
4. Detailed geological framework (NTB 24-17)
Key points:
- All three siting regions show areas devoid of seismically mappable faults. In NL this area is the largest. The observed differences between the siting regions relate to their position with respect to tectonic domains (Konstanz – Frick Trough, Jura Fold-and-Thrust Belt, Hegau – Bodensee Graben and Upper Rhine Graben).
- The Opalinus Clay host rock shows similar characteristics in all the siting regions (100 to 120 m thick, clay-mineral-rich, small lithological variability). This can be attributed to deposition in an epicontinental marine basin characterised by clay-mineral-rich input, generally high sedimentation rates and a relatively homogeneous environment.
- The confining units with overall high clay-mineral content surround the host rock. Compared to Opalinus Clay these units show more variability (e.g. intercalated sandy and calcareous beds). This is the result of more variable, mostly marine depositional environments (e.g. variations in subsidence, water depth, sediment input, currents).
- The low hydraulic conductivity interval comprising host rock and confining units is well constrained by hydraulic field and laboratory data in all the siting regions. The interval is sandwiched in between regional and local aquifers. It is thickest in NL and thinnest in JO.
- The aquifers above the confining units (Malm, Hauptrogenstein) include groundwaters of high residence time. Quasi-stagnant conditions are observed in the Malm aquifer in NL. The Keuper aquifer delimiting the lower confining units is also characterised by high residence times, except for parts of JO. In contrast, the Muschelkalk aquifer further below represents a continuous and comparably dynamic flow system in all the siting regions.
- Porewater investigations provide independent evidence for the hydraulic barrier effect and for diffusion-dominated transport at formation scale over geological times. NL shows highest Opalinus Clay porewater values of stable water isotopes indicating a comparably large old component.
This chapter is dedicated to the characterisation of the study area in Northern Switzerland with respect to sedimentation, diagenesis, tectonic deformation, current stress field, hydrogeological and hydrochemical characteristics and current temperature conditions. The focus is on the safety-relevant geological units from the base of the Schinznach Formation (upper Muschelkalk Group) to the top of the «Felsenkalke» and «Massenkalk» (upper Malm Group). This sequence includes the host rock, the surrounding low-permeability confining units and the bounding aquifers. The chapter provides a description of the present situation, but frequently refers to the past evolution because this is key for understanding the current situation. For example, the lateral variability of properties of a certain unit is closely related to its depositional environment.
The chapter highlights similarities and differences between the three siting regions and forms the framework for Chapter 5, which focuses on safety-relevant properties and processes in the clay-mineral-rich core of the geological barrier (the Opalinus Clay and adjacent low-permeability rocks). The detailed description of the geological barrier also forms the basis for the assessment of its future evolution, which is discussed in Chapter 5.
Fig. 4‑1 visualises the topics covered in this chapter. Section 4.2 focuses on the sedimentology and stratigraphy of the geological units of main interest (base of the Schinznach Formation to the top of the «Felsenkalke» and «Massenkalk»). Section 4.3 describes the tectonic situation in the siting regions and in a larger regional context. In Section 4.4, the recent stress field is characterised. Section 4.5 addresses the hydrogeological and hydrochemical situation in the aquifer – aquitard sequence. Past transport in the host rock and confining units is discussed in Section 4.6 (investigations of profiles of natural tracers in the porewater) and in Section 4.7 (investigations of secondary mineralisations). Section 4.8 describes the current temperature conditions. The final Section 4.9 summarises the most important project-specific conclusions, including a site-specific definition of the extent of the lower and upper low-permeability confining units.
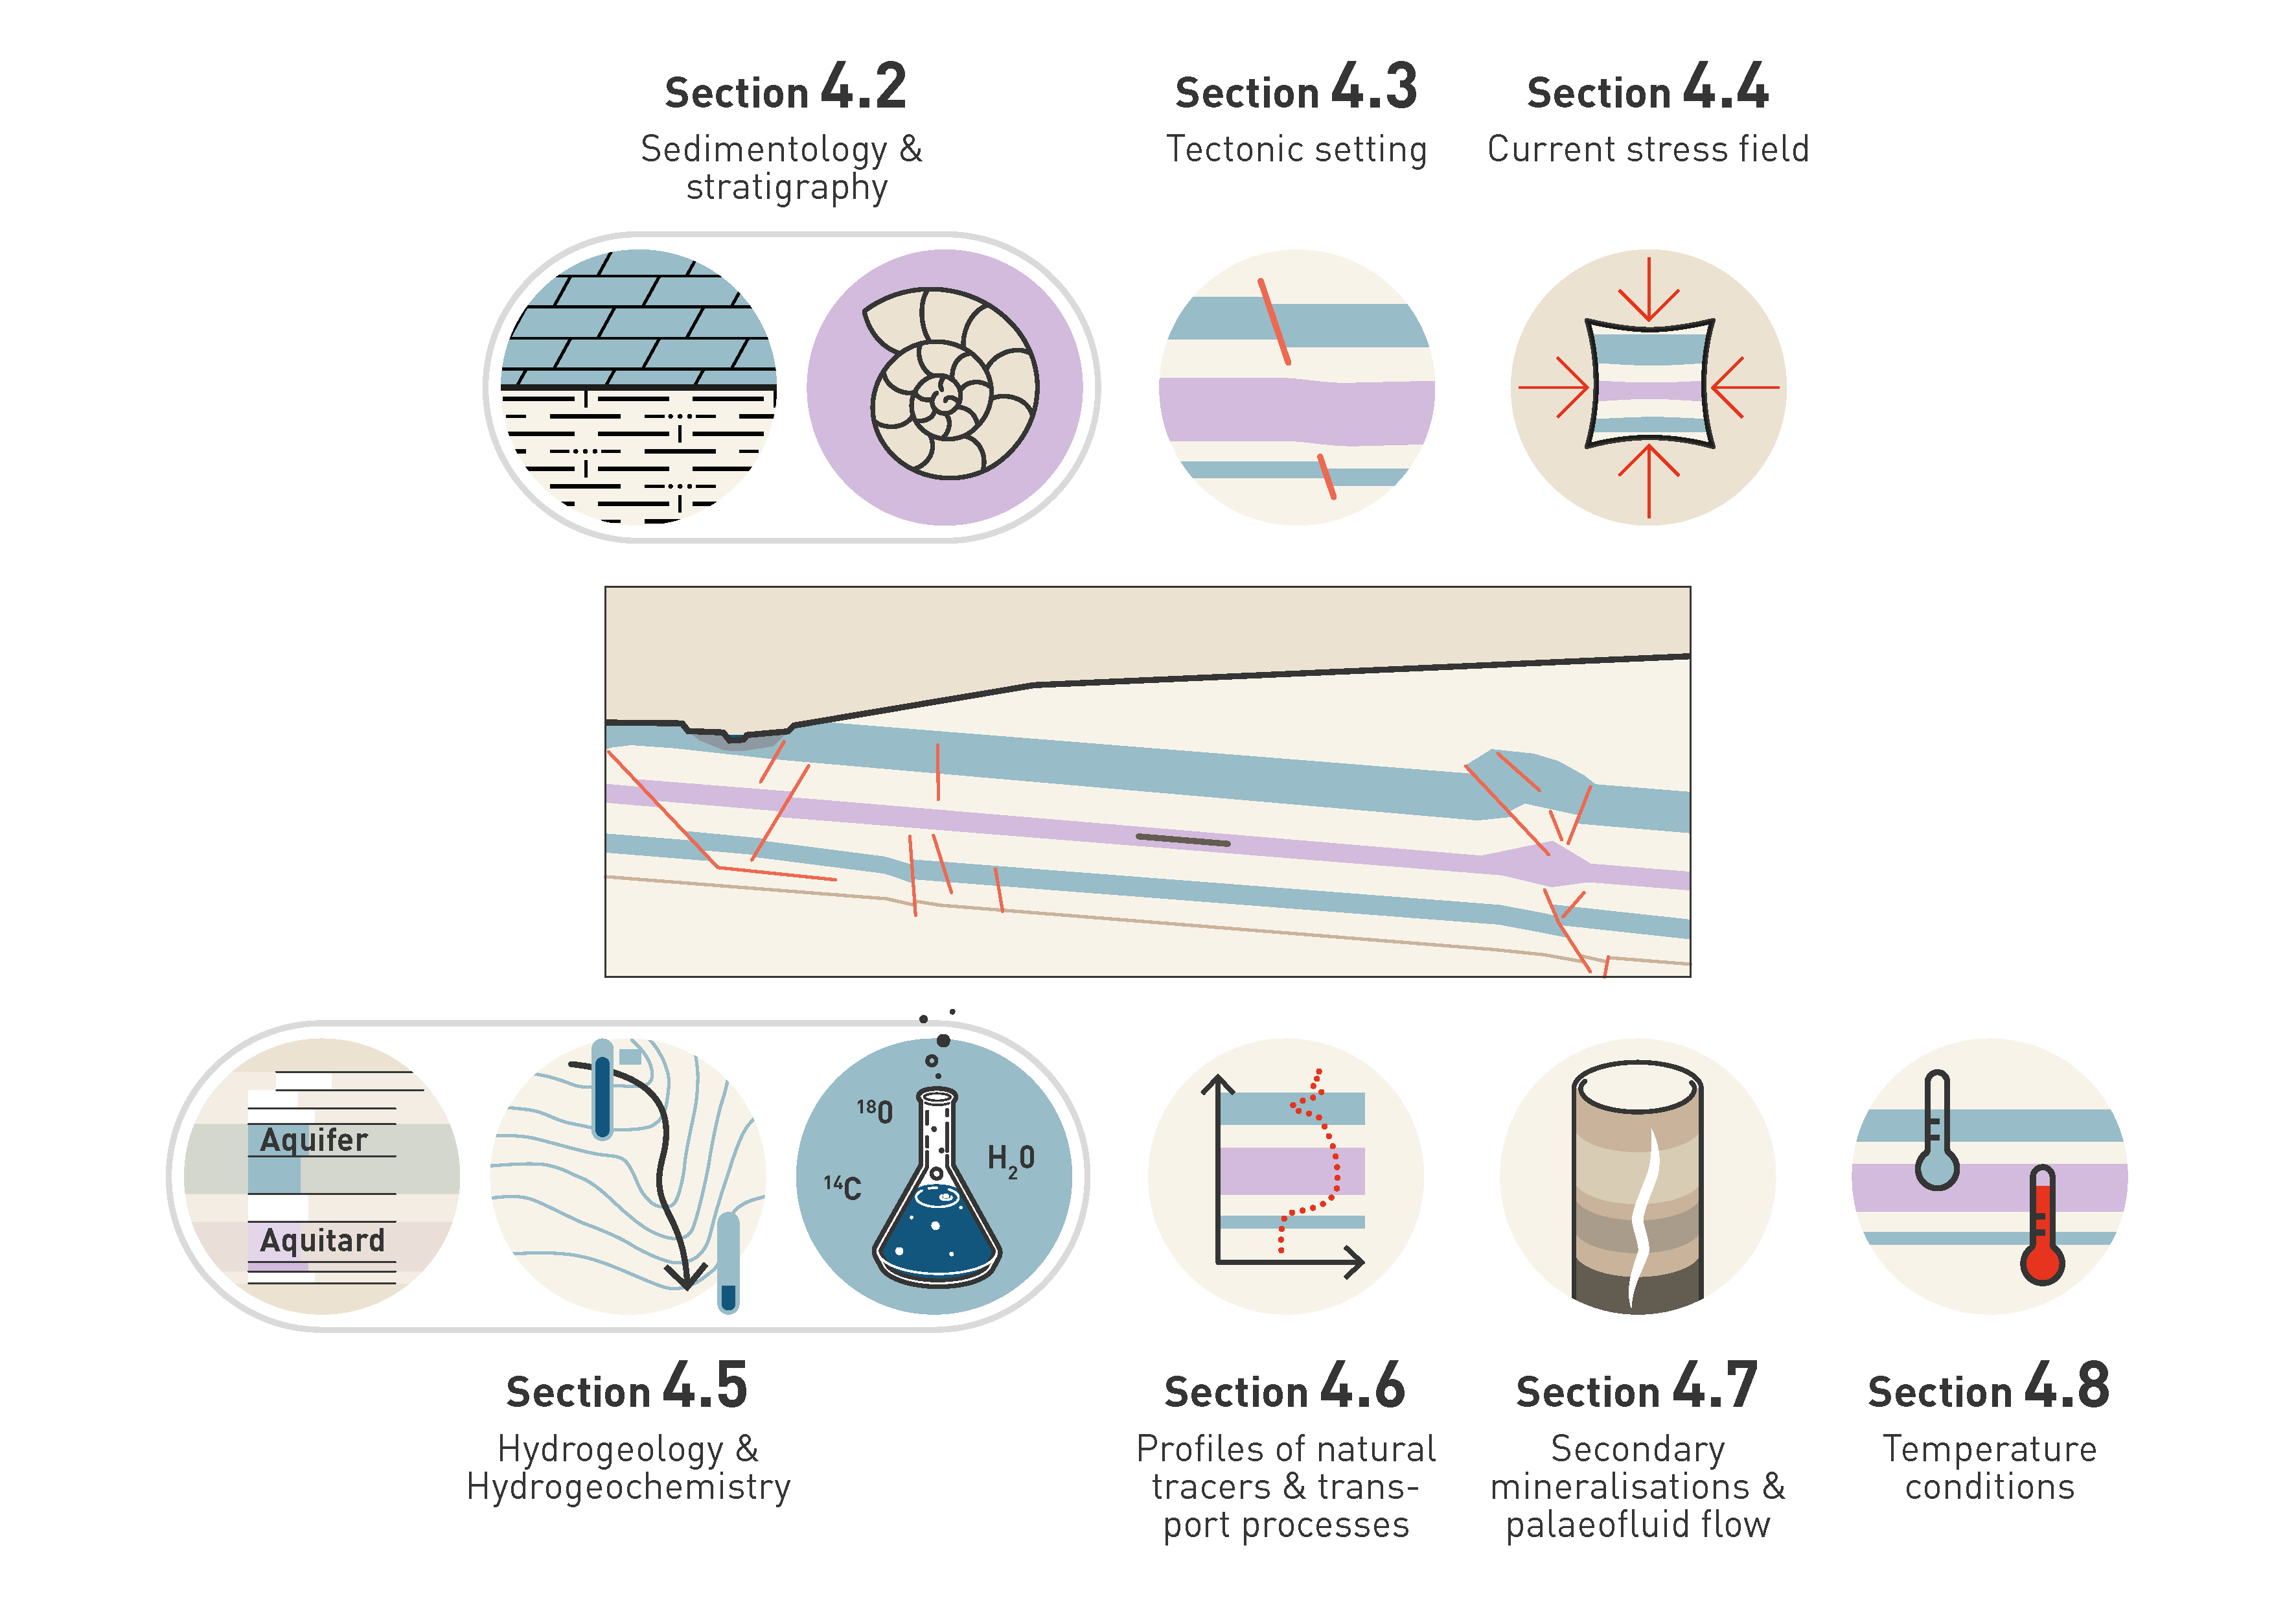
Fig. 4‑1: Schematic overview of the content and structure of the chapter
Key points:
- The Opalinus Clay host rock shows thicknesses of about 100 to 120 m in the three siting regions. Lithological characteristics are similar due to a common, relatively homogeneous marine depositional environment characterised by clay-mineral-rich input and high sedimentation rates.
- The units directly below and above the Opalinus Clay are, in general, also characterised by high clay-mineral contents, but they show more variable thickness and facies. This reflects locally more varying depositional environments.
- While the marine Staffelegg Formation directly below the host rock is similar between the siting regions, some prominent differences occur in the underlying partly shallow marine to mostly terrestrial Klettgau Formation.
- The marine deposits of the Dogger Group above Opalinus Clay are characterised by lateral thickness and facies changes. The deposits include decametre-thick clay-mineral-rich units as well as intercalated sandy-calcareous beds, condensed horizons and carbonate build-ups reflecting changes in sediment input, water depth and ocean currents.
In this section, the sedimentological and stratigraphic evolution of the study area for selected units is interpreted with respect to changing tectonic and climatic conditions and associated processes such as sea-level variations and ocean currents. The geological conditions of the investigated area during the Permo-Carboniferous, following the Variscan orogenesis, were dominated by regional crustal extension and erosion (refer also to Chapter 3 for further context). The troughs were filled with fine- to coarse-grained sediments in a terrestrial depositional environment under mostly arid and partly humid climate conditions. During the Mesozoic, the break-up of Pangaea and the opening of the North Atlantic Ocean and the Piemont – Liguria Ocean led to extension-dominated tectonics in Northern Switzerland. Accommodation space for sediments was created by subsidence in the Central European Basin. In a shallow marine epicontinental sea to partly terrestrial setting, 800 to 900 m10 of predominantly argillaceous to calcareous sediments were deposited under subtropical climate conditions (Fig. 4‑2). The characteristics of the specific depositional environments (Fig. 4‑3) and later diagenesis of the sediments deposited in the study area have determined many of their fundamental barrier properties (e.g. lithology and the vertical as well as lateral variability). The spatial and temporal characteristics of the sedimentary processes and the resulting rock units furthermore provide the basis for a better understanding of the similarities and differences between the siting regions (Fig. 4‑4, Fig. 4‑5, Fig. 4‑6).
This section is divided into further subsections arranged from older to younger selected lithostratigraphic units. The Opalinus Clay and its confining units below and above are especially emphasised because of their importance as the host rock and barriers of the repository system. Additionally, the regional Muschelkalk and Malm aquifers are discussed. The sections are divided into the following paragraphs: introduction, facies and lithostratigraphy, variability, chronology, and depositional evolution. Interpreted timelines are given as red dashed lines in this section (e.g. Fig. 4‑2). Information on the other lithostratigraphic units below and above the regional Muschelkalk and Malm aquifers can be found in Chapter 3 and the literature cited therein.
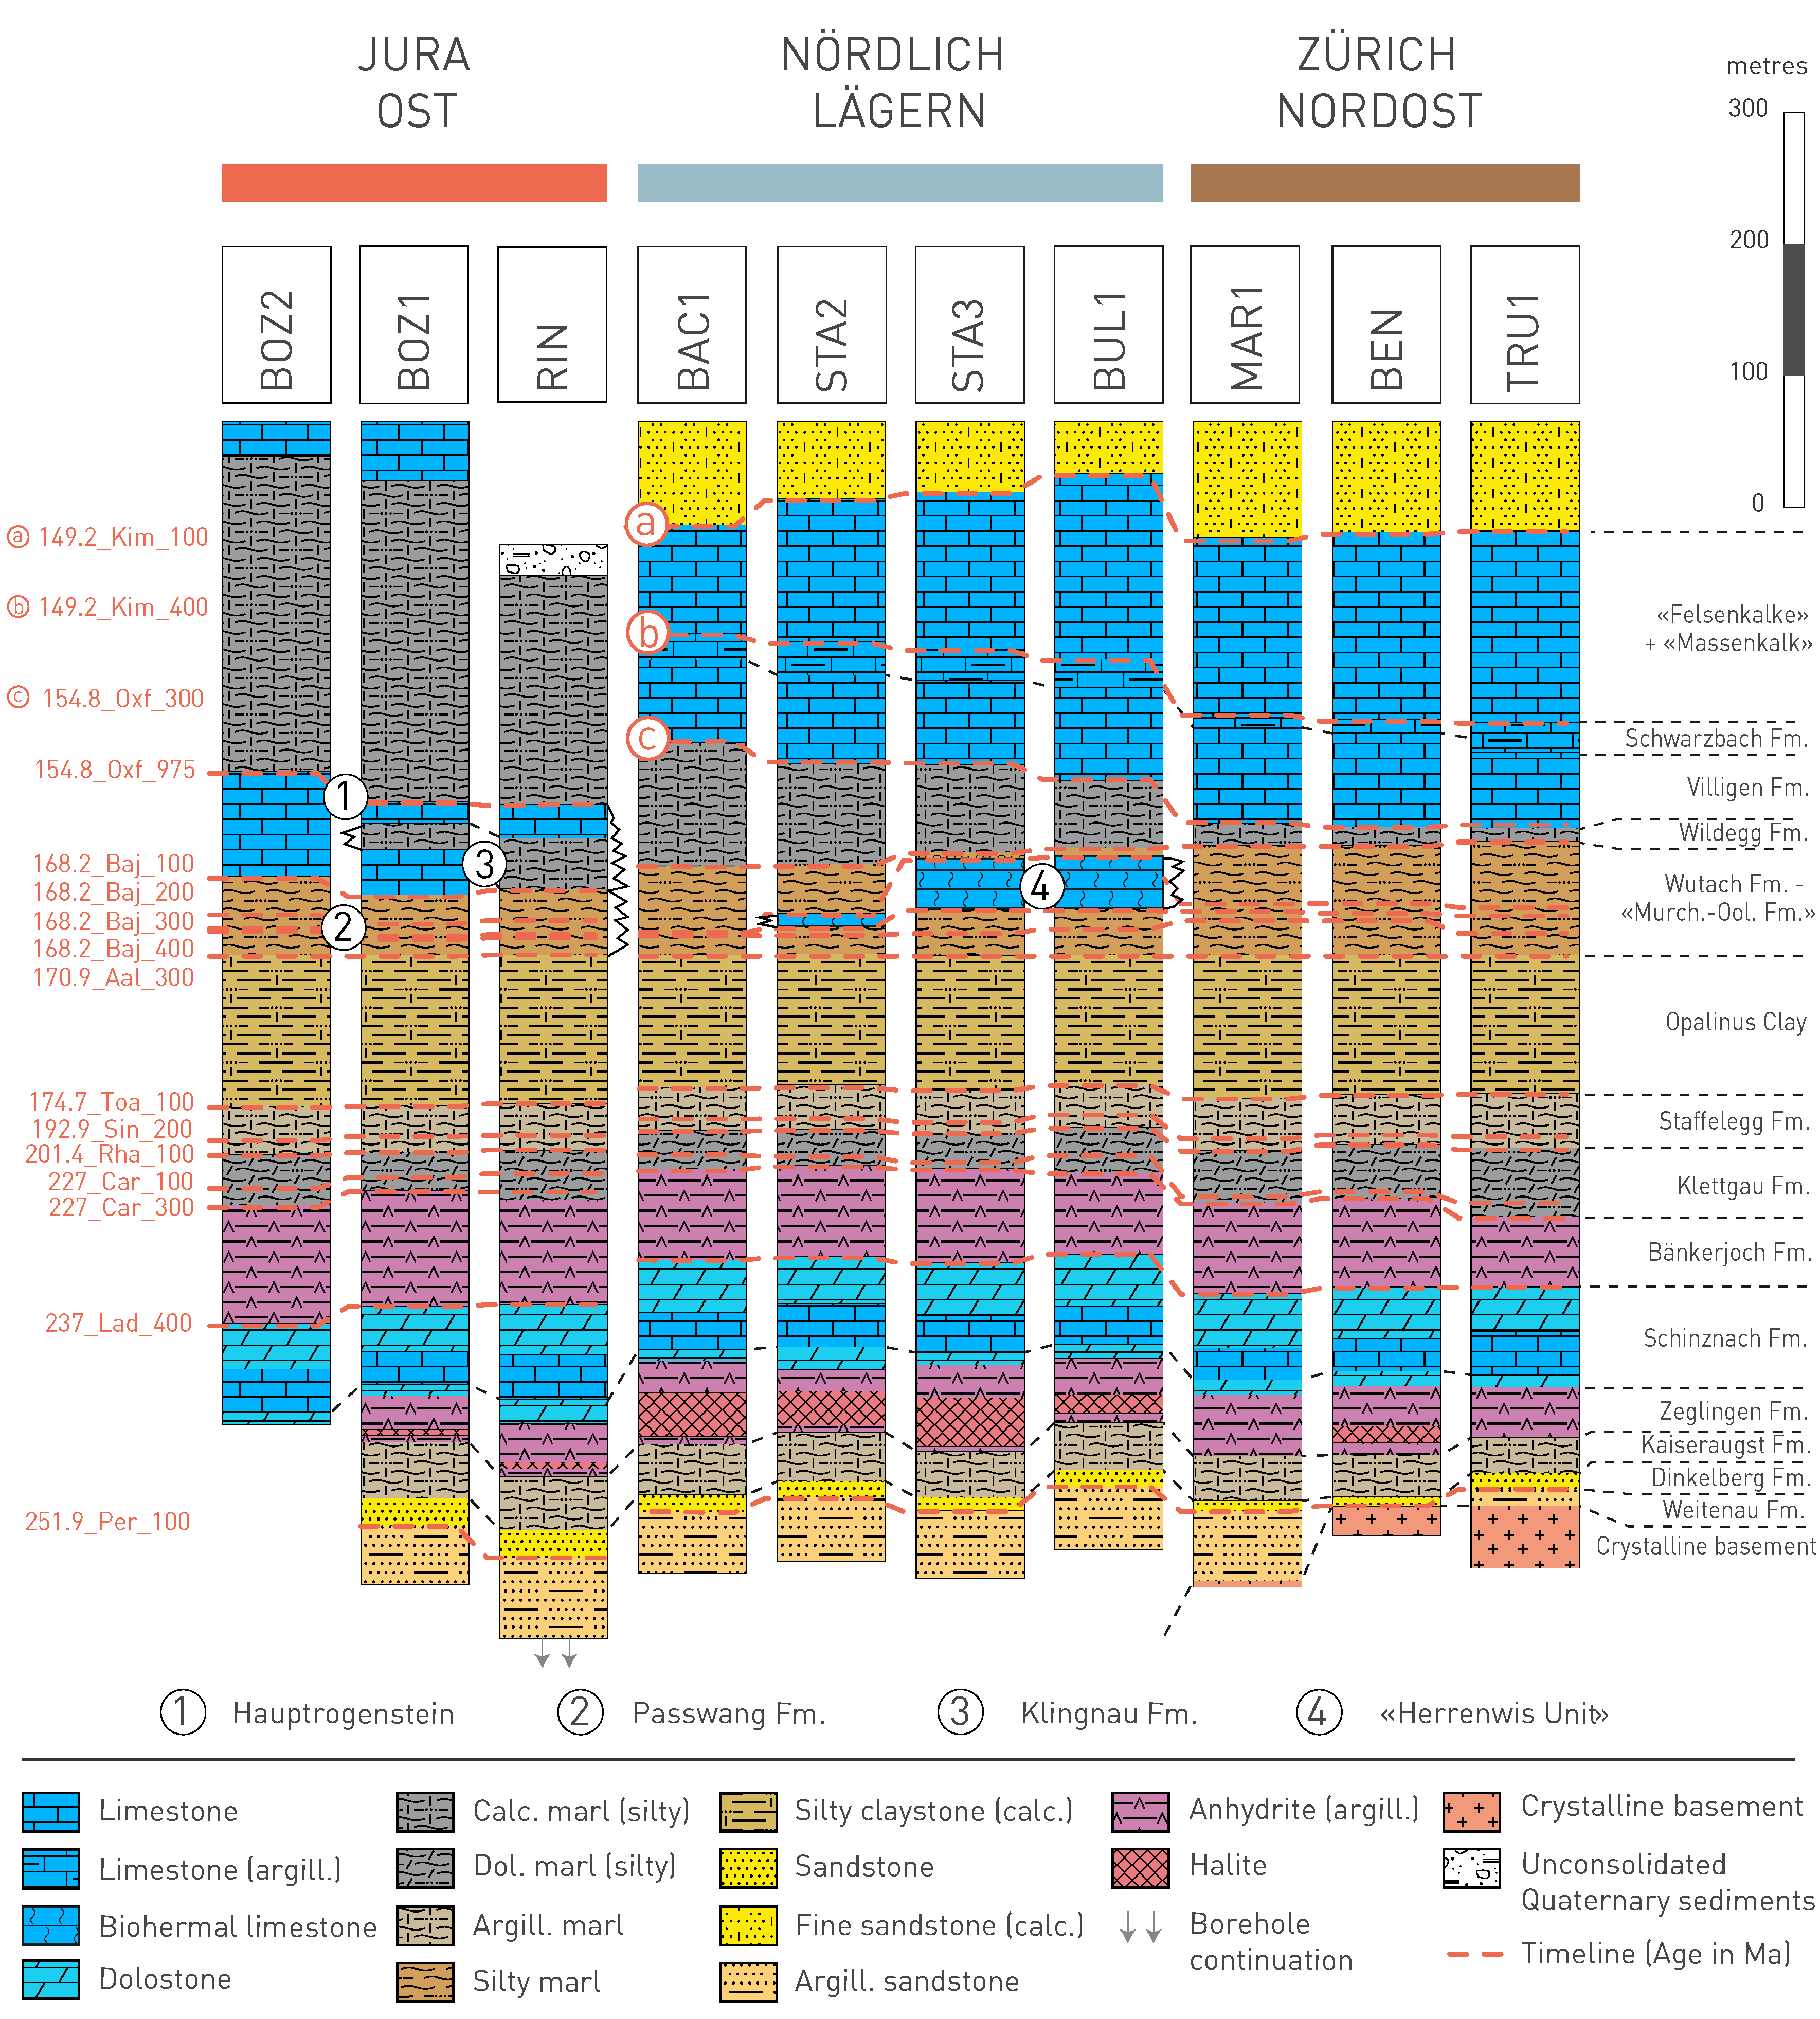
Fig. 4‑2:Lithological overview correlation with the focus on Mesozoic sedimentary rocks of the three siting regions
Boreholes are aligned to Top Opalinus Clay. Simplified lithological legend according to Naef et al. (2019). Black dashed lines indicate lithostratigraphic boundaries. Red dashed lines indicate timelines. Their names consist of three elements (e.g. 170.9_Aal_300): 1) start age of the corresponding chronostratigraphic stage (International Chronostratigraphic Chart, v 2022/10, e.g. 170.9 Ma for start of the Aalenian), 2) name of corresponding chronostratigraphic stage and 3) three-digit number. The given age in the name should therefore not be understood as depositional age but rather as a general temporal orientation based on the corresponding chronostratigraphic stage. The temporal resolution or number of timelines was chosen regarding potential horizons in seismic interpretation and for a basic stratigraphic analysis. Therefore, many more timelines could be identified, and the three-digit numbers are not sequential but were chosen to enable later additional picking of lines without changing the numbering scheme.
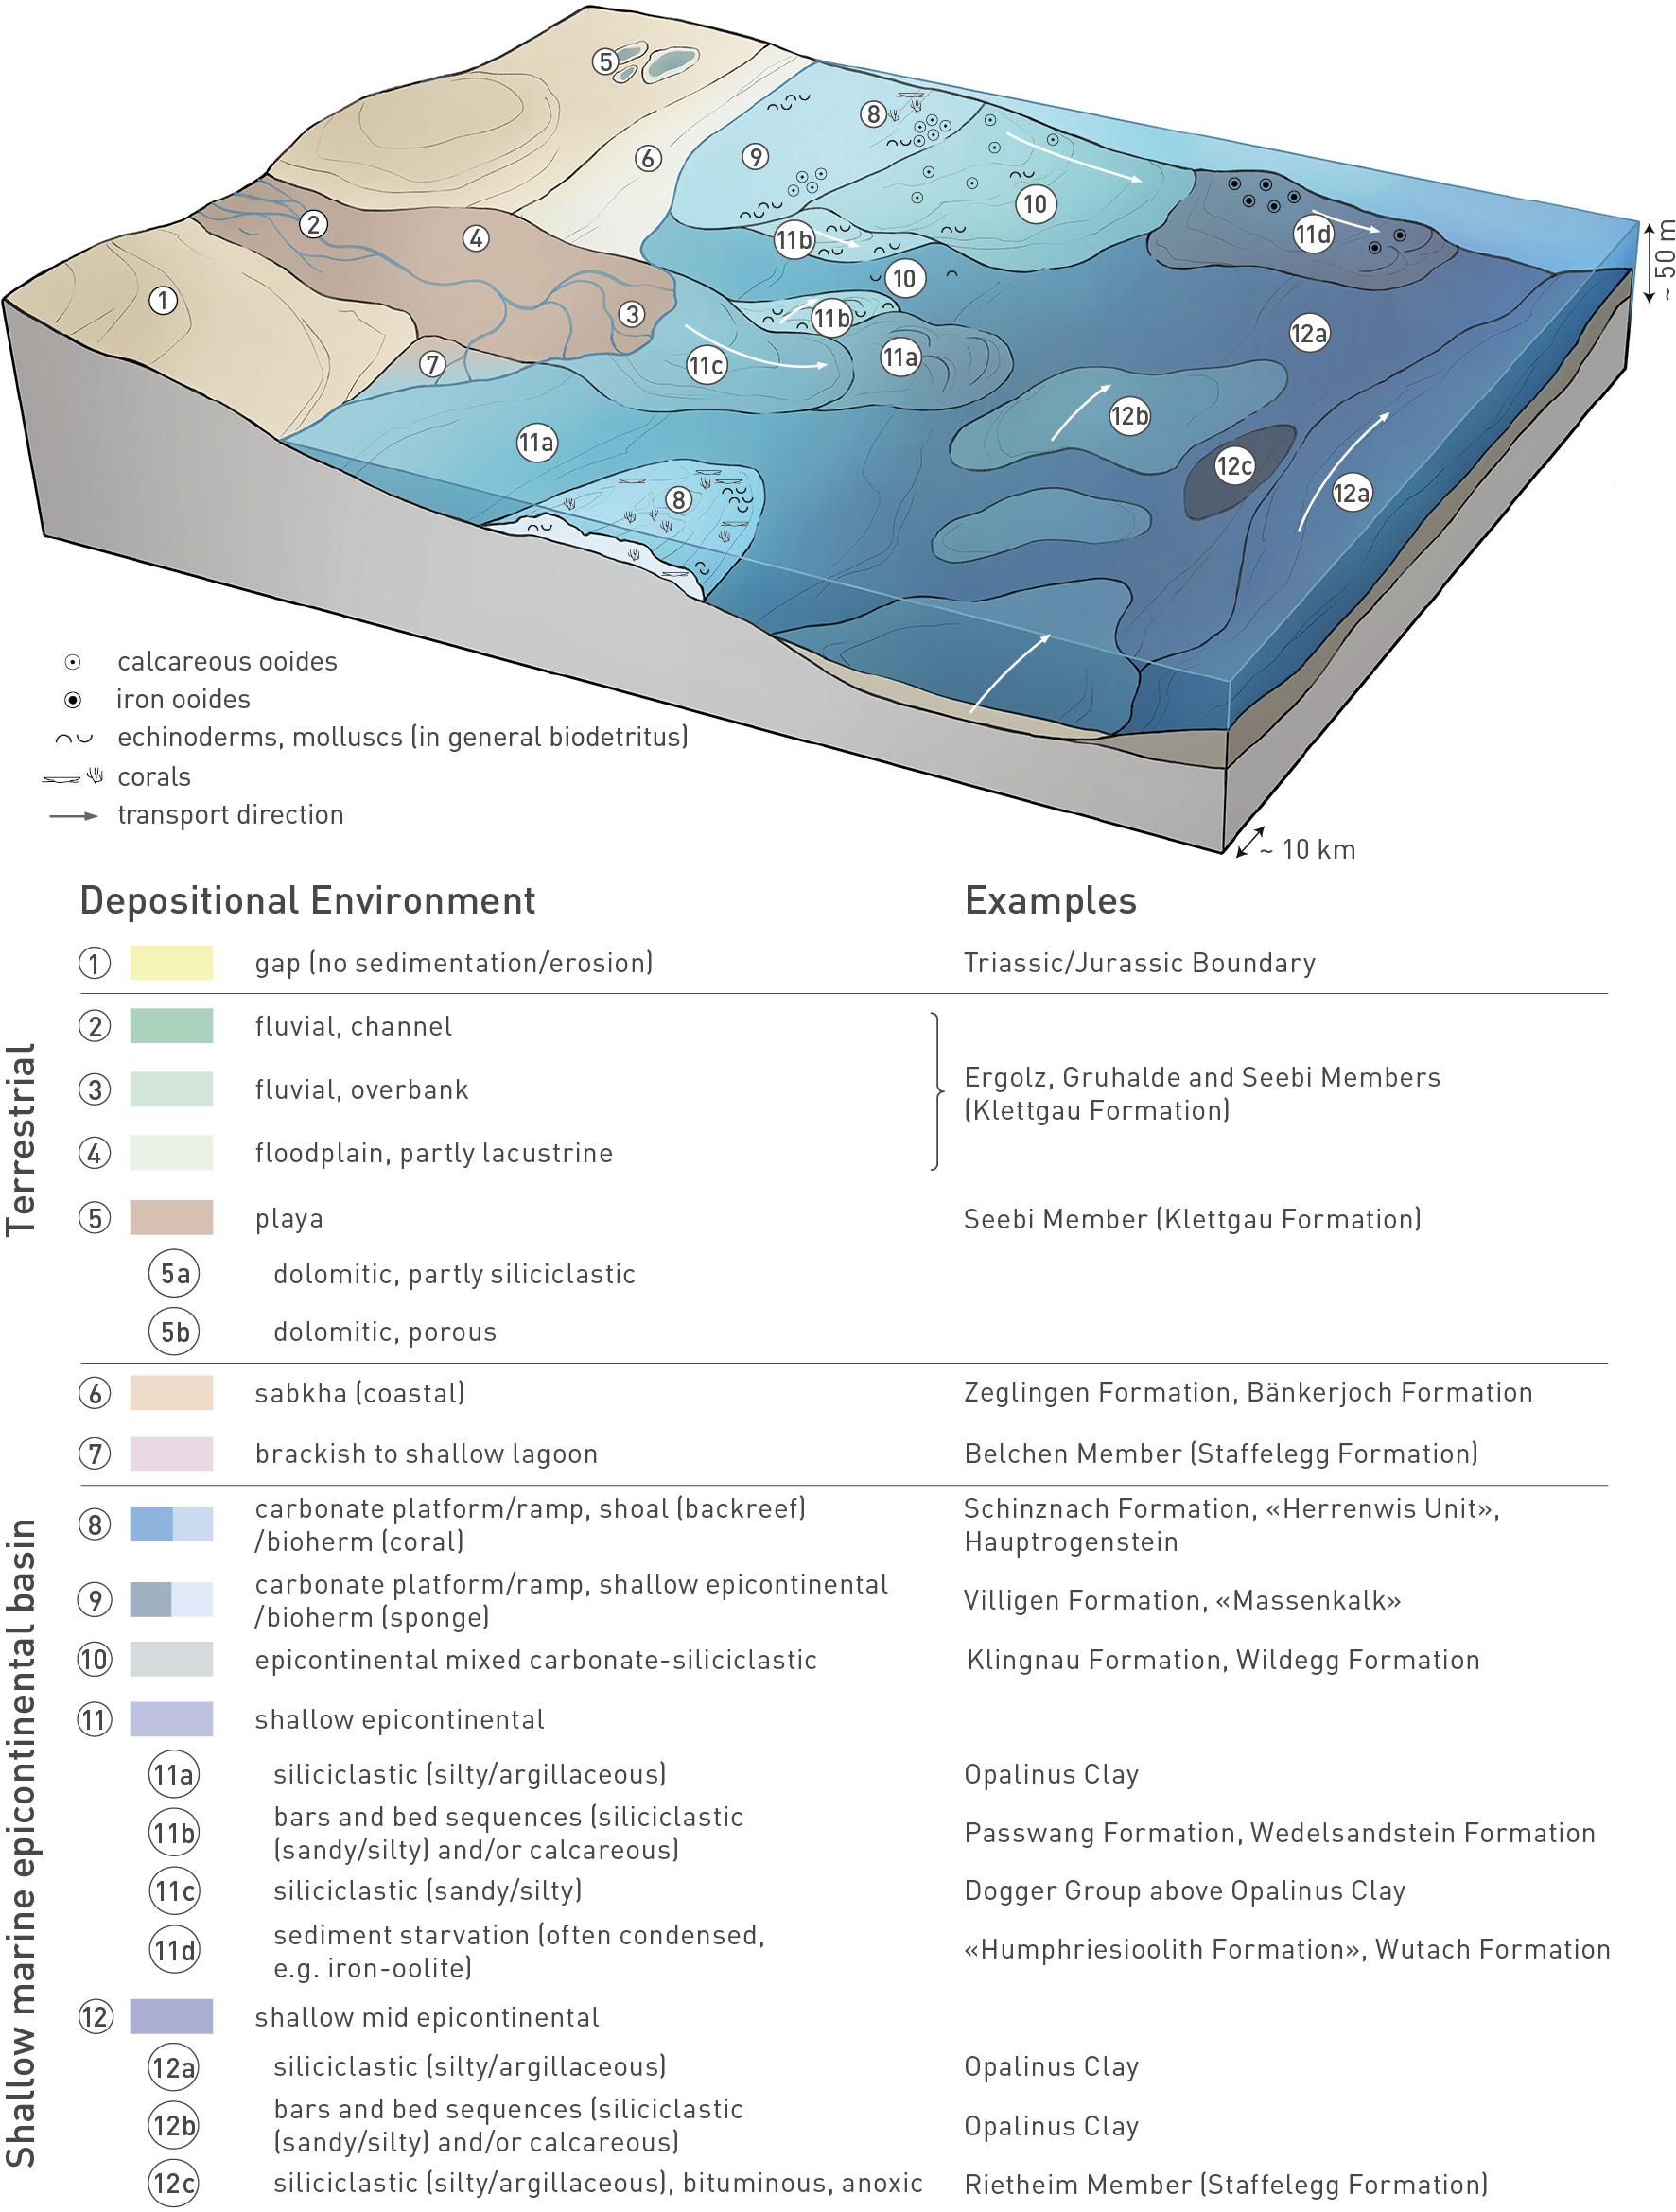
Fig. 4‑3:Schematic representation of depositional environments of Mesozoic sedimentary rocks in Northern Switzerland
This sketch conceptually summarises the main characteristics of depositional environments and serves as an orientation for the respective maps below. Note that the sketch is strongly vertically exaggerated.
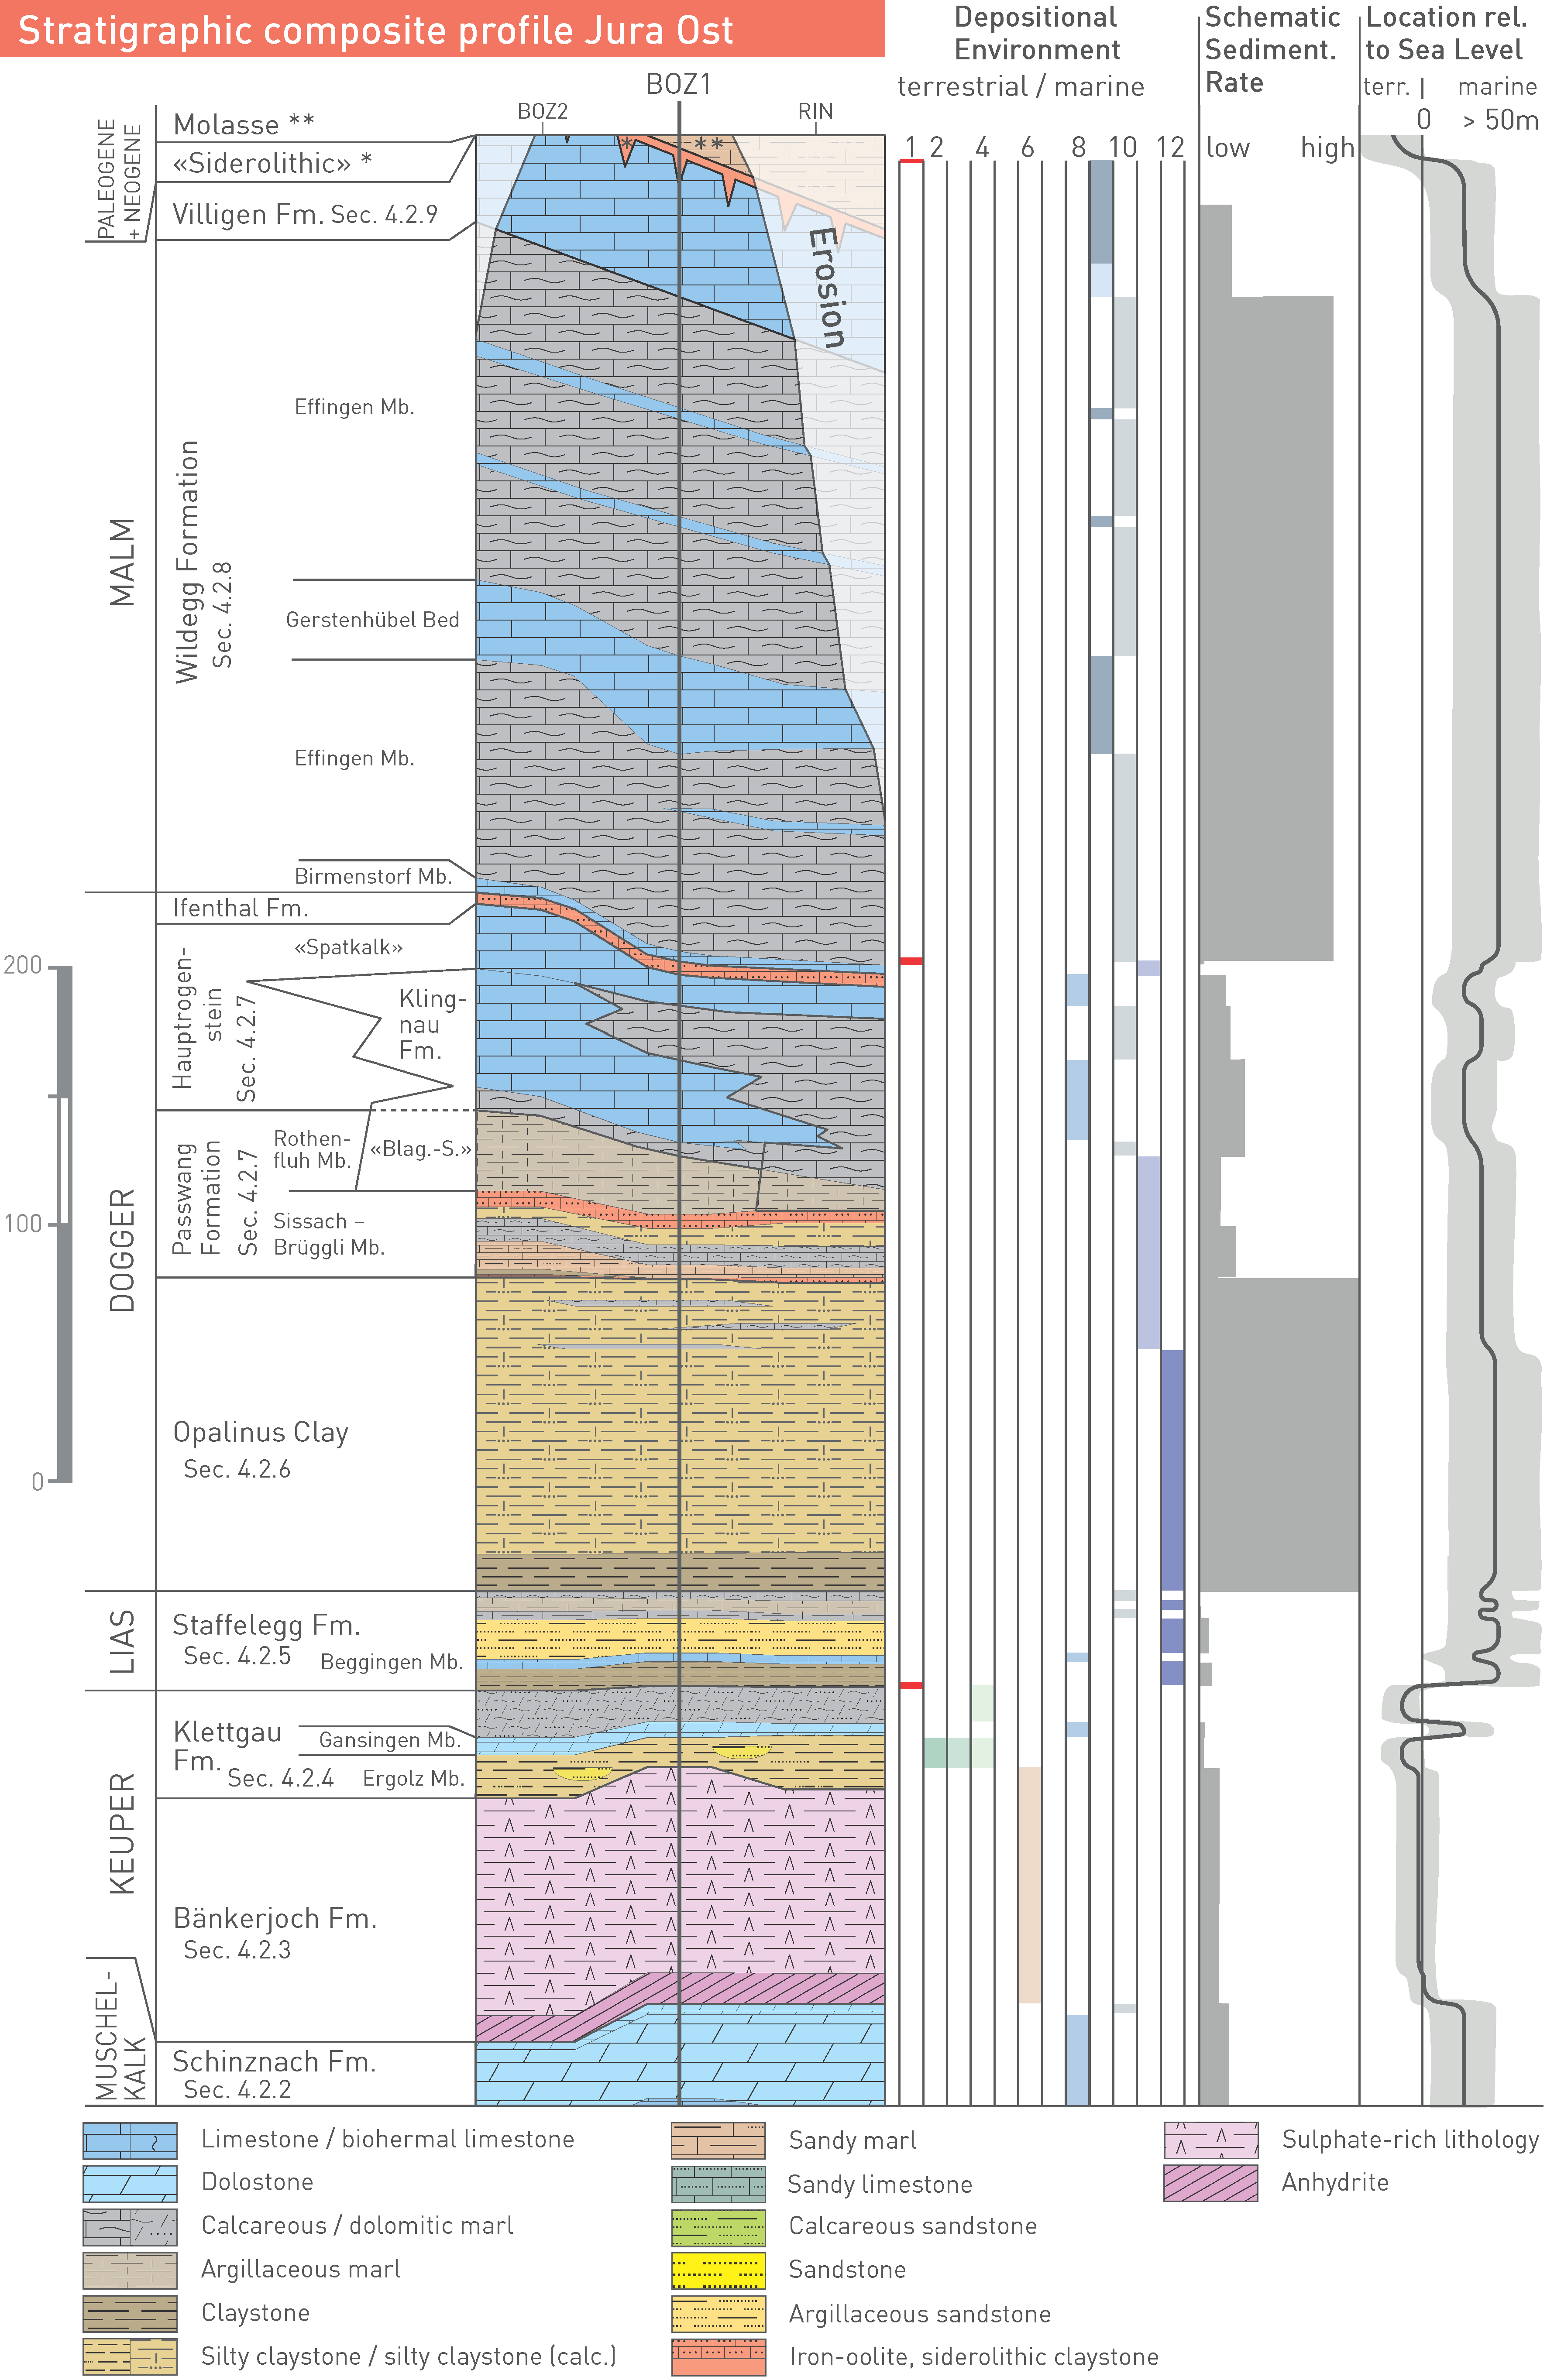
Fig. 4‑4:Schematic lithostratigraphic column for JO with depositional environments, schematic sedimentation rates and estimated location relative to sea level
Refer to Fig. 4‑3 for depositional environments. Boreholes are aligned to the base of the Opalinus Clay. Stratigraphic thicknesses in three right panels according to BOZ1. Sedimentation rates were estimated by dividing the thickness by the deposition period (including hiatuses) of a unit. Fm. = Formation, Mb. = Member.
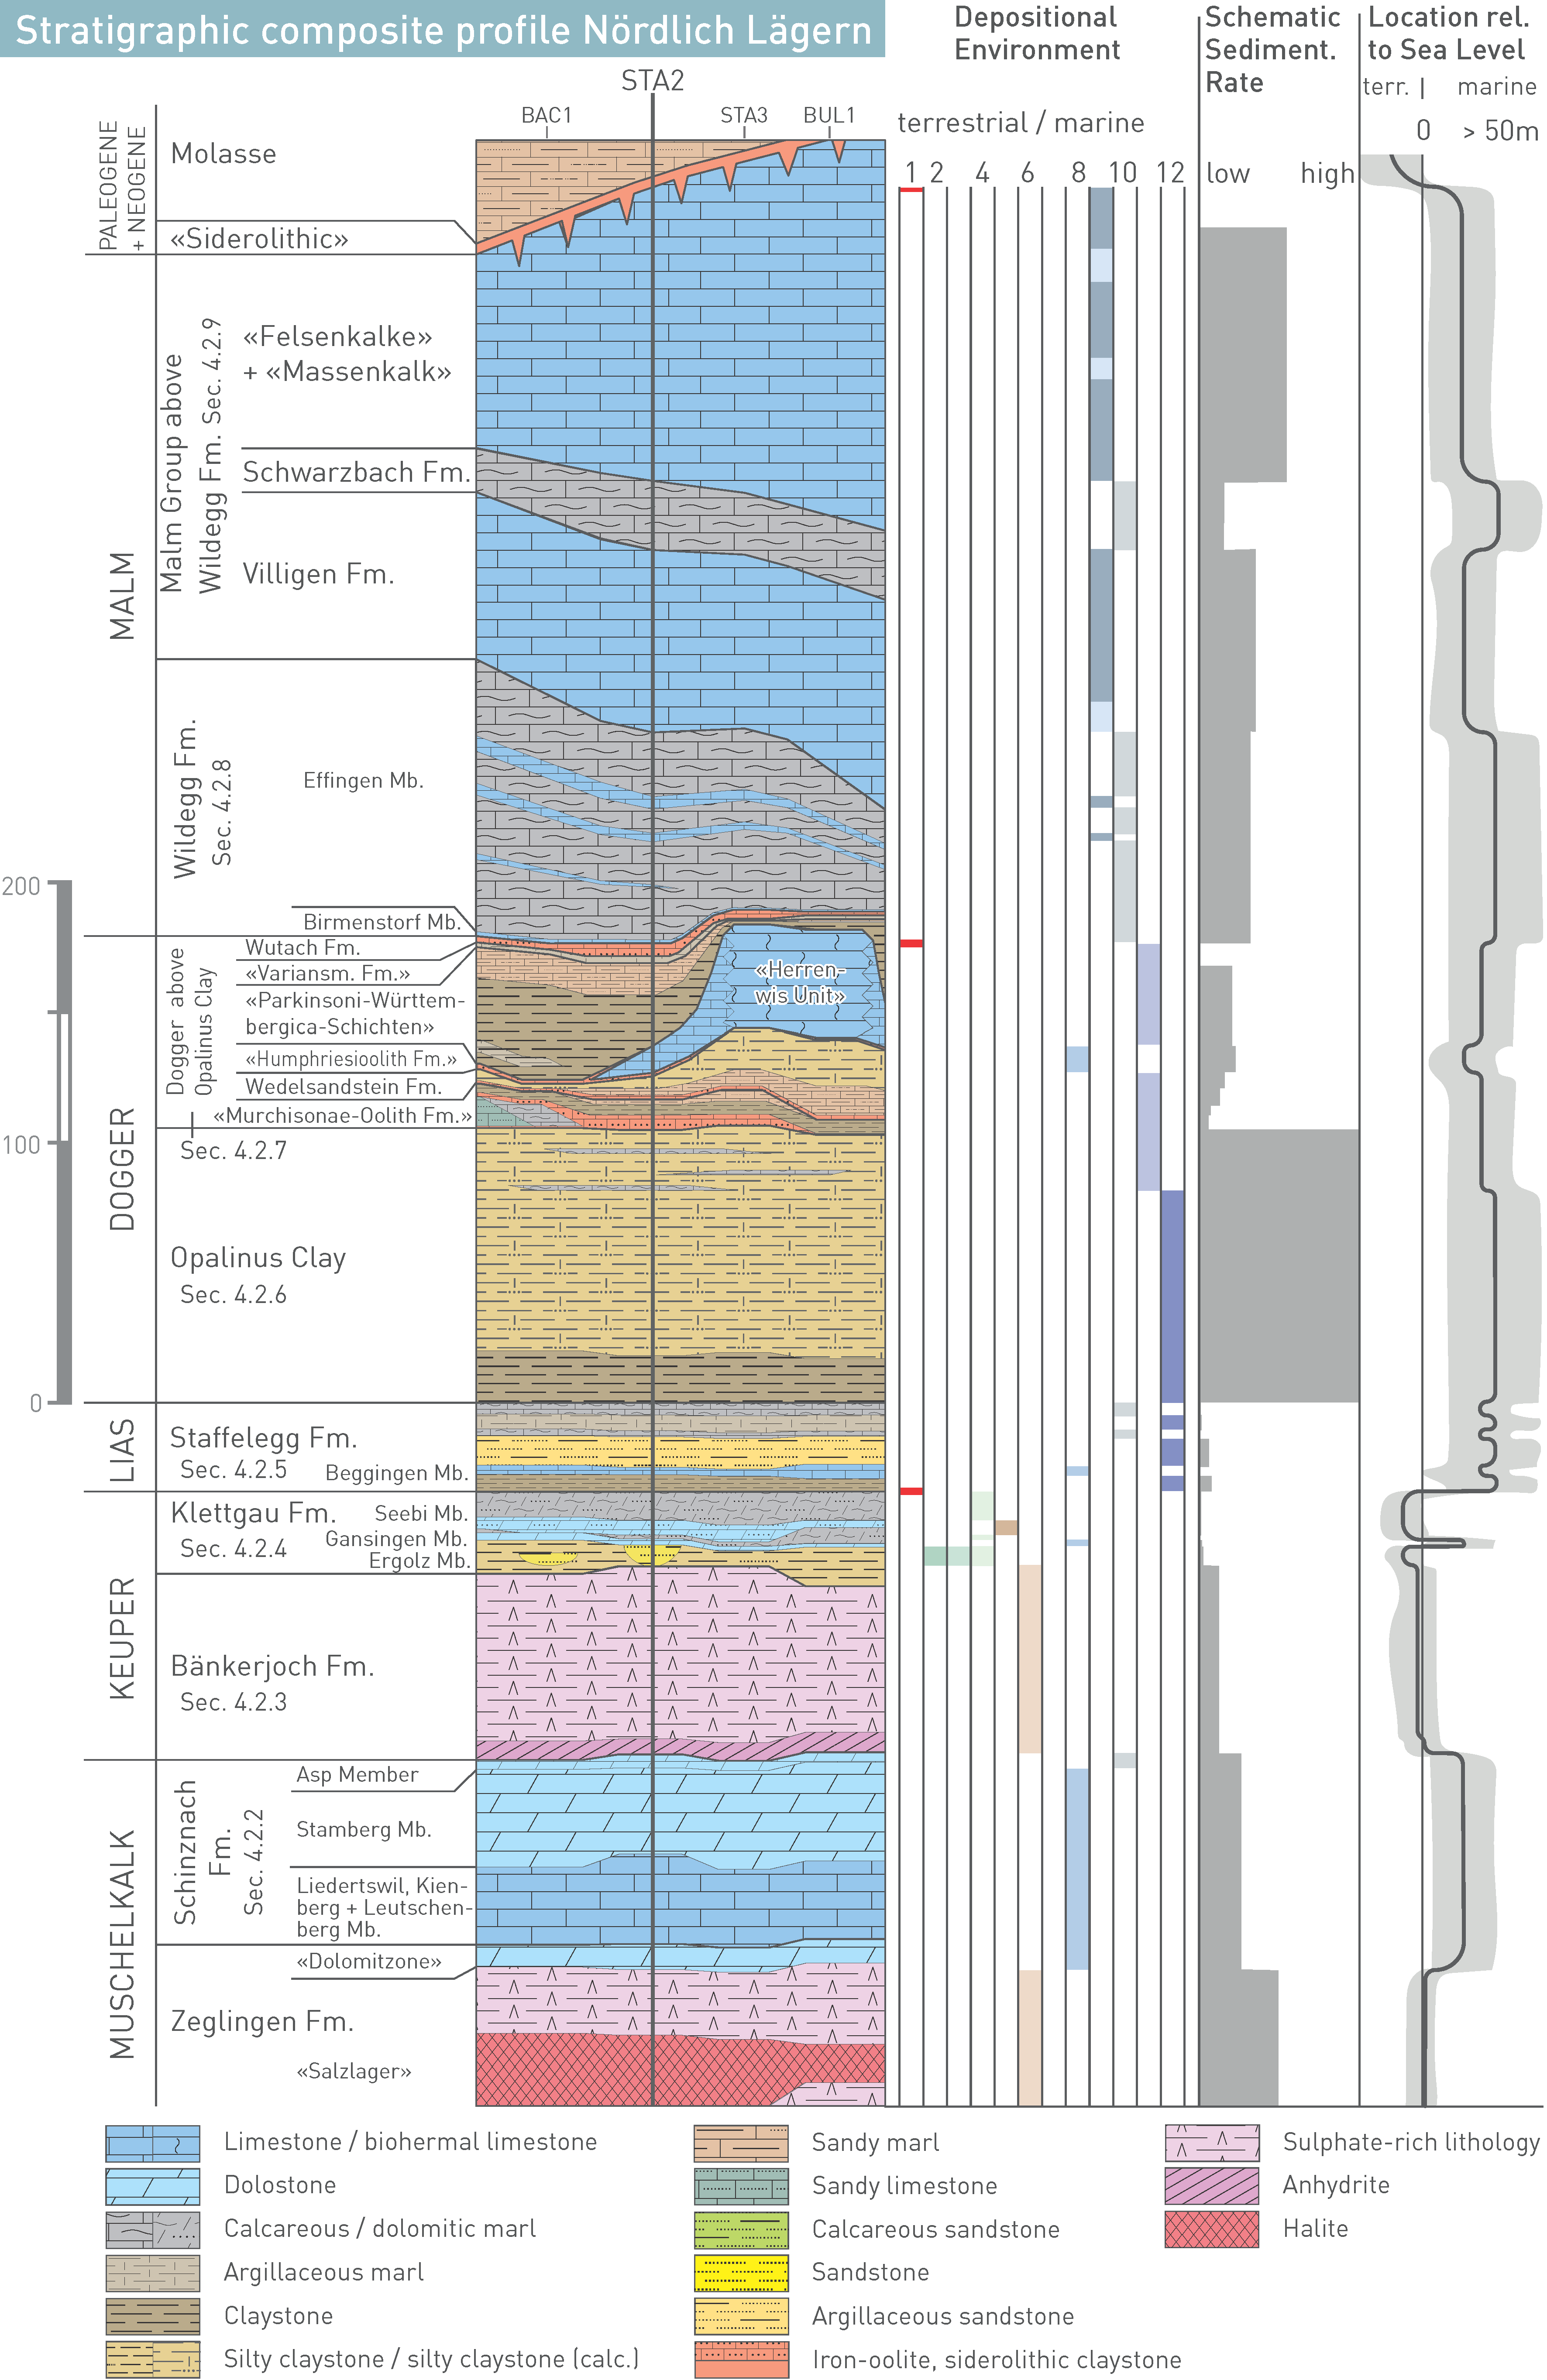
Fig. 4‑5:Schematic lithostratigraphic column for NL with depositional environments, schematic sedimentation rates and estimated location relative to sea level
Refer to Fig. 4‑3 for depositional environments. Boreholes are aligned to the base of the Opalinus Clay. Stratigraphic thicknesses in three right panels according to STA2. Sedimentation rates were estimated by dividing the thickness by the deposition period (including hiatuses) of a unit. Fm. = Formation, Mb(s). = Member(s).
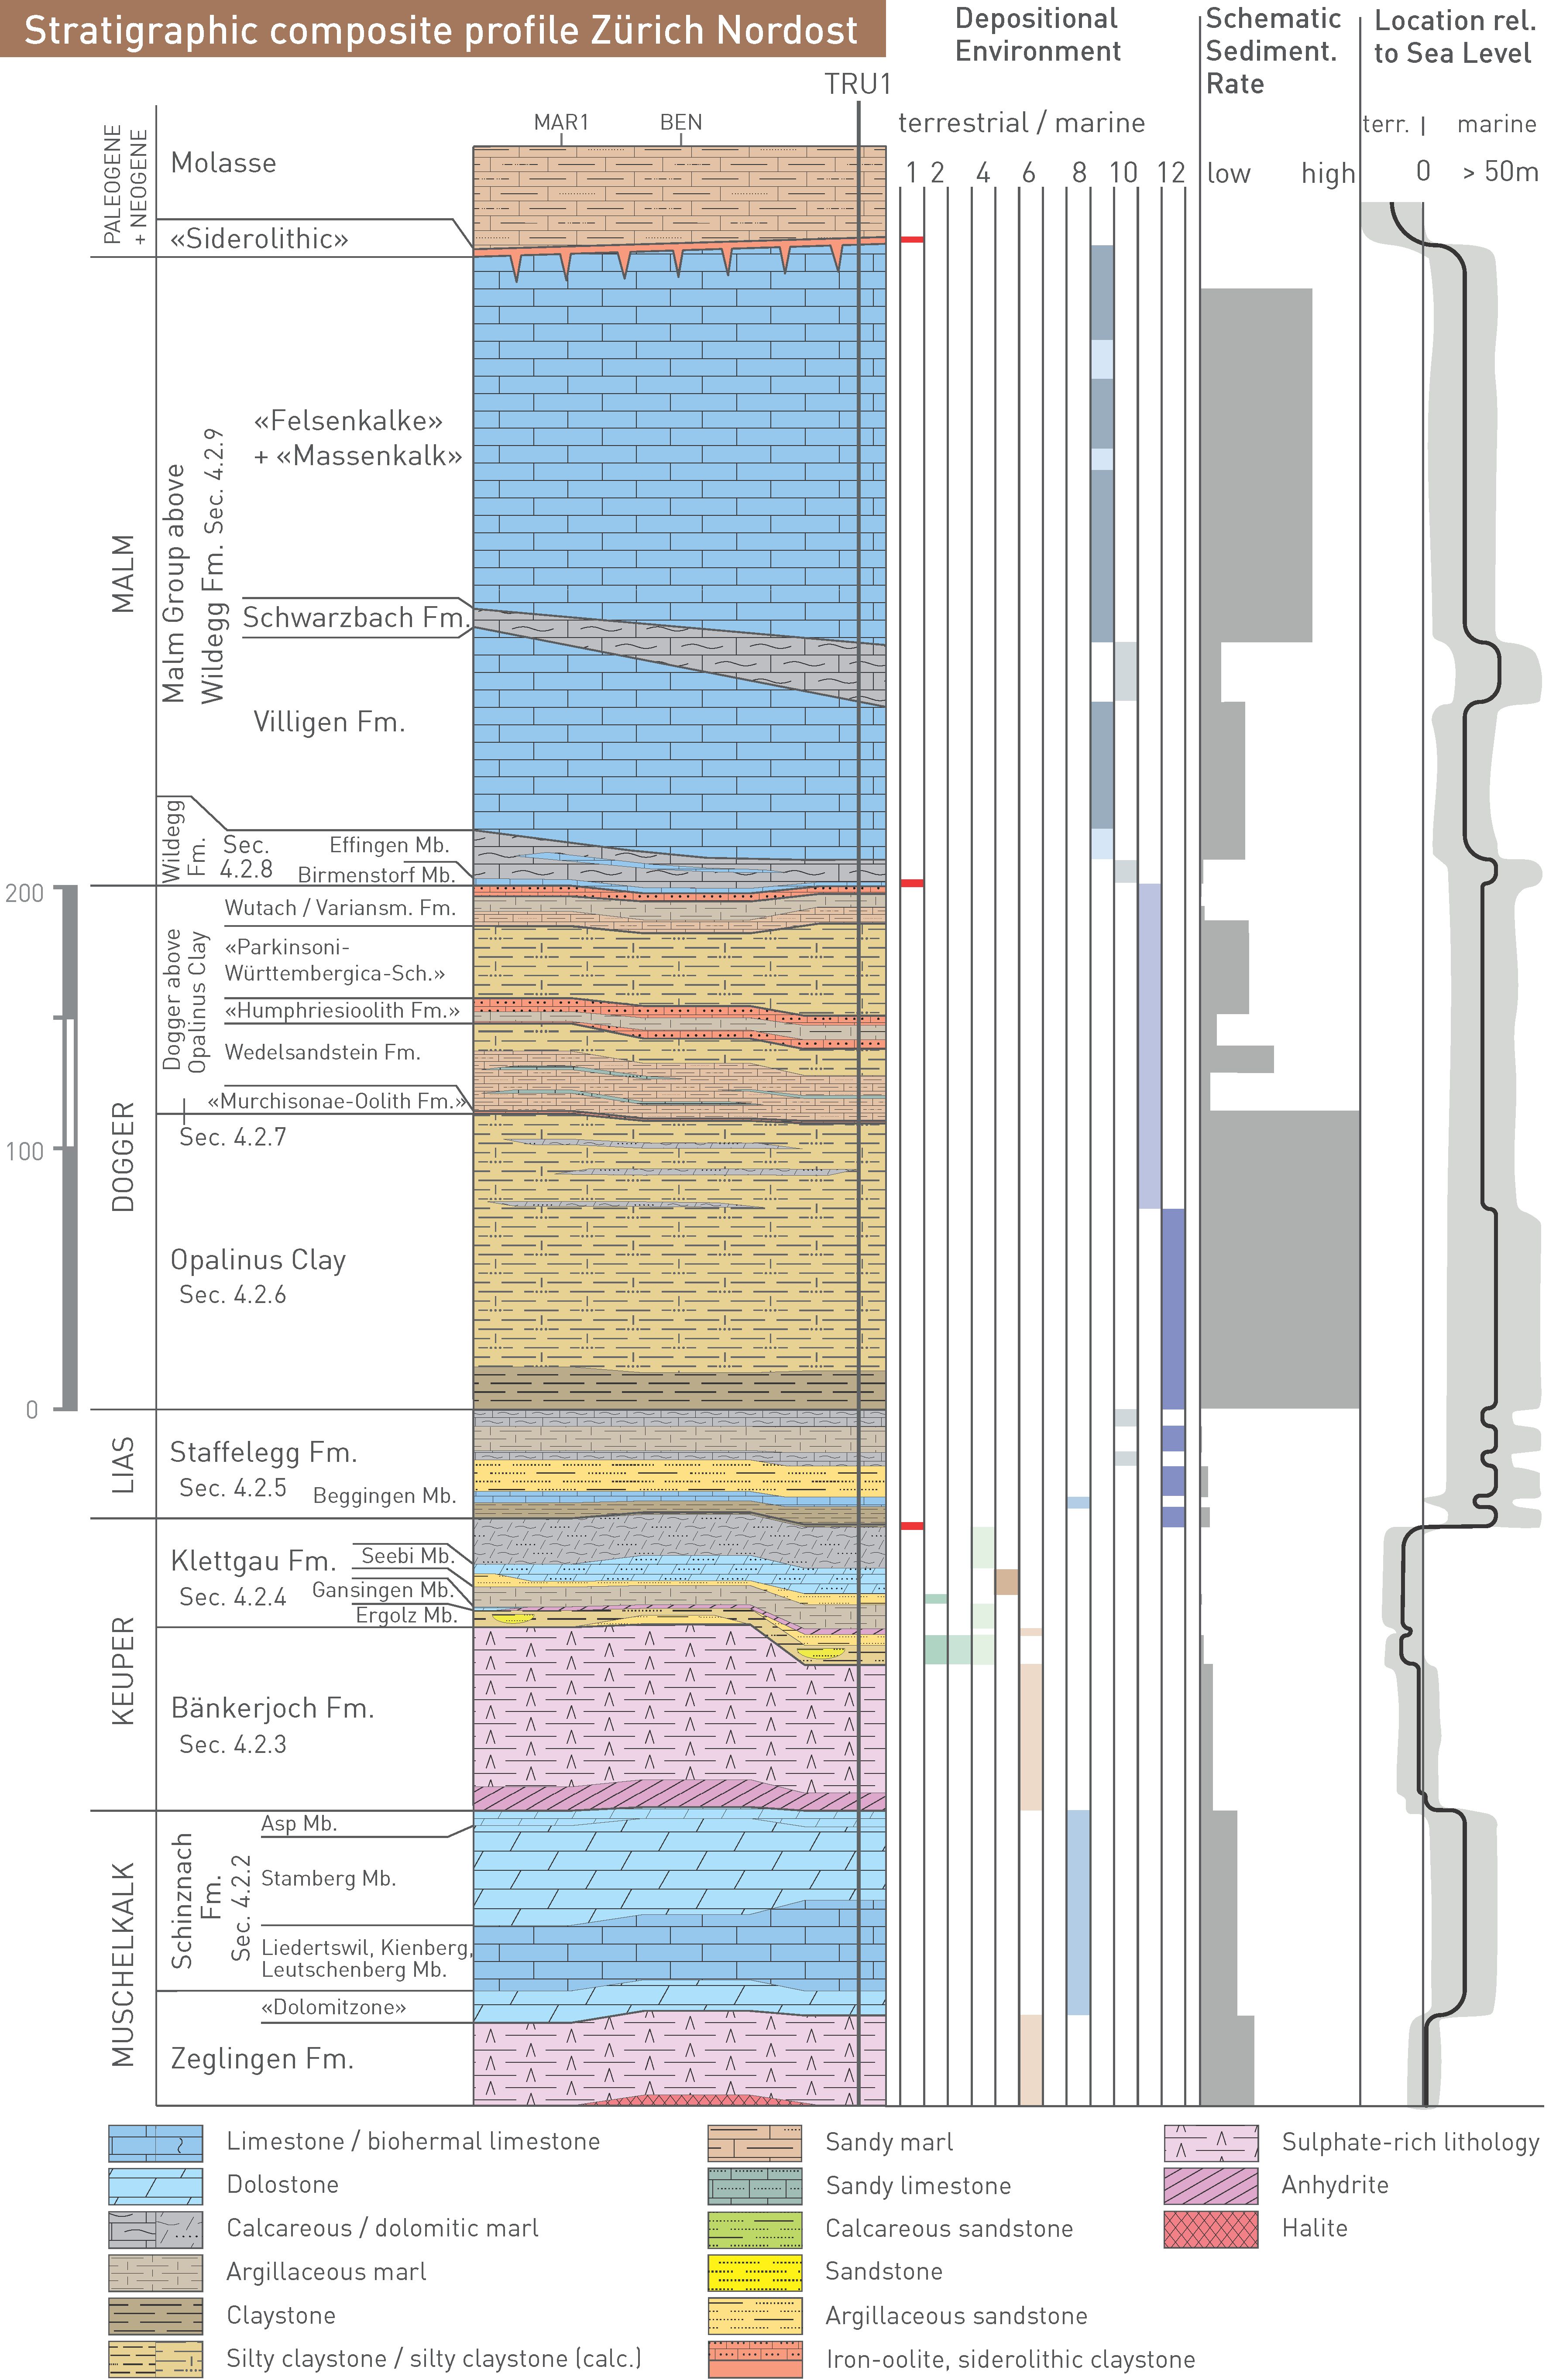
Fig. 4‑6:Schematic lithostratigraphic column for ZNO with depositional environments, schematic sedimentation rates and estimated location relative to sea level
Refer to Fig. 4‑3 for depositional environments. Boreholes are aligned to the base of the Opalinus Clay. Stratigraphic thicknesses in three right panels according to TRU1. Sedimentation rates were estimated by dividing the thickness by the deposition period (including hiatuses) of a unit. Fm. = Formation, Mb. = Member.
800 – 900 m refers to the current compacted thickness of sedimentary rocks. ↩
The Schinznach Formation forms the regional aquifer below the potentially lowermost confining units of the Bänkerjoch Formation (Section 4.5.3.12). During the Middle Triassic, the study area was part of the Central European Basin (Chapter 3). The mostly carbonate sediments were deposited in a shallow marine depositional environment (Merki 1961, Pietsch et al. 2016, Adams & Diamond 2017).
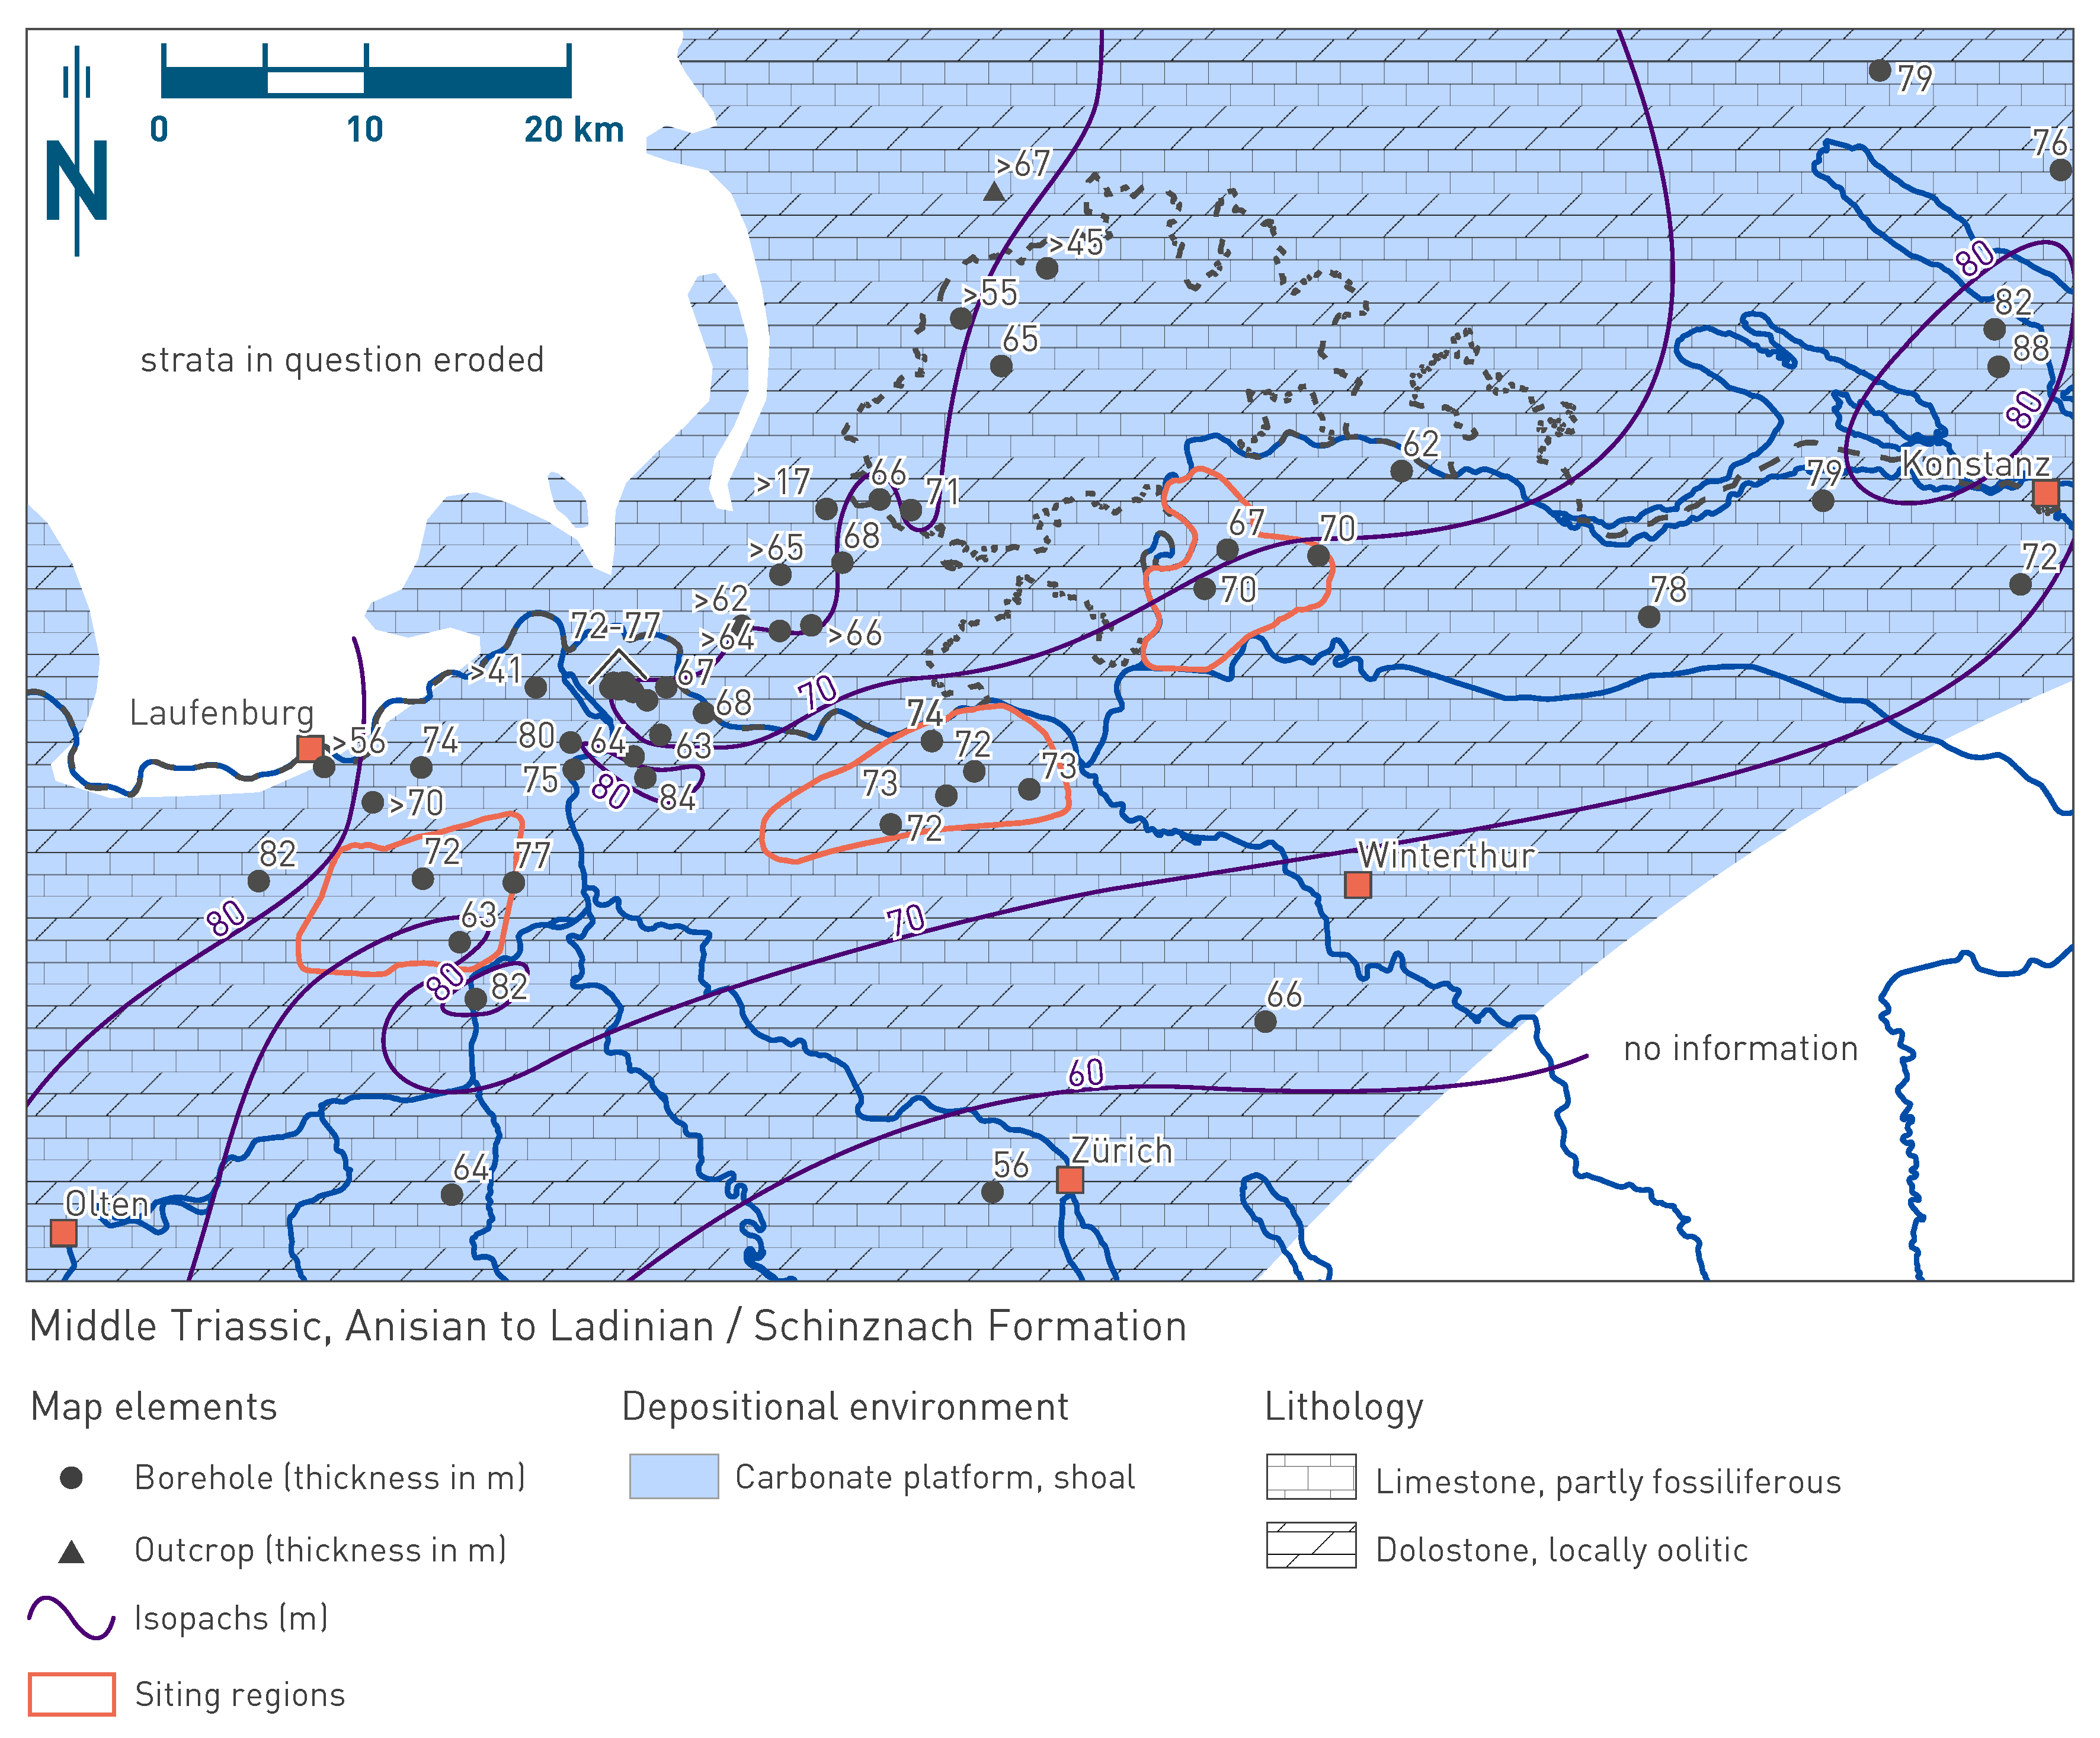
Fig. 4‑7:Map of depositional environments during the Middle Triassic (Anisian – Ladinian) preserved in the Schinznach Formation
Refer to Fig. 4‑3 for a schematic representation of depositional environments. The north arrow refers to present-day geographic north.
The Schinznach Formation (Upper Muschelkalk Group, former «Hauptmuschelkalk», «Trigonodusdolomit» and «Lettenkohle») exists in all three siting regions and is about 65 to 75 m thick (Fig. 4‑7; Pietsch et al. 2016). It consists of macrofossil-poor to bioclastic limestone and local macrofossil-rich dolostone (Fig. 4‑8). Intervals with oncoids and ooids may occur locally. Later diagenesis led to a partial or complete dolomitisation and successions of cementing and leaching events determine the remaining porosity. Especially in dolomitised bioclastic or oolitic beds, reduced sectors of open porosity exist. However, the porous shoal facies is relatively rare compared to southern Germany (Adams & Diamond 2017). The Schinznach Formation was subdivided into five members:
Leutschenberg and Kienberg Members (lower and middle part of the former «Hauptmuschelkalk»): In the study area, the two lowermost members of the Schinznach Formation are generally hard to separate in the boreholes and are combined in the present study (Jordan & Deplazes 2019). The combined thickness varies between ca. 20 and 30 m. They consist of a bedded succession of limestone (micrite, mudstone) with a varying content of bioclastic limestone (biomicrite, wackestone, packstone) (Fig. 4‑9a & b). Ooids and oncoids also occasionally occur. Some parts of the succession are dolomitised.
Liedertswil Member (upper part of the former «Hauptmuschelkalk»): The thickness of this member varies between ca. 2 and 12 m. It consists mostly of a thin- to medium-bedded succession of partly bioturbated, glauconitic limestone (micrite, mudstone) with some bioclasts mostly concentrated in coquinas (Fig. 4‑9c). The upper boundary to the overlying unit of the Stamberg Member is defined by the onset of post-sedimentary, persistent and complete dolomitisation (Pietsch et al. 2016). This petrographic, diagenetic boundary is therefore diachronous.
Stamberg Member (approx. former «Trigonodusdolomit»): The thickness of this member varies between ca. 30 and 40 m. In the lower part it comprises bedded, macrofossil-poor dolostone (mudstone, wackestone), which resembles the Liedertswil Member but is fully dolomitised (Fig. 4‑9d). The upper part is characterised by partly porous dolostone with chert nodules and is locally sandy or anhydritic. In the porous dolostone, vugs with a size of up to 3 cm occur, which may originate from dissolved shells (Fig. 4‑9e). Additionally, oolite horizons may occur (Fig. 4‑8).
Asp Member (ca. former «Lettenkohle»): The thickness of this member varies around ca. 5 m. The Asp Member can generally be separated into two parts. The lower part consists of a fossiliferous, often bituminous shale or claystone with thin dolostone interbeds (Fig. 4‑9f). The upper part is characterised by dolostone with anhydrite nodules and nodular layers (Fig. 4‑9g).
The overall facies variability of the Schinznach Formation is similar in all boreholes of the siting regions and mainly concerns varieties of dolostone and limestone (Fig. 4‑8). The depth of dolomitisation varies laterally, depending on local diagenesis.
The Schinznach Formation was deposited in the Middle Triassic (Anisian to Ladinian; Pietsch et al. 2016, Bernasconi et al. 2017). Sequence stratigraphic analysis of the Schinznach Formation below the Asp Member identified a variable number of cycle sets (transgressive-regressive / regressive-transgressive hemicycles) as seen in the drill cores retrieved from the siting regions (Pietsch et al. 2016, Warnecke 2018, Adams & Diamond 2019).
The Schinznach Formation was deposited in the southern part of the Central European Basin between the London Brabant Massif in the west and the Vindelician – Bohemian Massif with its Alemannic promontory in the east and southeast (note: for cardinal points the present geographic reference system is used as plotted in the depositional maps). During the Middle Triassic, the basin was temporarily connected to the Neotethys by seaways in the east (Silesia and Eastern Karpathian Gates) and west (Burgundy Gate). The depositional environment was characterised by a carbonate platform to ramp transition in a shallow epicontinental sea (Adams & Diamond 2019, Warnecke & Aigner 2019). The Schinznach Formation is characterised overall by medium sedimentation rates (Fig. 4‑4, Fig. 4‑5, Fig. 4‑6); however, sedimentation rates must have varied temporarily.
Together with its neighbouring lithostratigraphic units, the Schinznach Formation comprises two major transgressive to regressive sequences (Adams & Diamond 2019). The first transgression is expressed by the evaporitic sedimentary rocks of the upper Zeglingen Formation and continues through the deposits of the Leutschenberg and Kienberg Members (Fig. 4‑8). The first regression is expressed by the sedimentary rocks of the Stamberg Member and ends with the strata at the top of the Stamberg Member; the top also corresponds to an unconformity. 3D seismic facies interpretation could indicate exposure-related dissolution in the Stamberg Member (Nagra 2024a, 2024b, 2024c). The second transgression led to the deposition of the Asp Member in a brackish to deltaic environment as expressed by strata at the base and inter- to subtidal coastal sediments towards the top. The second regression is mainly represented by the evaporitic sabkha environment of the overlying Bänkerjoch Formation.
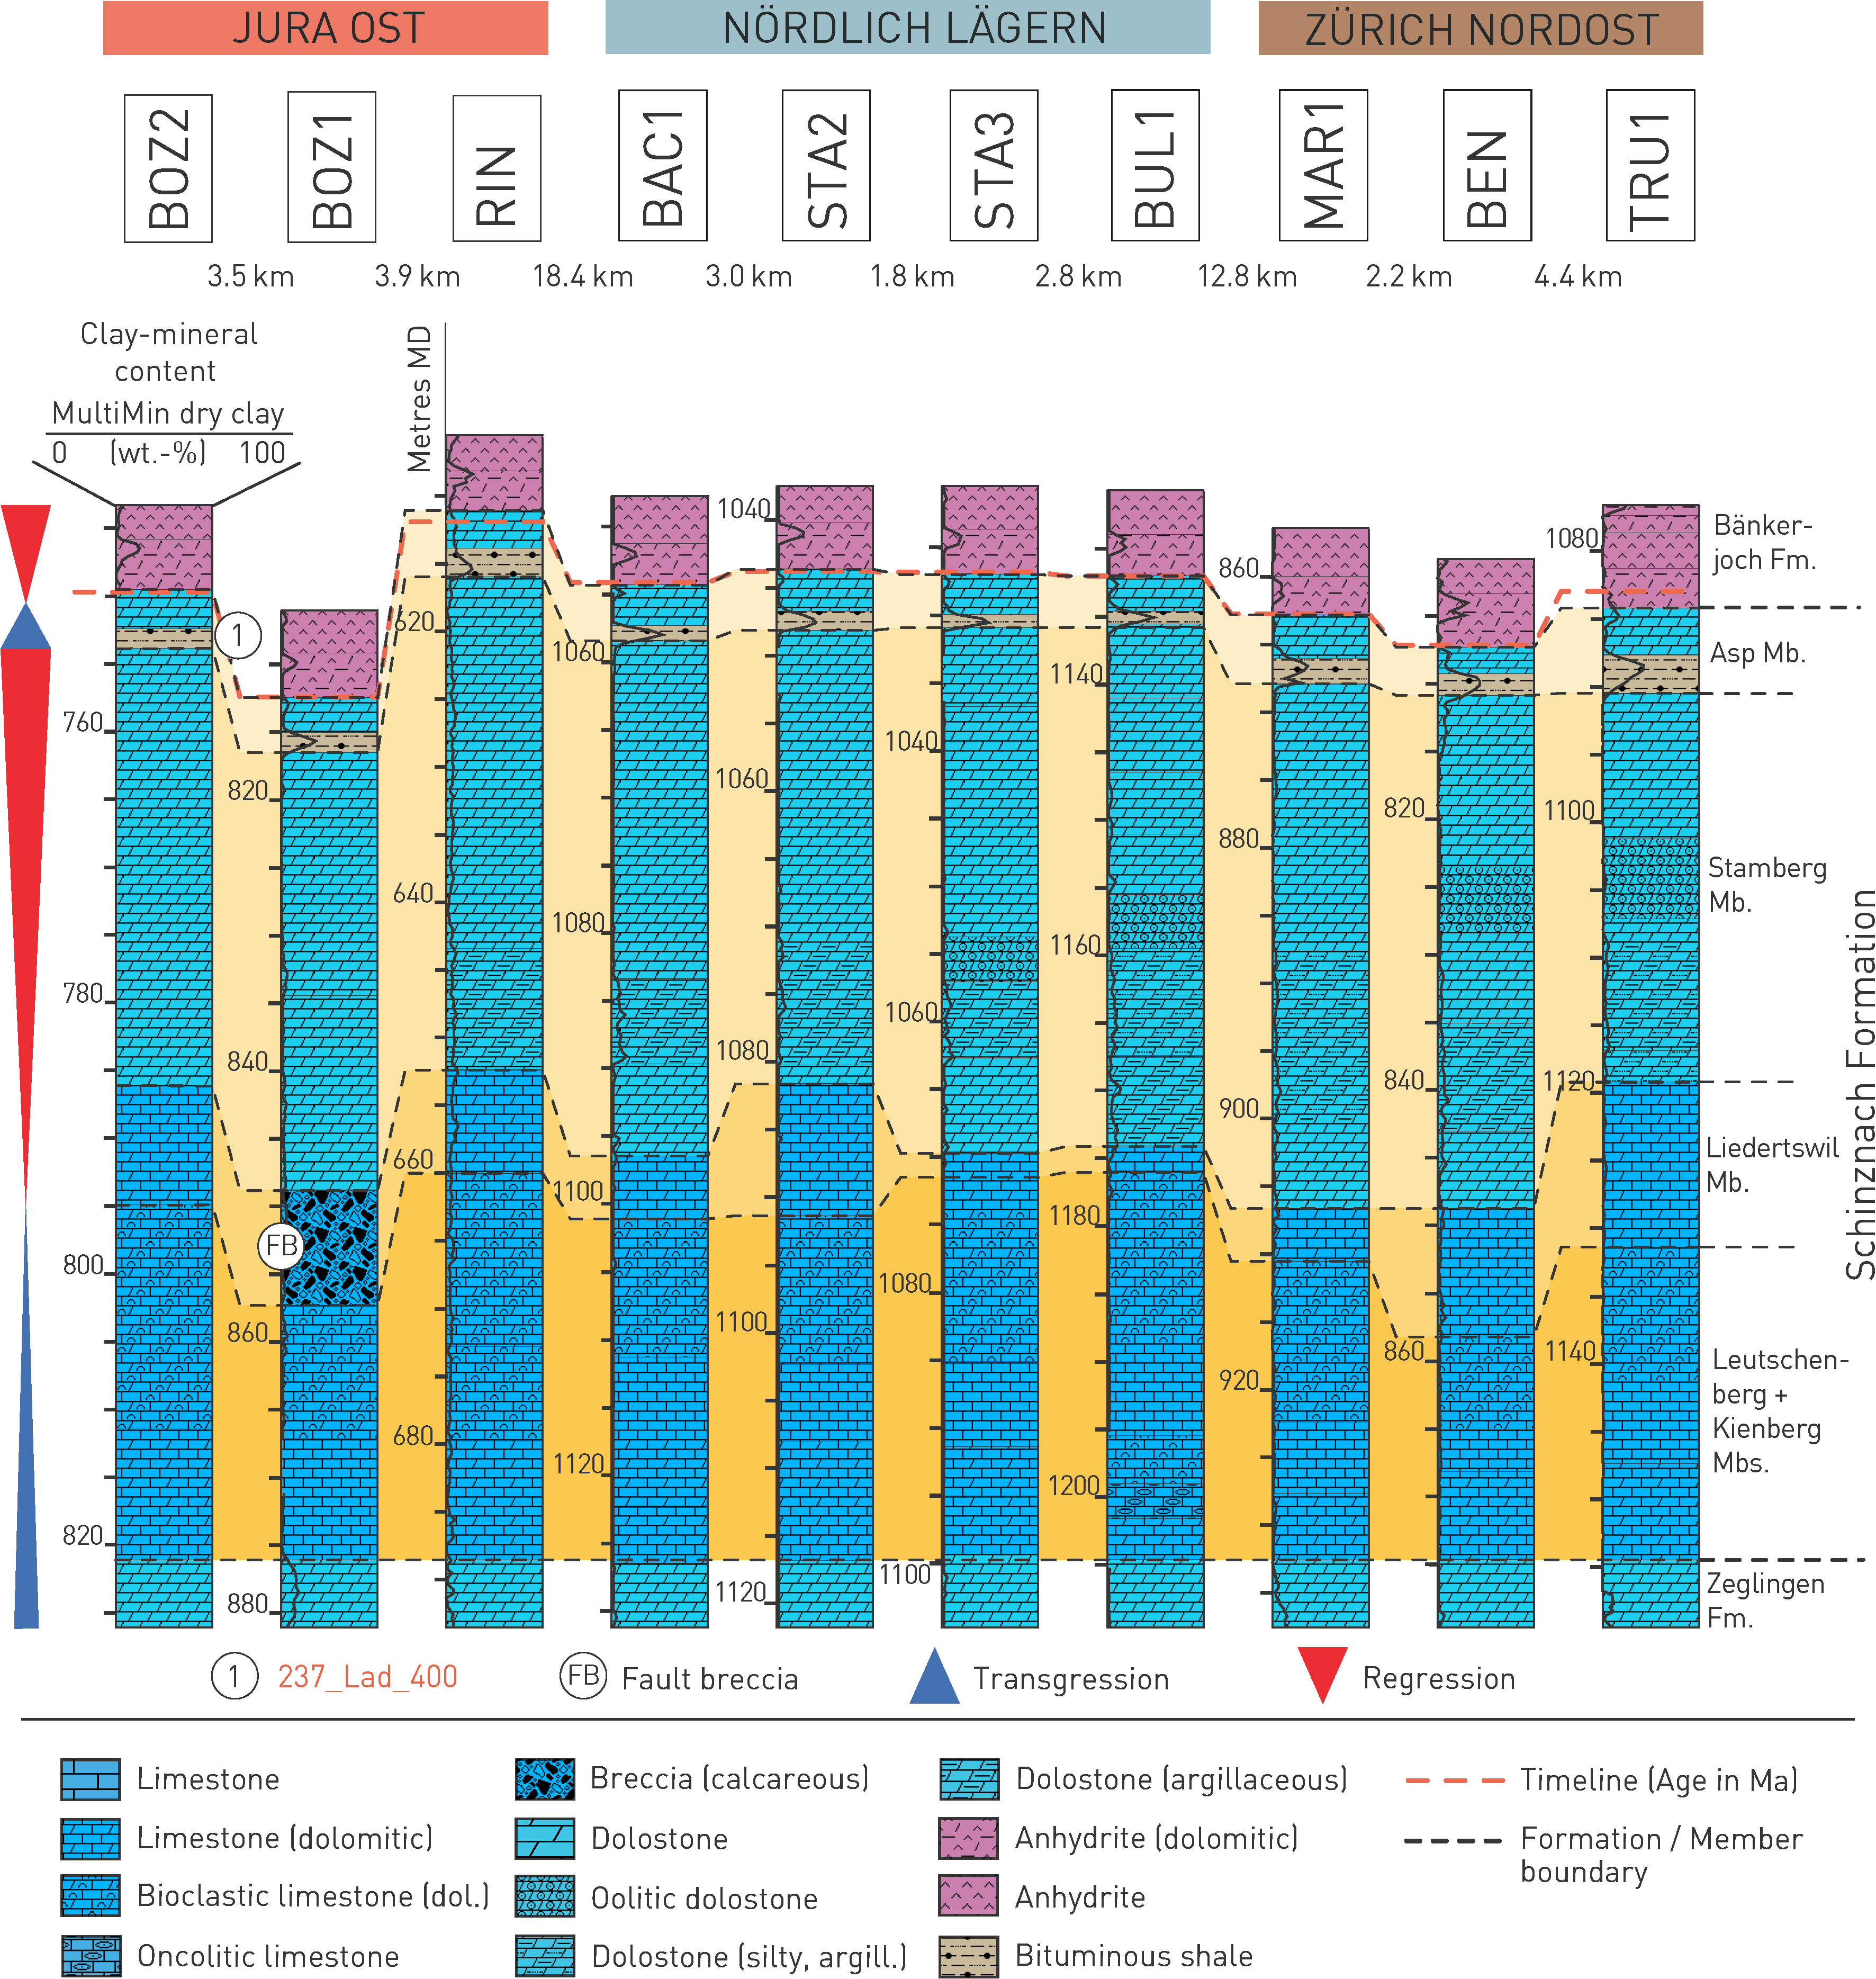
Fig. 4‑8:Stratigraphic borehole correlation of the Schinznach Formation
For lithological nomenclature refer to Naef et al. (2019). Clay-mineral content after Becker & Marnat (2024) . Some of the boundaries and lithologies as discussed in the original reports were adjusted to integrate all presented borehole data.
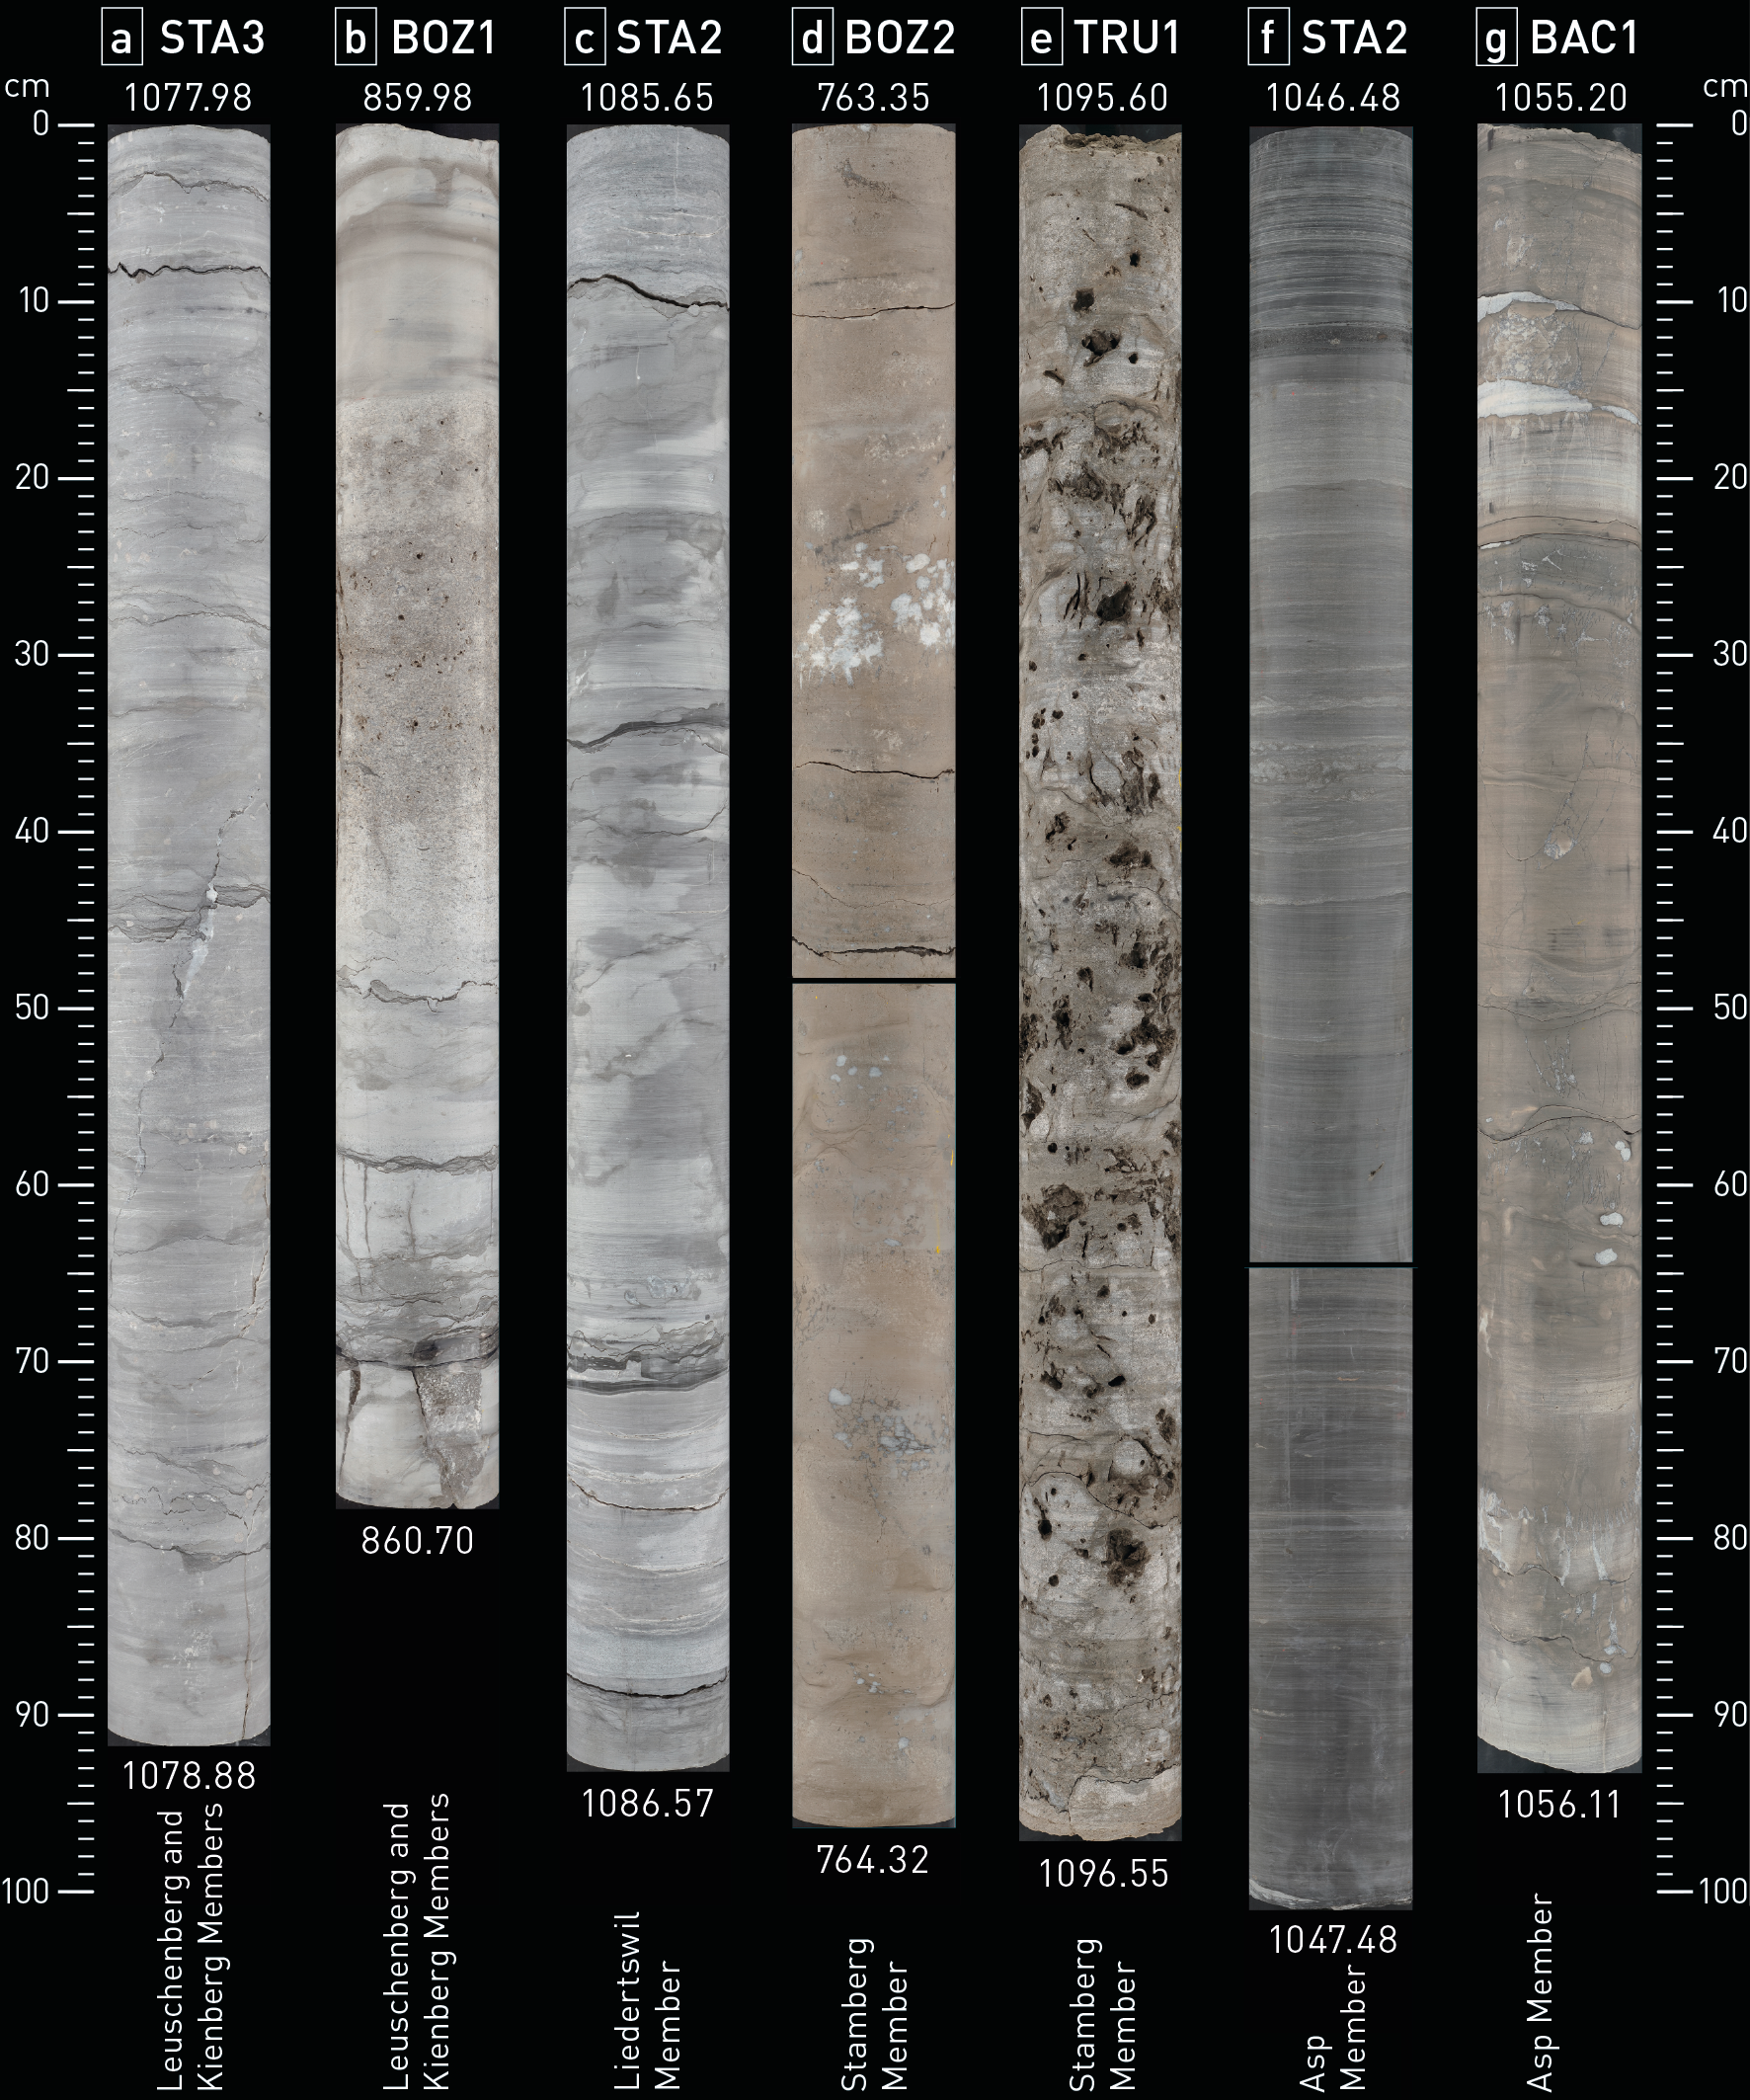
Fig. 4‑9:Selected core photos of the Schinznach Formation
(a) Grey, moderately fossiliferous (crinoids) limestone, slightly to moderately bioturbated, stylolites with thin argillaceous coatings; (b) light grey limestone and medium grey calcareous marl, bioturbated with grey, porous, bioclastic limestone bed; (c) grey, partly bioturbated and glauconitic limestone; (d) beige dolostone with white irregularly shaped anhydrite nodules; (e) beige grey dolostone with abundant vugs; (f) dark grey bituminous shale; (g) greyish brown dolostone with white anhydrite nodules and nodular layers.
The Bänkerjoch Formation (lower unit of the Keuper Group) underlies the Klettgau Formation. Where the local Keuper aquifer (part of the Klettgau Formation) is absent, the Bänkerjoch Formation is part of the lower confining units (Sections 4.5.3.11, 4.9). The Bänkerjoch Formation was deposited during the Triassic, when Northern Switzerland was located at the southern border of the Central European Basin (Chapter 3). It was deposited in vast sabkha plains with sporadic marine ingressions in an arid climate setting (Dronkert et al. 1990).
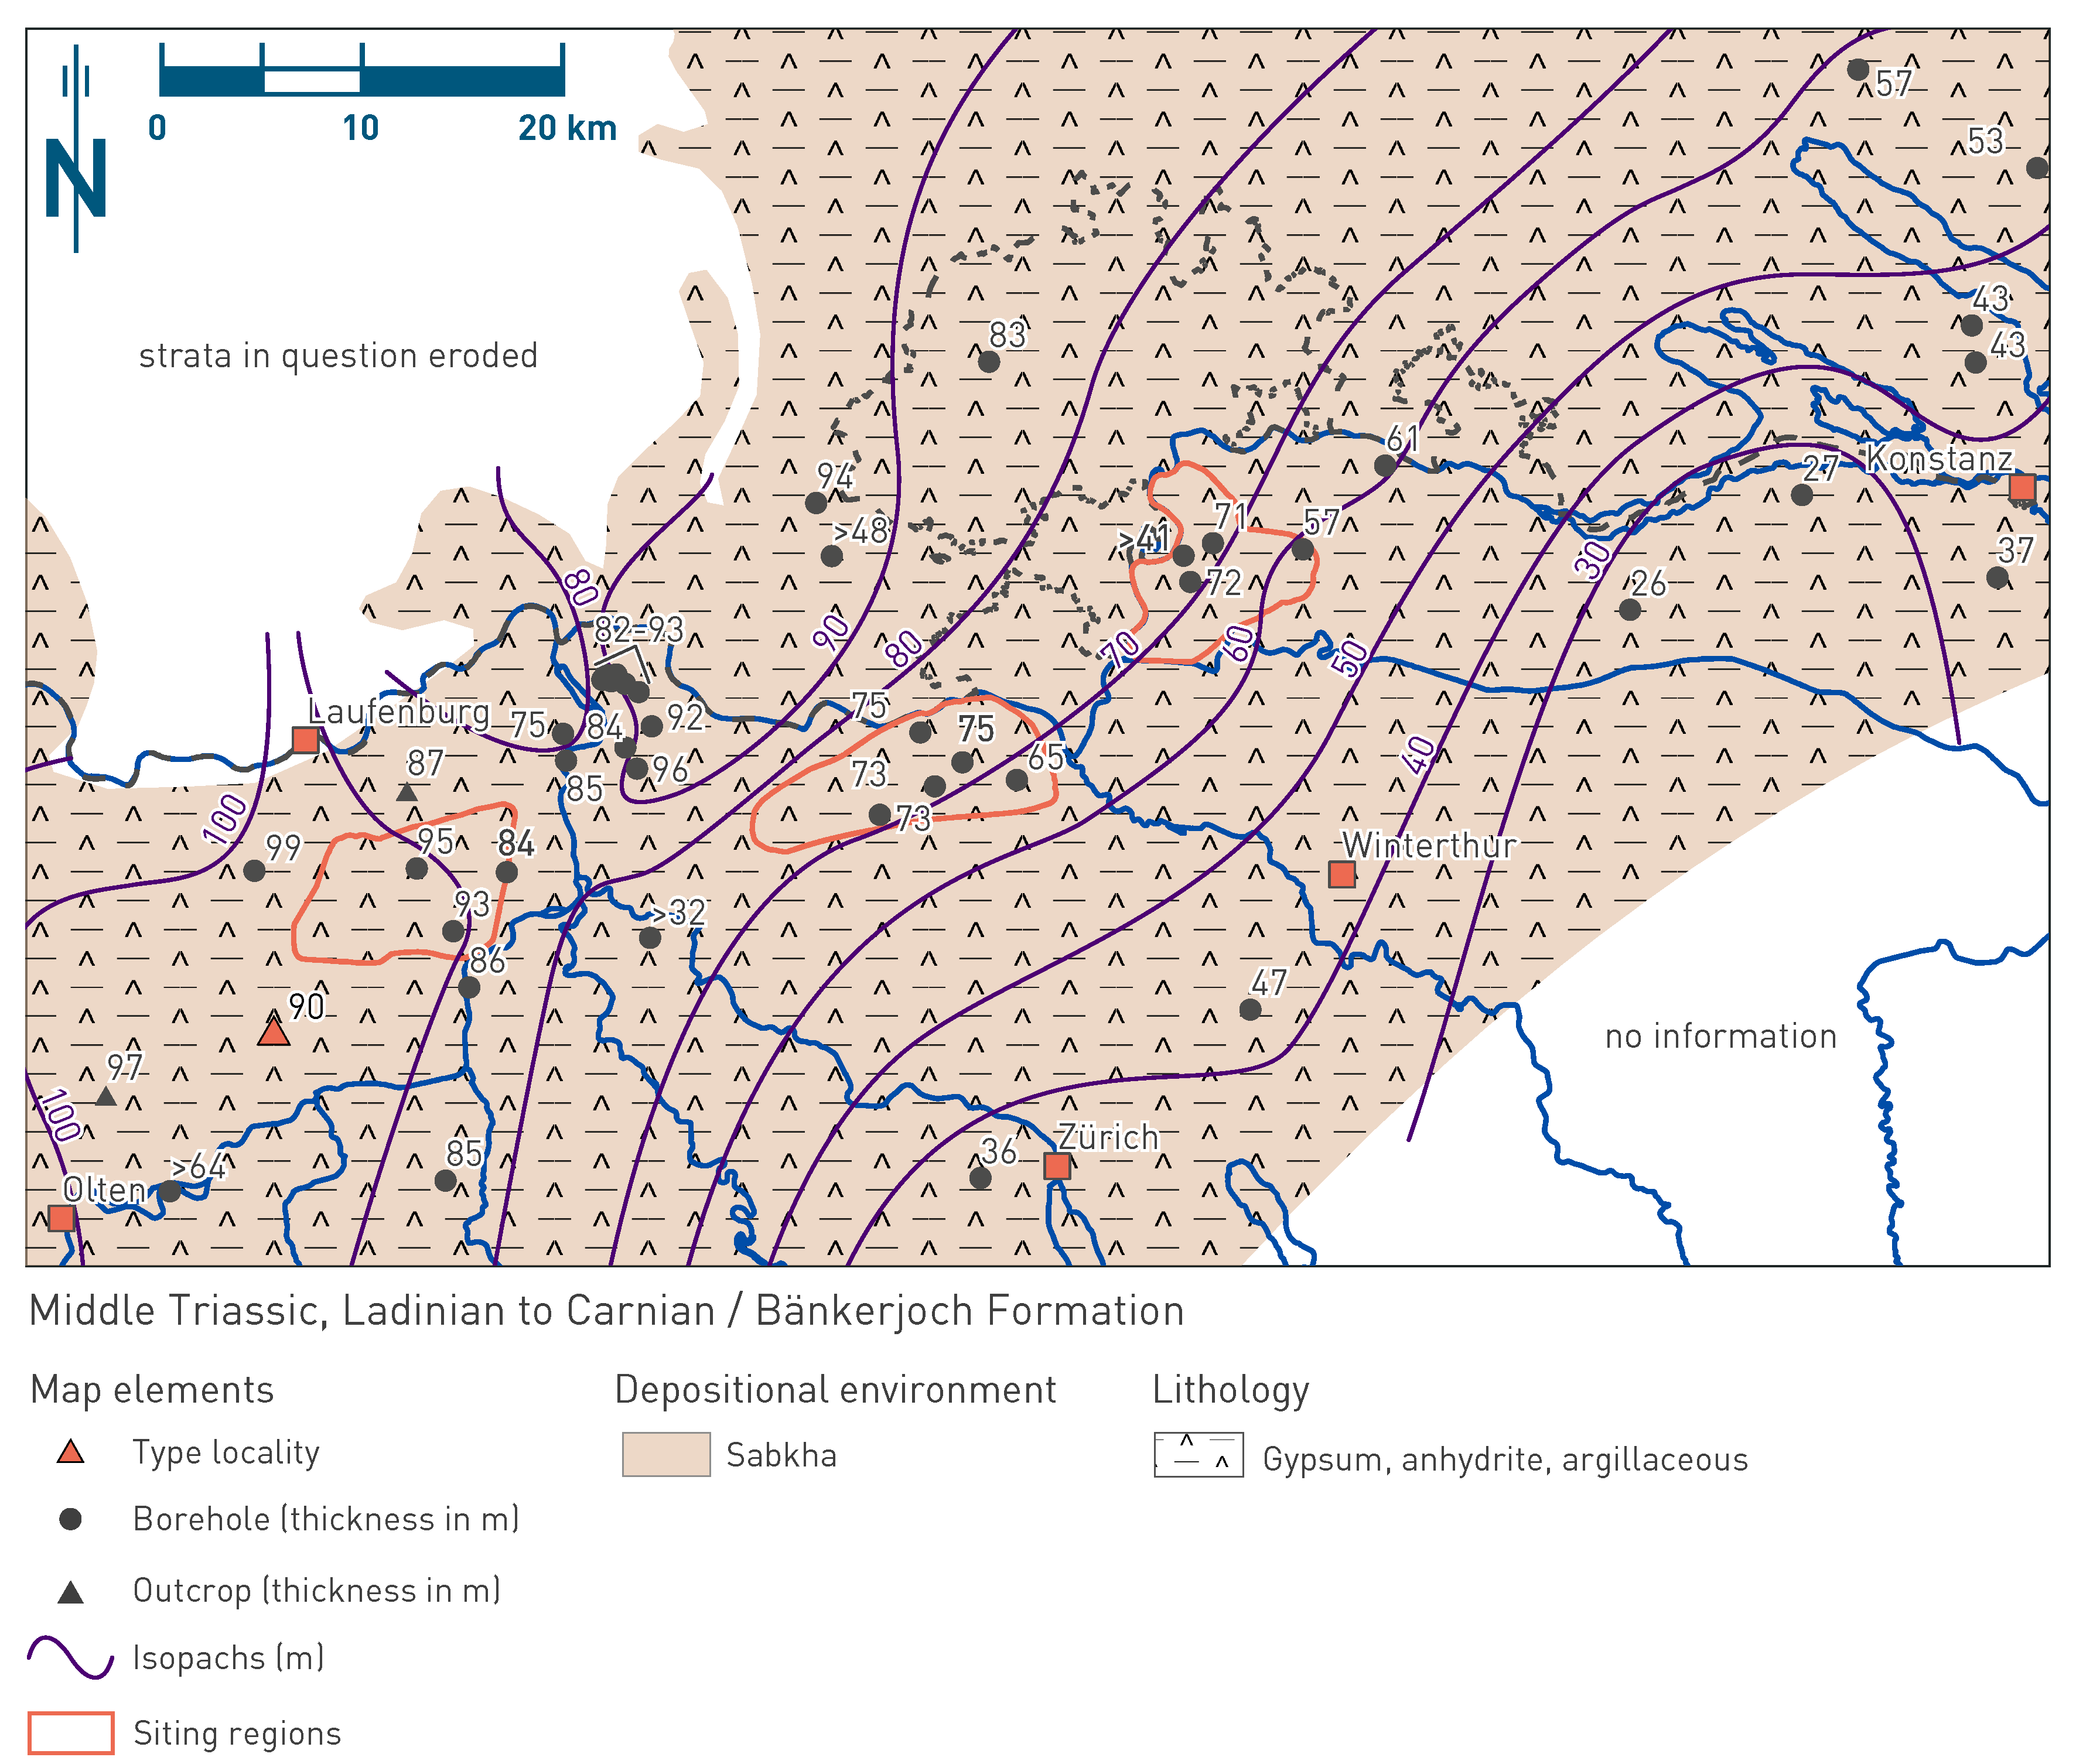
Fig. 4‑10:Map of depositional environments during the Middle Triassic (Late Ladinian – Early Carnian) preserved in the Bänkerjoch Formation
Refer to Fig. 4‑3 for a schematic representation of depositional environments. The north arrow refers to present-day geographic north.
The Bänkerjoch Formation (former «Gipskeuper», part of the Keuper Group) exists in all three siting regions with similar characteristics and a thickness in the range between ca. 55 and 95 m (Fig. 4‑10). The unit mostly consists of anhydrite (close to the surface and in outcrops also gypsum), claystone and dolostone (Fig. 4‑11). From bottom to top, the formation comprises cyclic successions of chicken-wire anhydrite, dolomitic claystone with thin anhydritic layers and claystone (Dronkert et al. 1990; Fig. 4‑12).
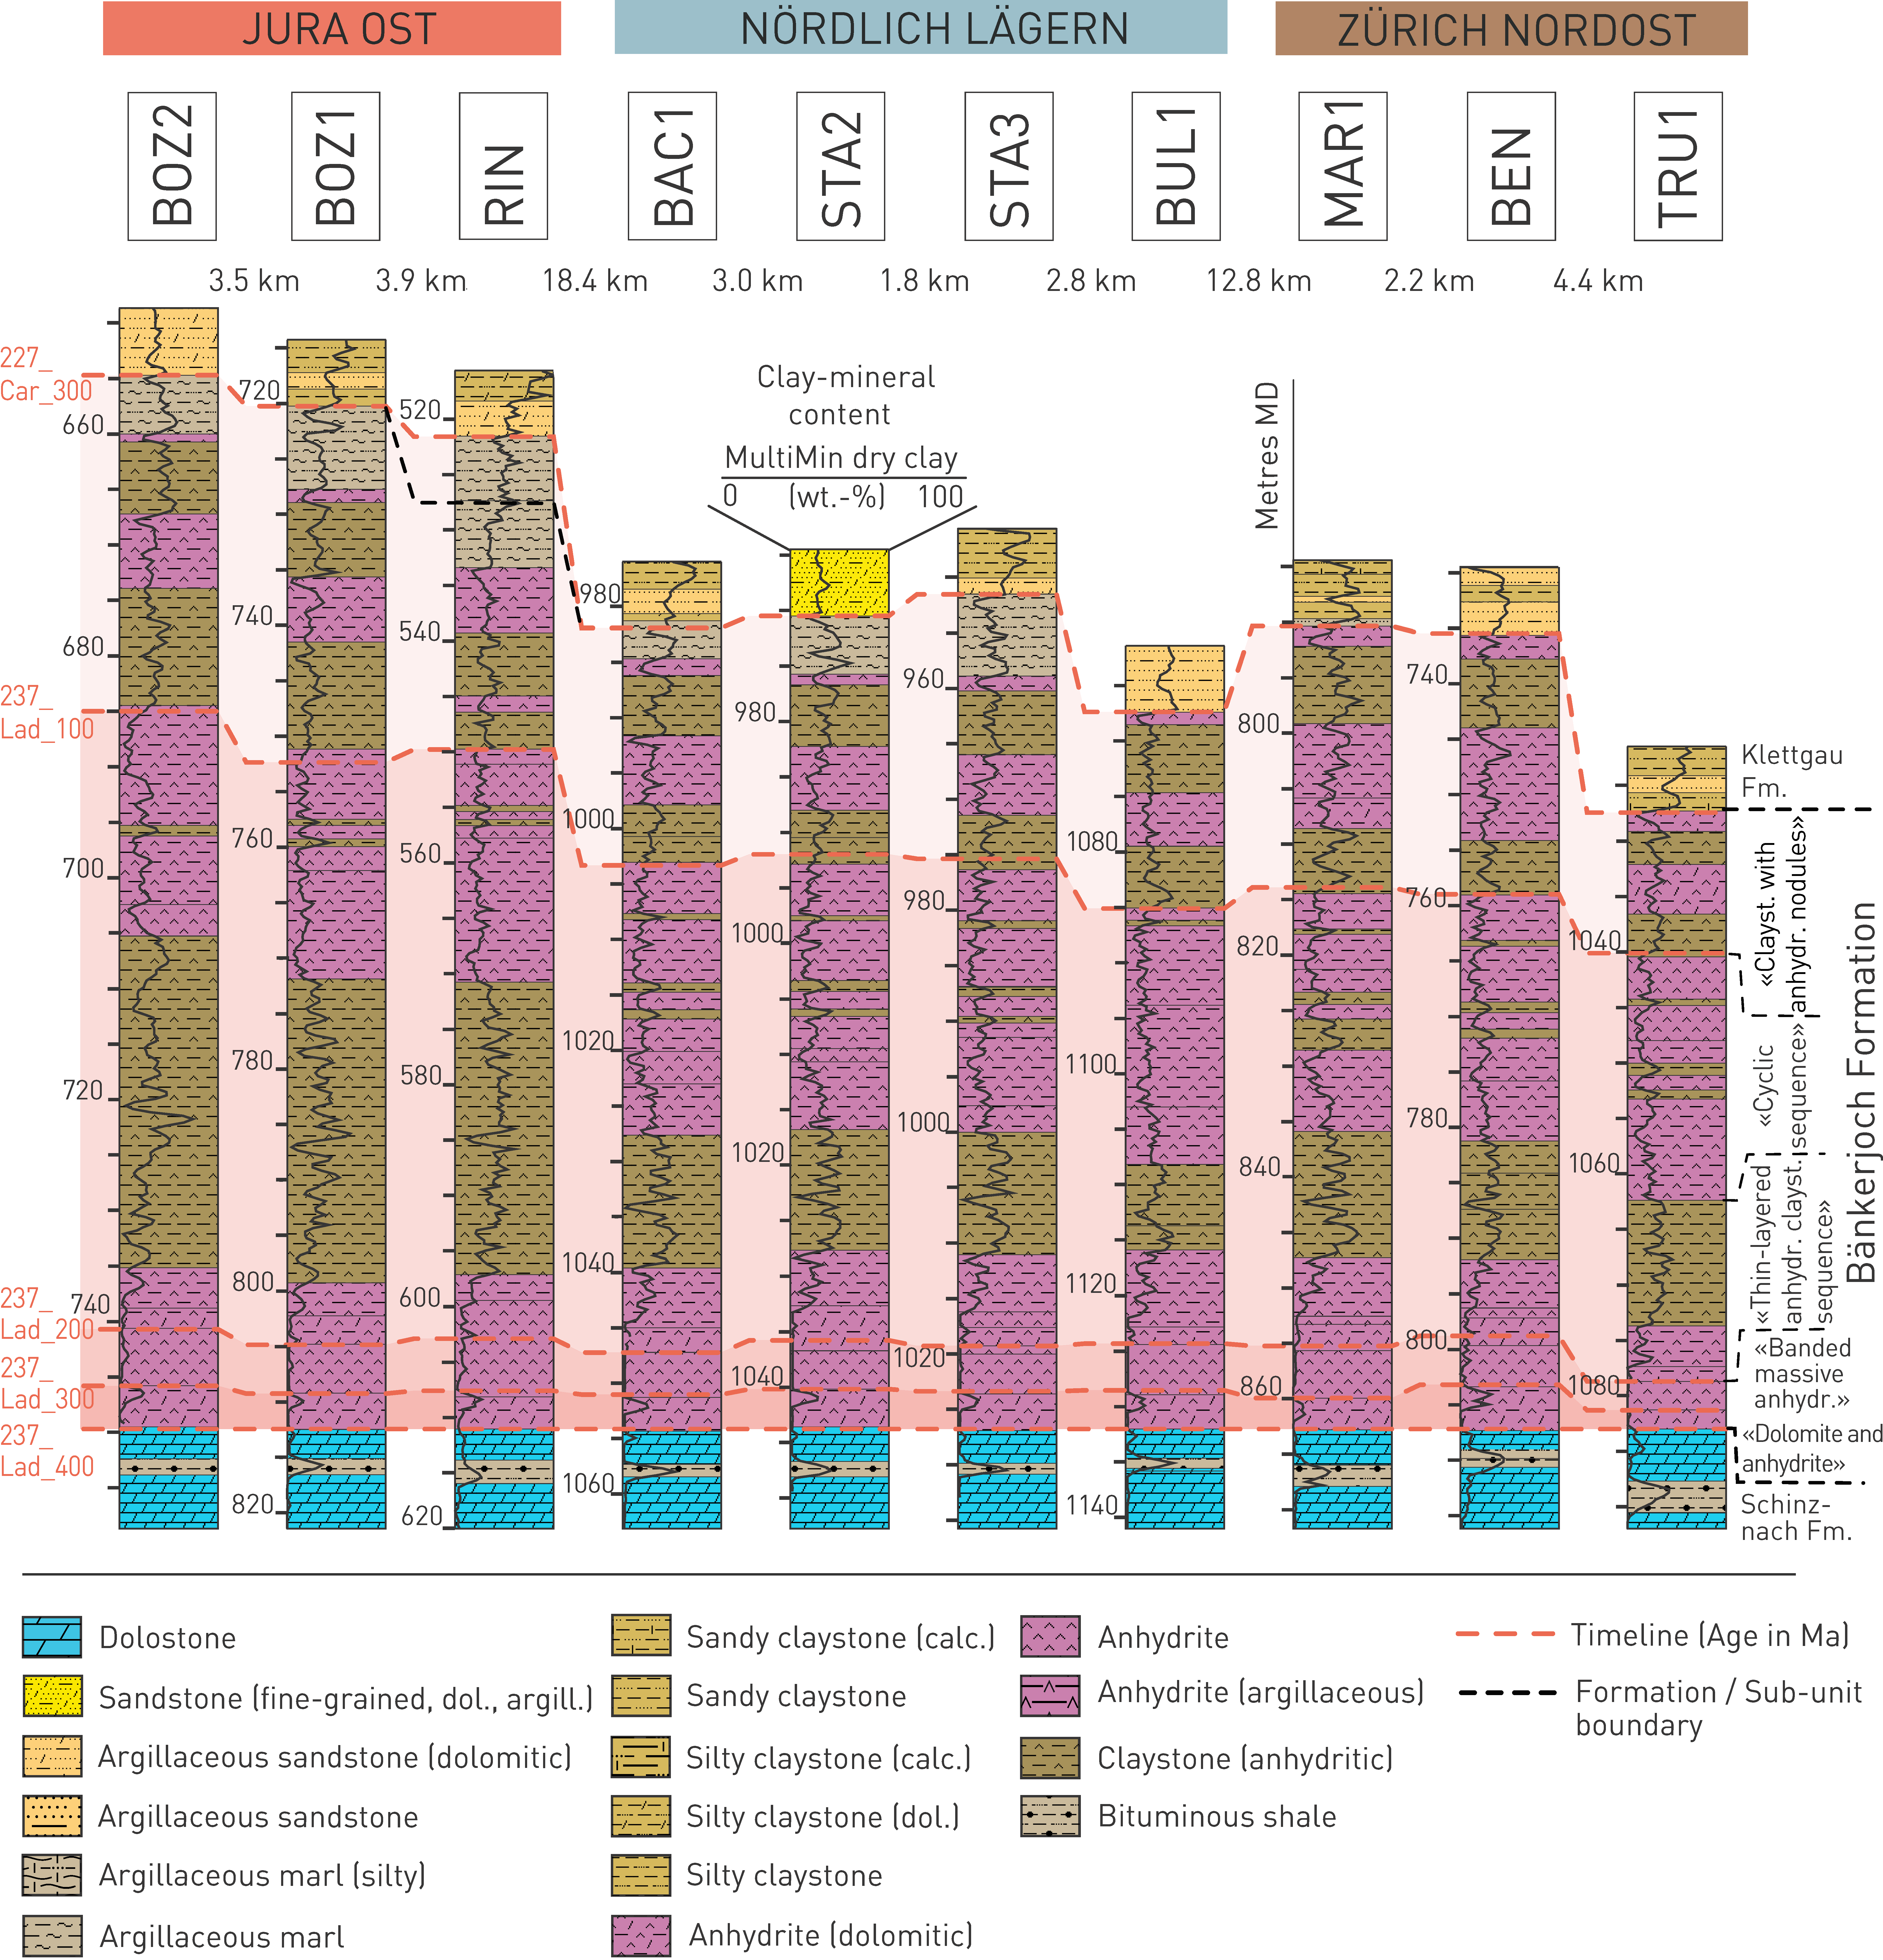
Fig. 4‑11:Stratigraphic borehole correlation of the Bänkerjoch Formation
For lithological nomenclature refer to Naef et al. (2019). Clay-mineral content after Becker & Marnat (2024) . Some of the boundaries and lithologies as discussed in the original reports were adjusted to integrate all presented borehole data.
The Bänkerjoch Formation has been subdivided into five informal subunits (Jordan et al. 2016a, 2016b):
«Dolomite and anhydrite»: The lowermost subunit of the Bänkerjoch Formation consists of an intercalation of dolomitic and anhydritic layers with some argillaceous marls with anhydritic nodules (Fig. 4‑12a).
«Banded massive anhydrite»: This subunit mostly consists of massive to banded anhydrite with some argillaceous to dolomitic interbeds (Fig. 4‑12b).
«Thin-layered anhydrite claystone sequence»: This subunit mostly consists of a succession of finely laminated anhydritic claystone, argillaceous, dolomitic marl and anhydrite (Fig. 4‑12c). The anhydrite occurs mostly in the form of beds with a nodular to chicken-wire fabric.
«Cyclic sequence»: This subunit includes sedimentary rocks that represent complete and mostly incomplete cycles with a thickness of mostly a few decimetres (Fig. 4‑12d & e). A typical complete cycle starts with chicken-wire anhydrite with anhydritic nodules in a matrix of claystone (anhydritic). It is followed by dolomitic claystone and nodular to laminated anhydrite and ends with a claystone (anhydritic) traversed by anhydrite veins.
«Claystone with anhydrite nodules»: This uppermost subunit of the Bänkerjoch Formation is lithologically the most heterogeneous (Fig. 4‑12f & g). It is mostly characterised by silty claystone (anhydritic or dolomitic) with interbeds of anhydrite and dolostone (anhydritic) to dolomitic marl. The anhydrite occurs in form of single nodules of mm to > 1 dm size, veins and densely packed nodular beds.
The general facies variability determined by sulphatic, argillaceous and dolomitic intercalations in the Bänkerjoch Formation is similar and is correlatable between all boreholes of the siting regions (Fig. 4‑11). For example, the interval with massive anhydrite in the lowermost part of the Bänkerjoch Formation is very well expressed and can be traced well laterally (defined by low clay-mineral contents between 237_Lad_300 and 237_Lad_200). However, in detail the expression, thickness and number of the lithological cycles vary depending on local conditions in the former sabkha environment. Additionally, lateral differences exist in the uppermost subunit where the overlying fluvial facies of the Ergolz Member (Klettgau Formation) is separated from the Bänkerjoch Formation by an erosional unconformity as observed in the TRU1 borehole.
The Bänkerjoch Formation was deposited during the transition between Middle and Late Triassic (Ladinian to Early Carnian; Kozur & Bachmann 2008, Bernasconi et al. 2017). Three timelines have been picked within the Bänkerjoch Formation (237_Lad_300, 237_Lad_200, 237_Lad_100). The two older timelines approximately follow the «Banded massive anhydrite» facies, which is interpreted as being deposited during roughly the same period (Fig. 4‑11). The younger timeline approximately follows the top of the «Cyclic sequence».
The Bänkerjoch Formation was deposited in vast sabkha plains at the southern border of the Central European Basin under arid conditions. The depositional environment was characterised by subaerial flats, ephemeral and saline ponds to lagoons subjected to sporadic marine ingressions. 3D seismic facies interpretation indicates that the Bänkerjoch Formation is characterised by a complex depositional history with potentially one or more evaporite dissolution events (Nagra 2024a, 2024b, 2024c). The sedimentation rates are overall medium, but fluctuated significantly between phases of deposition and non-deposition (Fig. 4‑4, Fig. 4‑5, Fig. 4‑6). The Bänkerjoch Formation formed during a large-scale regressive cycle with many superimposed small-scale regressive cycles (Dronkert et al. 1990). In the Bänkerjoch Formation, no halite and dissolution breccias such as in the Zeglingen Formation have been found; this reflects deposition in a marginal position of the basin with a relatively high argillaceous input. Conversely, coeval sedimentary rocks exposed in the present-day French Jura Mountains formed in a more basinal environment where halite was deposited. The depositional evolution of the Bänkerjoch Formation is subdivided here into four time intervals (Fig. 4‑11):
The first time interval (237_Lad_400 to 237_Lad_300) approximately corresponds to the «Dolomite and anhydrite» subunit. During this time, the depositional environment was characterised by saline ponds and lagoons, with anhydritic to dolomitic sedimentation as well as argillaceous input.
The second time interval (237_Lad_300 to 237_Lad_200) approximately corresponds to the «Banded massive anhydrite» subunit. This time interval was characterised by depositional environments ranging from saline ponds to lagoons, with generally anhydritic sedimentation.
The third time interval (237_Lad_200 to 237_Lad_100) approximately corresponds to the «Thin-layered anhydrite claystone sequence» and «Cyclic sequence» subunits. During this time interval, thick successions of sediments were deposited in shallow and ephemeral ponds as well as subaerial flats. In subaerial flats, pedogenic processes in combination with groundwater fluctuations and periodic flooding led to the formation of nodular to bedded sulphate horizons (cycles).
The fourth time interval (237_Lad_100 to 227_Car_300) approximately corresponds to the «Claystone with anhydrite nodules» subunit. This time interval is dominated by subaerial, more argillaceous sediments. Pedogenesis and groundwater fluctuations led to the formation of nodular anhydrite.
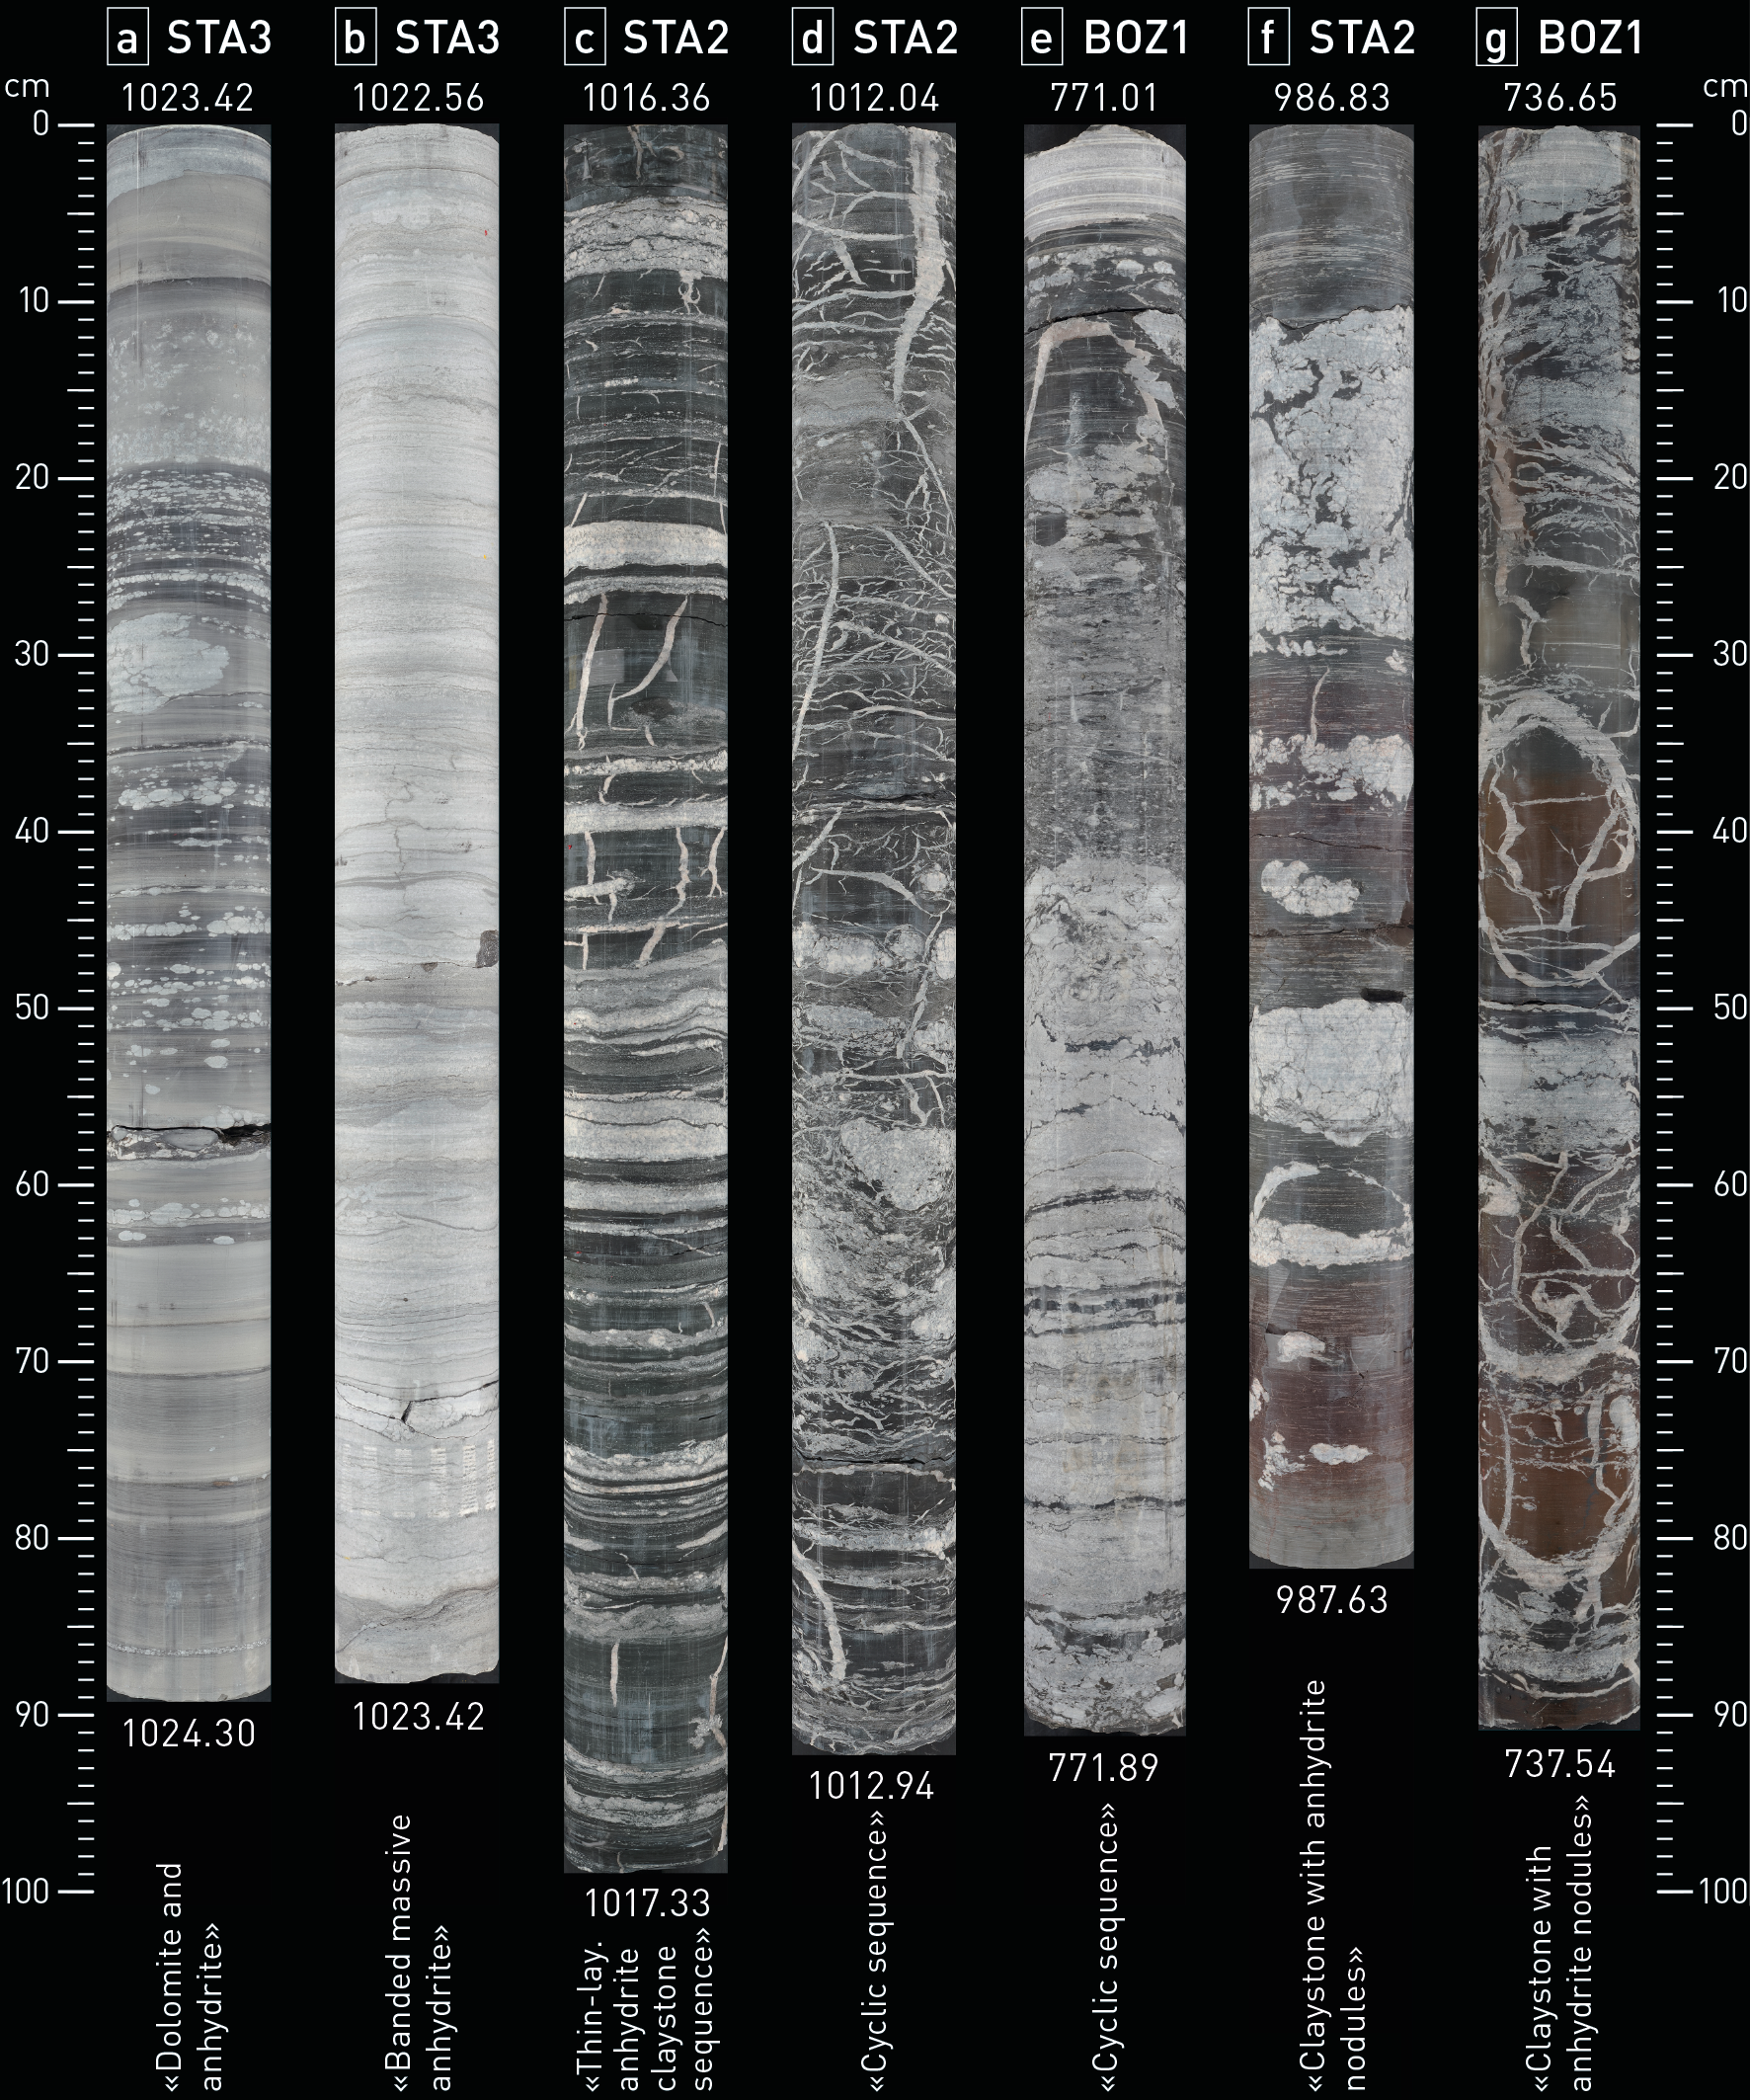
Fig. 4‑12:Selected core photos of the Bänkerjoch Formation
(a) & (b) beige to dark grey dolomitic marl with white anhydrite nodules and beds of beige grey argillaceous dolostone, above 1'023.45 m: white massive to thin-bedded anhydrite with fine layers of dark grey dolomitic claystone; (c) alternating laminated layers of white dolomitic anhydrite and black anhydritic claystone with few white anhydrite veins; (d) white nodular anhydrite (chicken-wire) with frequent anhydrite veins and black anhydritic claystone; (e) from bottom to top: cyclic sequence of white nodular anhydrite (chicken-wire), dark grey dolomitic claystone with nodular to laminated beds of anhydrite and black anhydritic claystone with anhydrite veins; (f) & (g) dark grey to brown anhydritic claystone with white nodular anhydrite partly enriched in beds traversed by anhydrite veins.
The Klettgau Formation (upper unit of the Keuper Group) underlies the Staffelegg Formation and belongs, at least partly, to the lower confining units. In JO and ZNO and partly in NL, it includes the local Keuper aquifer (Section 4.5.3.10). The Klettgau Formation was deposited in the southern part of the Central European Basin during the Late Triassic (Chapter 3). At this time, Northern Switzerland was dominated by variable, mostly terrestrial depositional environments (Fig. 4‑13).
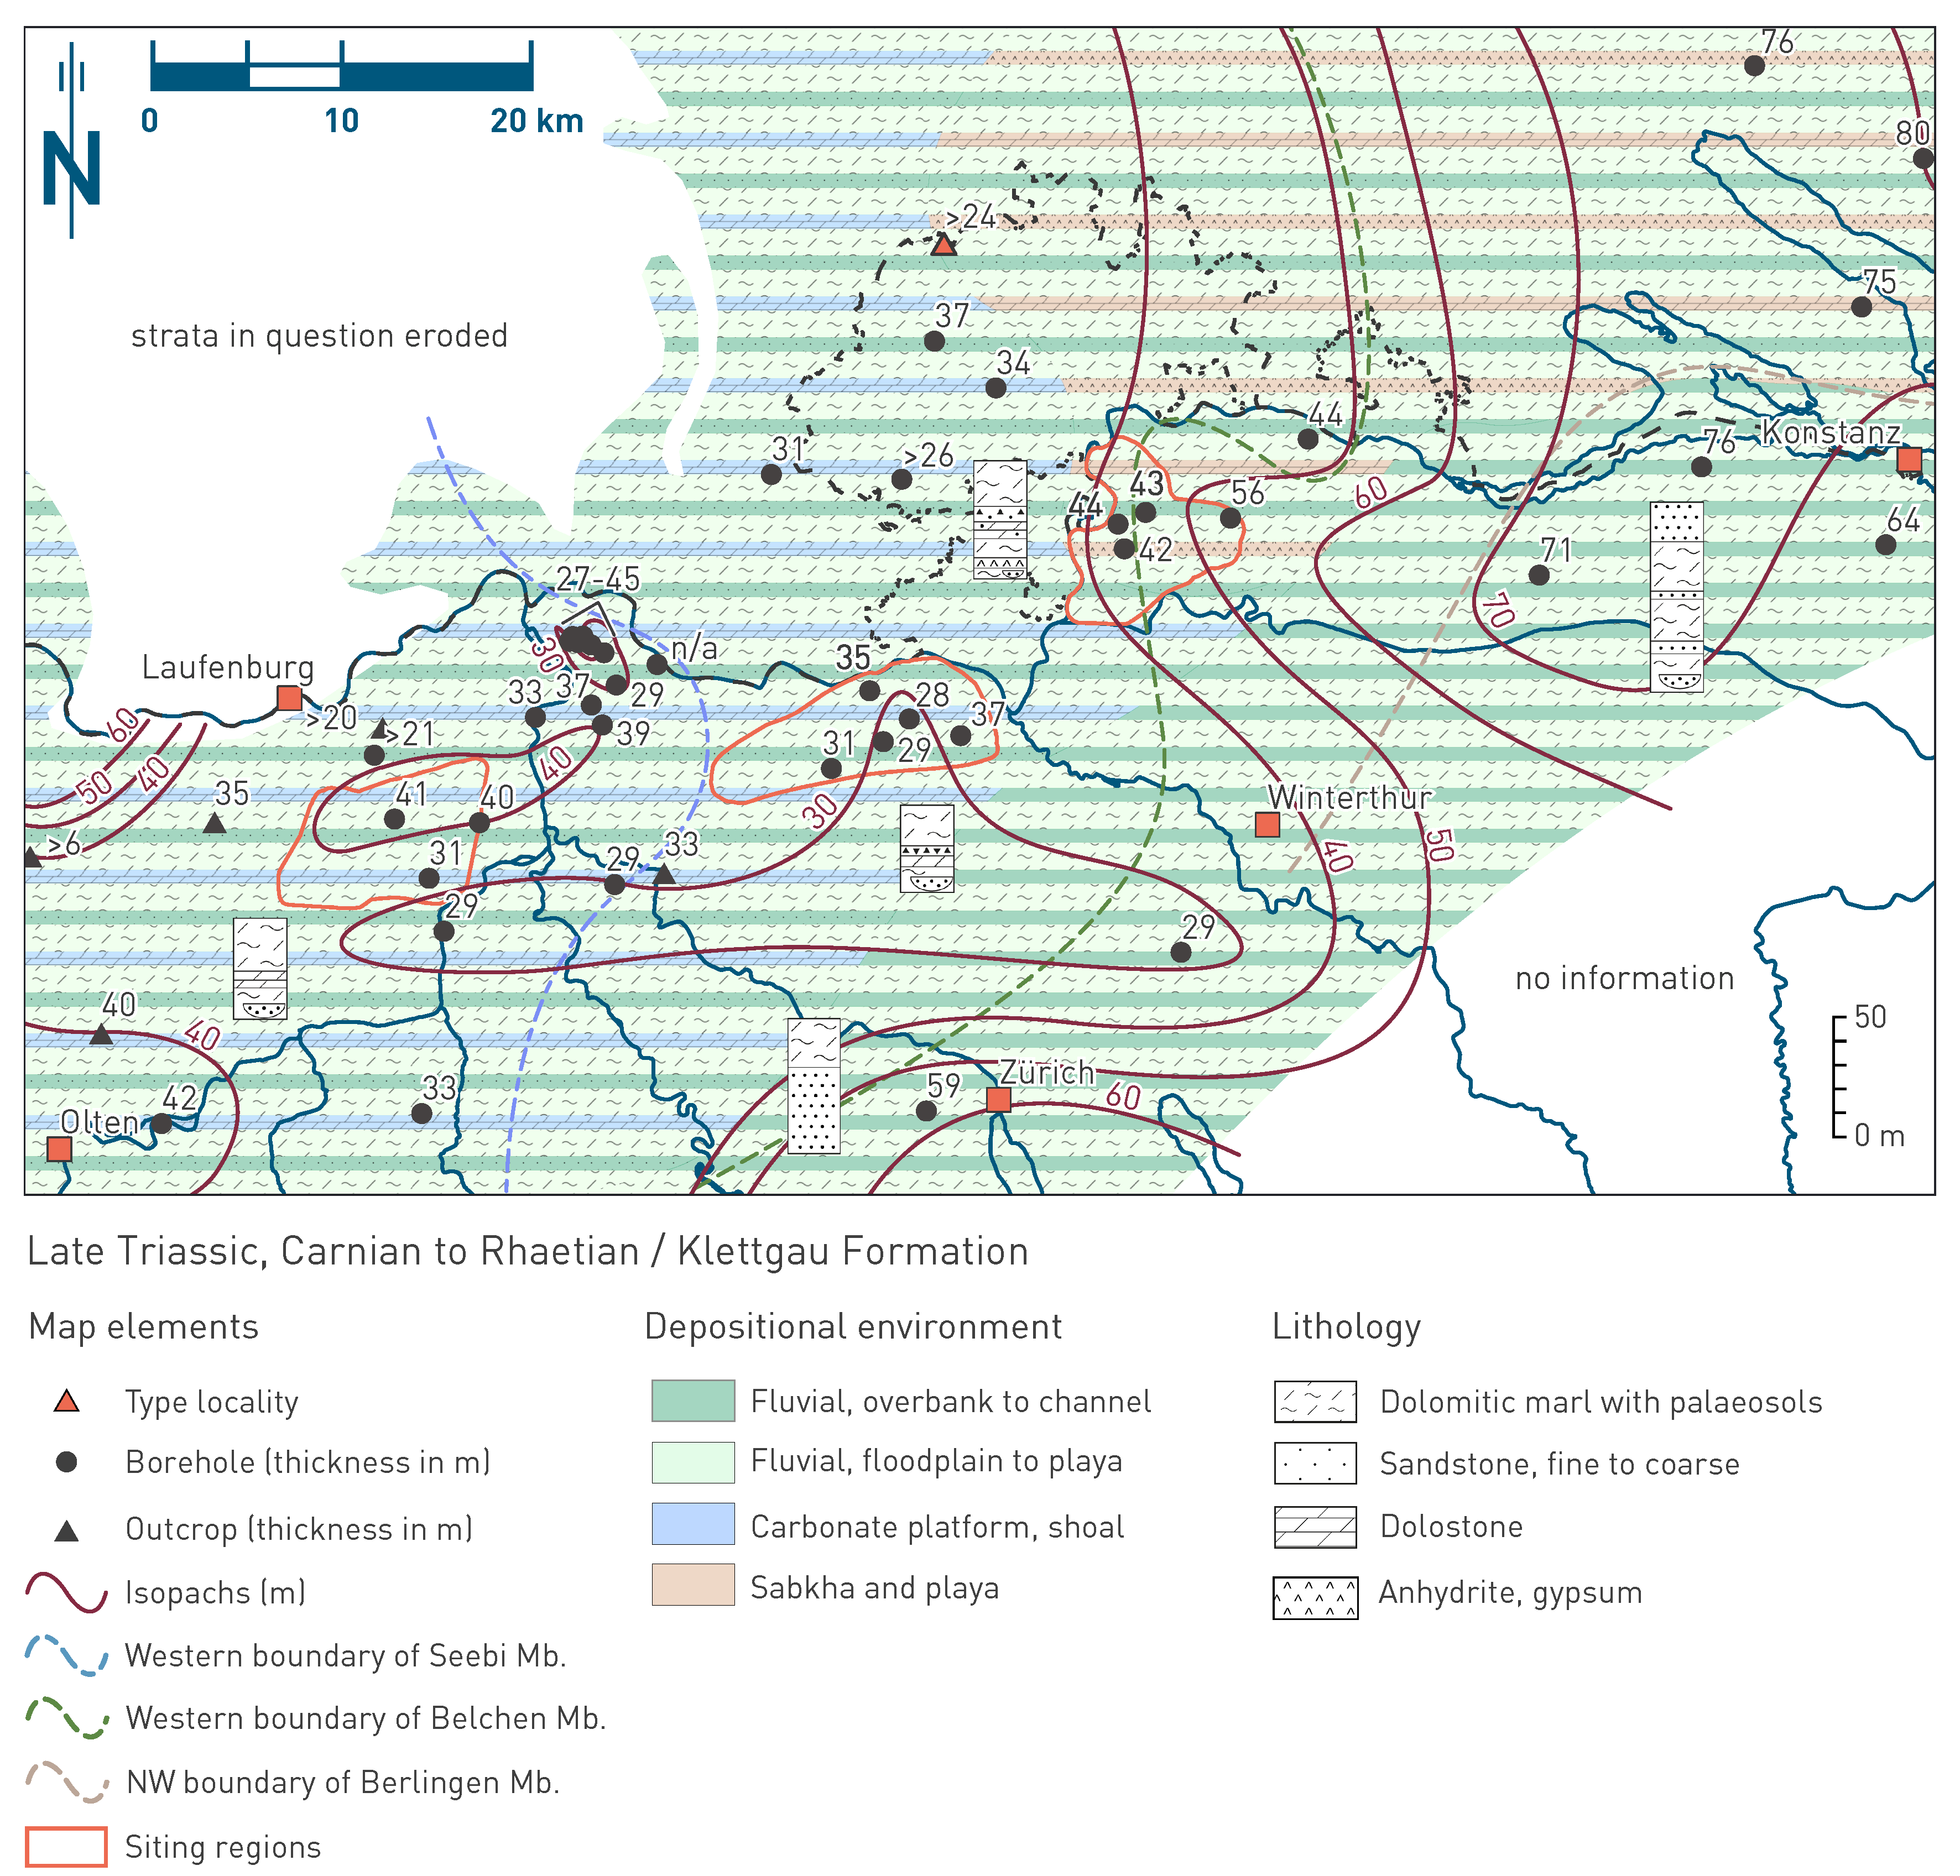
Fig. 4‑13:Map of depositional environments during the Late Triassic (Carnian to Rhaetian) preserved in the Klettgau Formation
Refer to Fig. 4‑3 for a schematic representation of depositional environments. The north arrow refers to present-day geographic north. Mb.: Member.
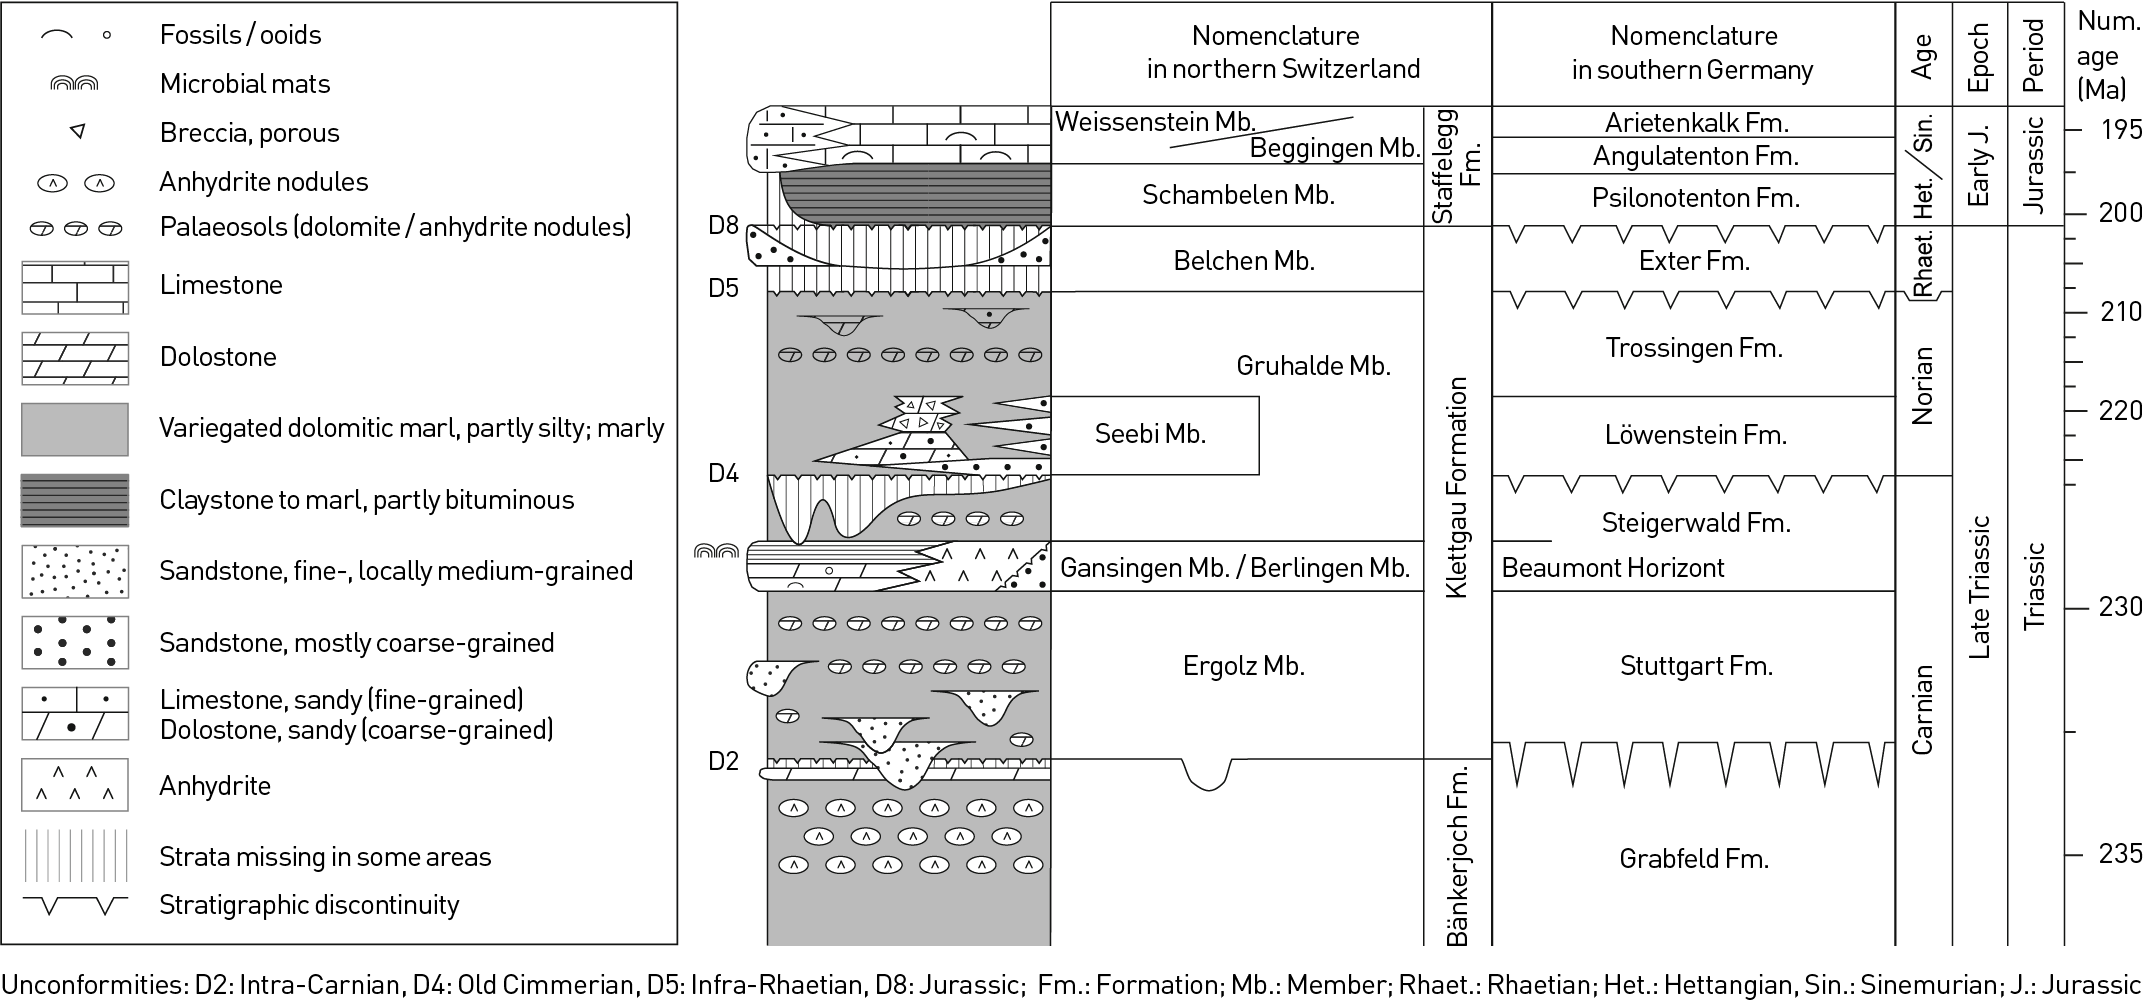
Fig. 4‑14:Schematic synoptic section of the Klettgau Formation with its different members
On the right, comparison with correlative stratigraphic units in Germany (Etzold & Schweizer 2005, Geyer et al. 2023). Modified after Jordan et al. (2016b).
The Klettgau Formation has a thickness varying between ca. 30 and 55 m (Fig. 4‑13). It is a heterogeneous succession dominated by dolomitic and argillaceous marls with intercalations of dolostones and partly porous sandstones (Fig. 4‑16). In some intervals this unit also includes porous dolomitic breccias and anhydrite. The Klettgau Formation can be divided into five members (Fig. 4‑14) in the three siting regions (Jordan et al. 2016b; Fig. 4‑16):
Ergolz Member (former «Schilfsandstein (sensu lato)» or «Schilfsandstein Formation», «Untere Bunte Mergel»): This member is the lowermost unit of the Klettgau Formation. Its thickness varies between ca. 6 and 21 m (Fig. 4‑17). It is dominated by dolomitic and argillaceous marl of the floodplain facies («normal facies»; Fig. 4‑16a). In this facies there are pedogenic nodular beds and nodules of dolostone. There are also partly porous sandstones and siltstones with cross- and flaser-bedding as well as ripples that were deposited in fluvial channels («channel facies»; Fig. 4‑16b, Fig. 4‑18, Fig. 4‑19). The sandstones of the Ergolz Member contain a significant proportion of lithic clasts, particularly up to ca. 30% of schistose clasts. As a transition between floodplain and channel facies deposits there are overbank facies deposits with a heterolithic association of fine, partly porous and silty sandstone and marl. Within the siting regions the most distinctive cross-bedded fluvial channel facies has been drilled in the STA2 borehole in western NL, but, based on its former depositional environment, it is likely that it also exists in all three siting regions. Channel-proximal overspill and overbank facies have been identified in boreholes of all three siting regions.
Gansingen Member (former «Gansinger Dolomit (sensu lato)»): The thickness of the overlying Gansingen Member generally decreases from west to east (JO: ca. 4.5 to 7 m, NL: ca. 1 to 3 m, ZNO: ca. 1.5 to 2 m; Fig. 4‑20). In JO, the Gansingen Member consists in the lower part of a dolostone locally with bivalves and ooids. This lower part is partly porous (up to cm-wide vugs and druses; and locally brecciated and fractured (Fig. 4‑16c). The upper part is mostly laminated, consisting of dolostone, dolomitic and argillaceous marl, locally with microbial mats, teepee structures and desiccation cracks. The NL siting region appears to lie in a transitional area between the depositional environments of JO and ZNO. In general, the facies is similar to JO, but thinner and with lower macroporosity. In the eastern boreholes of NL, the Gansingen Member includes an anhydritic facies at the base similar to ZNO, where it mostly consists of anhydrite (Fig. 4‑16d). In the lower part of the Gansingen Member of ZNO, interlayers of claystone and marl occur.
Gruhalde Member (former «Obere Bunte Mergel» and «Knollenmergel»): This unit is separated into a lower and upper part by the Seebi Member in NL and ZNO (Fig. 4‑15). In JO the Seebi Member does not occur or is thinner than one metre (Riniken borehole, RIN). The Gruhalde Member in JO has a thickness of ca. 14 to 19 m. The thickness of the lower part of the Gruhalde Member is up to ca. 6 m in NL and varies between ca. 7 to 10 m in ZNO. The thickness of the upper part varies between ca. 11 and 14 m in NL and ca. 16 and 18 m in ZNO. The Gruhalde Member mostly consists of variegated dolomitic marls («normal facies») with argillaceous marl and partly nodular pedogenic dolostone (argillaceous, partly silty to sandy; Fig. 4‑16g). Desiccation cracks, local brecciation, bioturbation and plant root tubes are typical phenomena for these deposits.
Seebi Member (former «Stubensandstein (sensu lato)»): The thickness generally increases from southwest to northeast (JO: not occurring or less < 1 m, NL: < 1 – ca. 6 m, ZNO: ca. 9 – 14 m; Fig. 4‑21). In NL it consists mostly of dolostone (partly argillaceous), partly brecciated sandy dolostone, argillaceous marl and few interlayers of dolomitic sandstone. The dolostone is partly brecciated. In ZNO, the Seebi Member consists of three parts. In the lower part, argillaceous, dolomitic and partly porous sandstone with interbedded dolostone prevails (Fig. 4‑16e). In the middle part, fine-grained dolostone, partly brecciated, is found. In the upper part, dolomitic breccia or dolocrete dominate with partly significant porosity and with vugs up to 10 cm (Fig. 4‑16f). The occurrence of brecciated dolocretes with elevated macroporosity seems to increase within ZNO from west to east (Fig. 4‑15).
Belchen Member (former «Rhät»): It occurs in the deep boreholes within the siting regions only in Benken (BEN) and TRU1 with a thickness of 0.6 and 1.4 m respectively. It consists mostly of partly bituminous and fossiliferous (thin bone beds) claystone.
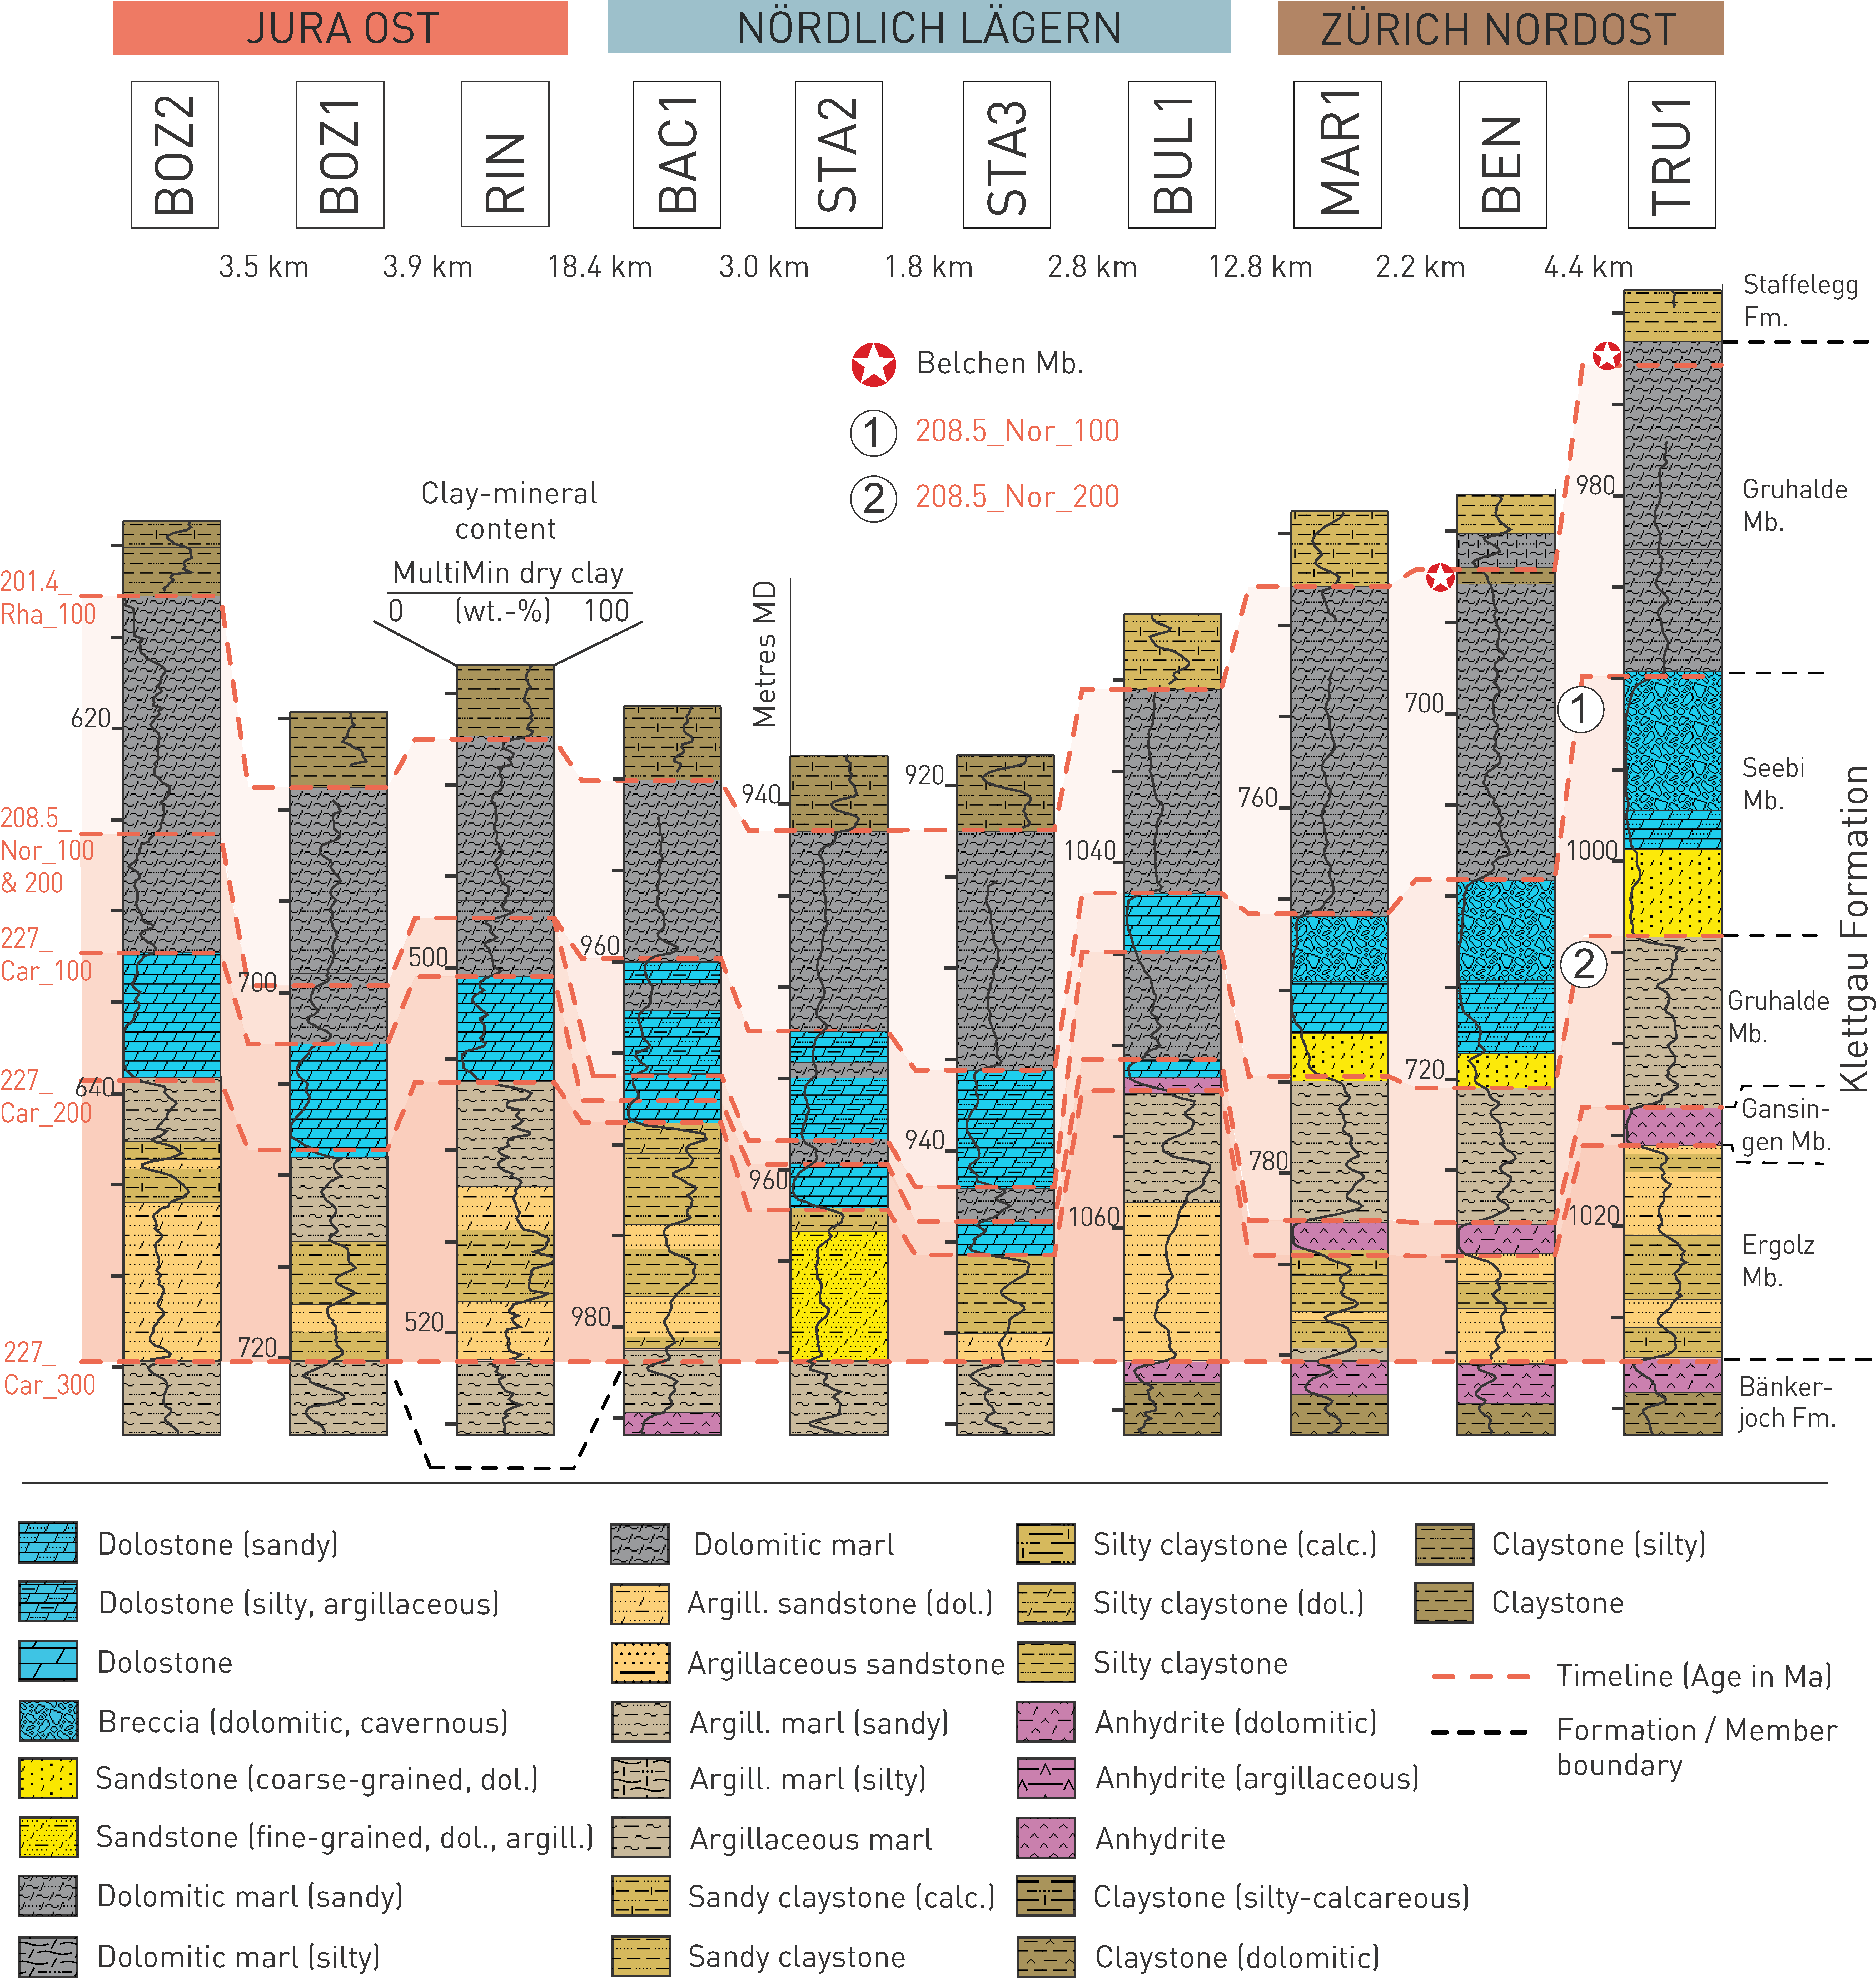
Fig. 4‑15:Stratigraphic borehole correlation of the Klettgau Formation
For lithological nomenclature refer to Naef et al. (2019). Clay-mineral content after Becker & Marnat (2024). Some of the boundaries and lithologies as discussed in the original reports were adjusted to integrate all presented borehole data.
The Klettgau Formation is a heterogeneous sedimentary succession with prominent lateral facies changes. In the Ergolz Member, channel, overbank and floodplain facies associations alternate laterally. The sandstones show a great variability in terms of composition, degree of diagenesis and porosity. The «channel facies» is incised in, or flanked by, the overbank and floodplain facies. The most typical channel facies was drilled in STA2, but, based on the inferred depositional environment, it is assumed that this facies may potentially occur in all the siting regions. The Gansingen Member decreases in thickness and shows a general facies trend from dolostone to anhydrite from west to east (along the siting regions). The Gruhalde Member exhibits a similar facies in all three siting regions, but the Seebi Member can be defined only in NL and ZNO. The Seebi Member shows a general facies change from west to east (along the siting regions) with both increasing thickness and macroporosity. Partly porous sandstones in the lower part of the Seebi Member and brecciated dolocretes with vugs have only been found in the boreholes of ZNO, and their occurrence seems also to increase towards the east.
The Klettgau Formation spans a long time period from the Middle Carnian to the Rhaetian in the Late Triassic, covering up to around 30 million years (Jordan & Deplazes 2019). It has generally only limited age constraints. Four timelines were picked within the Klettgau Formation (227_Car_200, 227_Car_100, 208.5_Nor_200, 208.5_Nor_100) that broadly follow corresponding lithostratigraphic boundaries (Top Ergolz Member, Top Gansingen Member, Top lower part of Gruhalde Member, Top Seebi Member; Fig. 4‑15). Between the top of the terrestrial Klettgau Formation and the overlying marine Staffelegg Formation there is a major diachronous unconformity that may encompass more than the entire Rhaetian, i.e. more than seven million years. However, also at the base and within the Klettgau Formation there are several unconformities that seem to have a supraregional character; the most prominent being the Old Cimmerian unconformity that encompasses a gap of several million years (Fig. 4‑14). They emphasise the discontinuous character of sedimentation in this depositional environment (Beutler 2005, Jordan et al. 2016a).
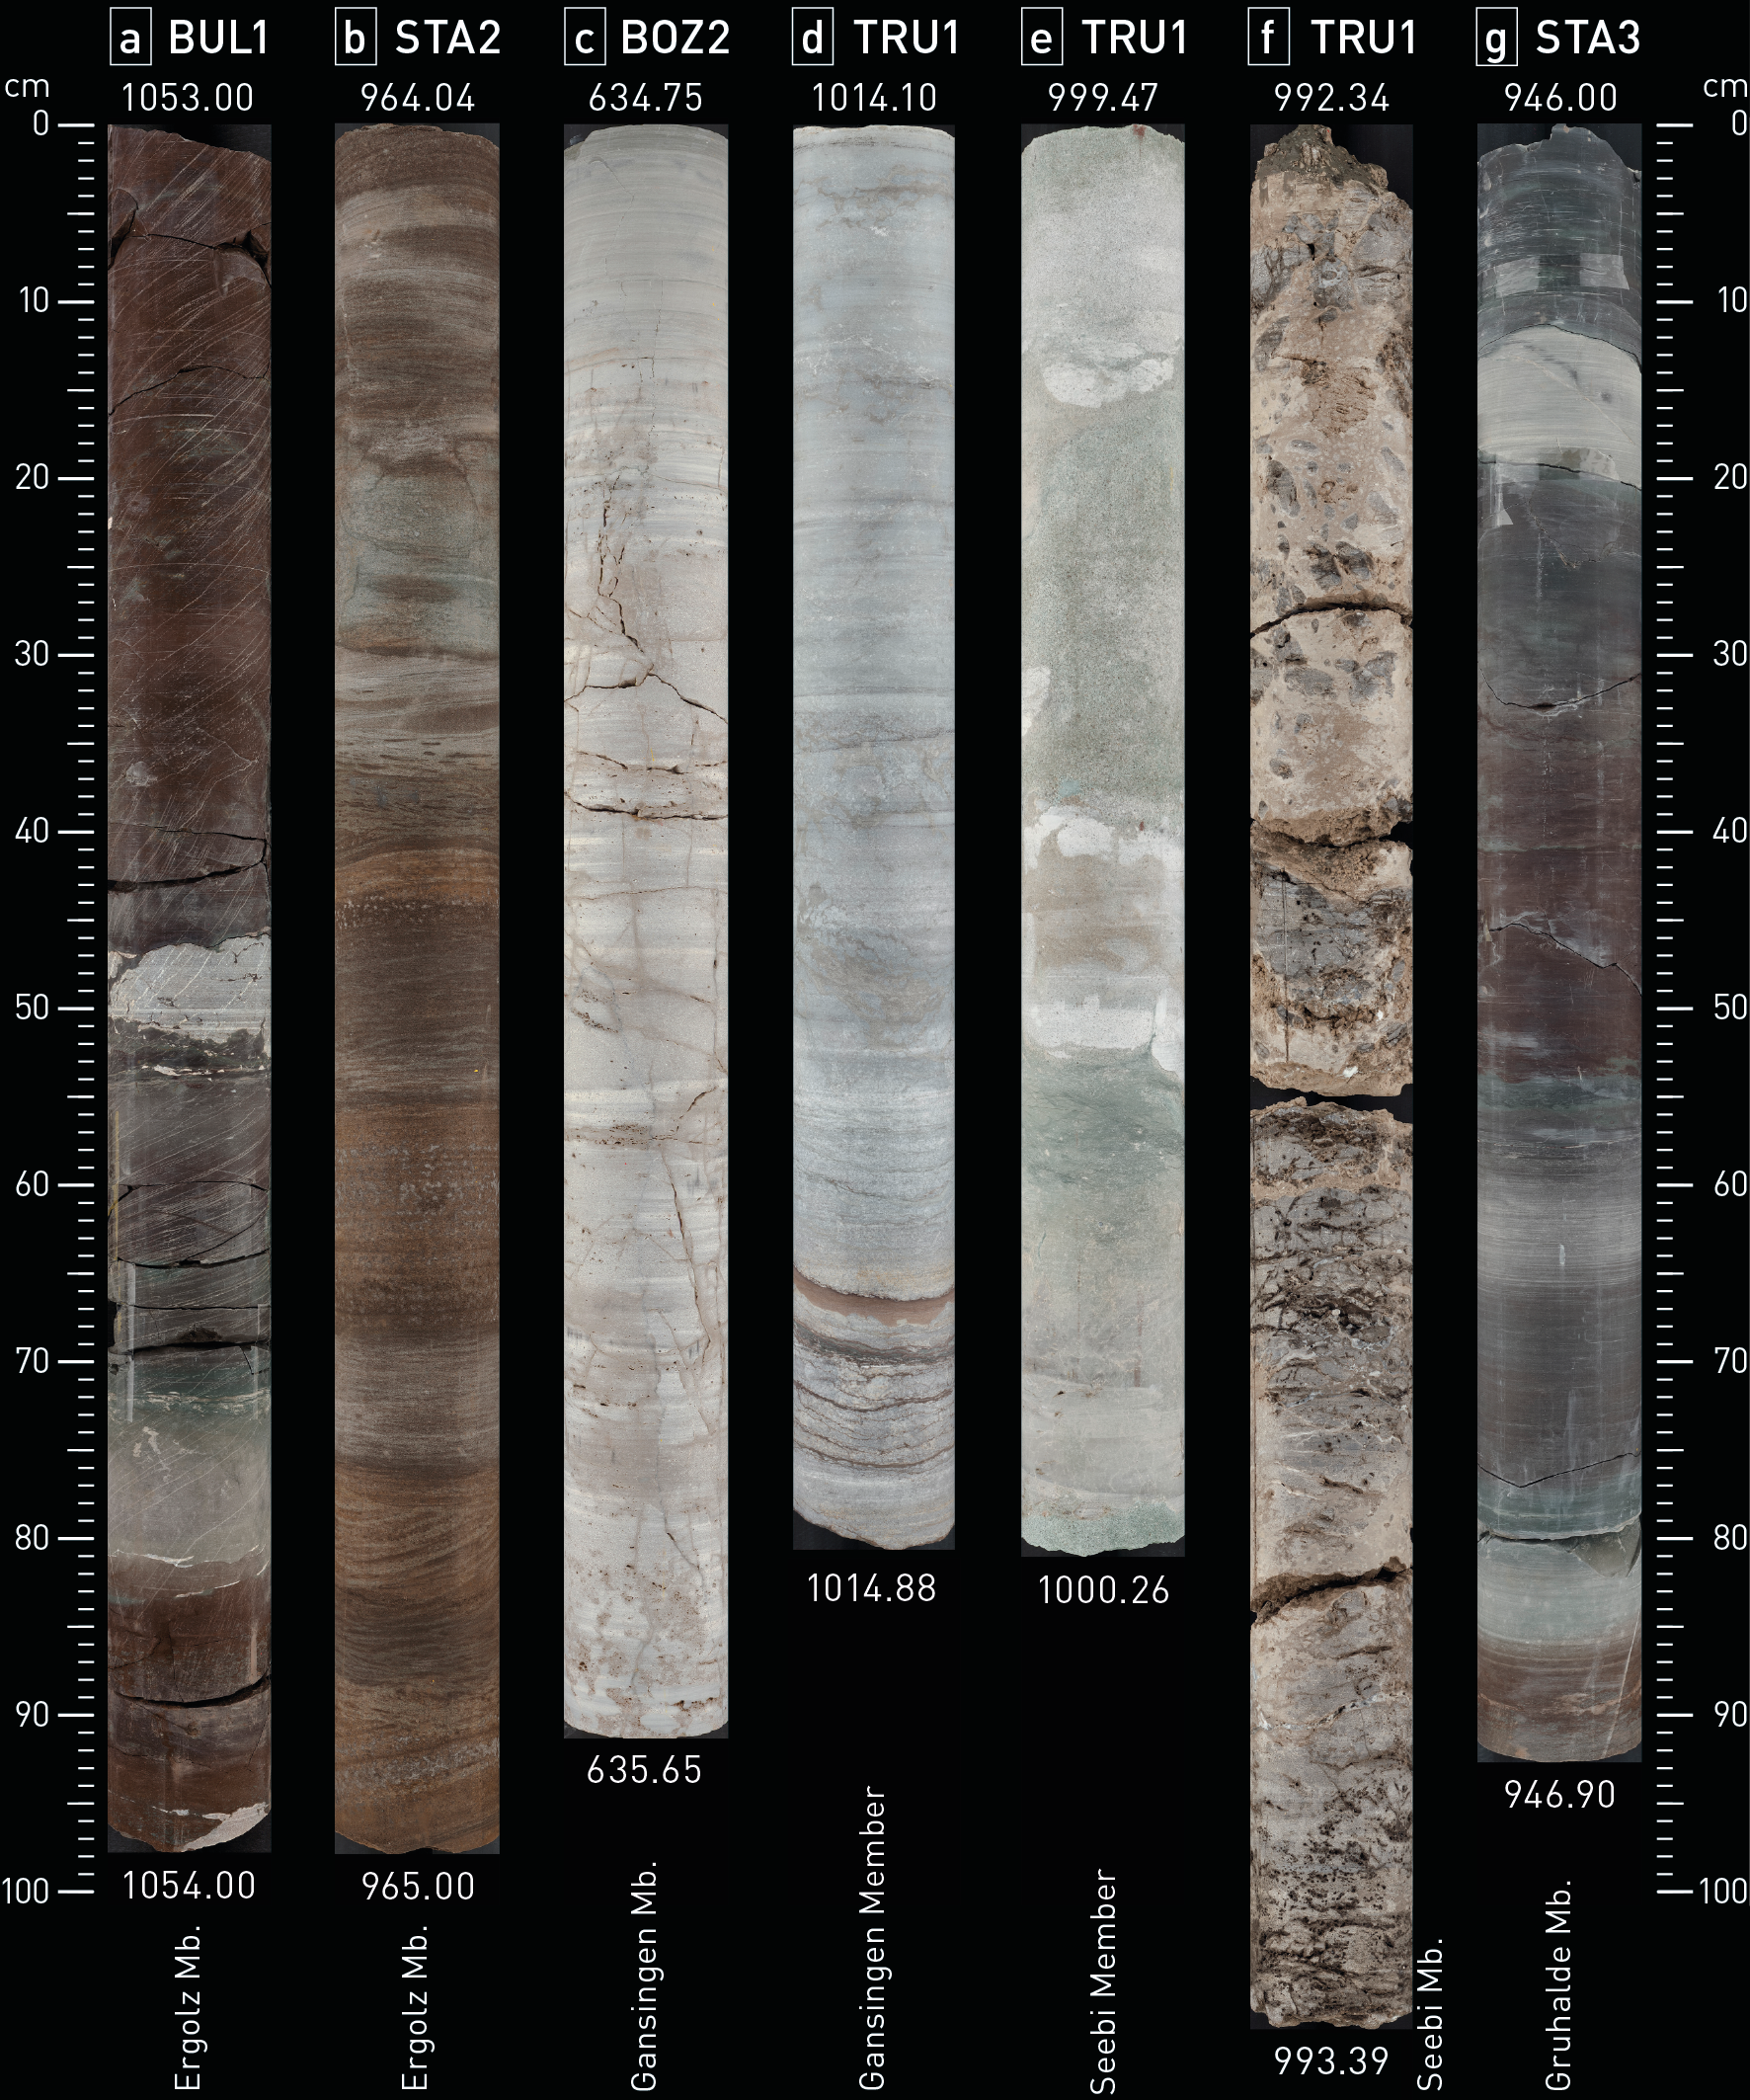
Fig. 4‑16:Selected core photos of the Klettgau Formation
(a) Grey violet, red to grey green dolomitic marl (silty) with light grey pedogenic anhydritic nodules (possibly partly dolomitised); (b) reddish brown to grey sandstone (dolomitic, argillaceous); fine- to medium-grained, with cross-bedding; (c) beige grey dolostone with bivalves, vugs and fracture network; (d) light grey to white anhydrite, laminated to nodular with reddish brown, argillaceous laminae at bottom; (e) light greenish sandstone (dolomitic), medium- to coarse-grained, with very light grey dolocrete nodules; (f) dark grey and pale pink brecciated dolostone, subordinate sandstone and limestone with a texture similar to rauhwacke and frequent vugs; (g) pale green and violet argillaceous marl (dolomitic, silty) with light grey nodules and nodular layers, at base reddish brown argillaceous sandstone.
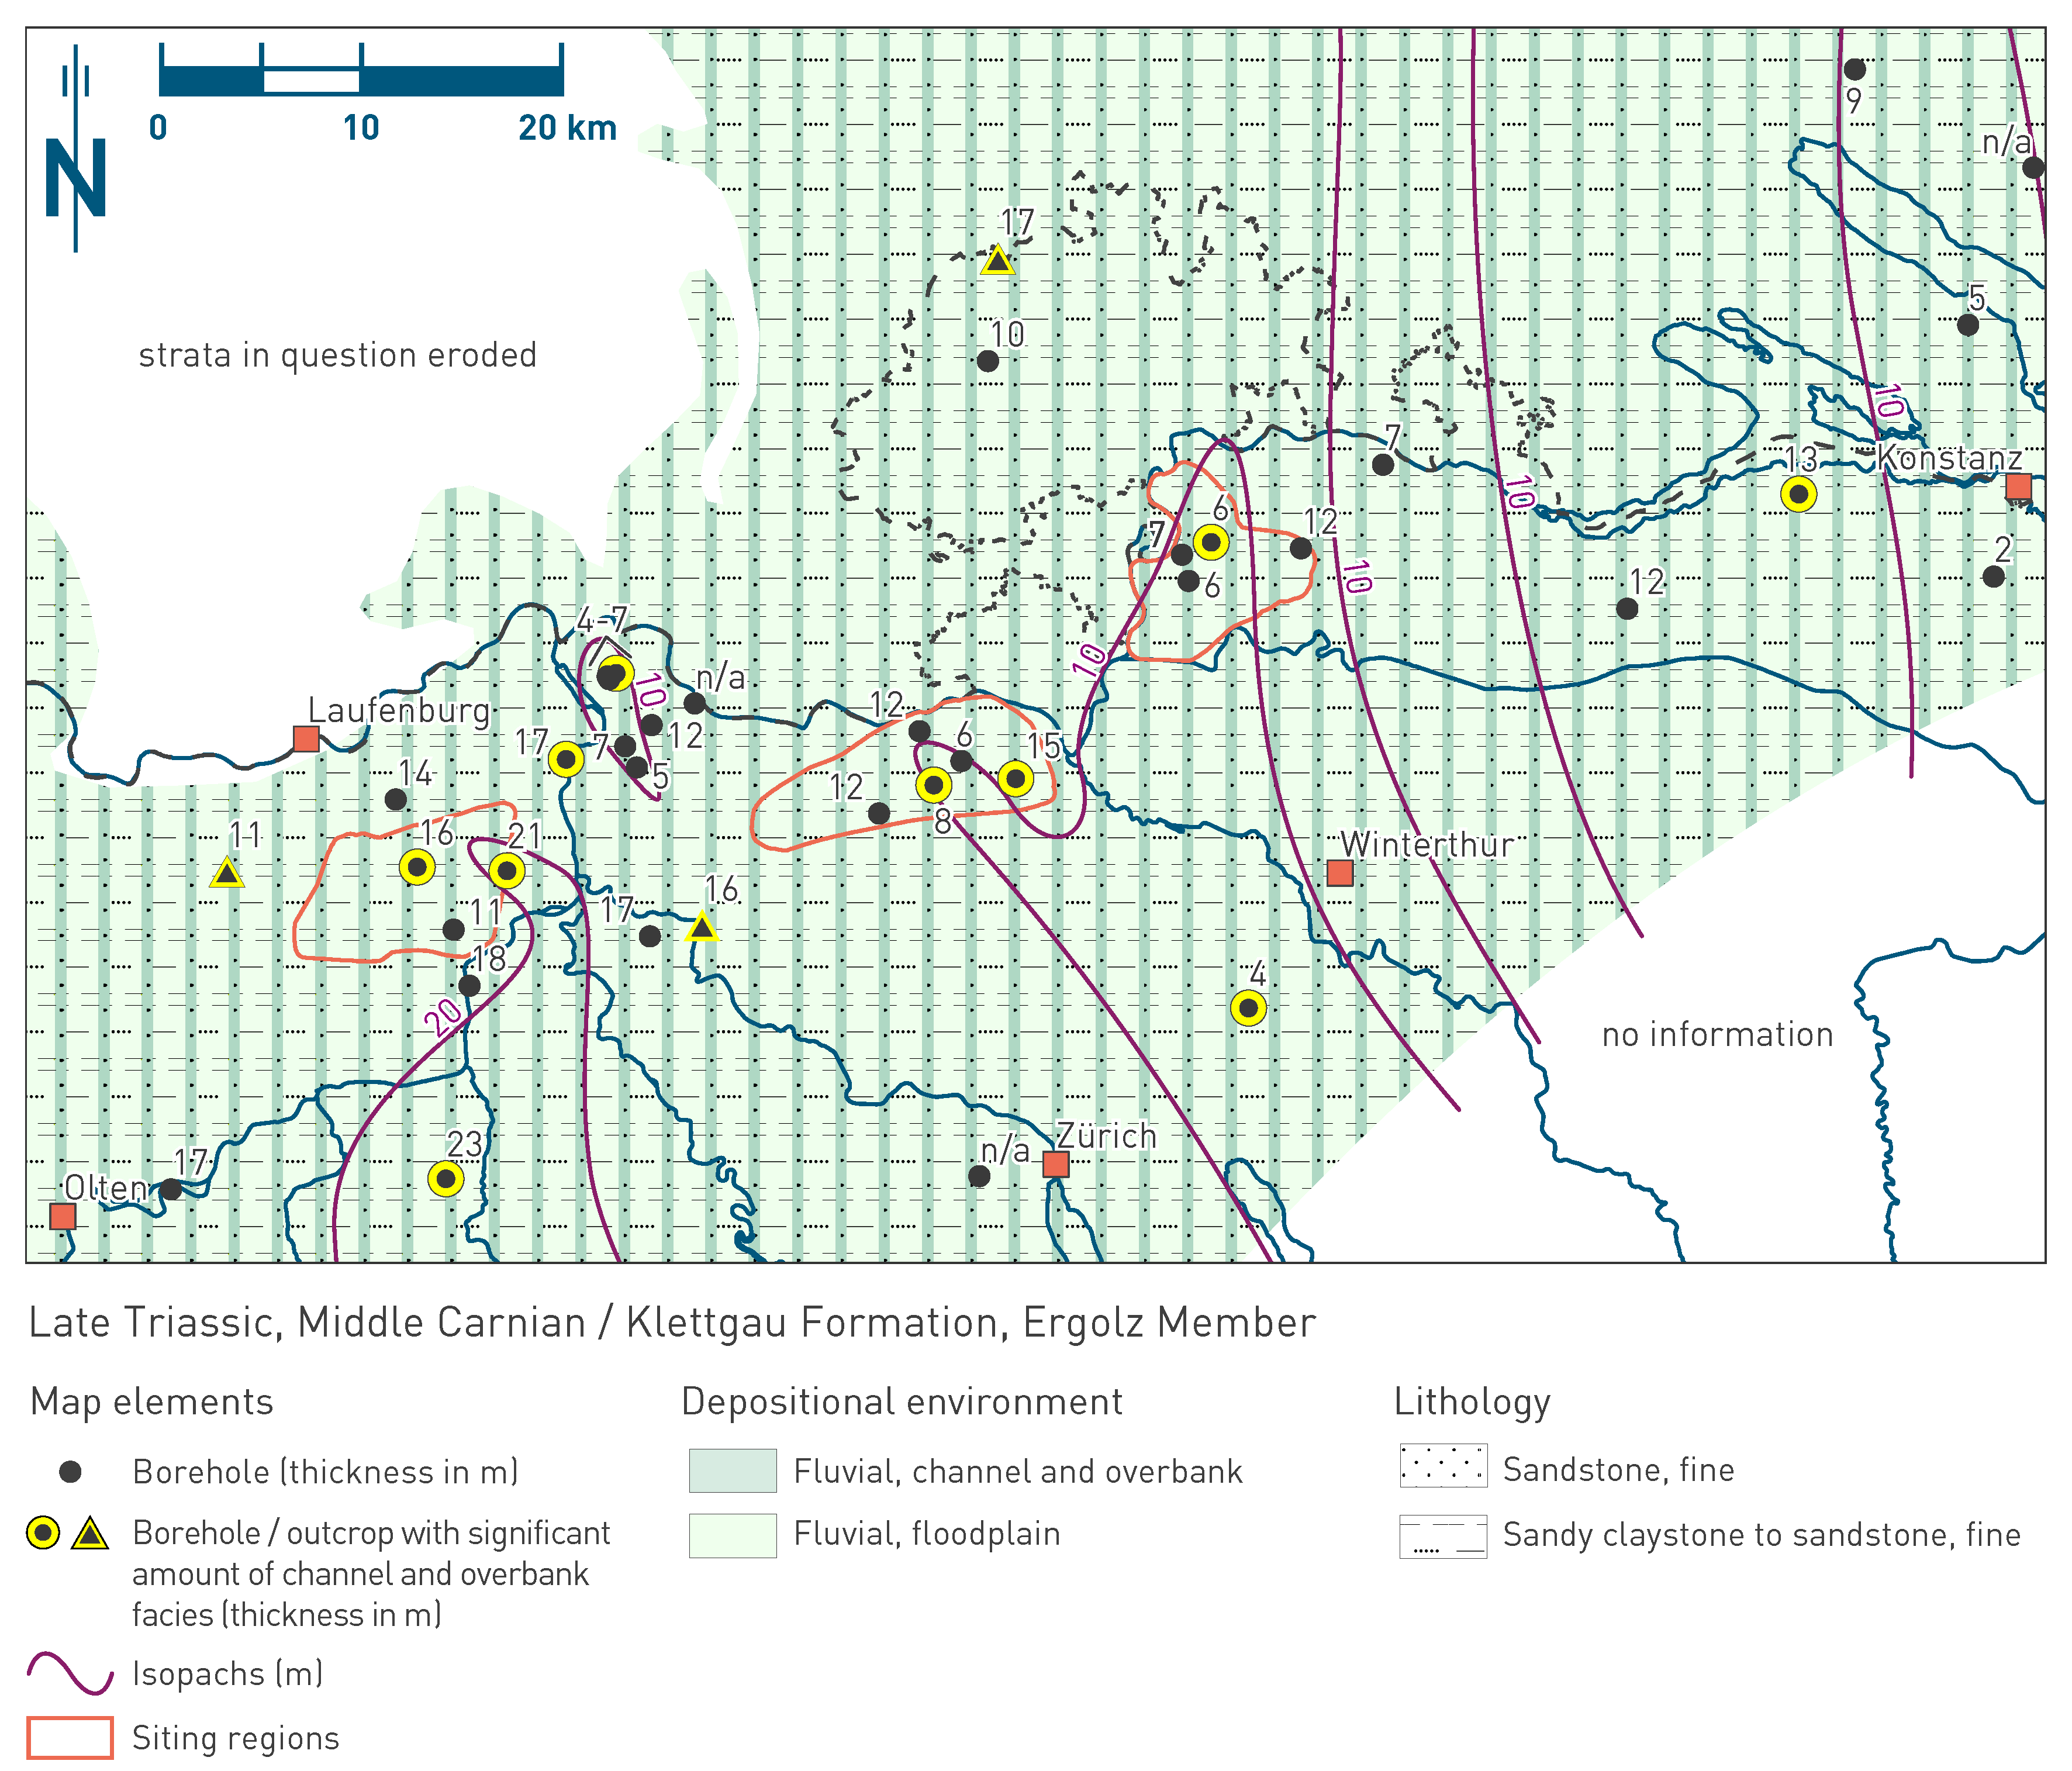
Fig. 4‑17:Map of depositional environments during the Late Triassic (Middle Carnian) preserved in the Ergolz Member of the Klettgau Formation
Refer to Fig. 4‑3 for a schematic representation of depositional environments. The north arrow refers to present-day geographic north.
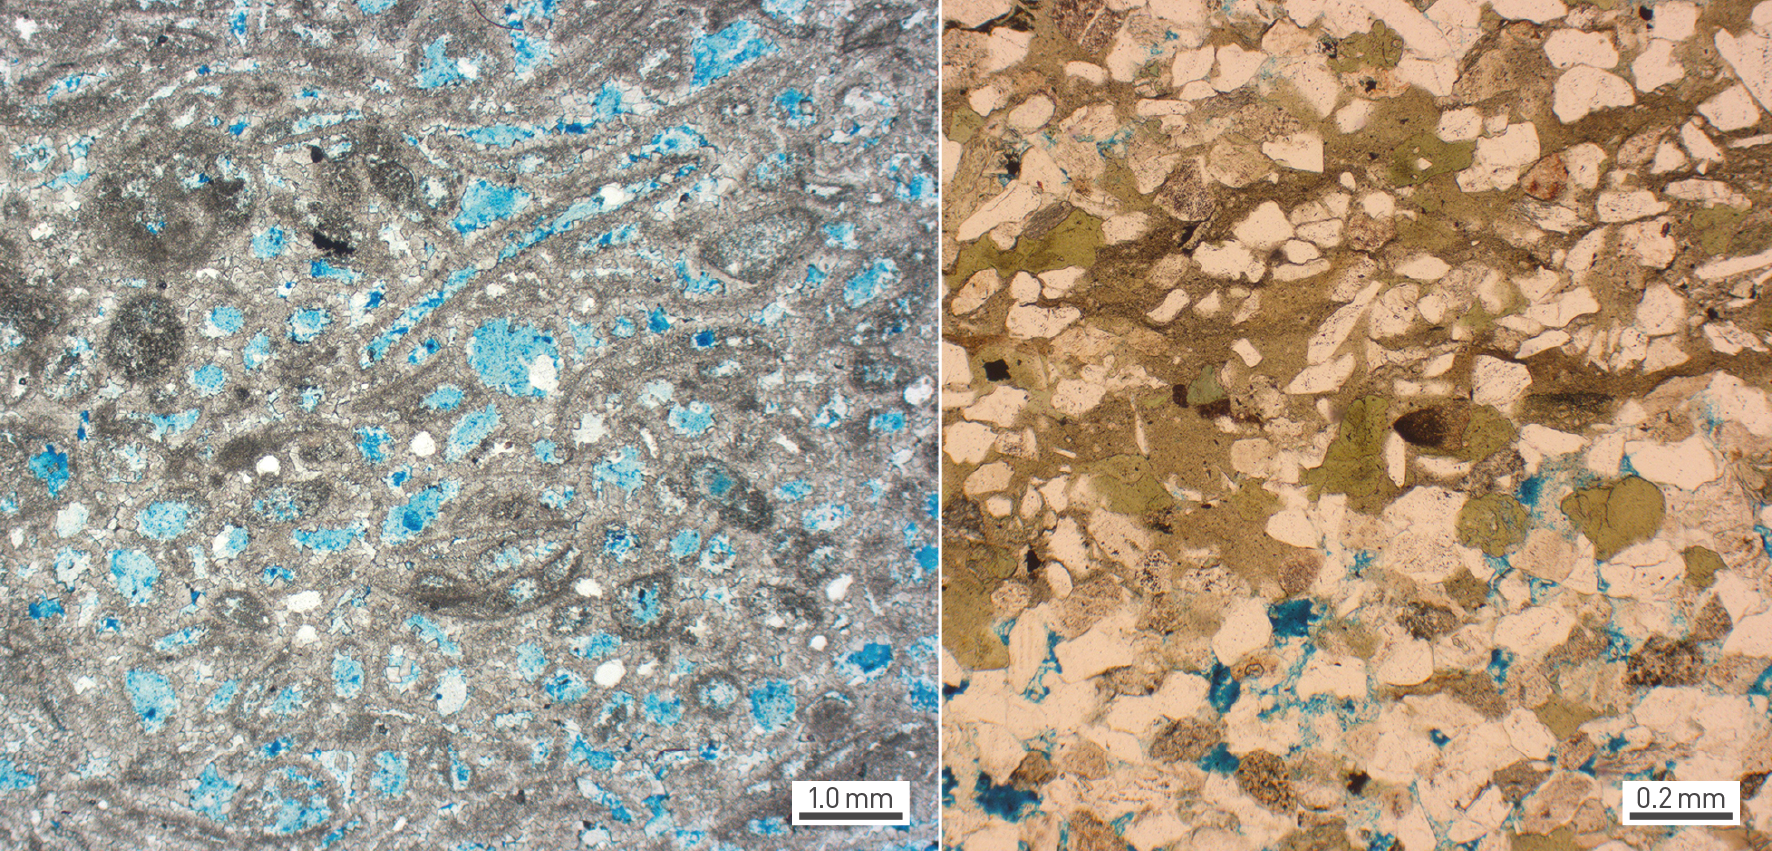
Fig. 4‑18:Microfacies of porous dolostone and sandstone with argillaceous matrix and open pores
Pore space filled with blue coloured glue. Left: Originally bioclastic, oolitic limestone which was dolomitised and leached, leading to open pores (leached ooids and bivalves); example from Gansingen Member, BOZ1-1-706.90 (Nagra (ed.) 2022a, Dossier IV). Right: Sandstone (argillaceous) composed of quartz grains and numerous rock fragments (greenish and brown components), as well as argillaceous matrix and open pores. Example from Ergolz Member, BAC1-1-975.74 (Nagra (ed.) 2023a, Dossier IV).
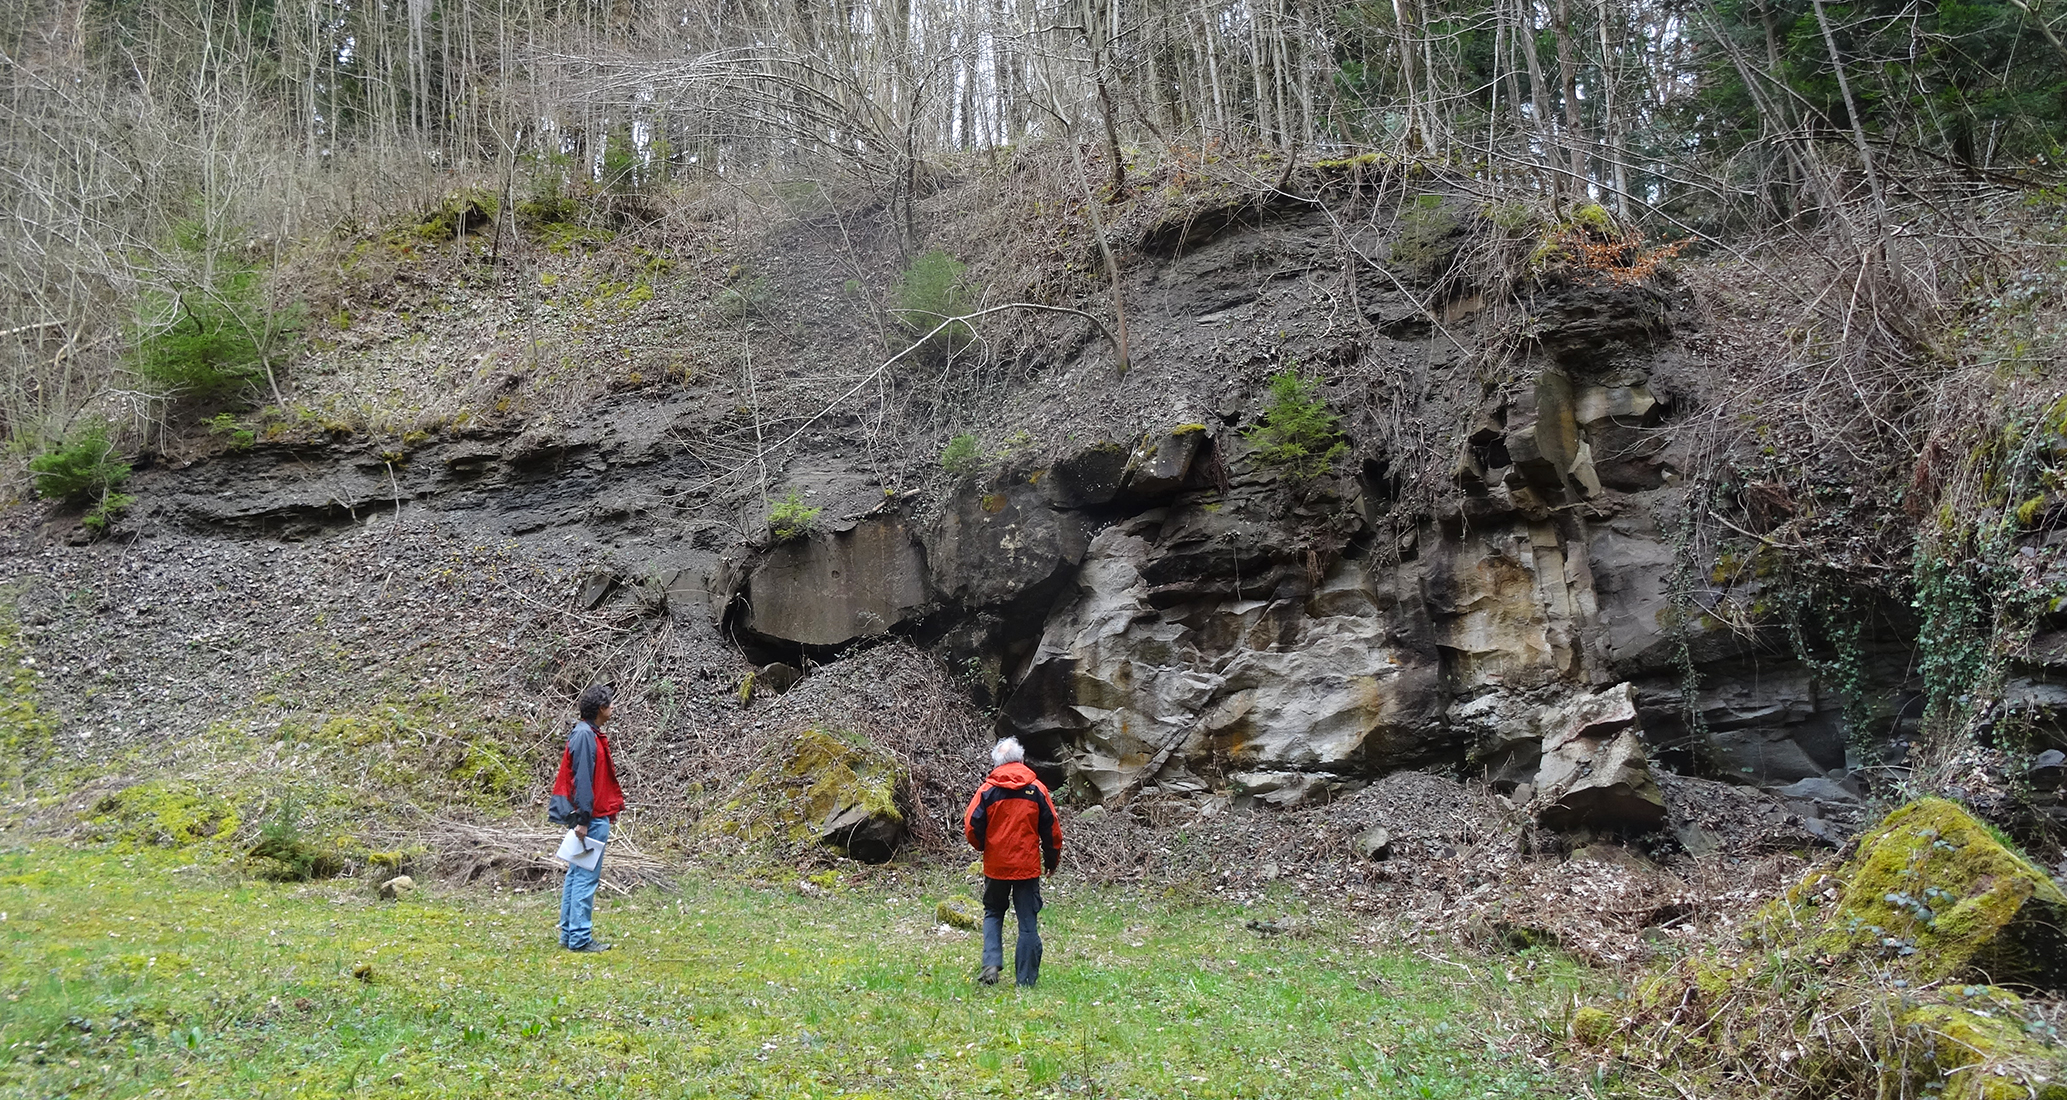
Fig. 4‑19:«Channel facies» intercalated with «floodplain facies» in the Ergolz Member at Steigrabe in Hemmiken
«Channel facies» on the right as weathering-resistant sandstone, «floodplain facies» on the left as non-weathering-resistant dolomitic marl (Jordan et al. 2016a).
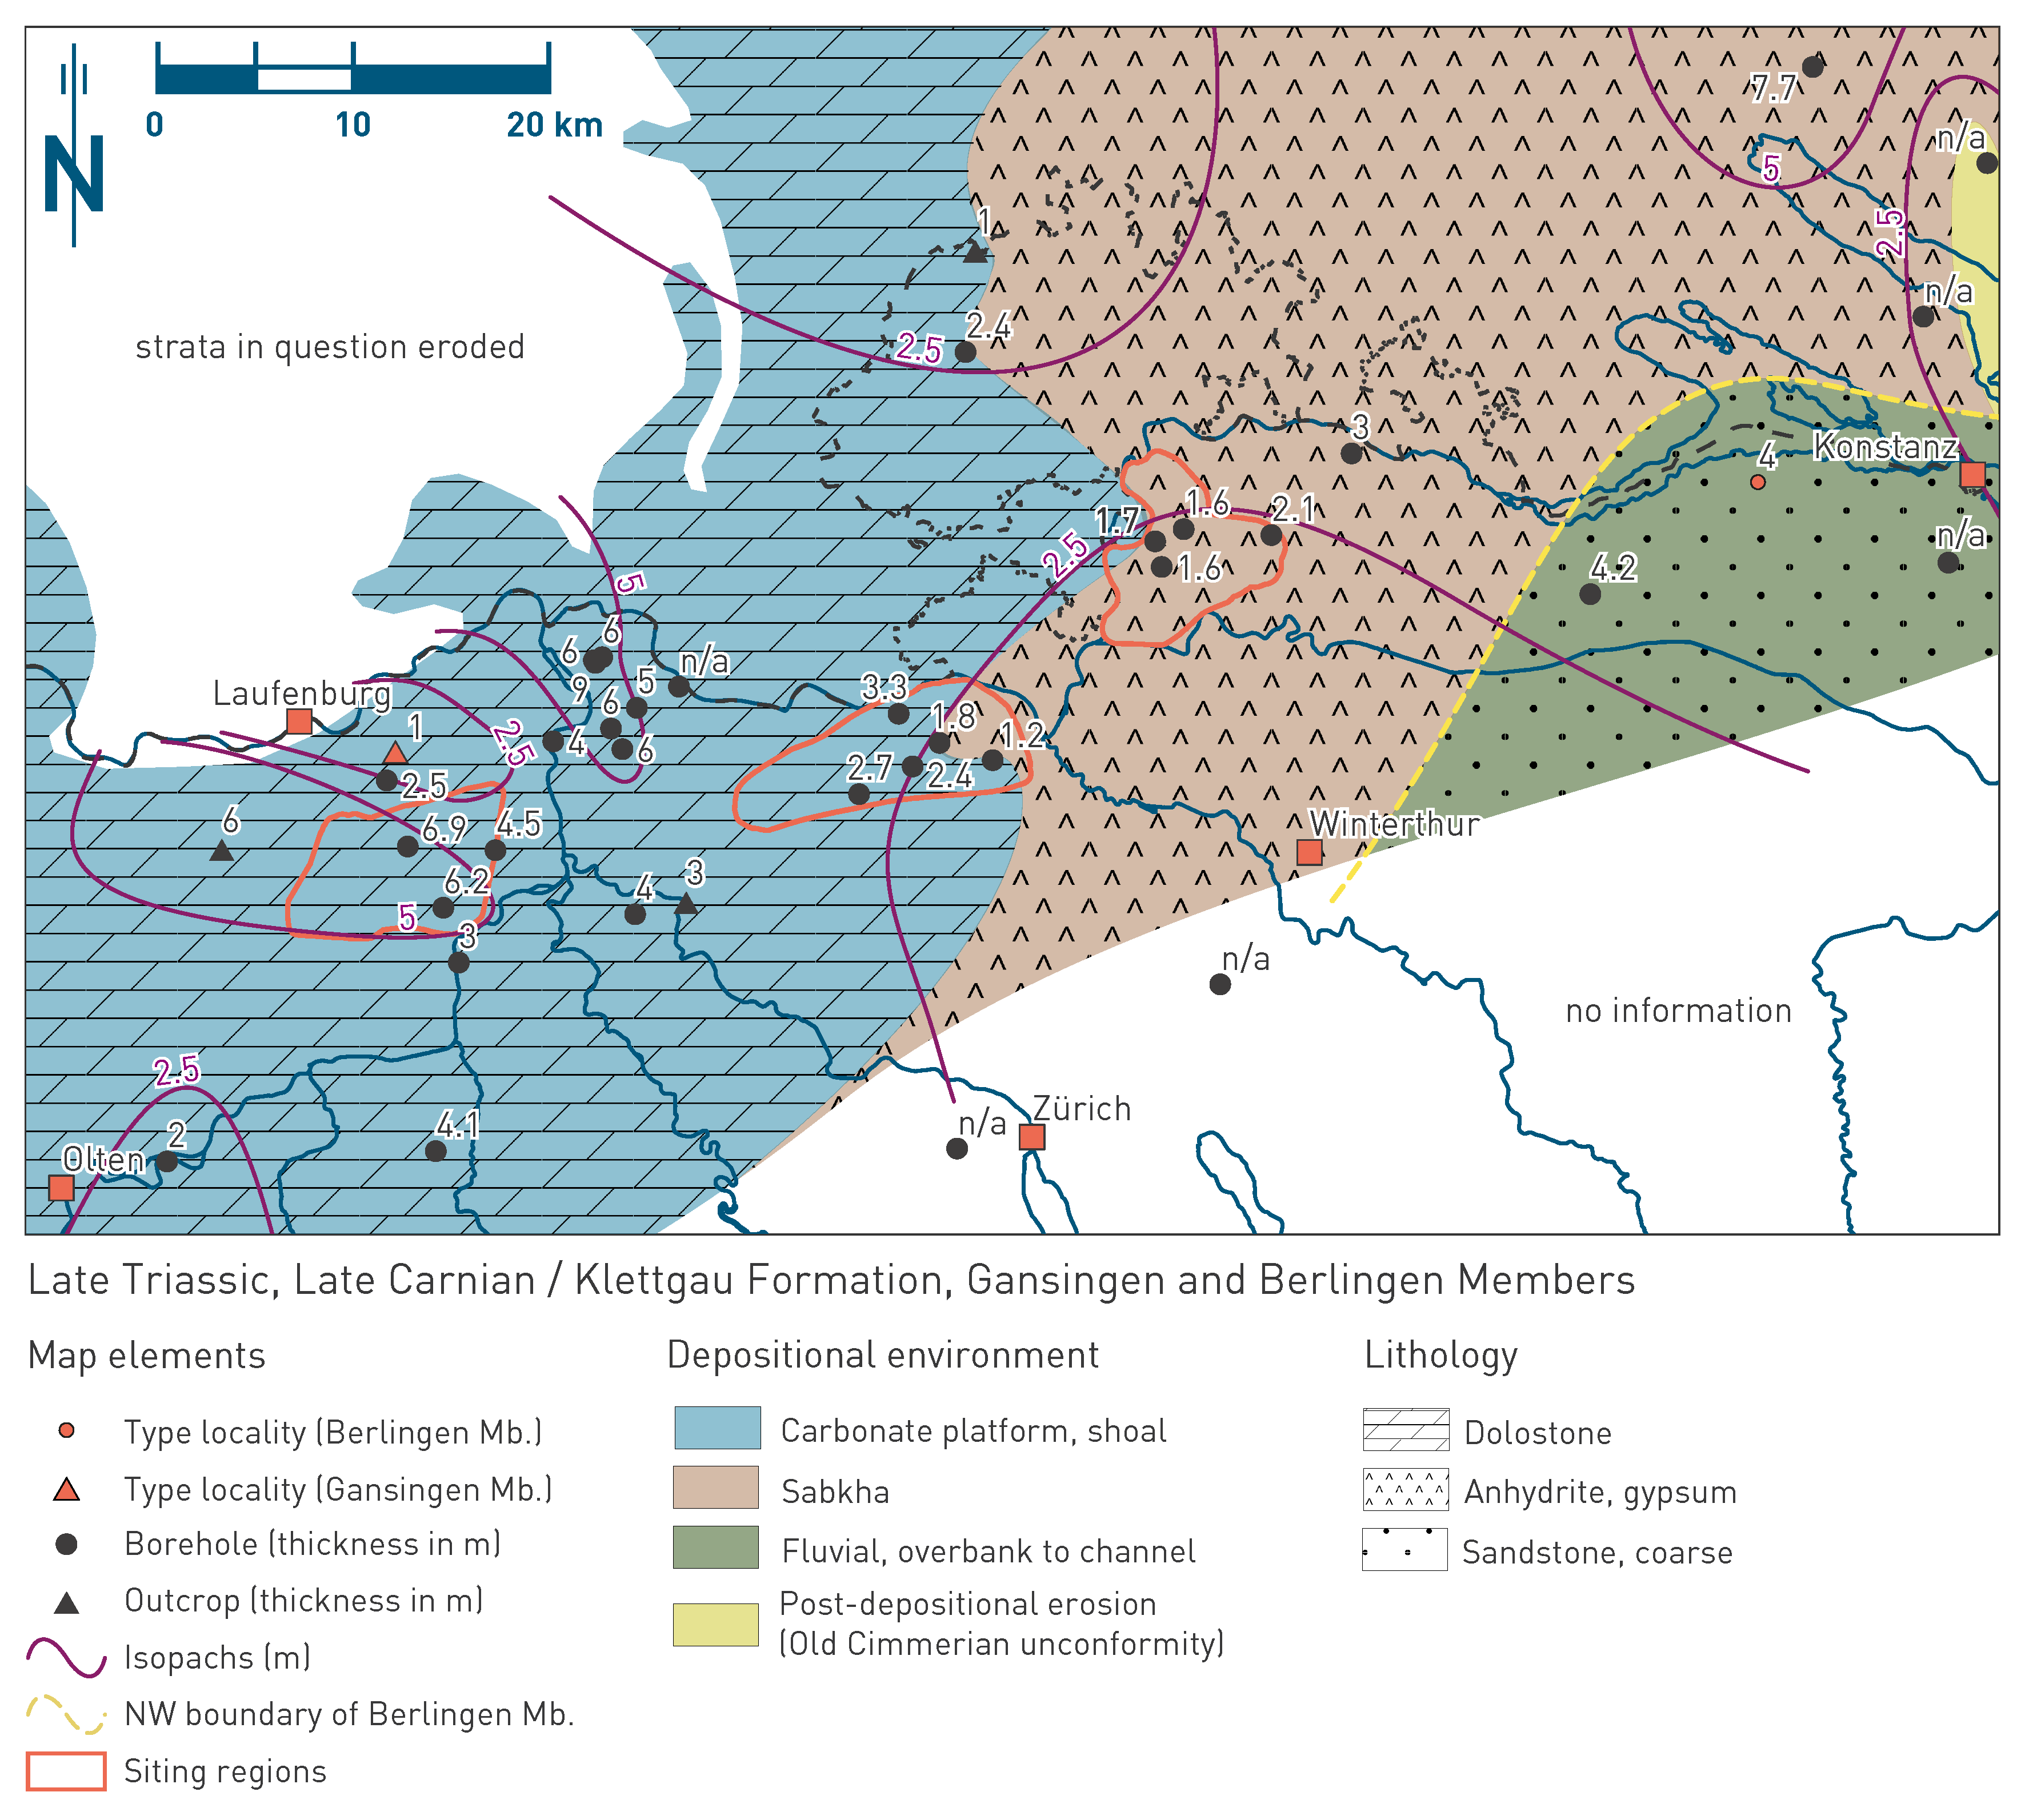
Fig. 4‑20:Map of depositional environments during the Late Triassic (Late Carnian) preserved in the Gansingen and Berlingen Members of the Klettgau Formation
Refer to Fig. 4‑3 for a schematic representation of depositional environments. The north arrow refers to present-day geographic north.
The Klettgau Formation was deposited in the southern part of the Central European Basin. During the long time span (some 30 Myr) from Middle Carnian to end Rhaetian, this basin underwent a very complex evolution resulting in a variety of different facies realms (Fig. 4‑13). They include terrestrial fluvial and playa environments as well as short marine ingressions. Sedimentary provenance also varies throughout the depositional evolution of the formation. At the beginning it was mostly the southern Norwegian Caledonides (Paul et al. 2008), later the Vindelician – Bohemian Massif (Wurster 1968). During the fluvial periods, channel fill sediments as well as overbank and evaporite sediments have been deposited in a vast continental playa under (semi)arid conditions (Fig. 3‑7). The marine ingressions are characterised by up to several metre-scale, partly stromatolitic carbonate layers, anhydrite sabkha sediments and estuarine sandstone. Despite the long period of deposition, the preserved succession is thin. As the deposits are not condensed, it can be assumed that most of the time is represented by gaps in sedimentation. Several erosive phases during deposition can be distinguished that partly resulted in deep incisions into the underlying strata. Even though channel-fill intervals of the Klettgau Formation were associated with very high sedimentation rates, the unit, including the erosive gaps, is characterised by low to very low sedimentation rates (Fig. 4‑4, Fig. 4‑5, Fig. 4‑6). The depositional evolution of the Klettgau Formation is subdivided here into five time intervals:
The first time interval (227_Car_300 to 227_Car_200, Middle Carnian) corresponds approximately to the deposition of dolomitic marls of the Ergolz Member (Fig. 4‑15). These dolomitic marls originated in vast floodplains of a playa system («floodplain facies»), which were intersected by fluvial channels («channel facies»; Fig. 4‑17). The channels reach depths of at least 7 m (STA2). Between these two facies associations, in a channel-proximal position and in overspills sand and silt layers are interbedded with dolomitic marls («overbank facies»). Dolomitic nodules, desiccation cracks, bioturbation and plant root tubes demonstrate relatively stable phases of soil formation and the development of vegetation covers in the floodplain.
The second time interval (227_Car_200 to 227_Car_100, Late Carnian) primarily corresponds to the Gansingen Member and reflects deposition during a transgression from the southwest, from the Burgundy Gate (Jordan et al. 2016b). From west to east, a shallow marine to lagoonal depositional environment existed (mostly carbonate deposition) that transitioned into a sabkha environment (mostly sulphate deposition), which is bordered by a terrestrial proximal fluvial fan (sandstone deposition, Berlingen Member; Fig. 4‑20). This suggests clastic input from the Vindelician – Bohemian Massif. The marine character of the Gansingen Member is also evidenced by the fossil record (Wildi 1976). Locally, the thickness of the Gansingen Member is significantly reduced, and its top is erosive (Jordan et al. 2016a).
The third time interval (227_Car_100 to 208.5_Nor_200, Late Carnian to Norian) corresponds approximately to the deposition of the strata in the lower part of the Gruhalde Member. The prevailing dolomitic marls document a return of a fluvial depositional environment similar to the Ergolz Member. However, at this time the «floodplain facies» were mostly deposited.
The fourth time interval (208.5_Nor_200 to 208.5_Nor_100, Norian) approximately corresponds to the Seebi Member. Proximal fluvial fans reached Northern Switzerland from the northeast and probably from the south (Fig. 3‑7, Fig. 4‑21). The source was the Vindelician – Bohemian Massif in the northeast and probably its promontory, the Alemannic Land, in the south. The influence of these fans is most evident in the lower part of the Seebi Member in ZNO and decreases towards the west; in JO the Seebi Member is < 1 m thick. In the ZNO siting region the sandy facies was superseded by a more dolomitic facies with brecciated dolocretes with vugs representing a playa environment. In NL the Seebi Member is also dominated by a dolomitic facies but without vugs. In the light of this, it is postulated that particularly the eastern sector of ZNO was dominated by
a playa depositional environment in which evaporitic minerals were formed that were subsequently dissolved leading to the formation of vugs. Towards the west less evaporites were formed, which resulted in reduced macroporosity.
The fifth time interval (208.5_Nor_100 to 201.4_Rha_100, Norian up to Rhaetian) approximately corresponds to the deposition of the strata in the upper part of the Gruhalde Member and the thin Belchen Member, where it survived later erosion. During this time period, mostly dolomitic and argillaceous marls were deposited in floodplains («floodplain facies»), which formed the habitat for plateosaurs (Hofmann & Sander 2014). This terrestrial depositional environment was terminated by a transgression during the Rhaetian (e.g. Schneebeli-Hermann et al. 2018). The sedimentary rocks of the Belchen Member were deposited in an estuarine to shallow marine depositional environment (Looser et al. 2018). Finally, the top of the Klettgau Formation constitutes a major erosive unconformity.
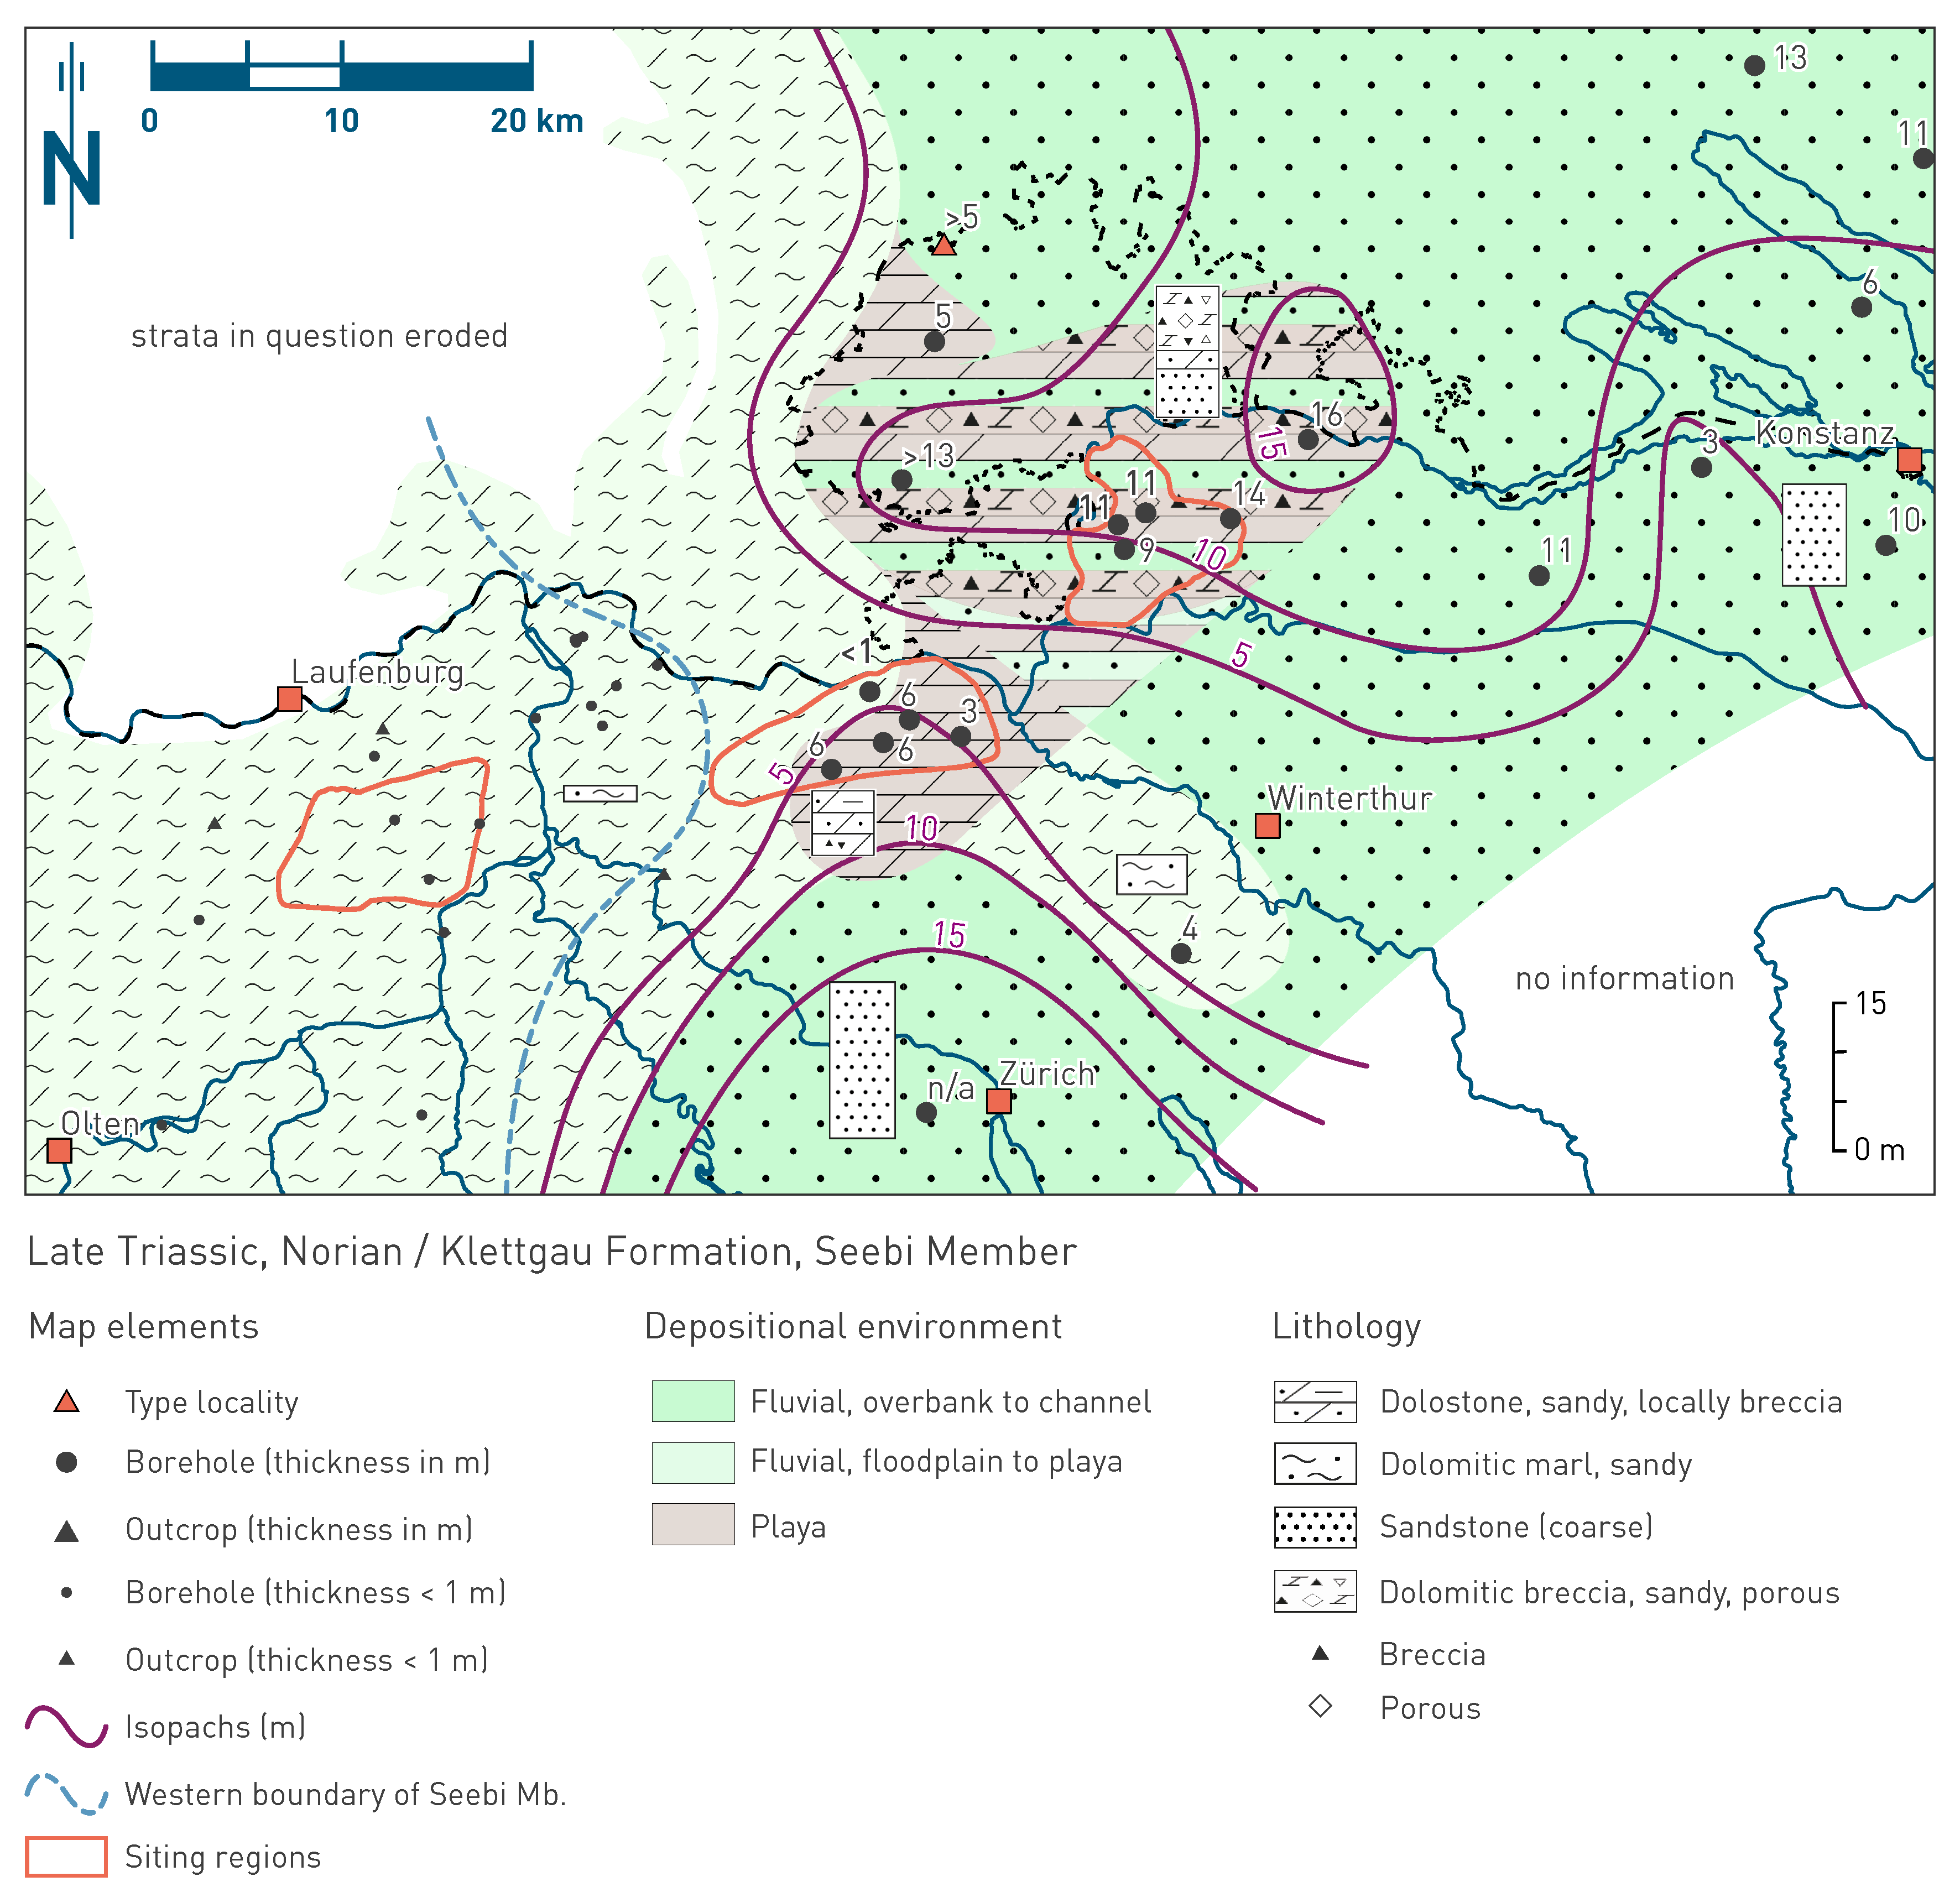
Fig. 4‑21:Map of depositional environments during the Late Triassic (Norian) preserved in the Seebi Member of the Klettgau Formation and its western equivalent (part of the Gruhalde Member of the Klettgau Formation)
Refer to Fig. 4‑3 for a schematic representation of depositional environments. The north arrow refers to present-day geographic north.
The Early Jurassic Staffelegg Formation immediately underlies the Opalinus Clay and is therefore the uppermost stratigraphic element of the lower confining units (Section 4.5.3.9). It corresponds in Northern Switzerland to the Lias Group. The Jurassic was characterised by continued N-S-directed extension during the opening of the Piemont – Liguria Ocean (Chapter 3). The study area was located in a shallow marine epicontinental sea.
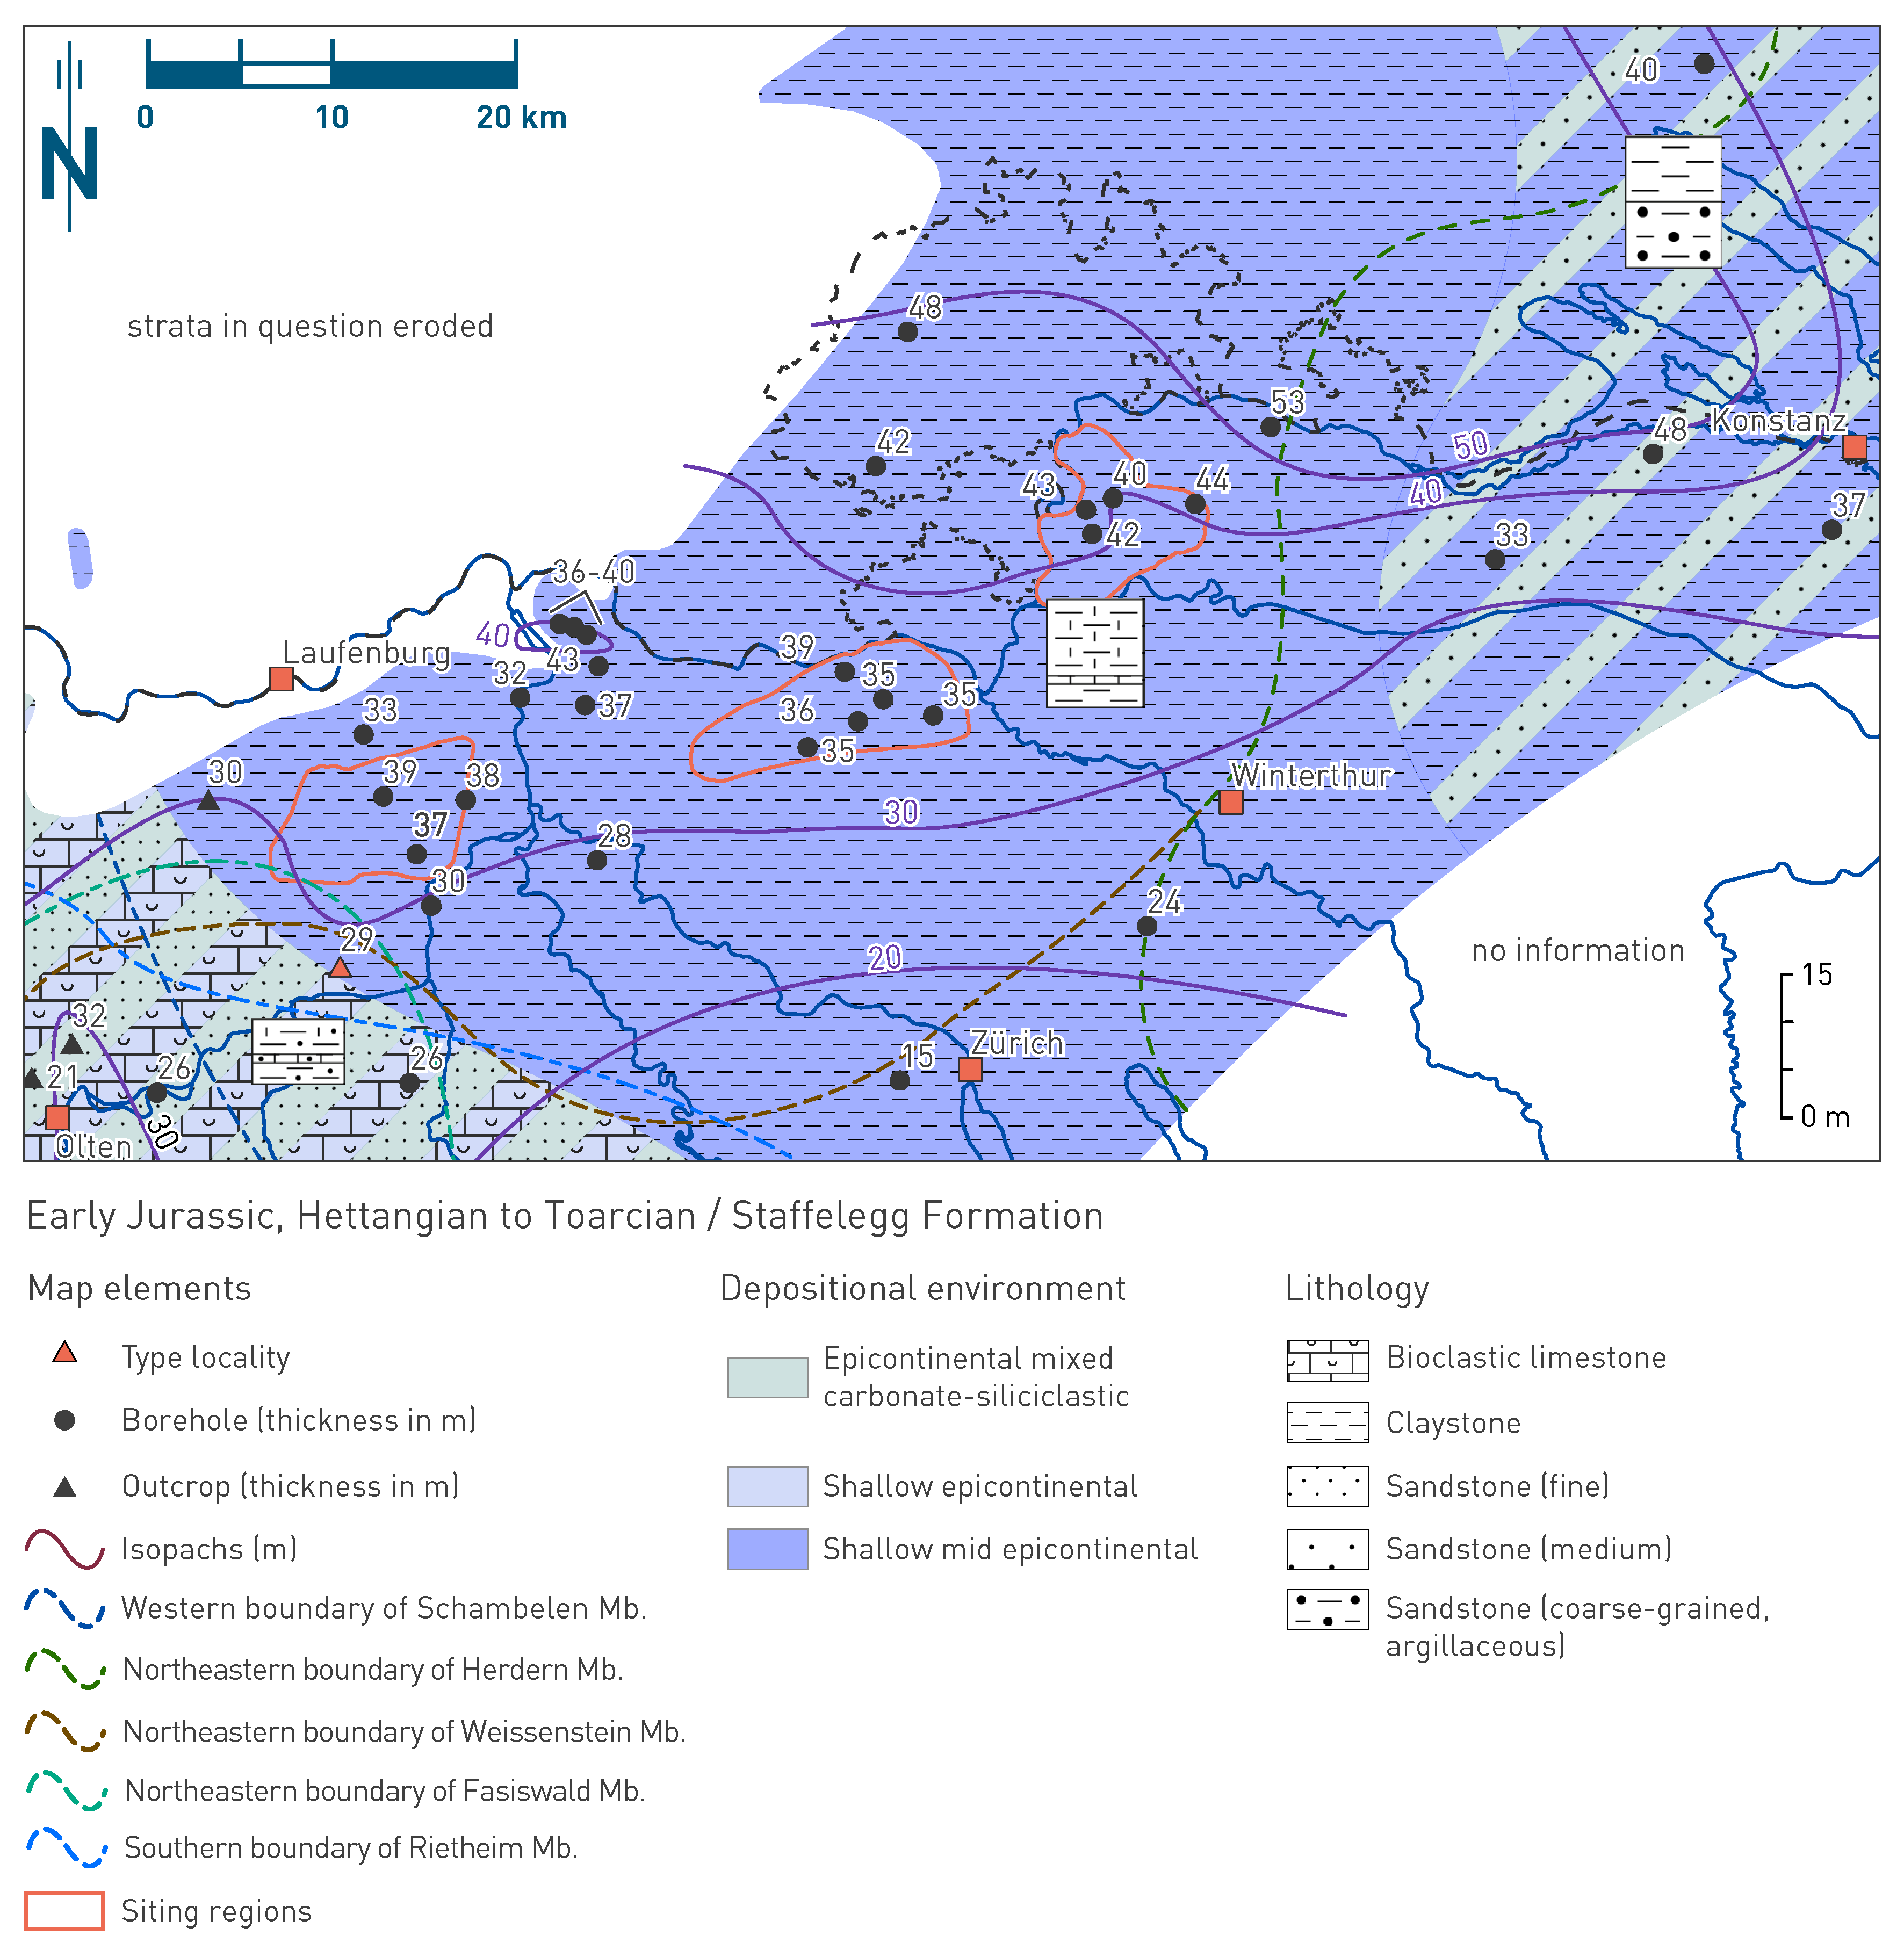
Fig. 4‑22:Map of depositional environments during the Early Jurassic (Hettangian to Toarcian) preserved in the Staffelegg Formation
Refer to Fig. 4‑3 for a schematic representation of depositional environments. The north arrow refers to present-day geographic north.
The Staffelegg Formation exists in all the siting regions, with generally similar characteristics and a thickness that reaches 35 to 45 m (Fig. 4‑22). It consists mostly of claystone, siltstone and marl (Fig. 4‑23), but it also comprises limestone and iron-oolite (Fig. 4‑24). The Staffelegg Formation can be separated into eight members in the three siting regions (Reisdorf et al. 2011, Kiefer et al. 2015):
Schambelen Member (former «Insektenmergel», «Psiloceras-Schichten»): The lowermost unit of the Staffelegg Formation is the Schambelen Member (Fig. 4‑24a). Its thickness varies between ca. 5 and 10 m. It is dominated by sandy/silty claystone (partly bituminous) and siltstone, also fossiliferous marl (mainly bivalves) occurs. These strata are intercalated with dm-thick limestone beds, partly in the form of hardgrounds.
Beggingen Member (former «Arietenkalk» and «Angulatenschichten»): This unit has a thickness of ca. 3 to 4 m (Fig. 4‑26) and is dominated by fossiliferous limestone (partly iron-oolitic, limonitic and phosphatic) with interbeds of claystone and argillaceous marl (Fig. 4‑24b & c). Various surfaces with borings and/or hardgrounds can be identified. In outcrops such as at the clay pit of Frick Gruhalde Fig. 4‑25) cross-bedded limestone occurs, which is generally bioturbated (Reisdorf et al. 2011). A lower limestone succession with iron-oolitic interbeds and an upper limestone succession with abundant ammonites and Gryphaea oysters separated by a clay-mineral-rich interval are generally expected. However, this succession is not equally well developed in all boreholes across the siting regions.
Frick Member (former «Obtusus-Ton»): This unit has a thickness between ca. 11 and 16 m and is characterised by monotonous argillaceous siltstone and silty claystone (Fig. 4‑24d); macrofossils are rare.
Grünschholz (former «Obliqua-Schichten»), Breitenmatt (former «Numismalis-Schichten») and Rickenbach Members (former «Amaltheen-Schichten») (from bottom to top): These three units represent highly condensed intervals (Fig. 4‑24e). They are often described as one informal stratigraphic unit, as the unambiguous recognition of the three members is difficult. In some boreholes the lowermost Grünschholz Member was identified based on the presence of Gryphaea obliqua and its nodular look. The three members reach a total thickness between ca. 2 and 5 m. They are characterised by a fossiliferous (predominantly belemnites) succession of limestone, calcareous and argillaceous marl (all glauconitic) with nodules of phosphorite, siderite and pyrite. Bored surfaces and/or hardgrounds are common.
Rietheim Member (former «Posidonienschiefer»): This unit has a thickness between ca. 4 and 10 m. Its lower part is characterised by laminated bituminous shale with fossiliferous horizons (e.g. bivalves) and distinct cm- to dm-scale, partly laminated and bituminous limestone beds (e.g. «Unterer Stein»; Fig. 4‑24f). The upper part is characterised by argillaceous to calcareous marl which is still rich in organic matter.
Gross Wolf Member (former «Jurensis-Mergel»): This unit has a thickness of ca. 3 to 7 m and is dominated by silty to sandy argillaceous to calcareous marl, and decimetre-scale nodular interbeds of fossiliferous limestone (mostly belemnites) (Fig. 4‑24g).
To the west and east of the three siting regions, more sandy intercalations occur in the Staffelegg Formation, such as in the Weissenstein and Herdern Members (Fig. 4‑26). These members were not identified in the boreholes within the siting regions.
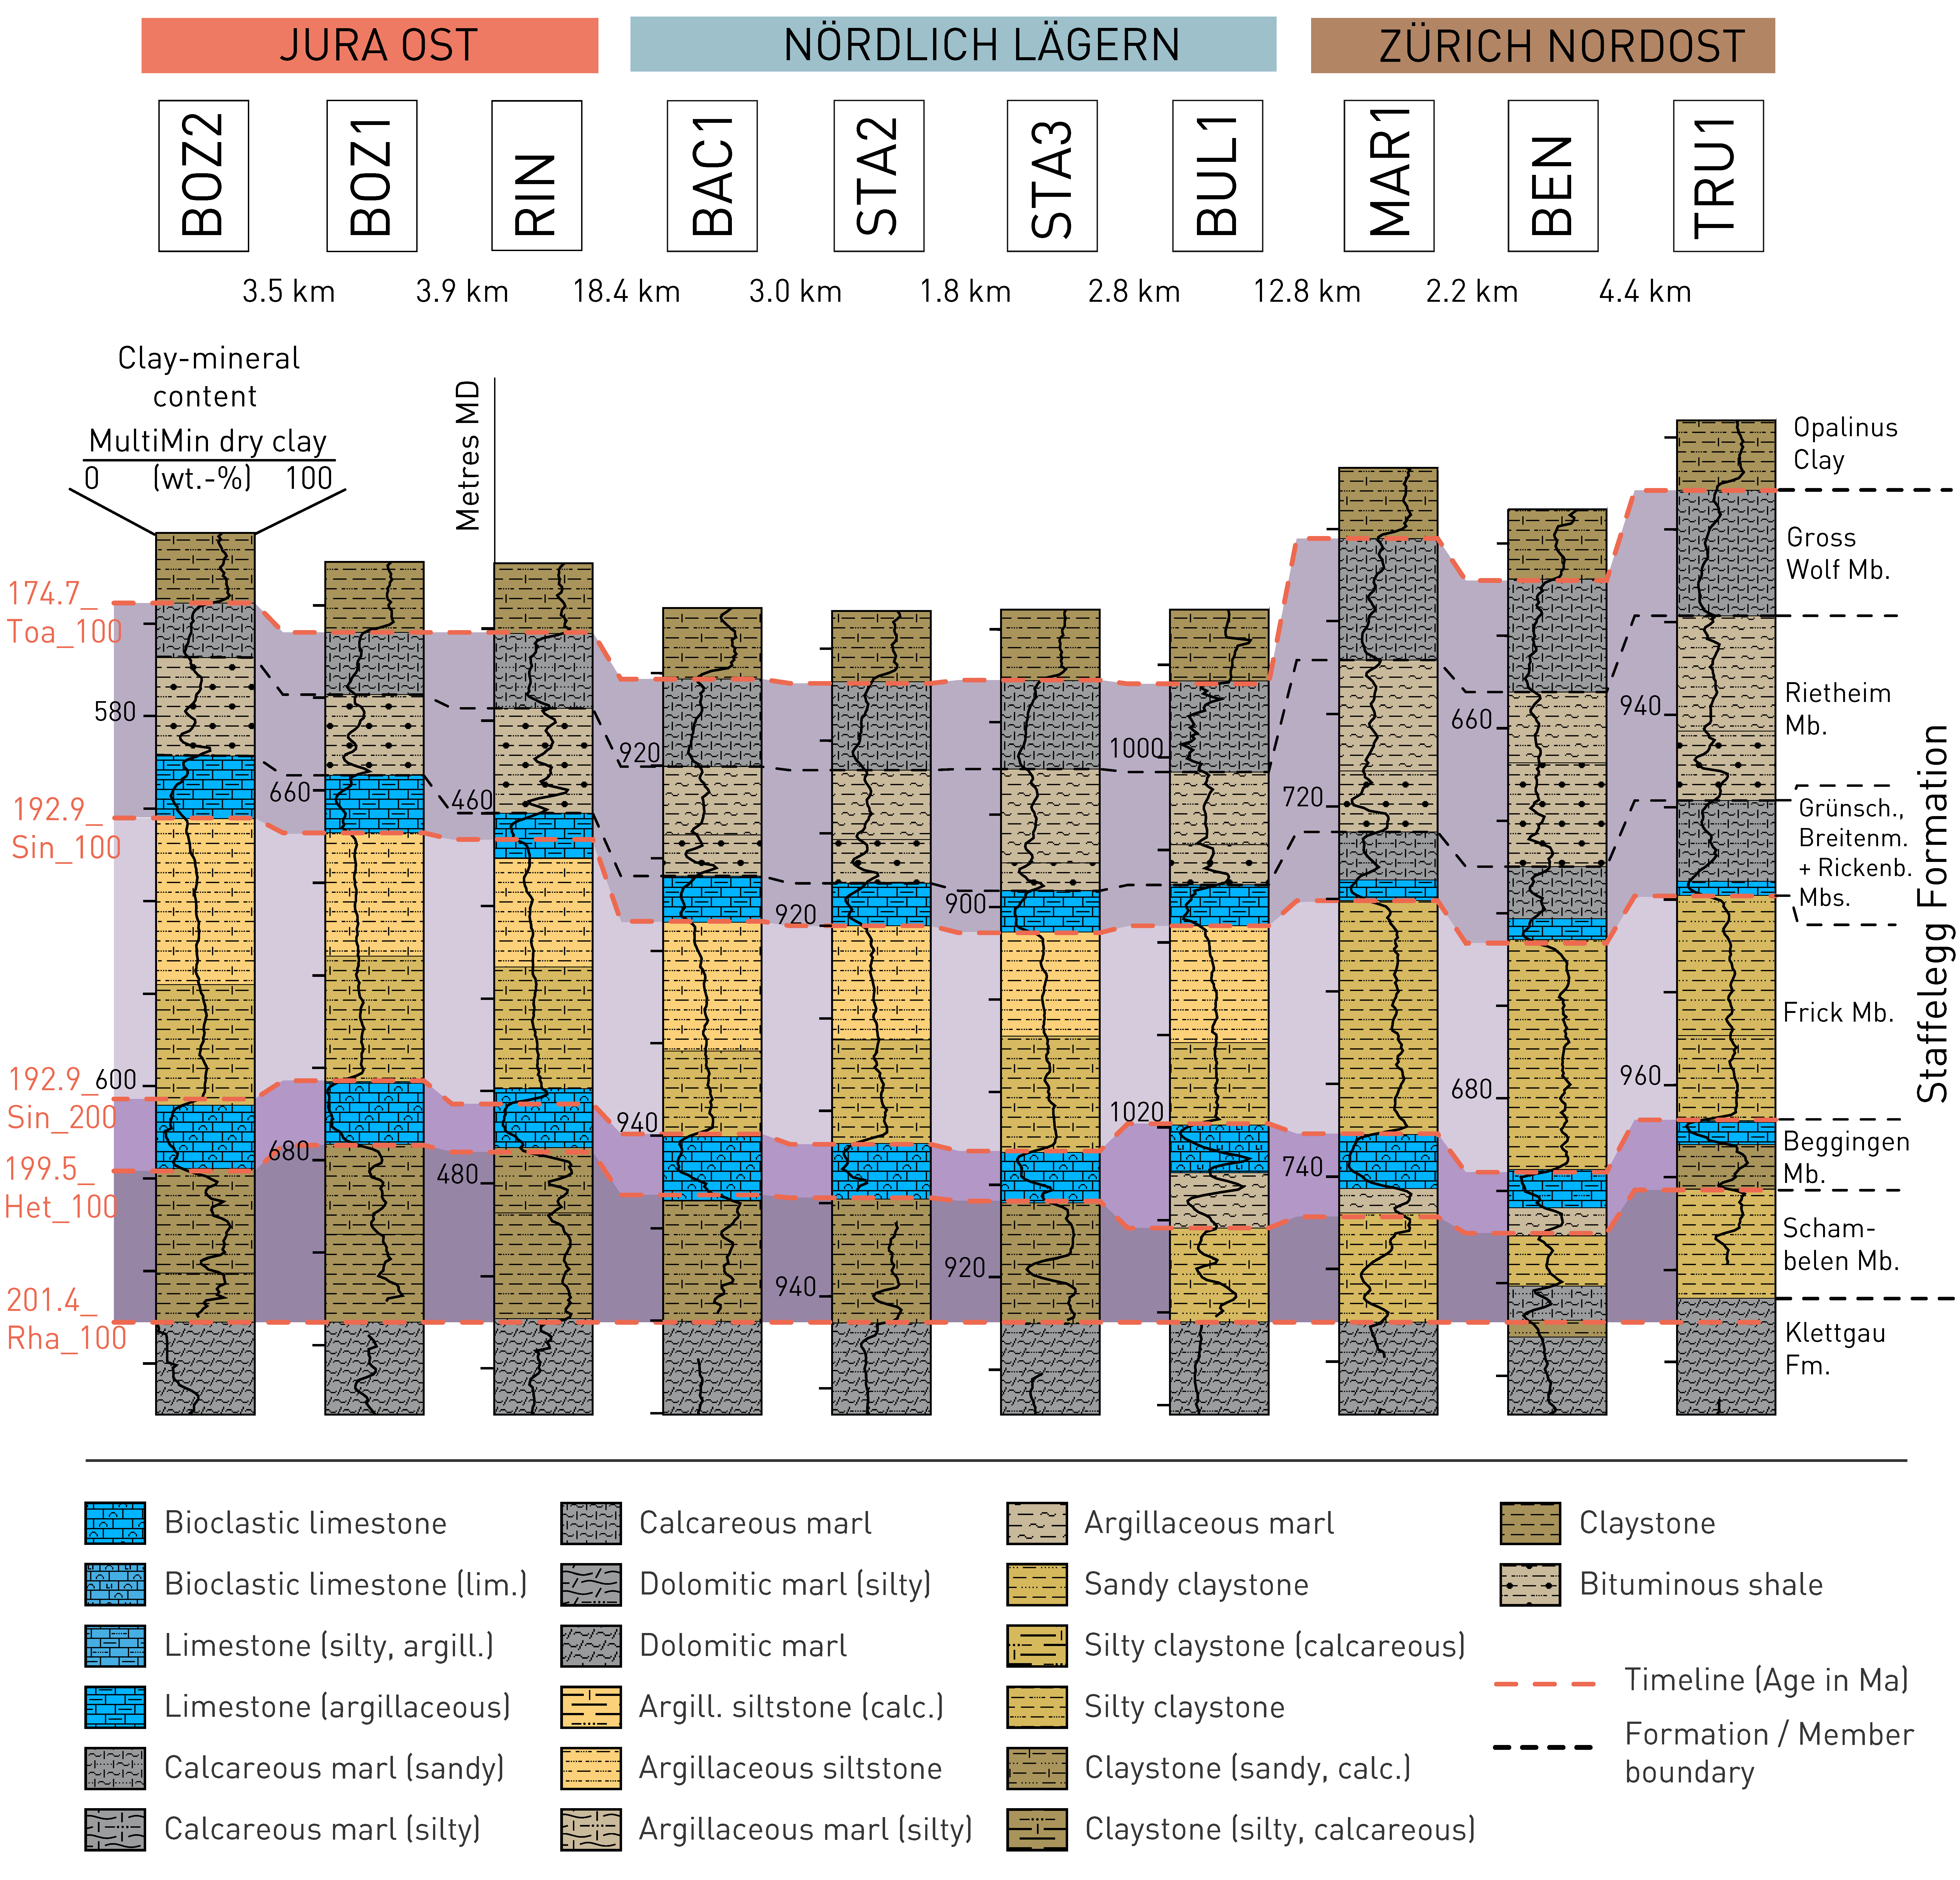
Fig. 4‑23:Stratigraphic borehole correlation of the Staffelegg Formation
For lithological nomenclature refer to Naef et al. (2019). Clay-mineral content after Becker & Marnat (2024). Some of the boundaries and lithologies as discussed in the original reports were adjusted to integrate all presented borehole data.
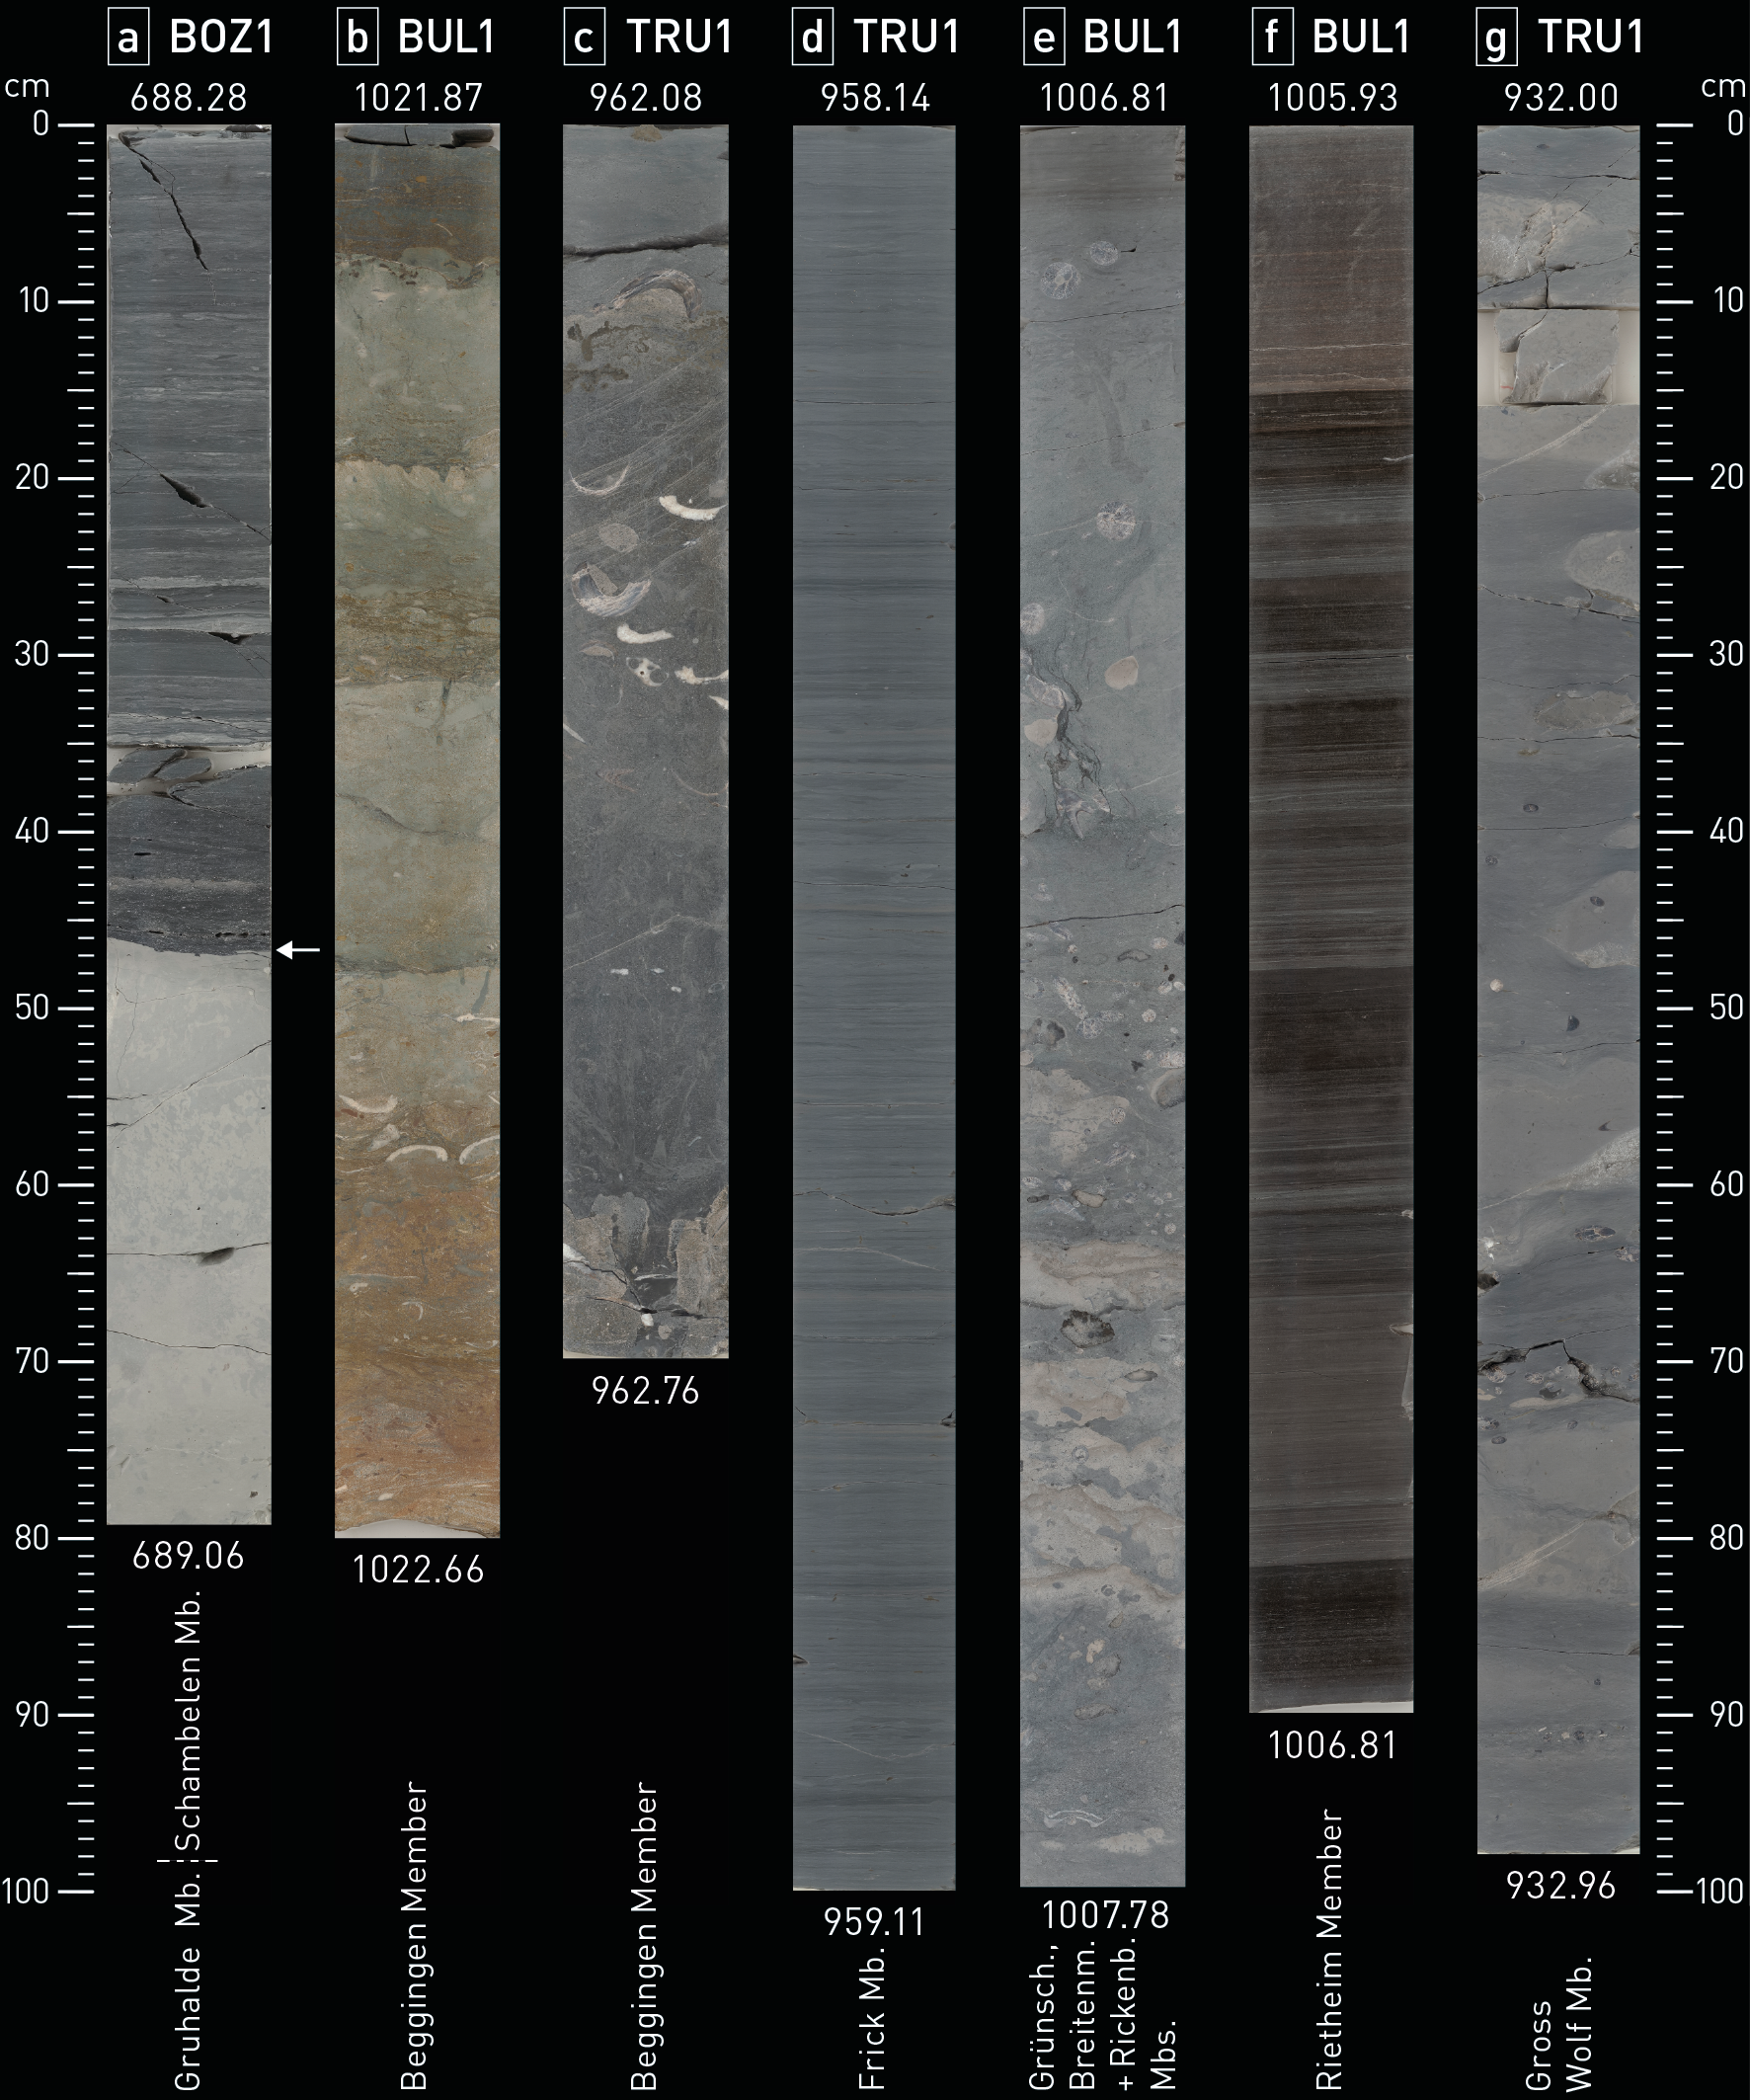
Fig. 4‑24:Selected core photos of the Staffelegg Formation (slabbed cores)
(a) Triassic/Jurassic discontinuity with change from terrestrial, light grey, dolomitic marl to marine, dark claystone with silty layers; (b) grey to ochre brown limestone (iron-oolitic), fossiliferous with various bored hardgrounds; (c) grey bioclastic limestone (partly argillaceous), fossiliferous, phosphatic concretions and two hardgrounds (962.19 m and 962.67 m); (d) grey, laminated silty claystone (calcareous); (e) grey limestone (partly argillaceous), glauconitic, fossiliferous (belemnites), with several bored and phosphatic hardgrounds; (f) dark grey to black, laminated, bituminous shale with limestone bed at top («Unterer Stein»); (g) grey calcareous marl with intercalated nodular limestone (both fossiliferous).
The members of the Staffelegg Formation are correlatable between all boreholes (Fig. 4‑23). Some lateral facies changes occur, but in general the different facies can be identified in all boreholes. In relation to other Mesozoic formations, thickness variations of the different members are small.
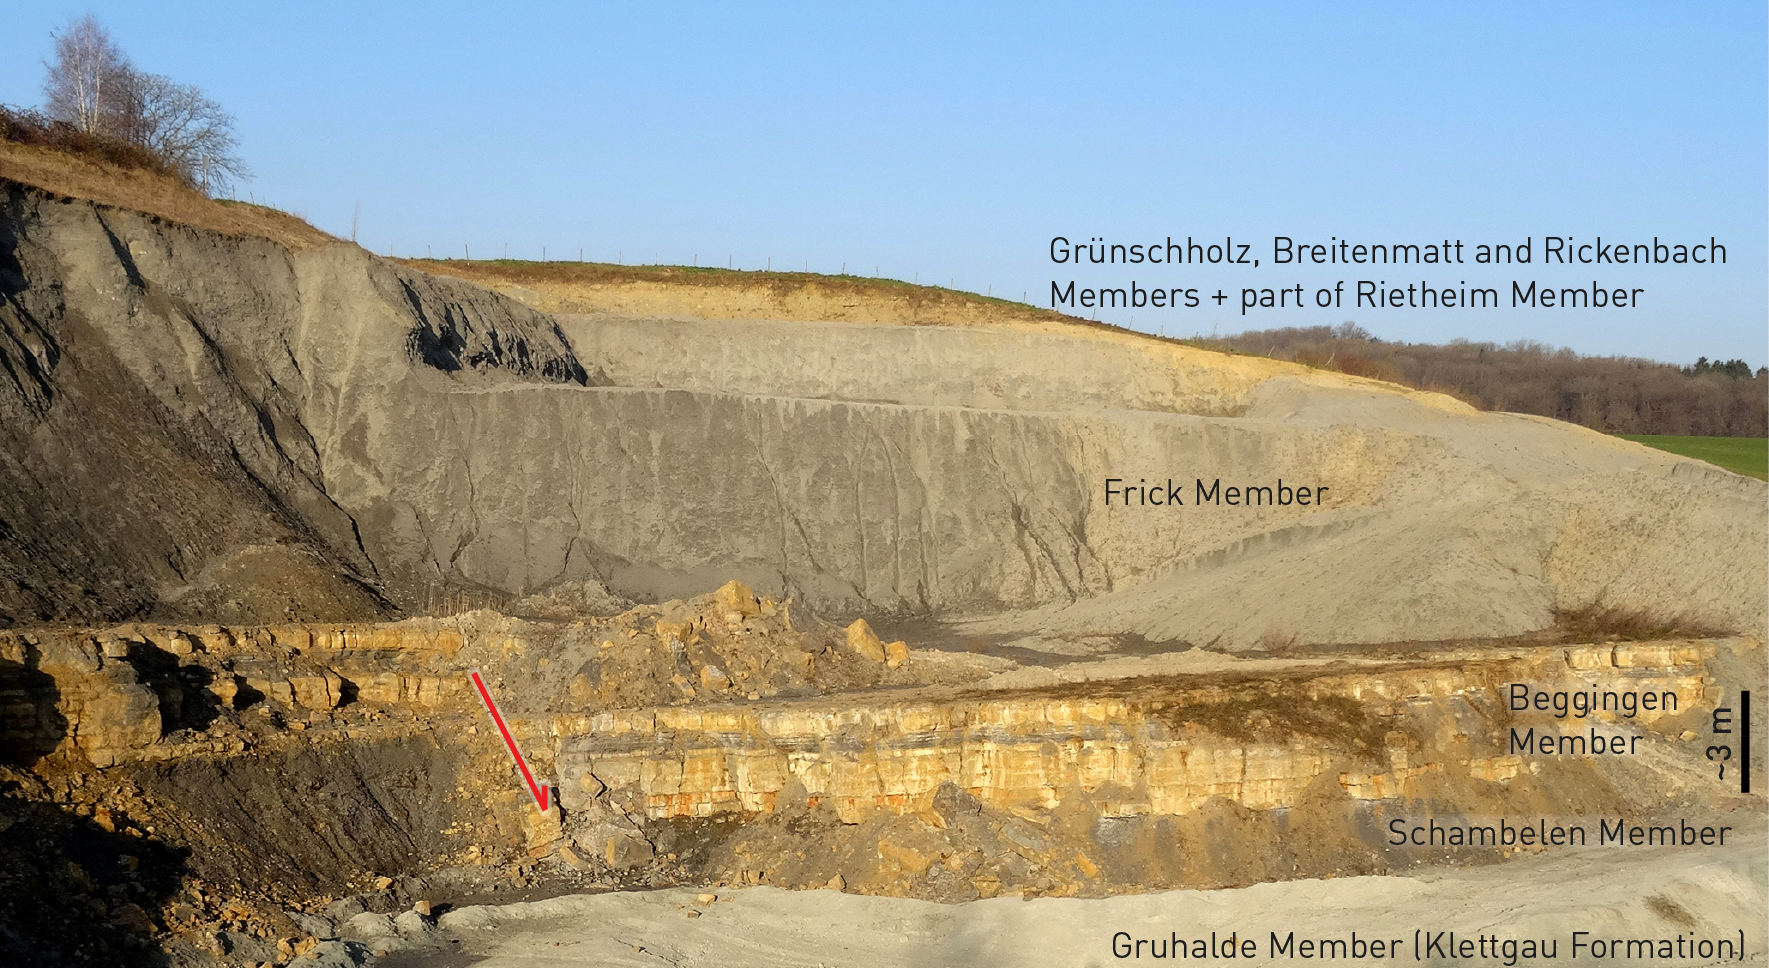
Fig. 4‑25:Outcrop of the Staffelegg Formation in the Frick Gruhalde clay pit
The Beggingen Member forms a few-metre-thick limestone succession between the clay-mineral-rich Schambelen and Frick Members. The red arrow denotes a normal fault, which displaces the Beggingen Member (see Section 5.5.4 and Fig. 5‑36 for further information). Modified after Nagra (2014b).
The Staffelegg Formation spans the entire Early Jurassic and thus represents a protracted period of deposition of nearly 30 million years. Three timelines picked within the Staffelegg Formation (199.5_Het_100, 192.9_Sin_200, 192.9_Sin_100; Fig. 4‑23) approximately follow lithostratigraphic boundaries (Top Schambelen Member, Top Beggingen Member and Top Frick Member). Within the very bituminous lower part of the Rietheim Member, the negative carbon-isotope excursion of the Toarcian Oceanic Anoxic Event is recognised (e.g. Fantasia et al. 2019). This global Toarcian Oceanic Anoxic Event, together with the C-isotope chemostratigraphy, allows a high-resolution correlation for the boreholes presented here (Wohlwend et al. 2024).
The Early Jurassic Staffelegg Formation was deposited in a shallow epicontinental sea in a subtropical to tropical climate. The Early Jurassic was characterised by a N-S-directed extension during the opening of the Piemont – Liguria Ocean (Chapter 3). The base of the Staffelegg Formation is a major unconformity (Section 4.2.4). In nearly 30 million years only 35 – 45 m of sedimentary rocks are preserved; the overall sedimentation rates are thus low to very low (Fig. 4‑4, Fig. 4‑5, Fig. 4‑6). The Early Jurassic is globally characterised by a marine transgression (Haq 2018). The associated deposits in the study area are related to phases of strong condensation, reworking, hiatuses and some intermittent episodes with relatively elevated sedimentation rates (Reisdorf et al. 2011, Kiefer et al. 2015). To the east and south, the epicontinental sea was bordered by the Vindelician Land and its promontory, the Alemannic Land, which successively became an island because of continuous lowering and flooding. These topographically high zones were potential sources for siliciclastic input (Trümpy 1959, Jordan 1983). Overall, the depositional environment appears to have evolved similarly over the entire study area. Lateral facies variability points to the presence of a smaller-scale palaeo-relief on the sea floor and different bottom current conditions. The depositional evolution of the Staffelegg Formation is subdivided here into four time intervals:
The first time interval (201.4_Rha_100 to 199.5_Het_100, mostly Hettangian) approximately corresponds to the strata of the Schambelen Member. This time interval represents the first fully marine depositional environment after the mostly terrestrial Triassic Klettgau Formation. The sedimentary rocks reflect phases with elevated siliciclastic input. More proximal settings with coastal sands of the Alemannic Land and the Vindelician Land characterise areas towards the east and are inferred to exist south of the siting regions.
The second time interval (199.5_Het_100 to 192.9_Sin_200, mostly lower part of Sinemurian) mainly corresponds to the Beggingen Member. During this time interval, calcareous sedimentation dominated (Fig. 4‑26). Evidence for condensation such as hardgrounds, iron-oolites and phosphatic nodules is common, supporting the notion of very low sedimentation rates. Sedimentary structures and fossils document the past existence of a shallow, partly very shallow marine setting with potential, localised, short-term emergence (Jordan 1983, Wetzel et al. 1993, Reisdorf & Wetzel 2018), with high current activity and diverse marine fauna.
The third time interval (192.9_Sin_200 to 192.9_Sin_100, within the upper part of the Sinemurian) mainly corresponds to the Frick Member. The depositional environment was characterised by fine-grained siliciclastic input from the Alemannic Land and the Vindelician Land (similar situation as shown in Fig. 3‑8). During the deposition of the Frick Member sedimentation rates temporarily increased.
The fourth time interval (192.9_Sin_100 to 174.7_Toa_100, uppermost part of the Sinemurian to end of the Toarcian) corresponds to the time interval during which the Grünschholz up to the Gross Wolf Members were deposited. The first part of this time interval, at the end of the Sinemurian and the Pliensbachian, is again characterised by the deposition of condensed successions indicated by phosphatic hardgrounds and reworked nodules (Grünschholz, Breitenmatt and Rickenbach Members). After a hiatus, the depositional environment was characterised by sedimentation rich in clay minerals and organic material during the Early Toarcian (Rietheim Member). This depositional environment has been extensively studied in Southern Germany, including famous fossil sites such as Holzmaden (Posidonienschiefer Formation). A shallow marine, warm, partly hypersaline and oxygen-poor environment can be reconstructed for the deposition during this interval (Riegraf 1985). Röhl & Schmid-Röhl (2005) favoured a depositional model involving a slow increase of the sea level in a "silled basin" that resulted in stagnant conditions. Alternative depositional models were also discussed. After a further hiatus with pronounced erosion, a phase of condensed deposition in a shallow marine, distal setting with an increased calcareous content is reflected by the Gross Wolf Member.
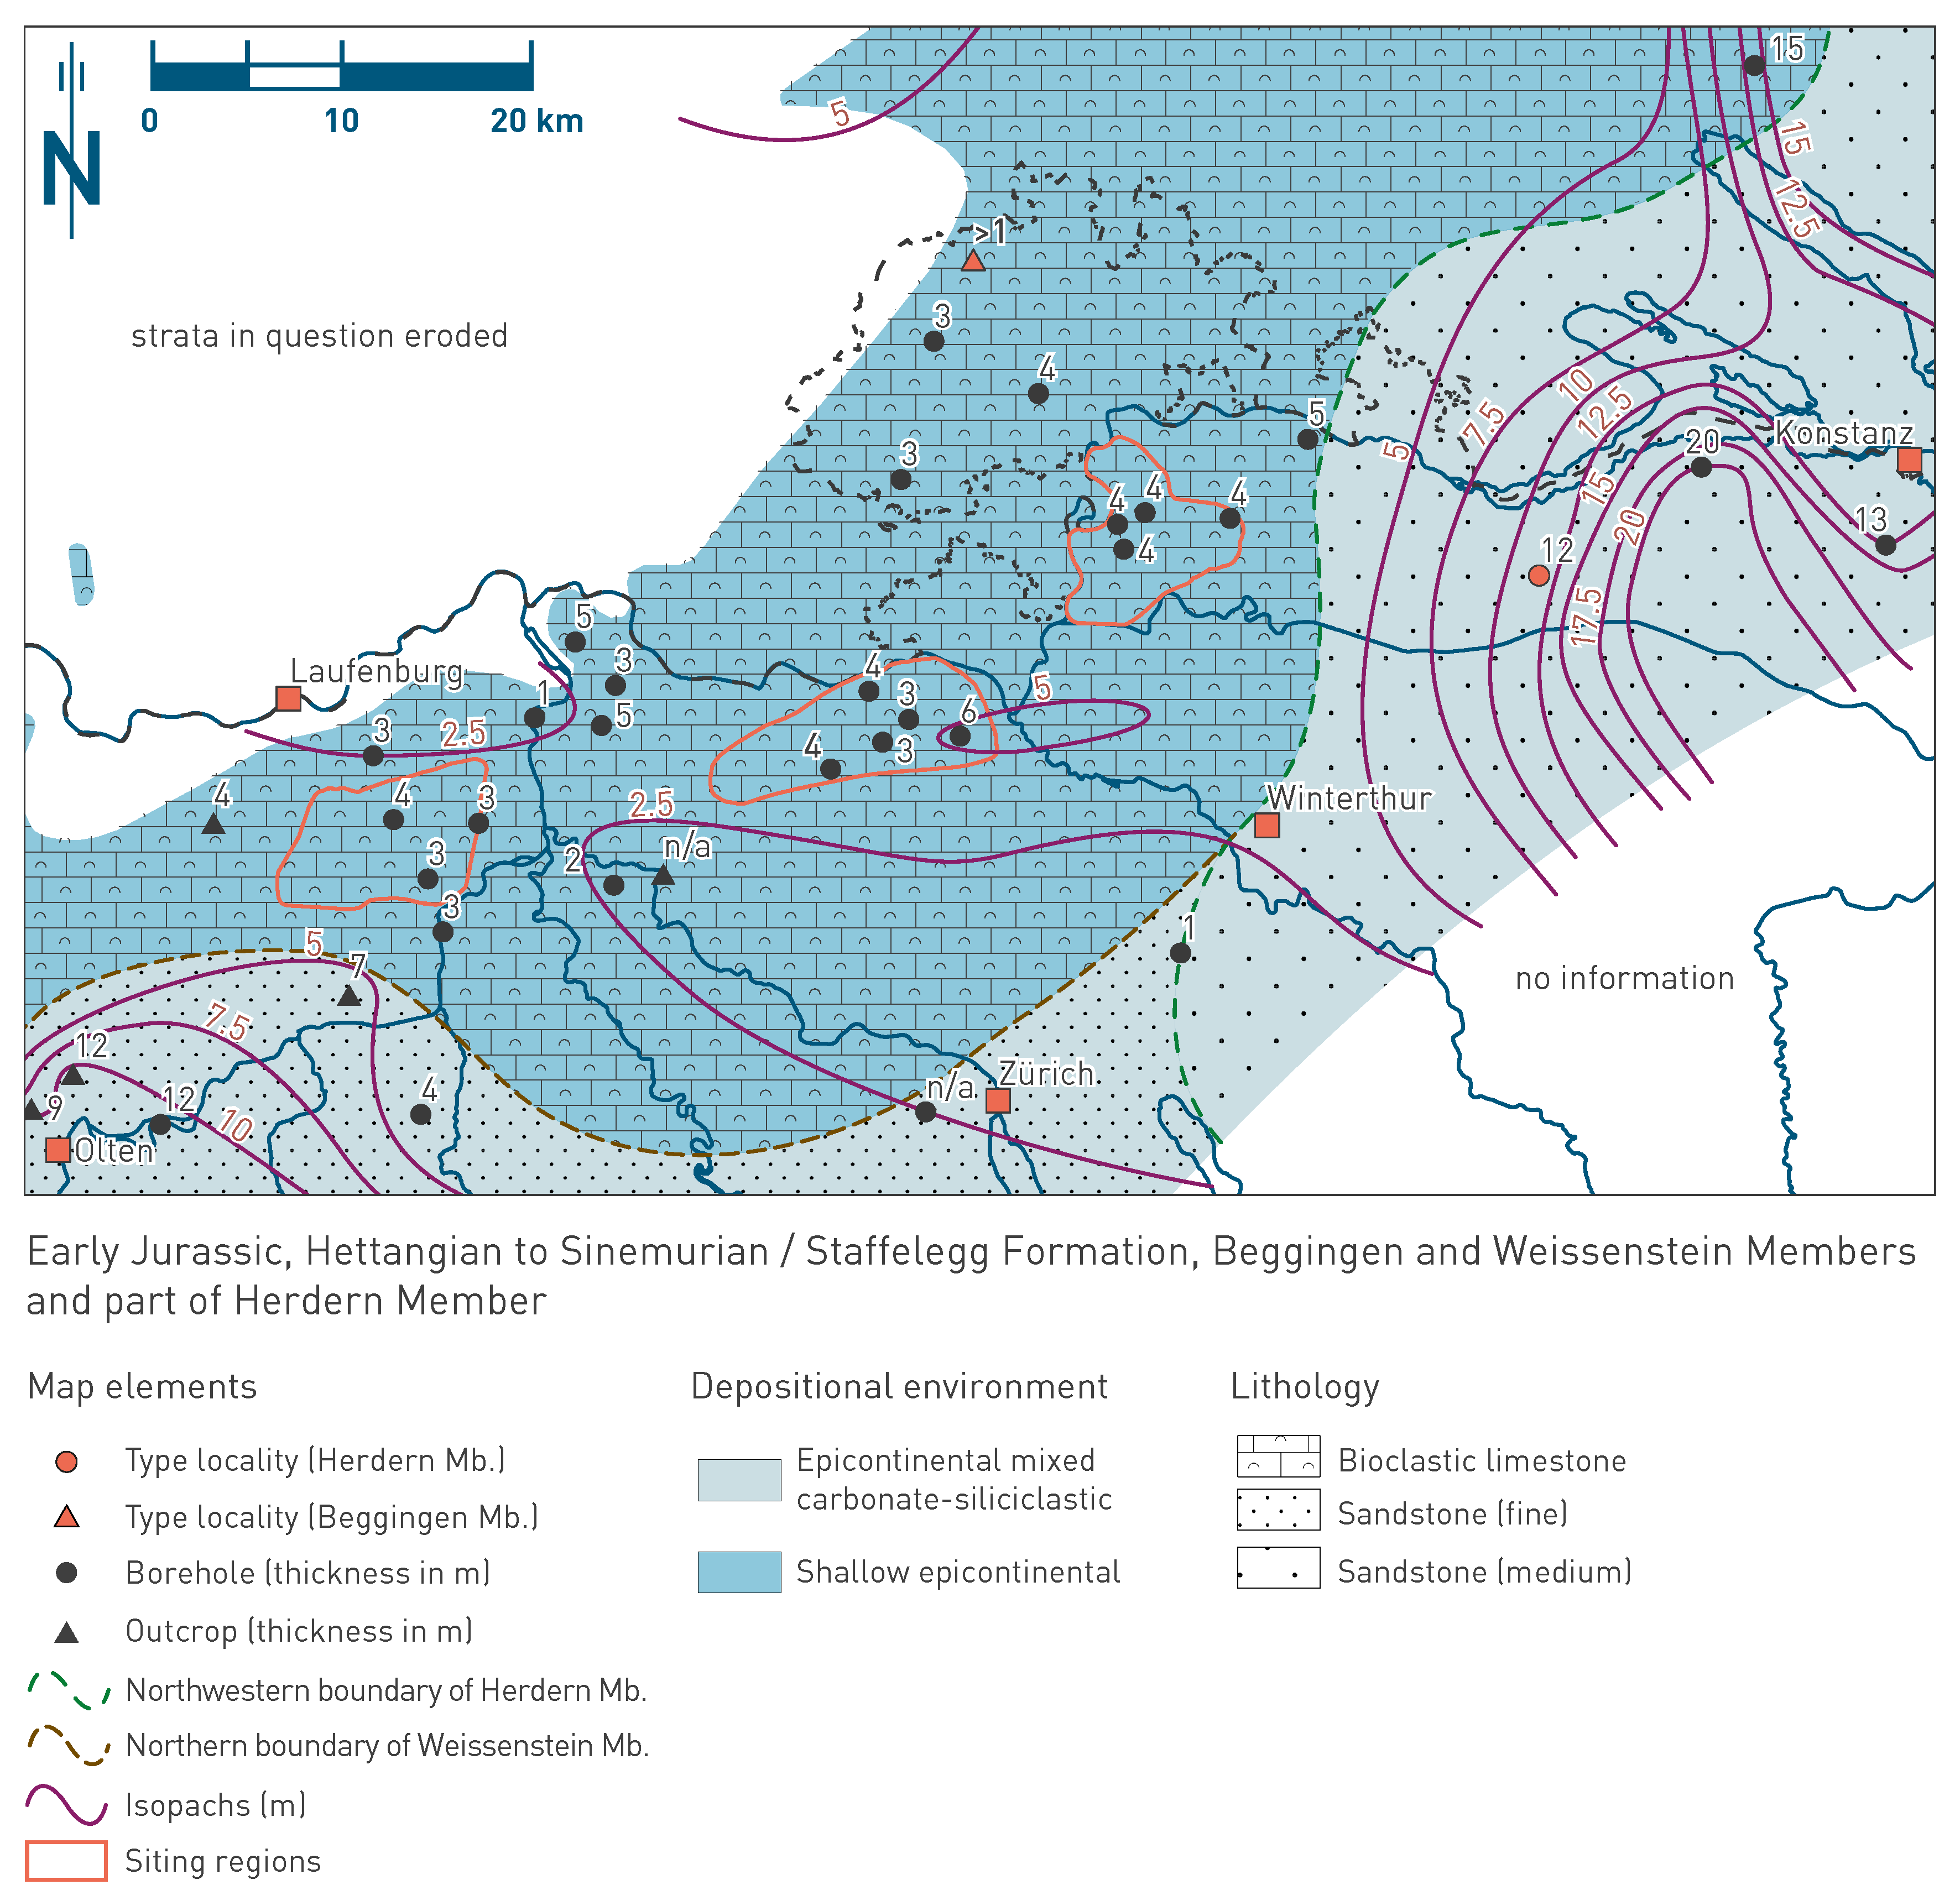
Fig. 4‑26:Map of depositional environments during the Hettangian to Sinemurian preserved in the Beggingen and Weissenstein Members and part of the Herdern Member
Refer to Fig. 4‑3 for a schematic representation of depositional environments. The north arrow refers to present-day geographic north.
The Opalinus Clay host rock exists in all three siting regions with similar facies characteristics and thickness. It was deposited during the Aalenian at the beginning of the Middle Jurassic. During this time period, Central Europe was affected by continued N-S-extension during the opening of the Piemont – Liguria Ocean (Chapter 3). These processes led to subsidence and created accommodation space for the deposition of the thick Opalinus Clay succession. This unit was deposited in a shallow marine epicontinental sea.
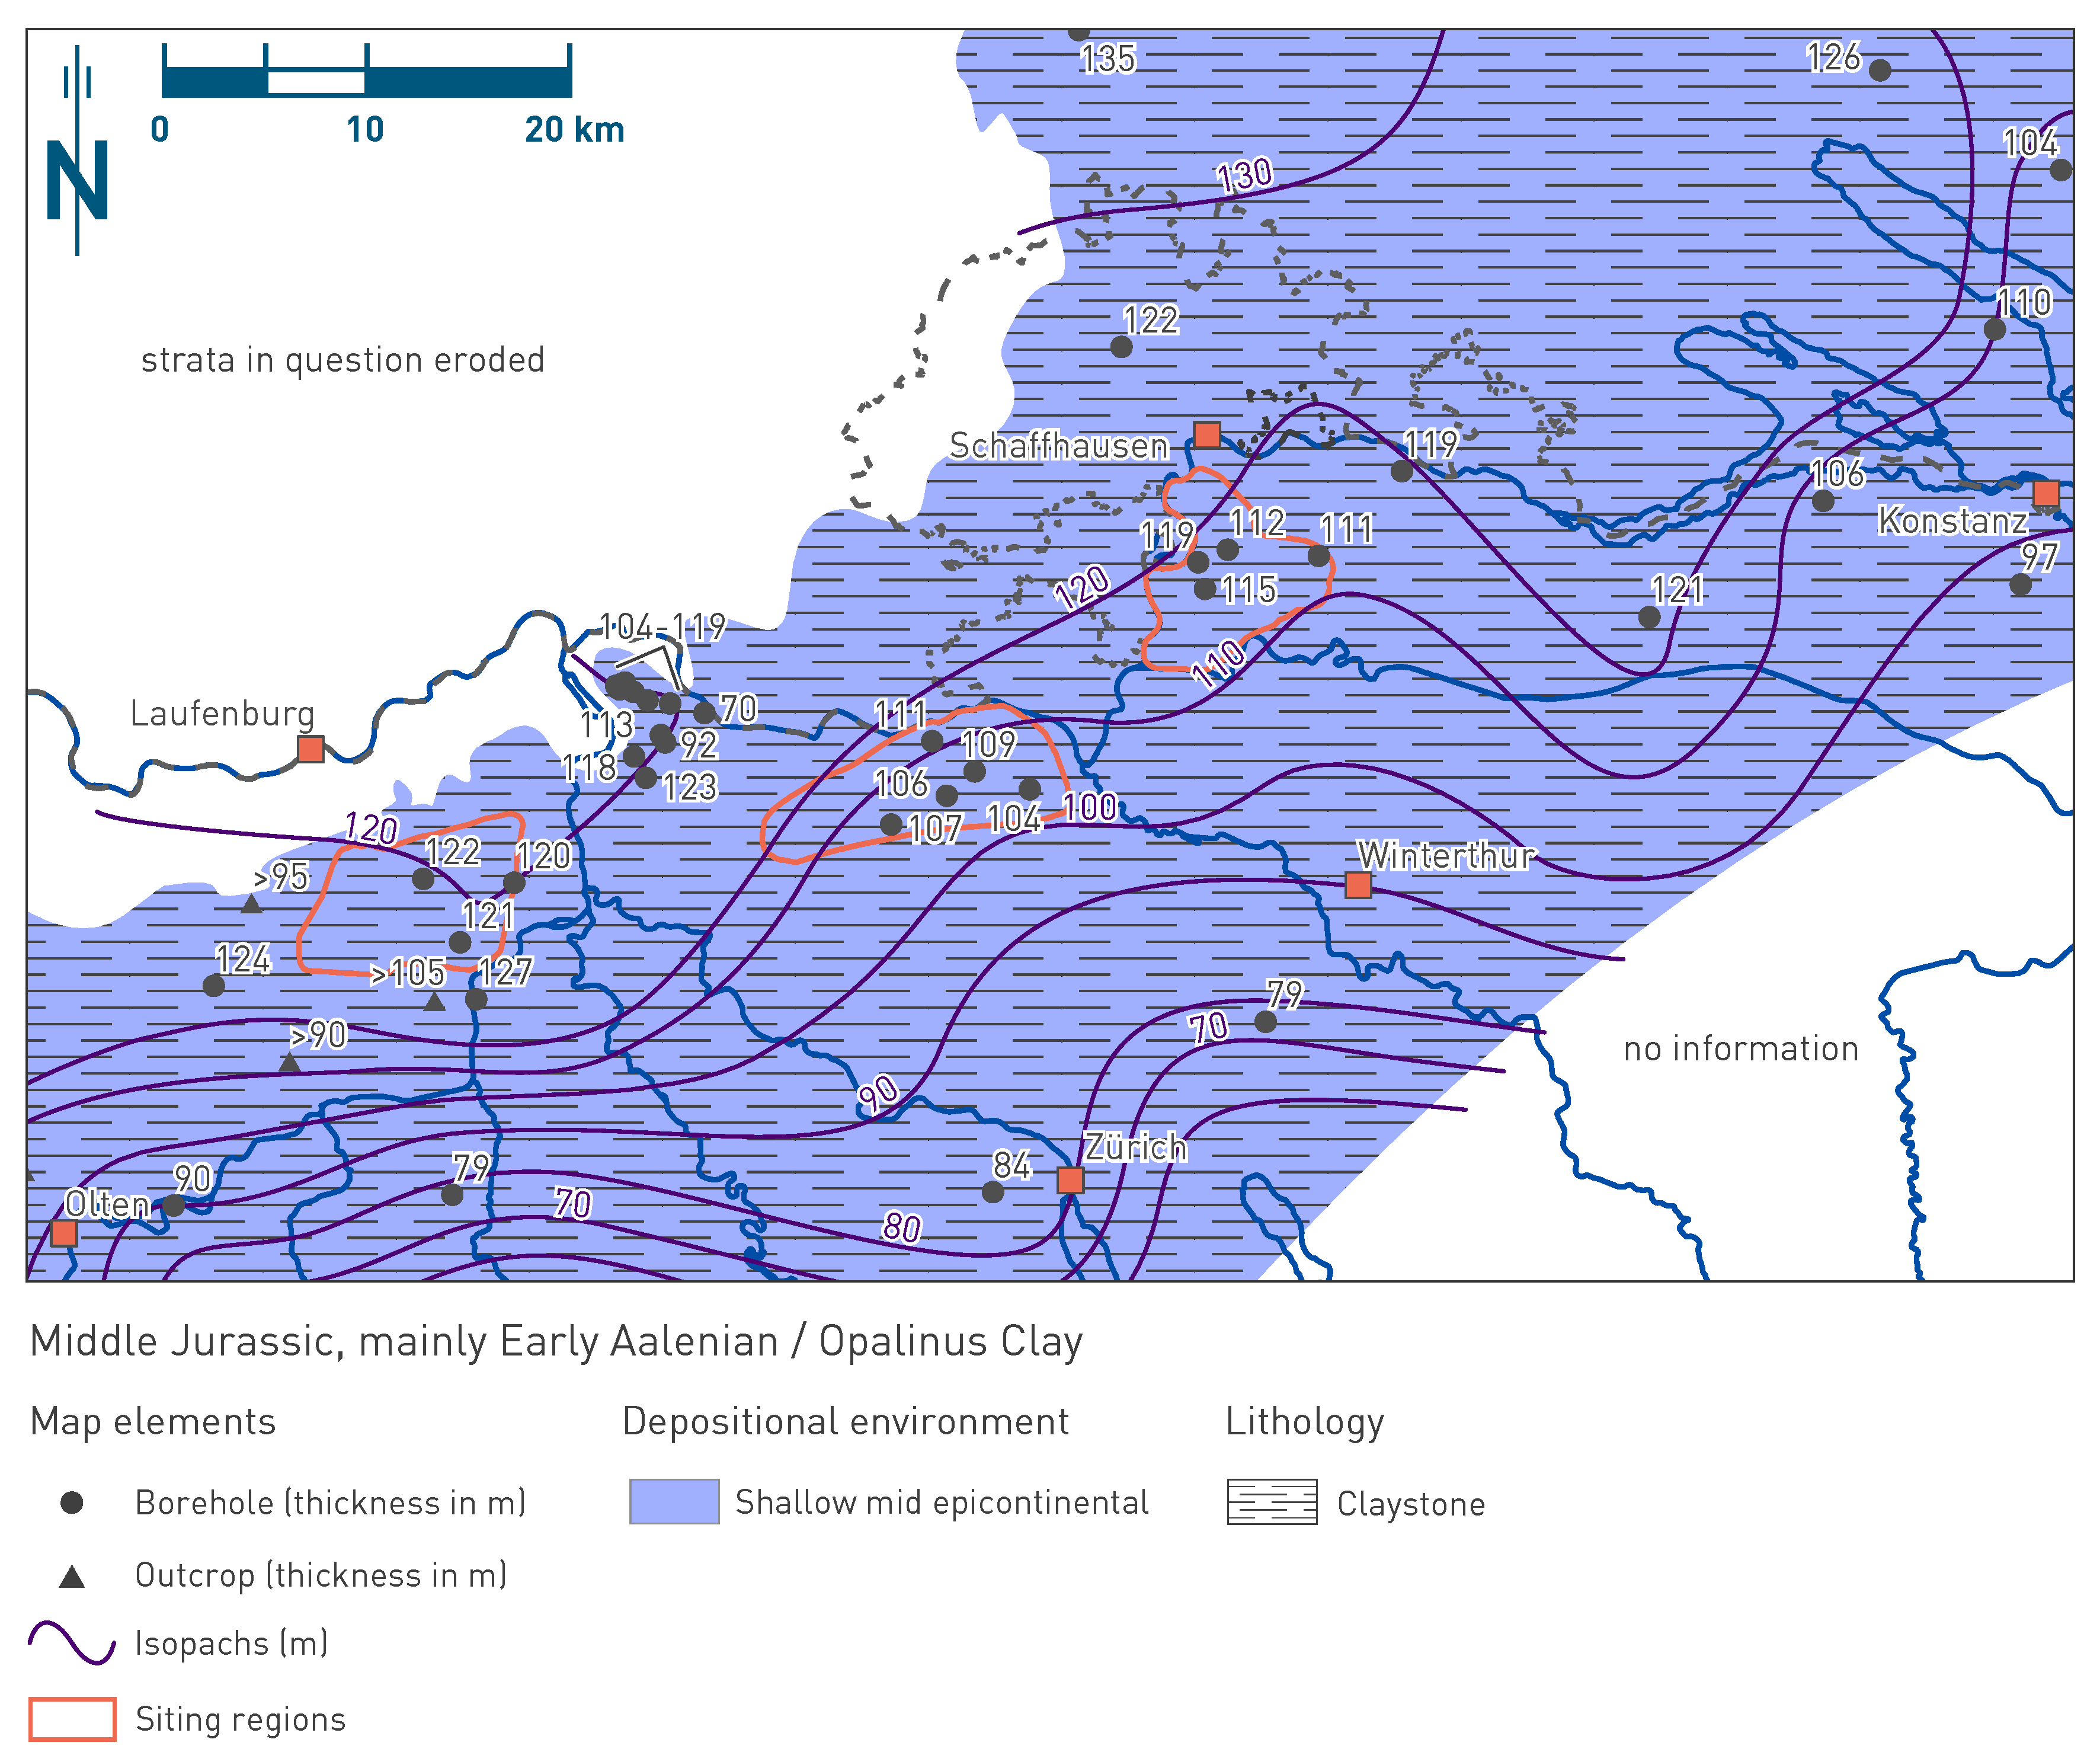
Fig. 4‑27:Map of depositional environment during the Middle Jurassic (mainly Early Aalenian) preserved in the Opalinus Clay
Refer to Fig. 4‑3 for a schematic representation of depositional environments. The north arrow refers to present-day geographic north.
The Opalinus Clay has the lithostratigraphic rank of a formation (Remane et al. 2005) and forms the lower part of the Dogger Group. The thickness of the Opalinus Clay is ca. 120 m in JO (BOZ2: 122 m, BOZ1: 121 m, RIN: 120 m), ca. 105 – 110 m in NL (BAC1: 107 m, WEI: 111 m, STA2: 106 m, STA3: 109 m, BUL1: 104 m) and ca. 115 m in ZNO (MAR1: 115 m, RHE1: 119 m [calculated true vertical depth TVD], BEN: 112 m, TRU1: 111 m) (Fig. 4‑27). The Opalinus Clay consists mostly of a fine sandy and silty claystone and claystone (sandy/silty, calcareous) (Fig. 4‑28, Fig. 4‑29).
There is no formal subdivision for the Opalinus Clay. In the past it had been subdivided into several dm- to m-scale subunits. This subdivision scheme was applied to the Opalinus Clay strata in the Nagra boreholes drilled in the 1980s and in the Mont Terri rock laboratory (e.g. Matter et al. 1988, Nagra 2001, Hostettler et al. 2017). This subdivision was refined by Mazurek & Aschwanden (2020) and applied to the TBO drilling campaign (Dossier III of TBO reports listed in Tab. 2‑1, Fig. 4‑28). From bottom to top this subdivision includes the following units: «Clay-rich sub-unit», «Mixed clay-silt-carbonate sub-unit», «Upper silty sub-unit» and «Sub-unit with silty calcareous beds». The additional «Carbonate-rich silty sub-unit» and the «Lower silty sub-unit» were only identified to the west of the study area.
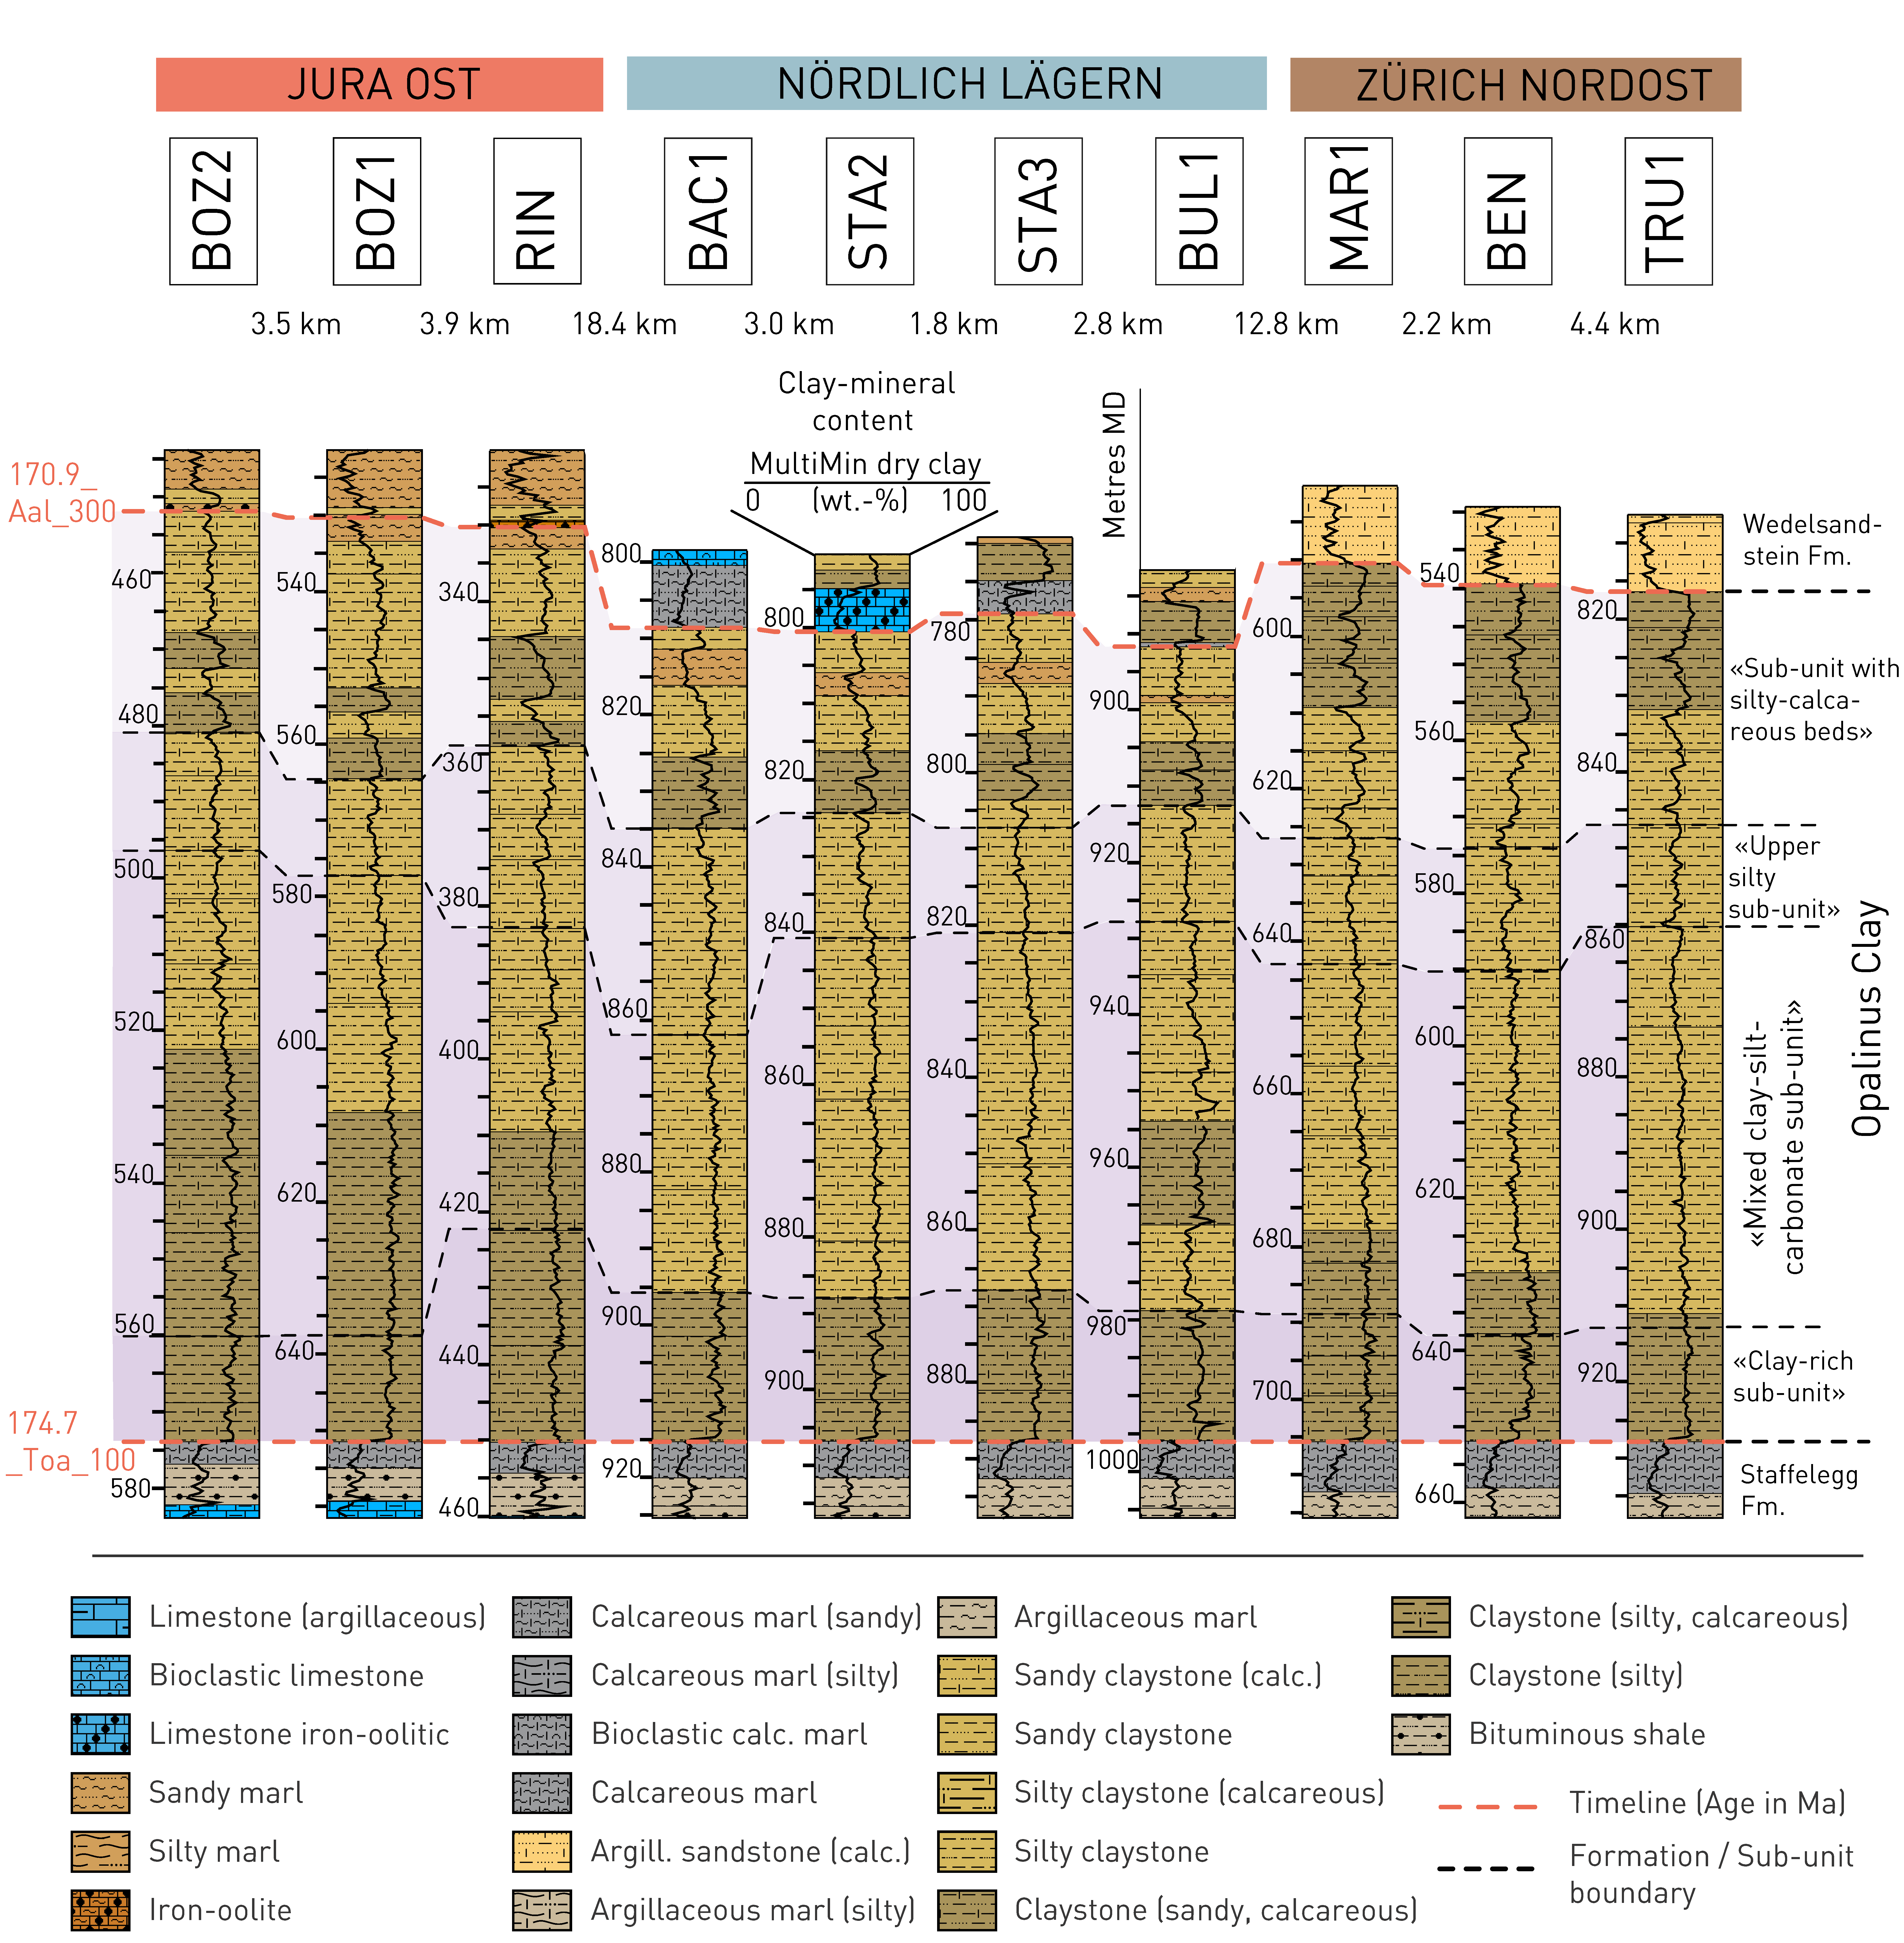
Fig. 4‑28:Stratigraphic borehole correlation of the Opalinus Clay
For lithological nomenclature refer to Naef et al. (2019). Clay-mineral content after Becker & Marnat (2024) . Some of the boundaries and lithologies as discussed in the original reports were adjusted to integrate all presented borehole data.
Recent multi-proxy studies combining petrographic, petrophysical, geochemical and mineralogical analyses consider lithological heterogeneity on a cm- to dm-scale. Based on these analyses, a new subfacies classification scheme was developed at the Mont Terri rock laboratory by Lauper et al. (2018). This classification was also applied in the study area and developed further by Lauper et al. (2021b) and Zimmerli et al. (2024); the geosynthesis follows these principles. In the study area, the Opalinus Clay is dominated by three subfacies (Fig. 4‑30). The argillaceous subfacies 1 (SF1) consists of a dark grey, homogeneous claystone (sandy/silty, calcareous) (Fig. 4‑29a to c). Dispersed quartz, mica, feldspar grains and bioclastic fragments occur within the argillaceous matrix. SF1 dominates the lower half of the Opalinus Clay and repeatedly occurs in boreholes of NL and ZNO in the approximately uppermost part of this unit. The laminated subfacies 2 (SF2) is a silty claystone with lenticular bedding (Fig. 4‑29d and e). It shows an alternation of a dark grey, argillaceous matrix and continuous to discontinuous, light grey, quartz and bioclastic-rich lenses (thickness: few mm to few cm). Most lenses are cemented by a sparitic Fe-calcite. The lenticular subfacies 3 (SF3) consists of a silty and fine sandy claystone. This subfacies has a lenticular to wavy-bedded texture. The lenses become thicker from a few mm to several cm and the argillaceous matrix contains more quartz grains and bioclastic fragments than the previous subfacies types. SF2 and SF3 may occur over the entire thickness of the Opalinus Clay, except in the lowermost part (Fig. 4‑30). Additionally, sideritic nodules and layers (Fig. 4‑29b) may be found throughout the Opalinus Clay; they occur particularly frequently in approximately the second quarter of the Opalinus Clay (from the bottom). The sandy subfacies 4 (SF4) and the bioclastic subfacies 5 (SF5), as defined by Lauper et al. (2018) in the Mont Terri rock laboratory, were not identified in the boreholes of the study area. Zimmerli et al. (2024) define an additional homogeneous/deformed subfacies 6 (SF6). This subfacies is characterised by homogenised, folded, deformed or tilted structures related to soft-sediment deformation. It is dominated by clay minerals, calcite and quartz grains and may occur in approximately the second and third quarters of the Opalinus Clay. In the approximately uppermost quarter of the Opalinus Clay, additional cm- to dm-scale beds of silty limestone and limestone (iron-rich) (Fig. 4‑29f and g) occur. The silty limestone consists of silt- to sand-sized quartz grains, with micas, feldspars, bioclastic fragments, clay minerals, pseudosparitic calcite cement, and minor pyrite, and is highly bioturbated. The iron-rich or ferruginous limestone contains abundant bioclastic debris, lithoclasts, and some concretions.
Overall, the Opalinus Clay has similar sedimentological characteristics in all investigated boreholes of the three siting regions. The lateral and vertical lithological variability is generally small compared with other Mesozoic formations of Northern Switzerland. The succession of sub-units or subfacies trends can generally be correlated over all borehole sites (Fig. 4‑28, Fig. 4‑30). However, local facies differences occur and the possibility to correlate units improves with a detailed look at the individual siting regions. For example, the approximately uppermost part of the Opalinus Clay retrieved from the boreholes of JO is richer in fine sand and silt, and less argillaceous compared to NL and ZNO. Special attention must be paid to the occurrence of characteristic calcareous and/or iron-rich beds to further investigate correlatable strata within the Opalinus Clay. Wohlwend et al. (2024) and Zimmerli et al. (2024) propose six potential marker beds or horizons, at least at local scale (Fig. 4‑30). Most of these beds occur in the approximately uppermost quarter of the Opalinus Clay. Within the NL and ZNO siting regions, the correlation of these beds appears to be quite robust, with the exception of Bed-II which represents a correlation with high uncertainty. The correlation towards and within JO is generally less reliable.
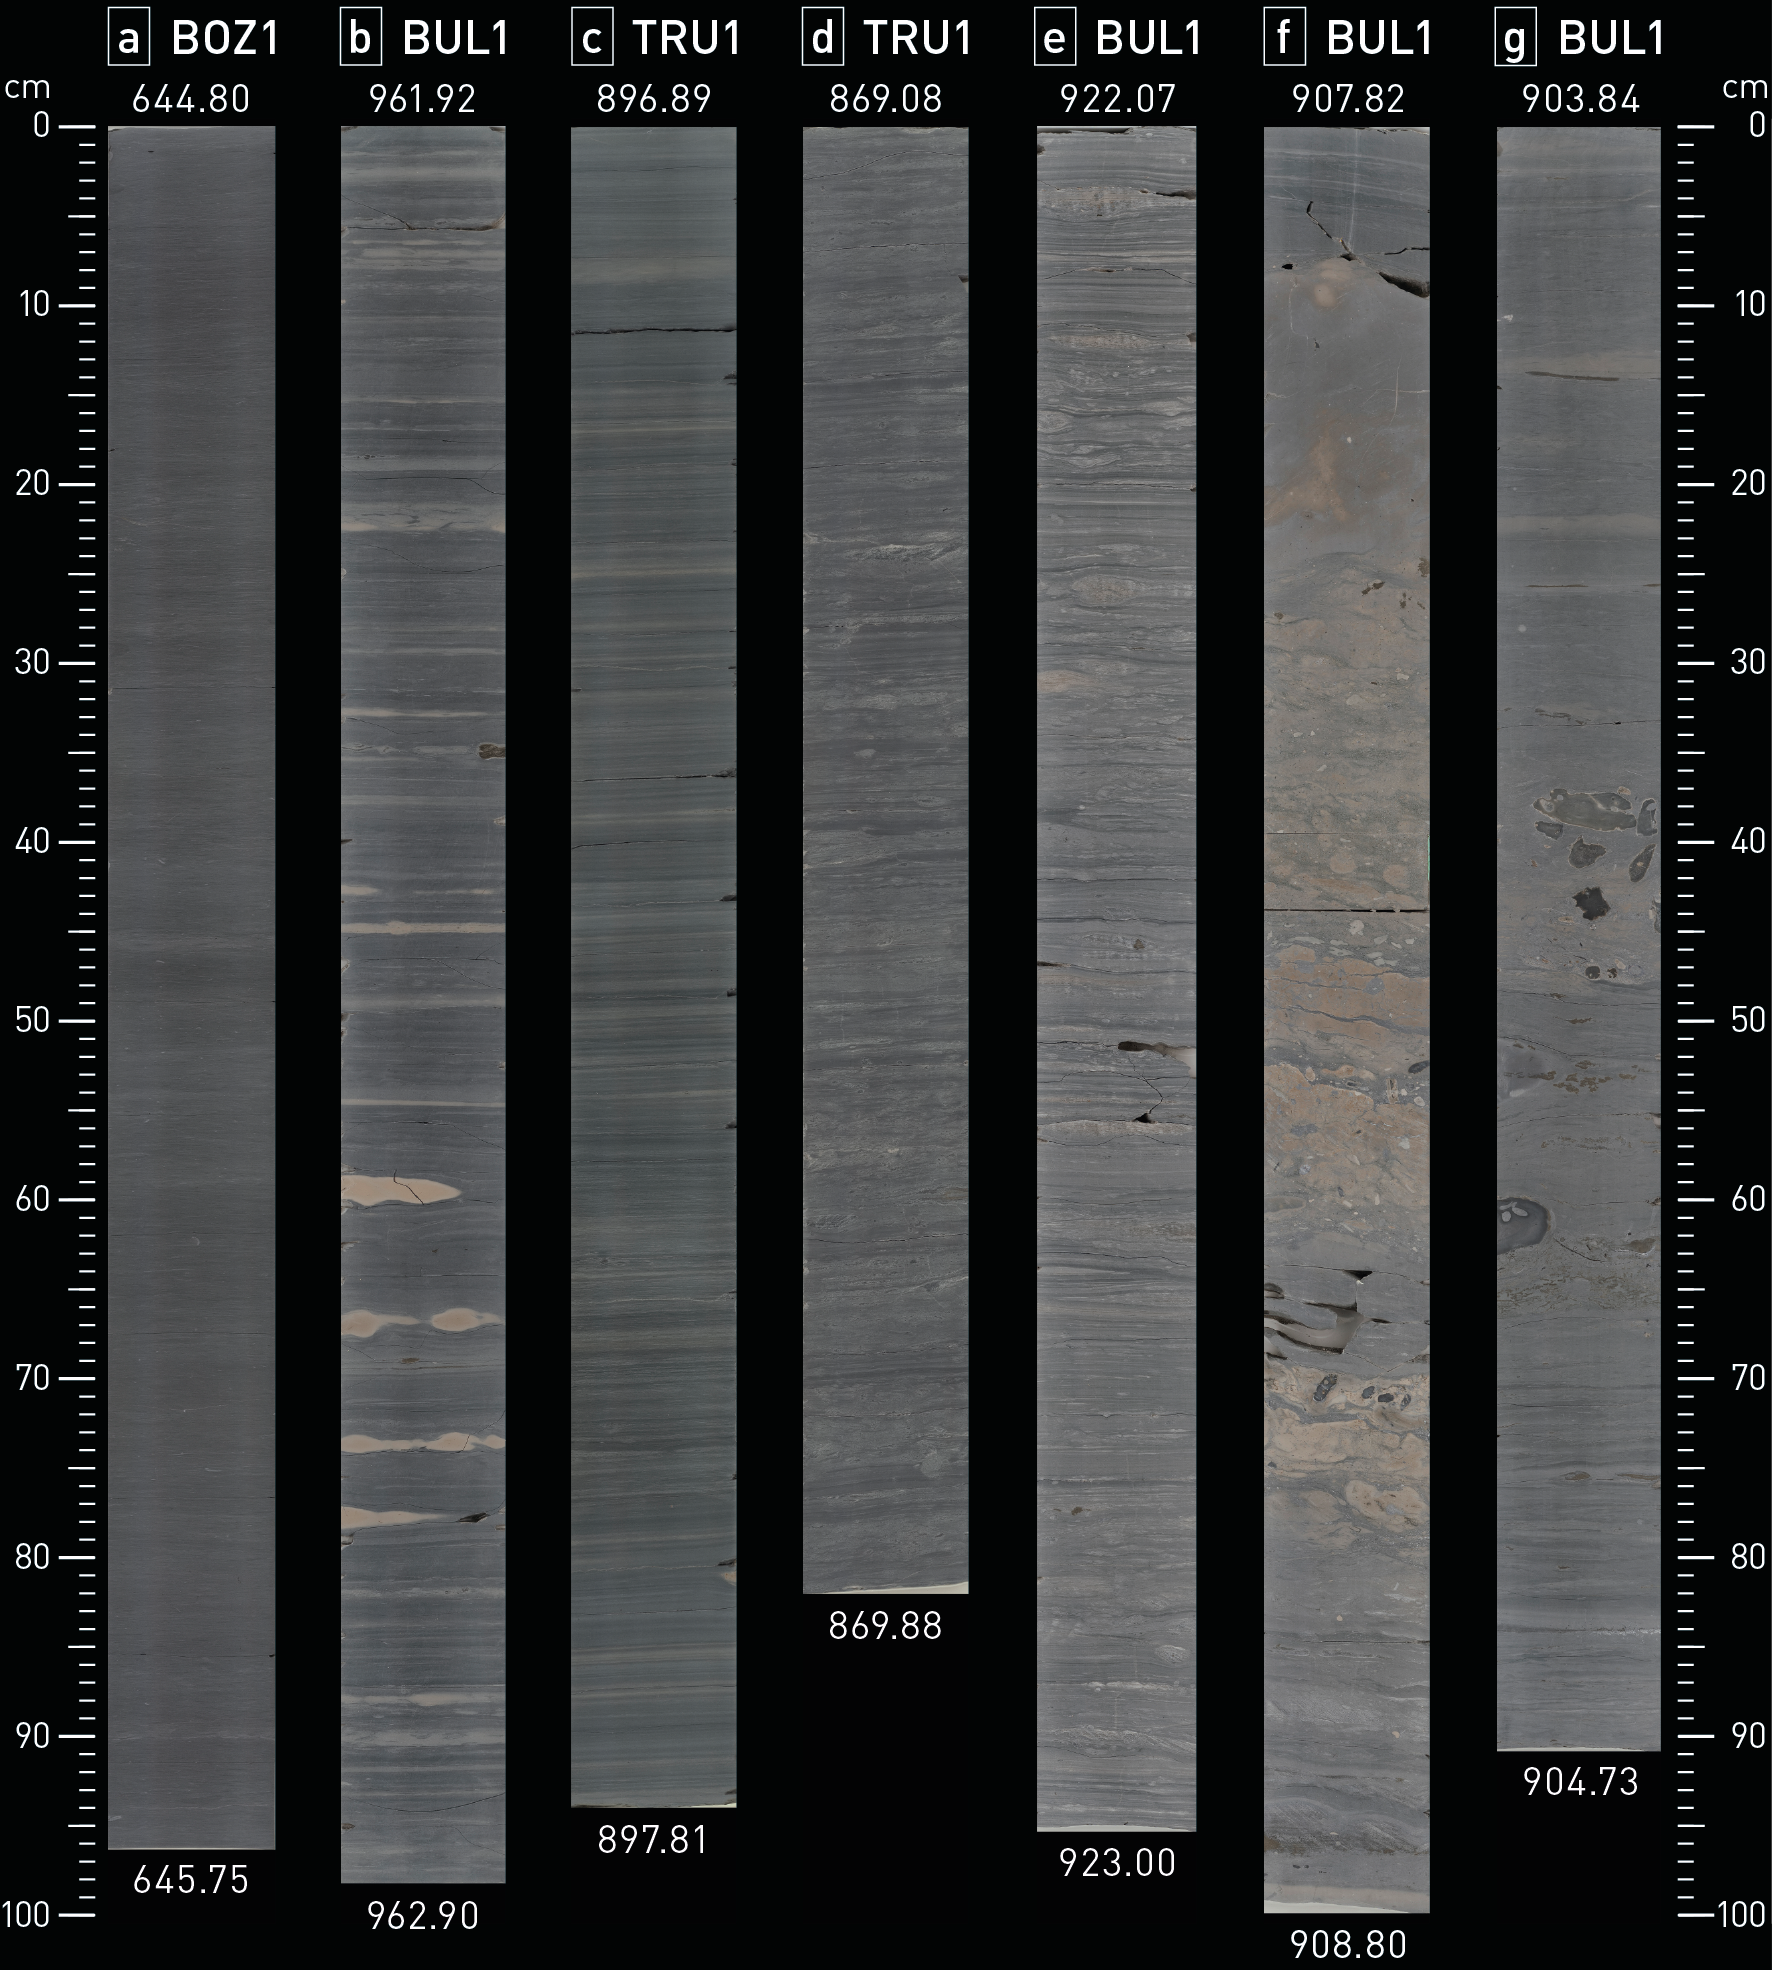
Fig. 4‑29:Selected core photos of the Opalinus Clay (slabbed cores)
(a) Dark grey claystone (silty), sparsely pyritic, scattered fine bioclasts and pyritised burrows (SF1); (b) dark to medium grey, laminated claystone (silty) with light grey layers and lenses of siltstone with beige siderite nodules (SF1); (c) dark to medium grey, laminated silty claystone (calcareous) with light grey, more silty to sandy layers (SF1); (d) dark grey sandy claystone with lenticular-bedded light grey lenses of siltstone and light grey sandy marl, rippled, bioturbated (SF2); (e) medium grey laminated to bioturbated sandy claystone (silty), with abundant light grey lenses of silt to sand, rippled (mostly SF2, towards SF3); (f) partly iron-rich succession of several firm- to hardgrounds, lithoclasts, calcareous marls and bioclastic limestone (argillaceous), ooids (former iron-mineral composition replaced by calcite); (g) medium to dark grey silty to sandy claystone (calcareous), with light grey lenses of mostly siltstone, rippled with beige limestone lithoclasts (904.18 to 904.48 m), densely bored (SF1 to SF2 with iron-rich limestone).
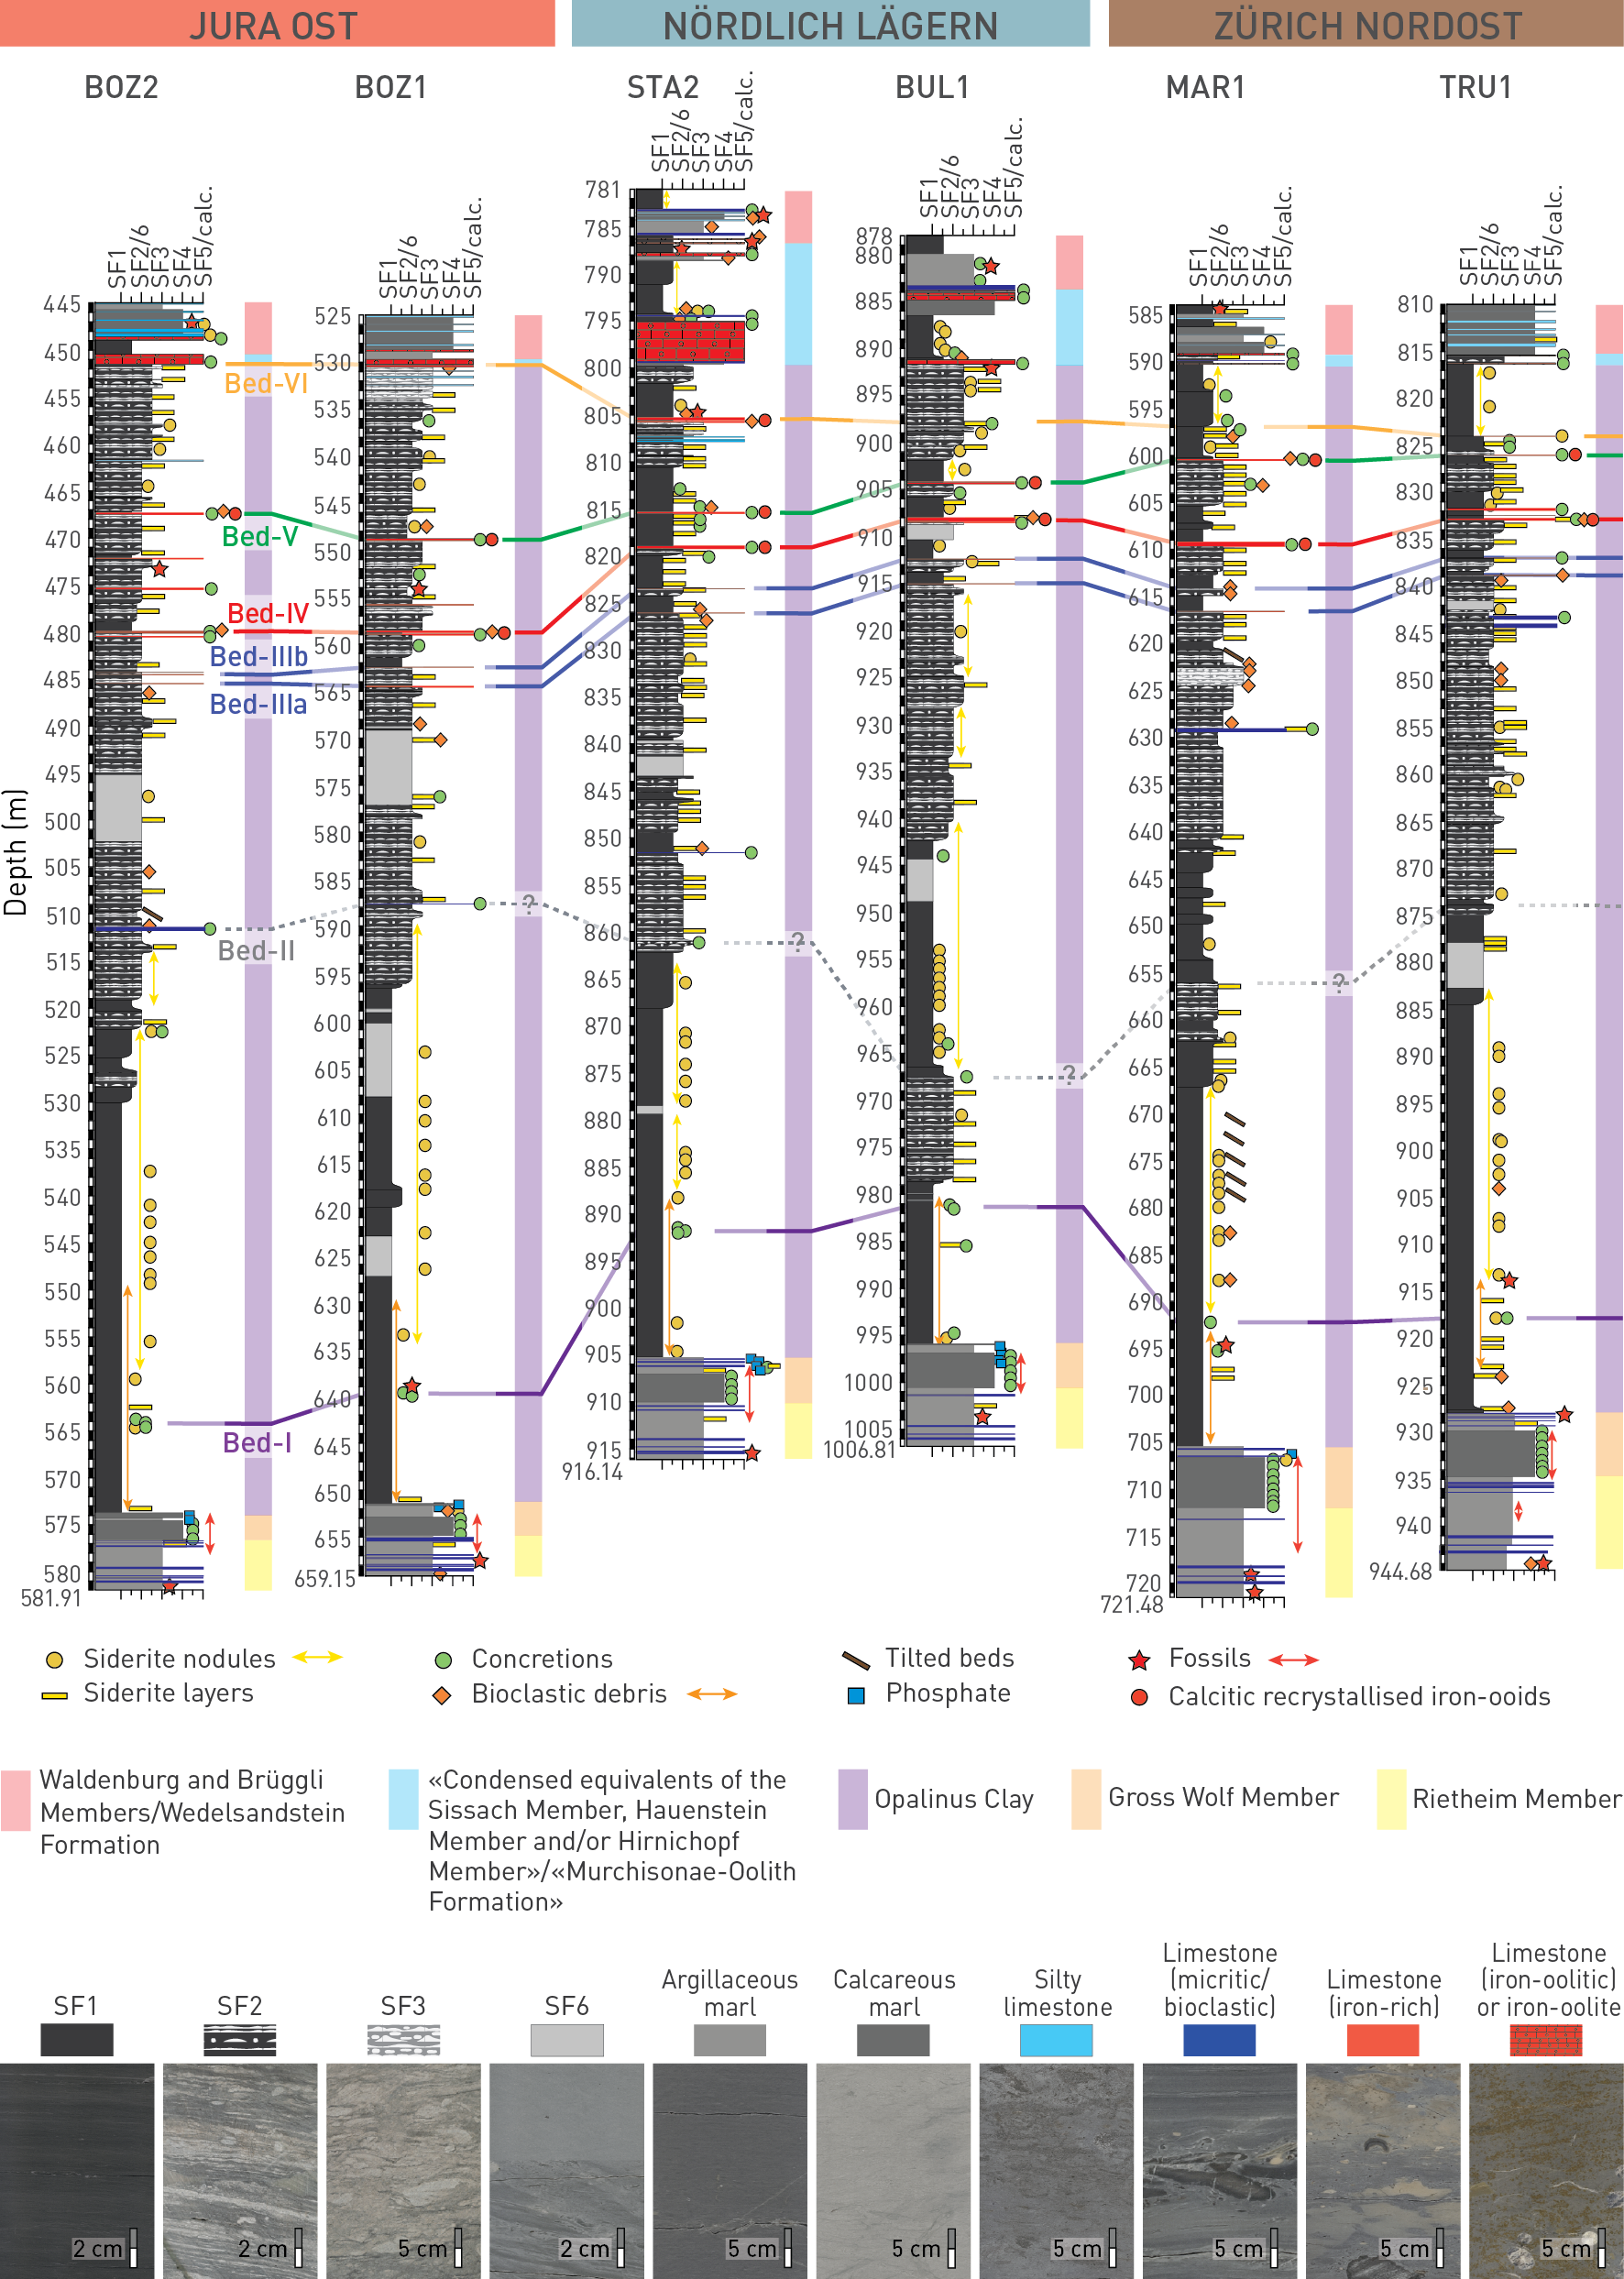
Fig. 4‑30:Subfacies classification and lithologies of the Opalinus Clay and adjacent formations in boreholes of Northern Switzerland
Modified after Zimmerli et al. (2024).
The Middle Jurassic Opalinus Clay was mainly deposited during the Opalinum ammonite Zone of the Early Aalenian. To improve the chronology within the Opalinus Clay, the combination of biostratigraphy, based on ammonites and palynomorphs, and stable carbon-isotope chemostratigraphy, measured on inorganic carbonates and organic matter, was applied (Wohlwend et al. 2024). In the uppermost part of the Staffelegg Formation (Rietheim Member), the global negative carbon-isotope excursion of the Toarcian Oceanic Anoxic Event was detected in all boreholes of the three siting regions. This demonstrates the reliability of C-isotopic chemostratigraphy (Section 4.2.5). In the lower part of the Opalinus Clay, an additional, slightly less negative C‑isotope shift in the organic matter was detected in the Opalinum Subzone of the Opalinum Zone. This negative shift is as well correlatable across all boreholes of the three siting regions. Within most of the Opalinus Clay, the C-isotopes of the organic matter are very constant or only show slight changes. However, a clear increase in C-isotope values of organic matter can be traced in the uppermost part of the Opalinus Clay that can be allocated to the Bifidatum Subzone of the Opalinum Zone by ammonites and palynomorphs. The positive isotope increase coincides with a calcareous, iron-rich bed and is well expressed in the boreholes of NL (Bed-VI in Fig. 4‑30). The facies (e.g. amount of iron-oolites) and thickness of this bed change laterally, but it apparently marks a more or less synchronous event of condensation in all boreholes. Therefore, these types of beds can be used in a first step to define timelines on a local to regional scale. In the Opalinus Clay, six beds were picked in the boreholes that might represent timelines (Fig. 4‑30). Bed-I, -III to -VI have a medium to good confidence level, whereas Bed-II has a low confidence level.
The Middle Jurassic Opalinus Clay was deposited in a shallow epicontinental sea in a subtropical to tropical climate (Wetzel et al. 2003, Lauper 2021, Wetzel & Allia 2003). During the Middle Jurassic, Europe continued to be affected by the development of the Piemont – Liguria Ocean (Chapter 3). For the Early Aalenian, an overall regressive trend was suggested for the epicontinental Central European Basin (Lauper et al. 2021a, Zimmermann et al. 2018). The epicontinental sea was surrounded by the Rhenish Massif to the north, the Vindelician – Bohemian Massif to the east, the Alemannic Land to the south and the very shallow area in the Burgundy area to the west (Fig. 3‑8). Siliciclastic input to the epicontinental basin could have come from the nearby landmasses or long-distance transport from Fennoscandia. Absolute water depth was estimated to about 20 to 50 m (Allia 1996, Wetzel & Allia 2003), but may also have been deeper at least temporarily (Fig. 4‑31). The large accommodation space needed to deposit the thick Opalinus Clay in a relatively shallow water environment – particularly considering uncompacted sediment thicknesses – was provided by regional subsidence (Wetzel & Allia 2003). Subsidence led to a depositional environment that became differentiated into subtle swells and depressions, thought to have had an important impact on thickness and facies variations of the Opalinus Clay (Wetzel & Allia 2000, 2003, Lauper et al. 2021a).
The lower lithostratigraphic boundary of the Opalinus Clay coincides with the Toarcian-Aalenian boundary within the available biostratigraphic resolution in the study area in Northern Switzerland. Towards the west, in the Mont Terri rock laboratory, the deposition of the Opalinus Clay had already begun by the Late Toarcian (Hostettler et al. 2017). In general, the entire Opalinus Clay exhibits a shallowing-upward trend, with more homogeneous claystone at the bottom and increasing silt and fine sand towards the top, which may reflect the overall regressive trend observed in the Early Aalenian. Different authors have postulated additional cyclic facies trends such as coarsening-upward cycles ("Dachbankzyklen") (Allia 1996, Wetzel & Allia 2003, Lauper et al. 2021a, Leu et al. 2023). The intervals between the correlatable beds presented here (Fig. 4‑30) have been interpreted as coarsening-upward cycles that correspond to shallowing-upward regressive trends (Zimmerli et al. 2024). As pointed out earlier, the definition of such trends is more difficult in the lower and middle parts of the unit compared to the uppermost sectors; in the upper layers, calcareous and iron-rich beds are more common and can be correlated at local to regional scales. These beds appear to trace phases of reduced sedimentation and slight stagnation to condensation. The increased occurrence of these calcareous beds in the upper part could indicate that sedimentation rates decreased towards the top. Conversely, the sedimentation rates of the thicker, lower part of the Opalinus Clay were probably very high (Fig. 4‑4, Fig. 4‑5, Fig. 4‑6).
Zimmerli et al. (2024) defined an additional homogeneous/deformed subfacies 6 (SF6) characterised by homogenised, folded, deformed or tilted strata. It is interpreted to reflect mass-wasting events of different scales within the basin.
The more sandy-silty expression of the uppermost part of the Opalinus Clay as seen in the boreholes of JO could indicate an additional or stronger input of quartz- and feldspar-rich detritus (interval between marker bed Bed-V and Top Opalinus Clay; Fig. 4‑30). The upper boundary of the Opalinus Clay was correlated to a regression discontinuity (Burkhalter 1996). Lauper et al. (2021a) also identified the top of the Opalinus Clay as a diachronous discontinuity (Fig. 4‑34) and linked its genesis to sediment bypassing.
The Opalinus Clay is generally described as a tempestite-dominated deposit (Allia 1996, Wetzel & Allia 2003, Lauper et al. 2018; Fig. 4‑31a). During storm events, continental detritus and bioclastic elements were inferred to have been mobilised, reworked, and transported into the basin. In this model, coarser and finer lithologies reflect more proximal and distal tempestites, respectively. Depending on the position relative to the storm-wave base and bathymetry, facies and thickness variations developed. Modern analogues can be found in the North Sea and the Baltic Sea (Aigner & Reineck 1982, Milkert 1994, Wetzel & Allia 2003).
Recently, alternative depositional models have been postulated, including drift deposits (Zimmerli et al. 2024; Fig. 4‑31b). Drift deposits are in general fine-grained sedimentary bodies that develop due to the interaction of continuous bottom currents and bathymetry of the sea floor. Potential past analogues of such drift deposits exist, albeit in deeper settings, in the hemipelagic Early Jurassic Laurasian Seaway in the Cardigan Bay Basin, UK (Pieńkowski et al. 2021) or in the deposits of the Upper Jurassic/Lower Cretaceous Vaca Muerta Formation in the Argentine Neuquén Basin (Paz et al. 2022). Muddy shallow-water drifts (ca. 150 – 300 m) can for example be found on the south-western shelf of Mallorca (Verdicchio & Trincardi 2008, Vandorpe et al. 2011). The evidence for the occurrence of drift deposits on top of the Opalinus Clay below the «Herrenwis Unit» in a similar general setting (Section 4.2.7.5) supports the importance of currents for sediment transport and deposition in the environment of the Opalinus Clay.
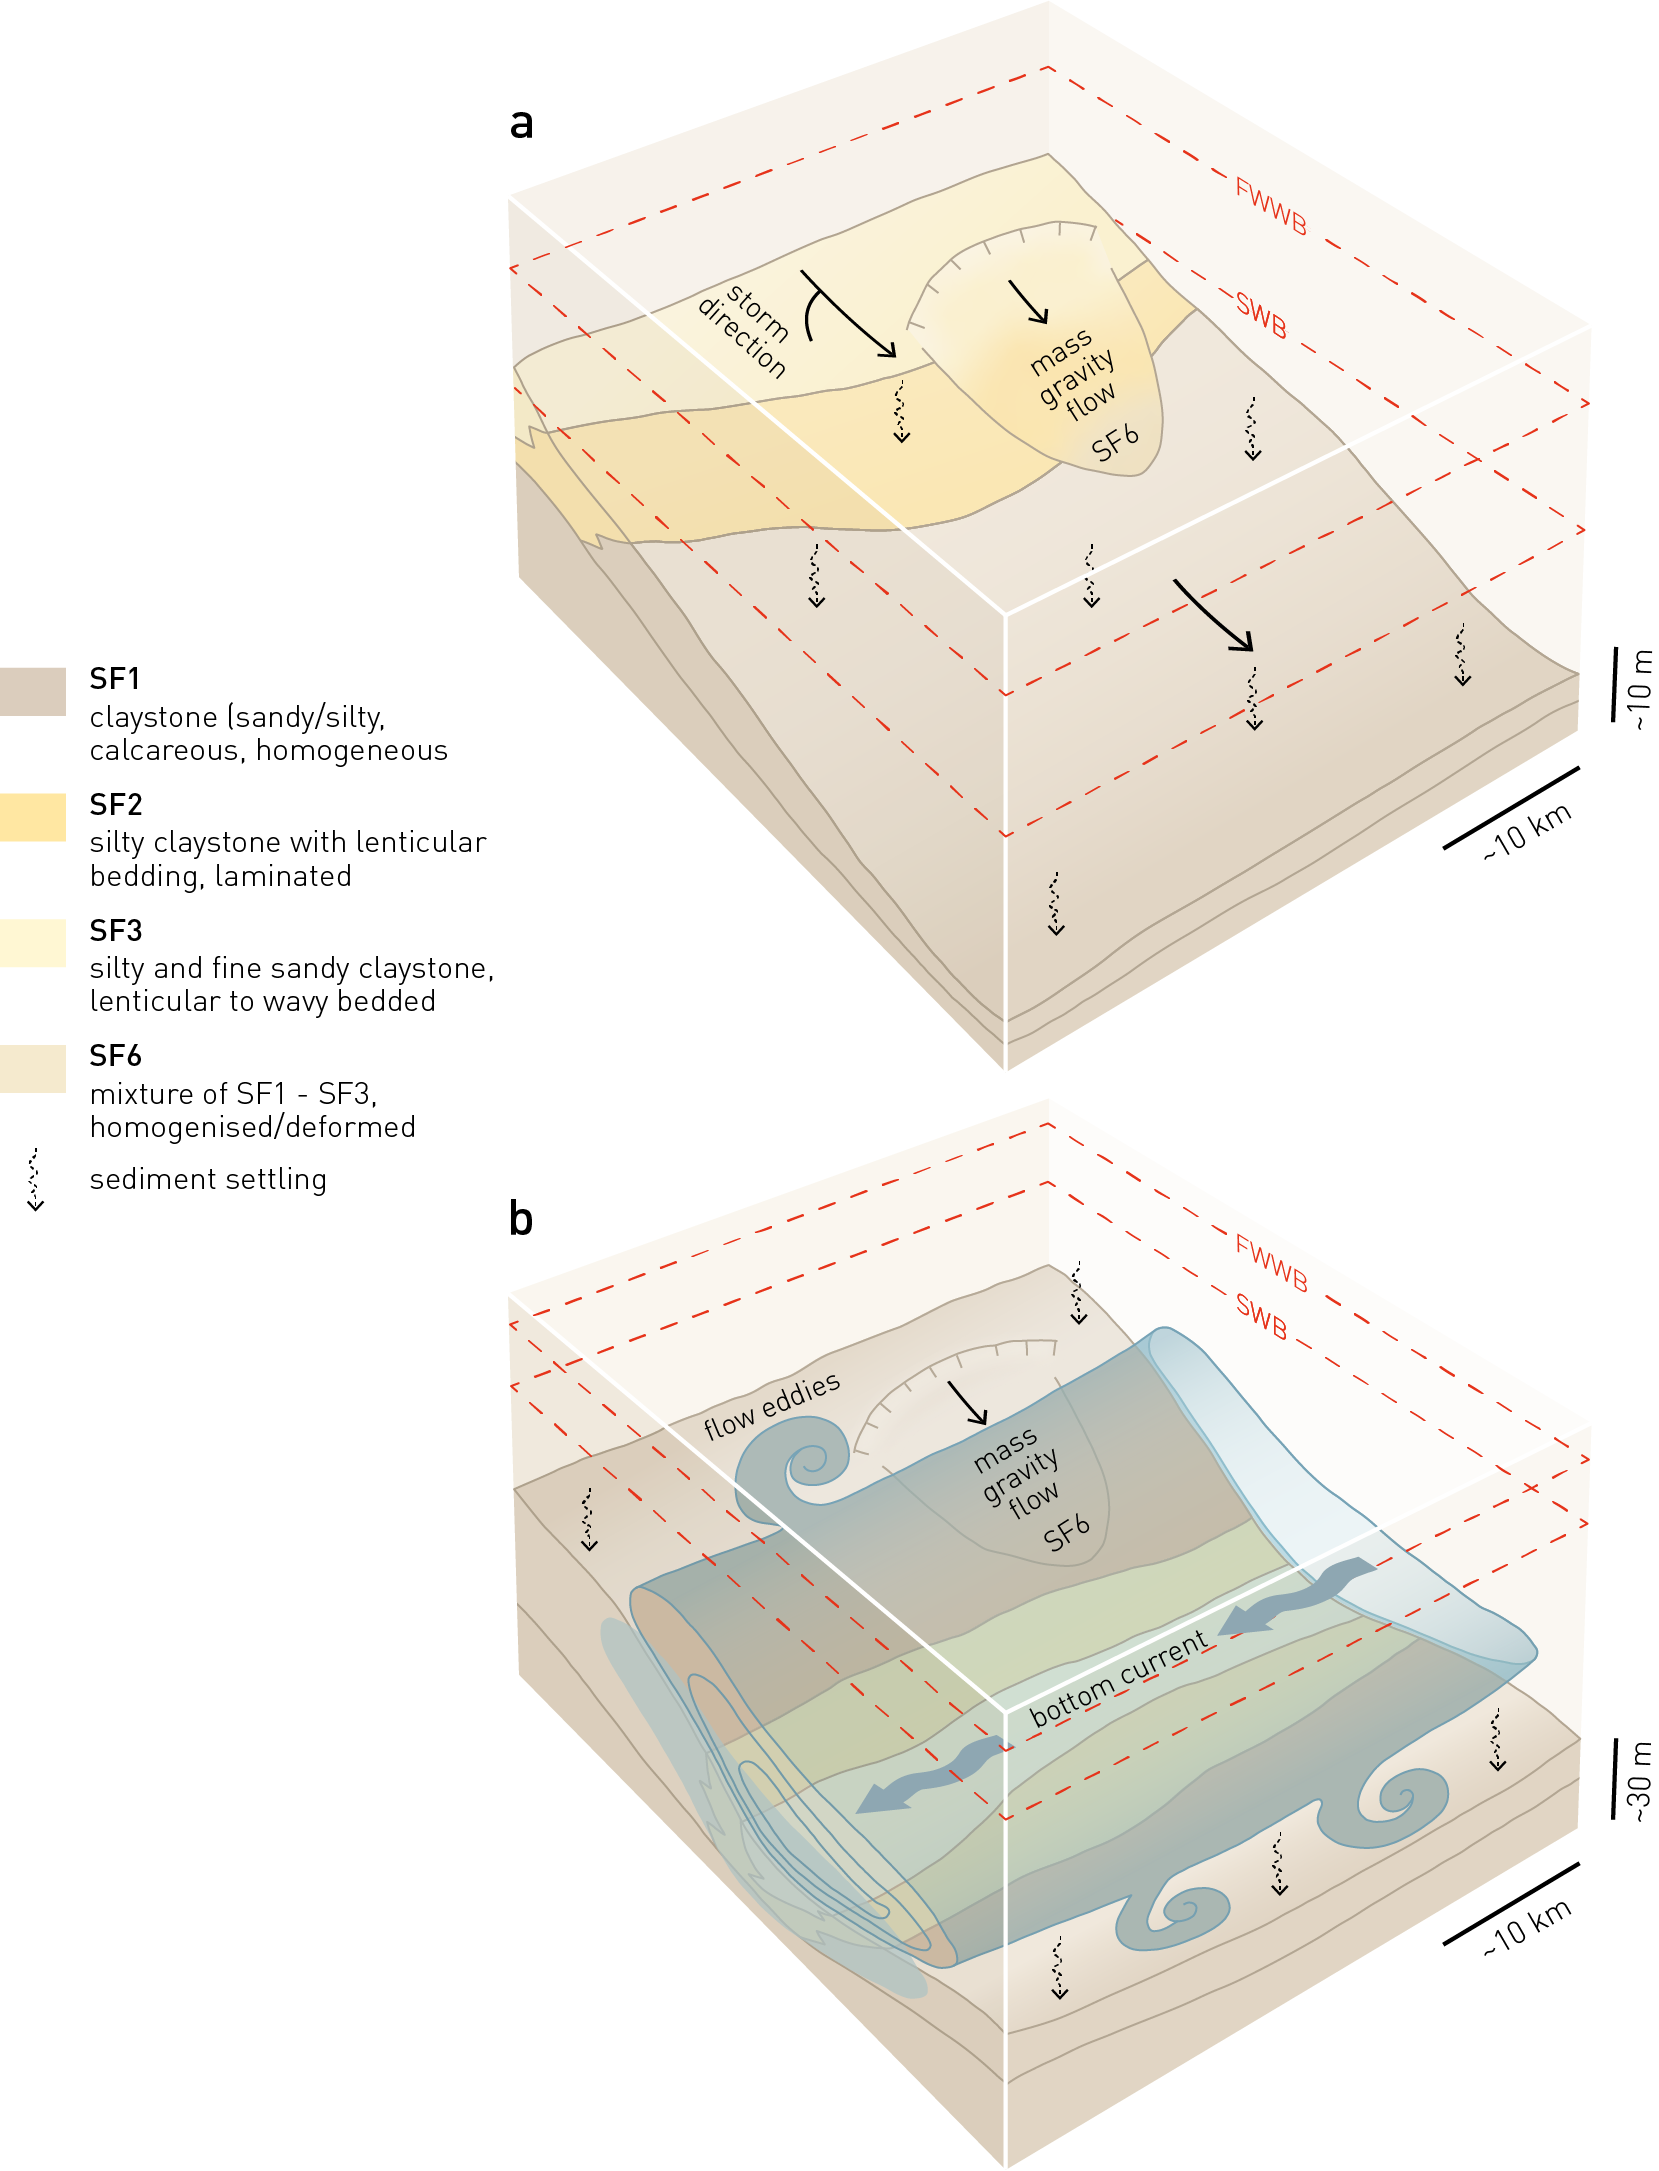
Fig. 4‑31:Block diagrams showing depositional models of the Opalinus Clay in Northern Switzerland
Sediment transport dominated by (a) storm events (tempestites) or (b) bottom currents (drift deposits). The depositional models are inspired by investigations of Lauper et al. (2018), Rebesco et al. (2014), Wetzel & Allia (1996, 2003) and Zimmerli et al. (2024). SF: subfacies, FWWB; fair-weather wave base, SWB; storm wave base.
The sedimentary units of the Dogger Group that directly overlie the Opalinus Clay form the lowermost and most important part of the upper confining units (Section 4.5.3.5). They were deposited in the Middle Jurassic. At this time, Central Europe was affected by the development of the Piemont – Liguria Ocean, resulting in large-scale N-S-directed extension leading to subsidence (Chapter 3). The Dogger Group above Opalinus Clay was deposited in a shallow epicontinental sea with some lateral and vertical facies variability (Fig. 4‑32).
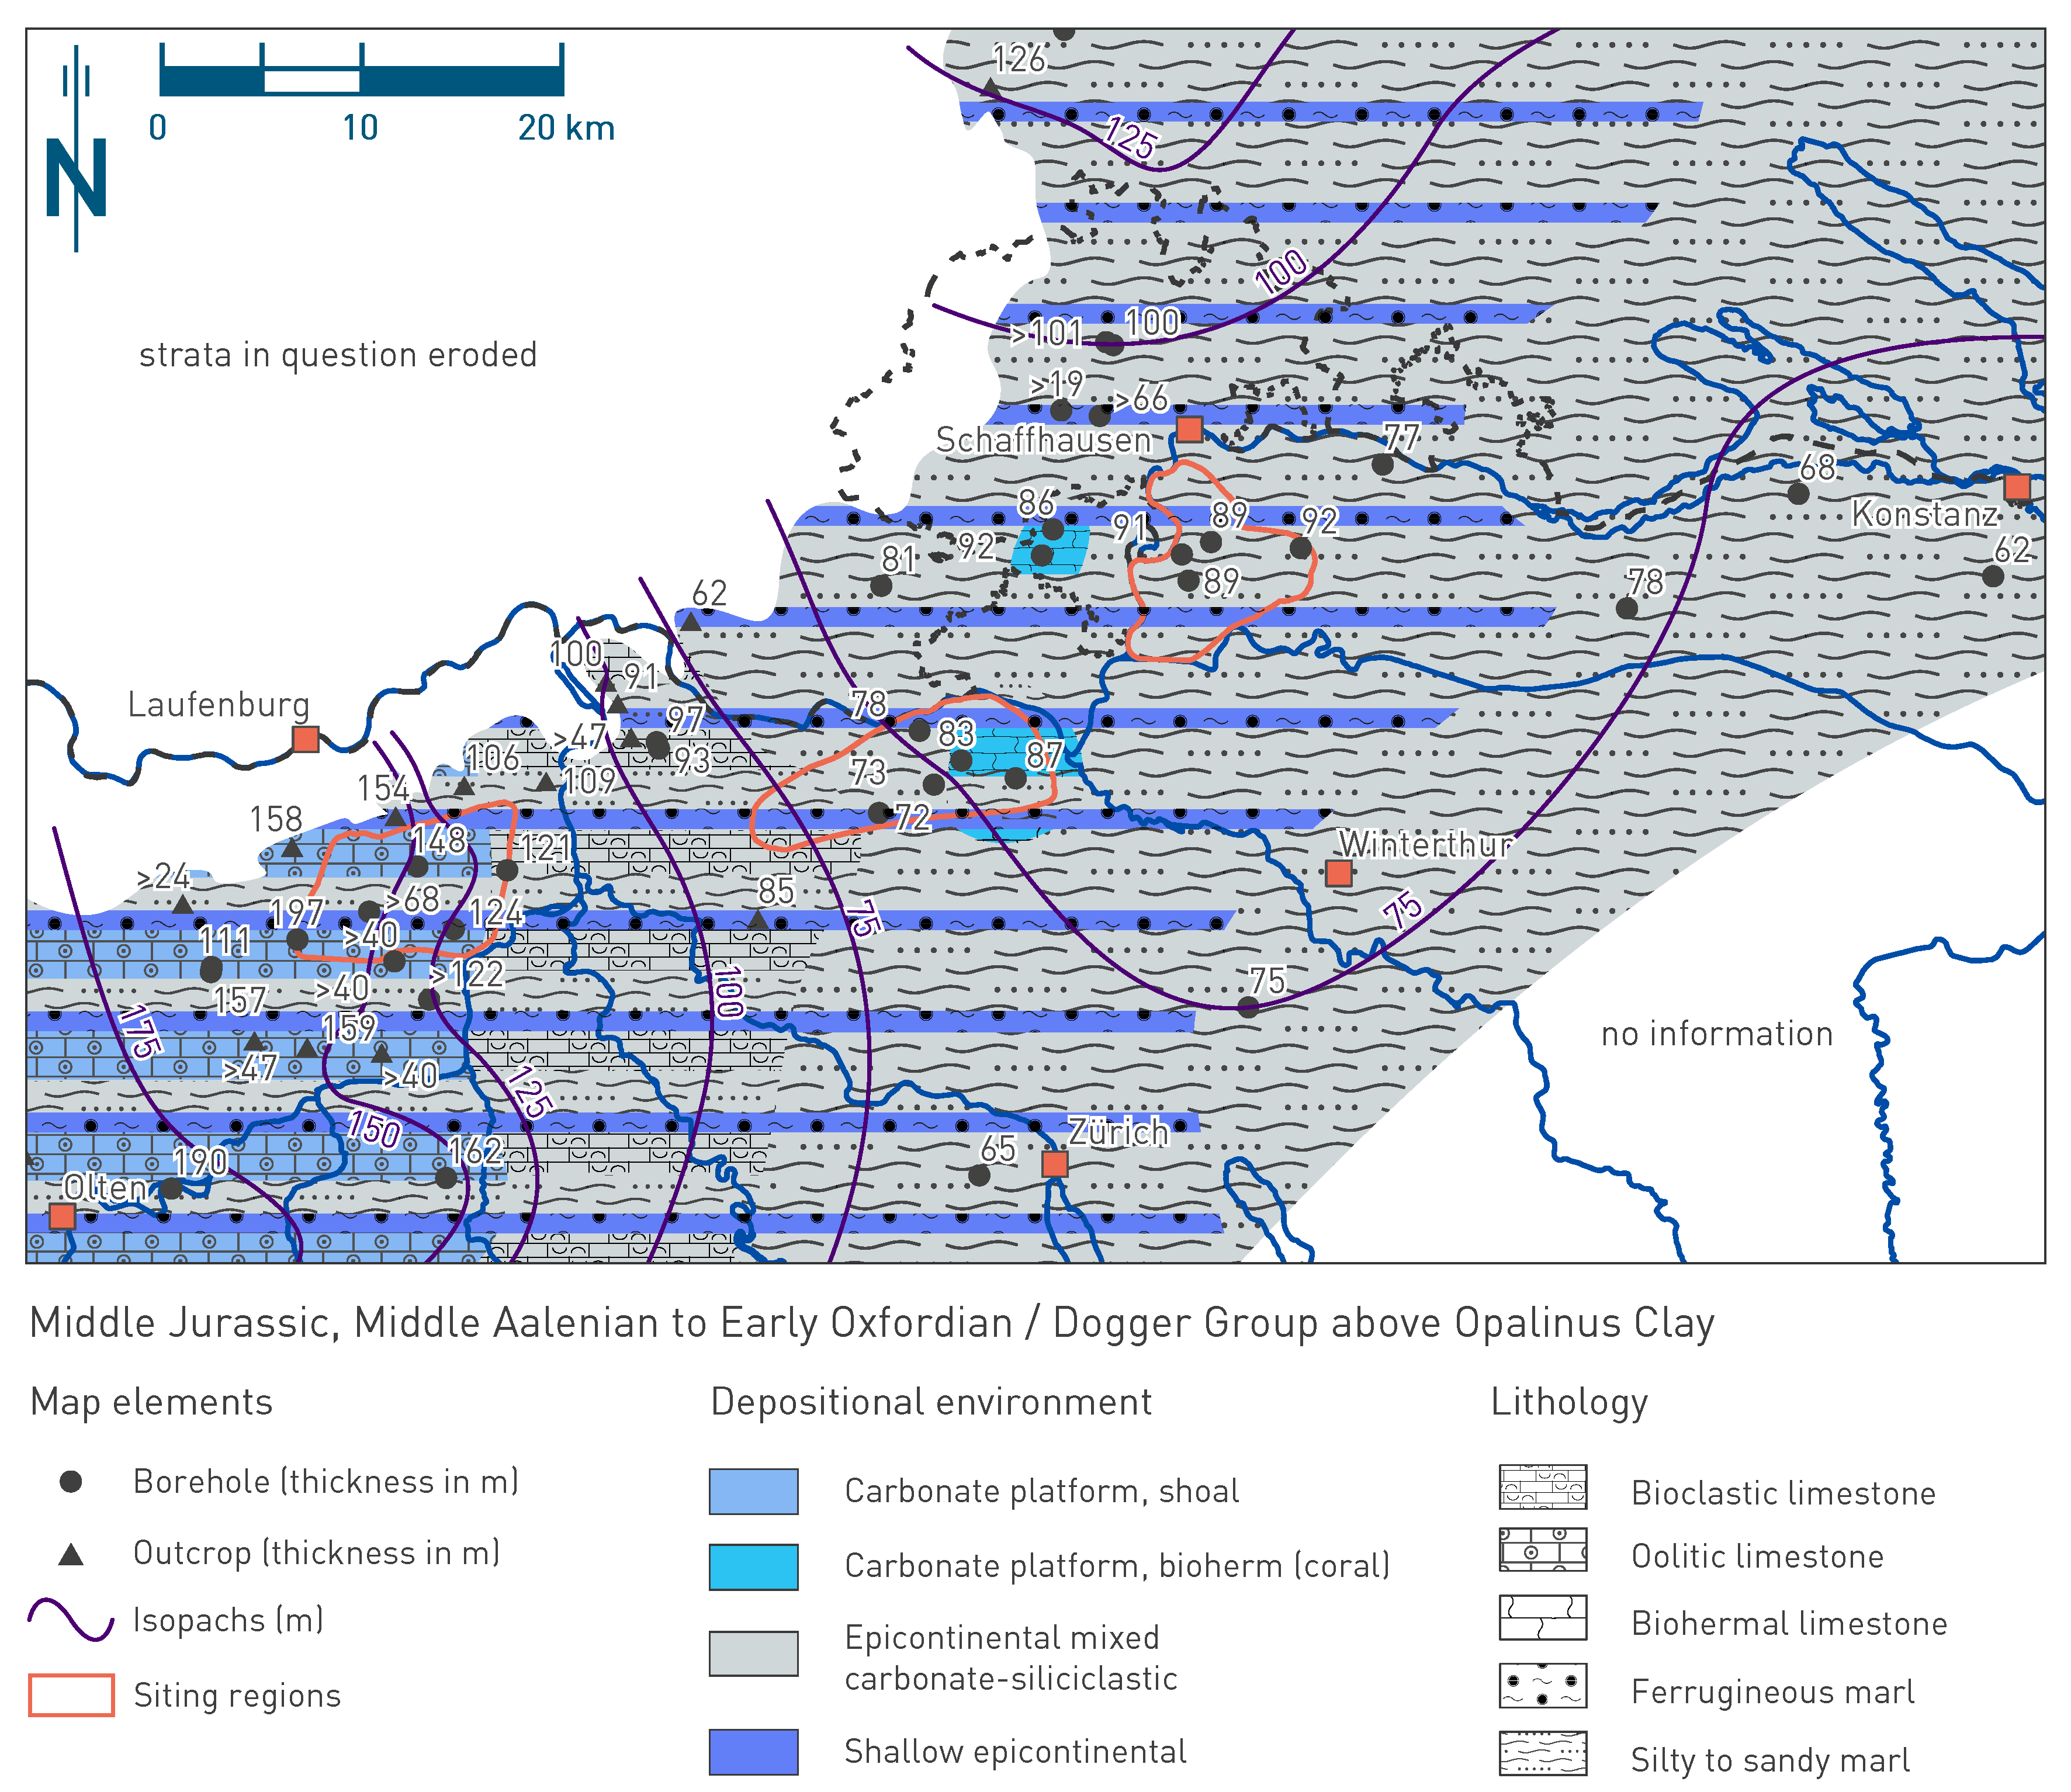
Fig. 4‑32:Map of depositional environments during the Middle Jurassic (Middle Aalenian to Early Oxfordian) preserved in the Dogger Group above Opalinus Clay
Refer to Fig. 4‑3 for a schematic representation of depositional environments. The north arrow refers to present-day geographic north. Map shows the setting during the time interval 170.9_Aal_300 to 154.8_Oxf_975 as discussed in the text.
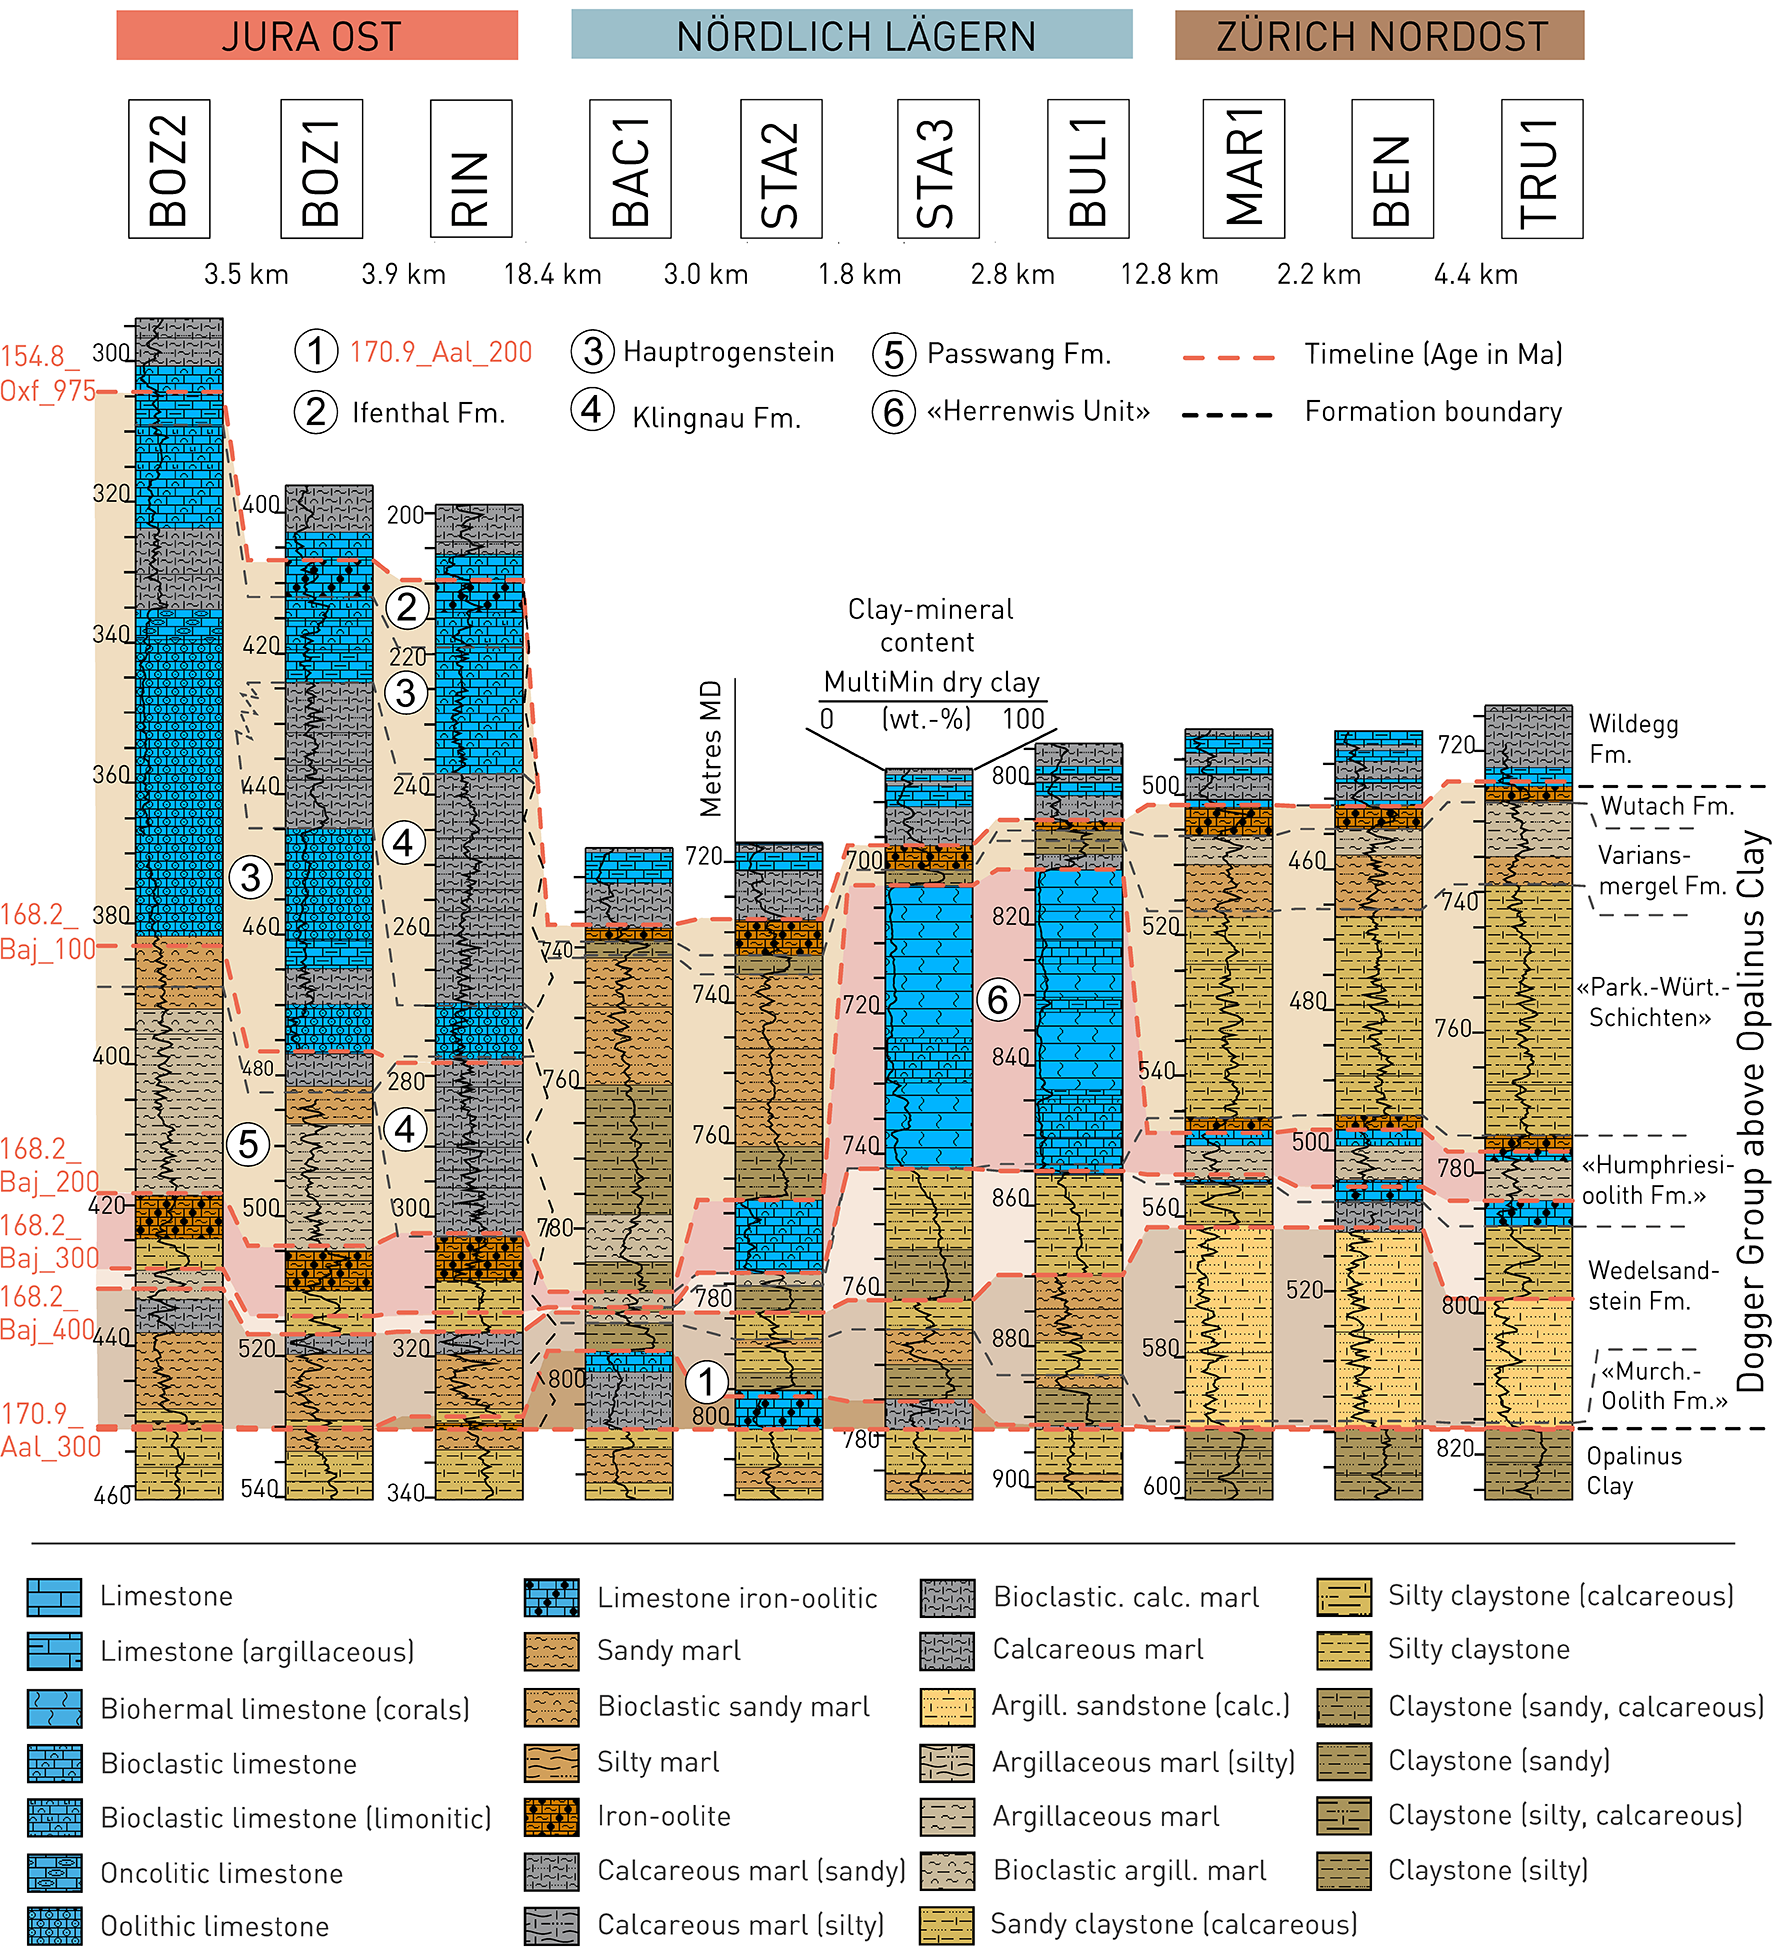
Fig. 4‑33:Stratigraphic borehole correlation of the units of the Dogger Group above Opalinus Clay
For lithological nomenclature refer to Naef et al. (2019). Clay-mineral content after Becker & Marnat (2024). Some of the boundaries and lithologies as discussed in the original reports were adjusted to integrate all presented borehole data.
For the Dogger Group above Opalinus Clay, a different lithostratigraphic nomenclature is used for the JO compared to the NL and ZNO siting regions (Fig. 4‑33, Fig. 4‑34, Fig. 4‑35). In the lower part this is partly because of historical reasons (e.g. Bläsi et al. 2013). In the middle part, a general facies trend from a more proximal to distal setting relative to the Celtic Platform (Fig. 3‑9) emphasises the usefulness of different nomenclature (Fig. 4‑32). In the upper part, starved sedimentation dominates in the three siting regions. The lithostratigraphy of the Dogger Group above Opalinus Clay integrates several informal units (marked with chevrons) and will likely be revised in the near future.
With the exception of the Hauptrogenstein and the «Herrenwis Unit», the Dogger Group above Opalinus Clay consists mostly of silty to sandy claystone (partly calcareous) and argillaceous, calcareous to silty or sandy marl (Fig. 4‑36). Intercalated in these clay-mineral-rich sedimentary rocks are single or successions of more weathering-resistant "hard beds" (Bläsi et al. 2013). In general, three types of "hard beds" can be distinguished that are mainly based on their lithology: 1) biomicritic limestone, 2) silty to sandy, bioclastic limestone, and 3) iron-oolite or iron-oolitic beds.
Dogger Group above Opalinus Clay in JO
In JO the Dogger Group above Opalinus Clay starts with the Passwang Formation (Burkhalter 1996). It consists mostly of silty claystone, argillaceous siltstone and silty to sandy marl with non-porous, calcareous and iron-oolitic interbeds. Its thickness decreases from ca. 60 m (BOZ2) in the west to ca. 30 m (Riniken borehole, RIN) in the east (Fig. 4‑33). The Passwang Formation is overlain by the strata of the carbonate platform of the Hauptrogenstein (Gonzalez & Wetzel 1996), which mostly consist of bedded oolitic and bioclastic limestone and some calcareous marl. The Hauptrogenstein platform interfingers towards the east with its more basinal counterpart of the Klingnau Formation. The composite thickness of the Hauptrogenstein decreases from ca. 80 m (BOZ2) in the west to 26 m (RIN) in the east. The Klingnau Formation consists mostly of calcareous and argillaceous marl. It is classified as a formation, but only if it reaches a thickness of > 15 m (Nagra (ed.) 2022a, Dossier IV) and has a composite thickness of ca. 60 m in the east (RIN). The Dogger Group above Opalinus Clay is completed with the Ifenthal Formation (Bitterli-Dreher 2012), which consists of a 5 – 10 m thick succession of partly iron-oolitic limestone and calcareous marl.
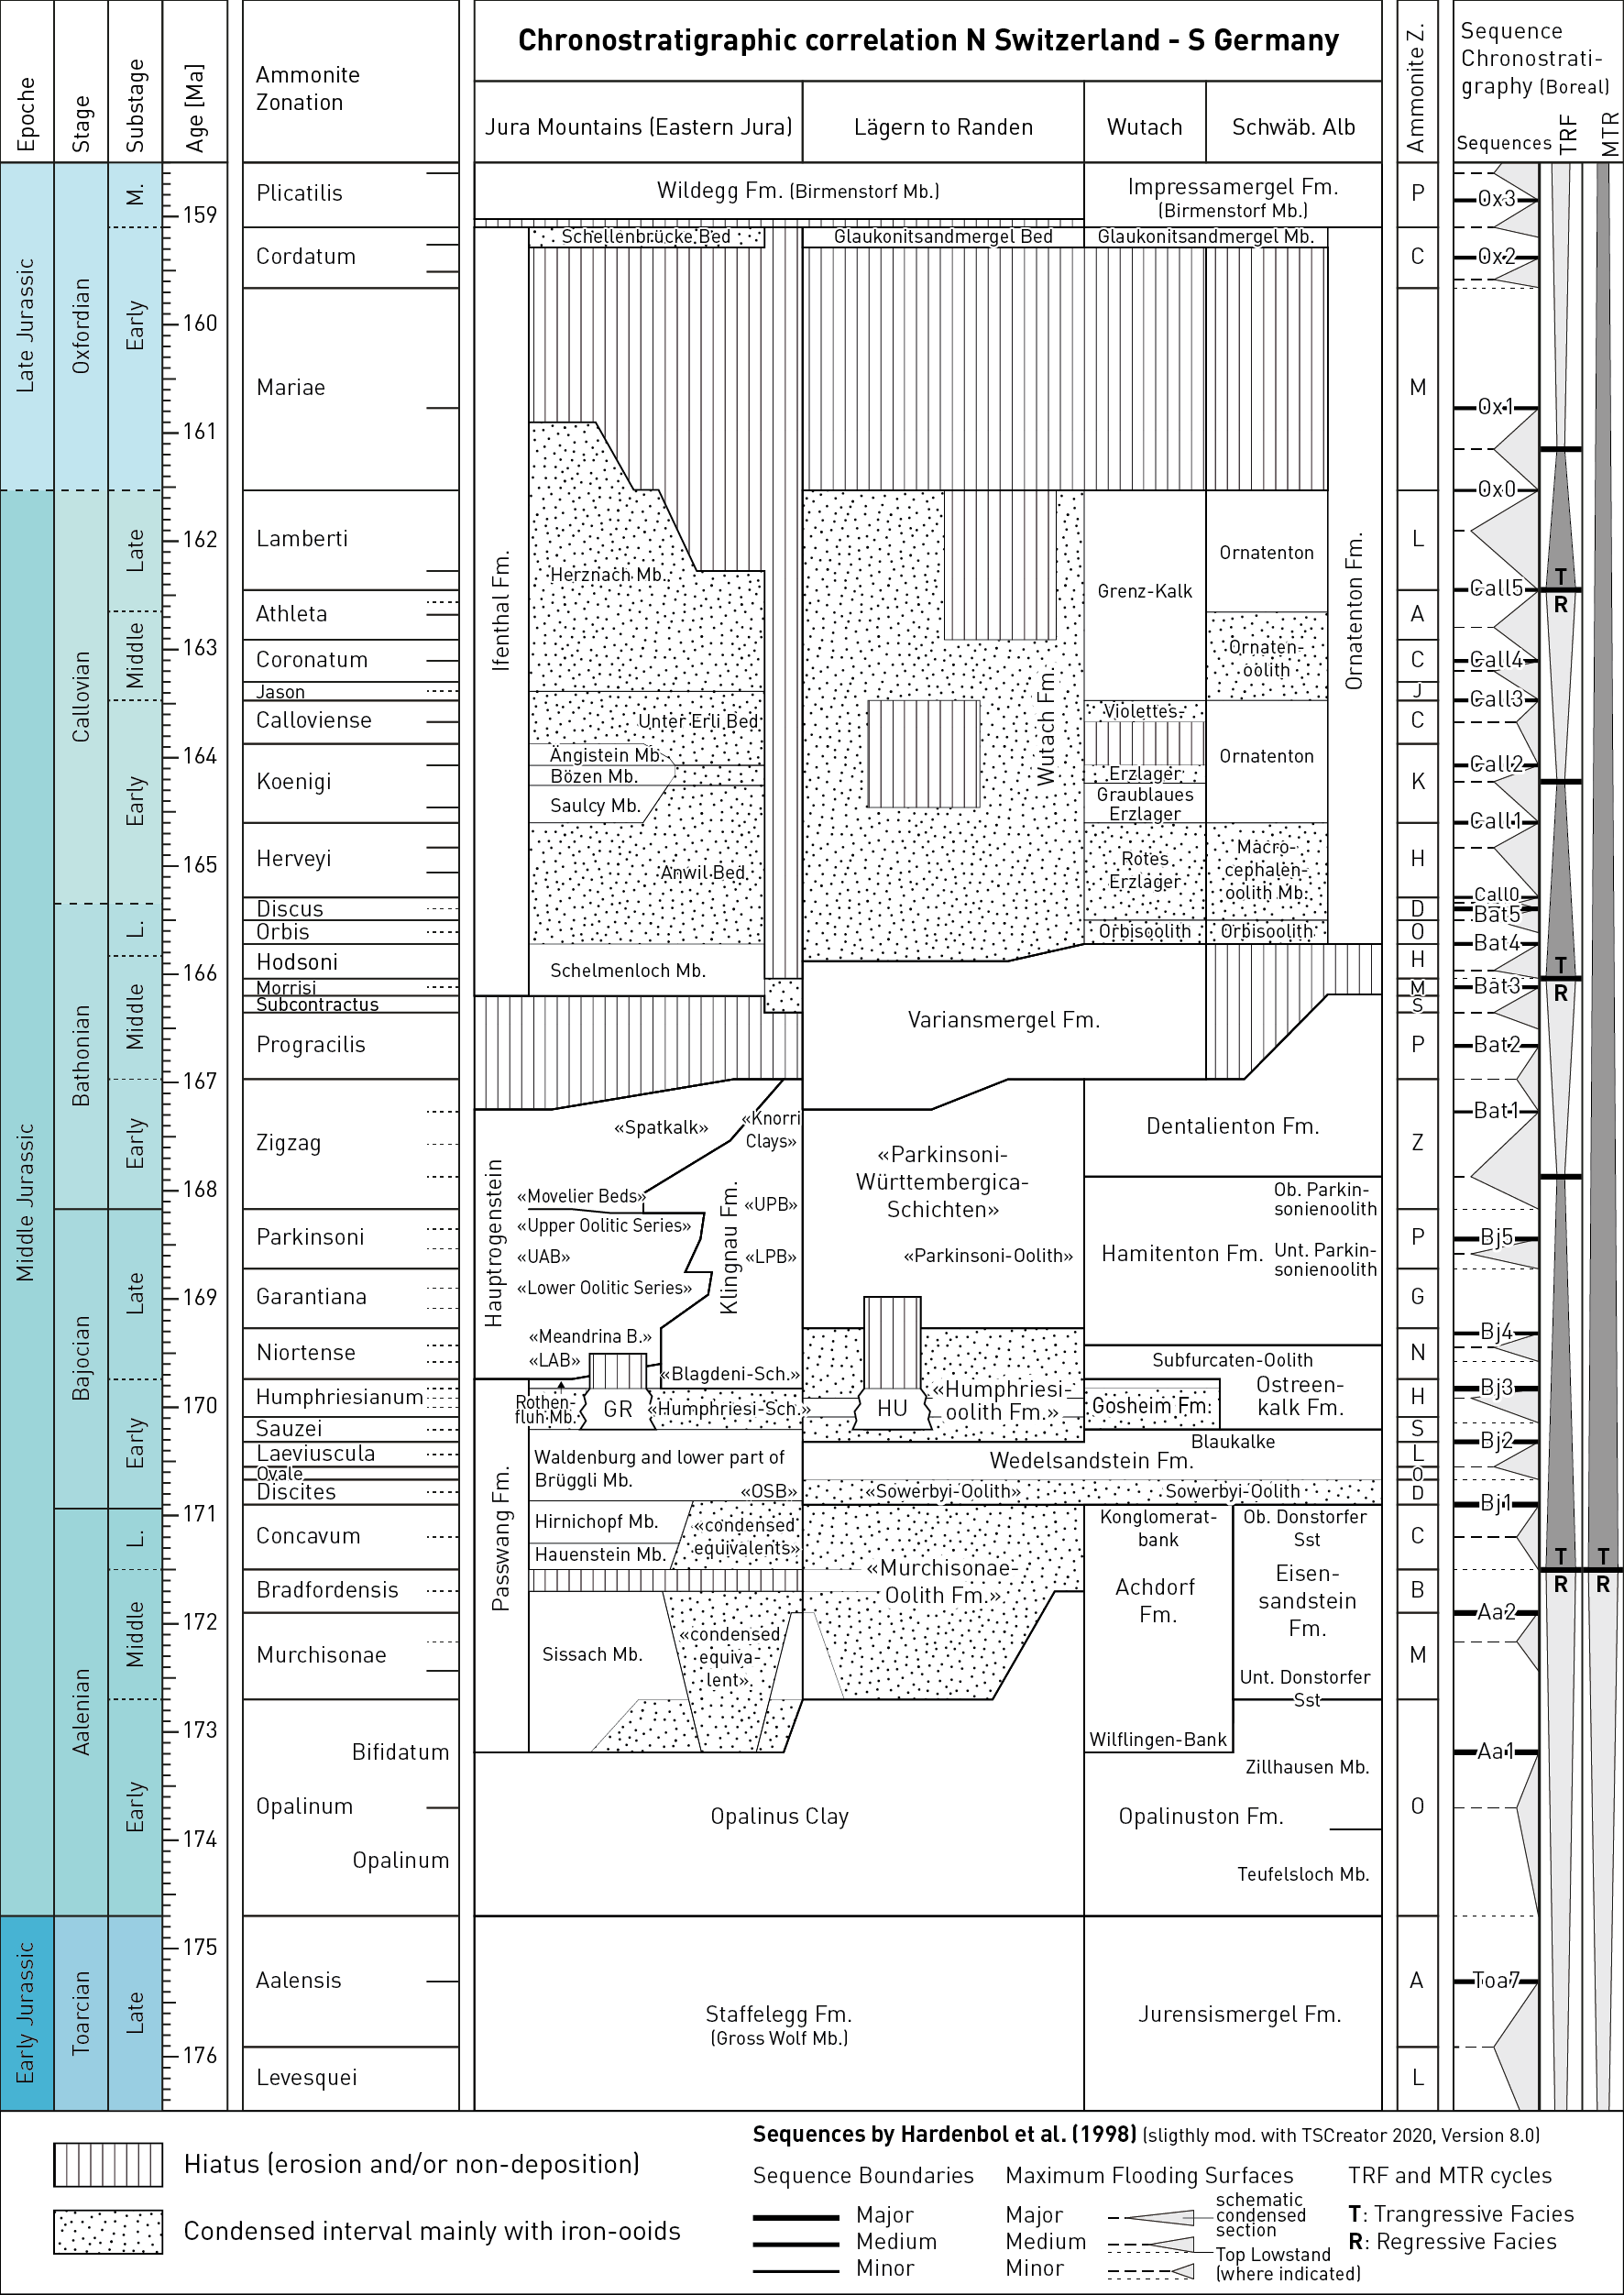
Fig. 4‑34:Stratigraphy of the Middle Jurassic of Northern Switzerland and the correlation with neighbouring Southern Germany
For figure explanations see next page.
Chronostratigraphy is based on the chronostratigraphic chart of the International Commission of Stratigraphy, v. 10/2020, Hesselbo et al. (2020) and TSCreator 2020 (Version 8.0); Ammonite zonation after Cariou & Hantzpergue (1997), Dietze et al. (2011, 2014, 2021); sequence chronostratigraphy and nomenclature are after Hardenbol et al. (1998) and slightly modified using TSCreator 2020 (Version 8.0). German stratigraphy after Bloos et al. (2006), Dietl (2006, 2007, 2008, 2010), Franz & Nitsch (2009). Abbreviations: L. = Late, M. = Middle, Fm. = Formation, Mb. = Member, B. = Beds, LAB = «Lower Acuminata Beds», UAB = «Upper Acuminata Beds», OSB = «Obere Sublata-Bank», LPB = «Lower Parkinsonien Bank», UPB = «Upper Parkinsonien Bank», GR = Gisliflue Reef, Sch. = Schichten, HU = «Herrenwis Unit», Unt. = Untere(r)/Lower, Ob. = Obere(r) /Upper, Sst = Sandstein/Sandstone, Z. = Zonation, TRF = Transgressive-Regressive Facies Cycles, MTR = Major Transgressive-Regressive Cycles. Modified after Bläsi et al. (2013) and Meier & Deplazes (2014).
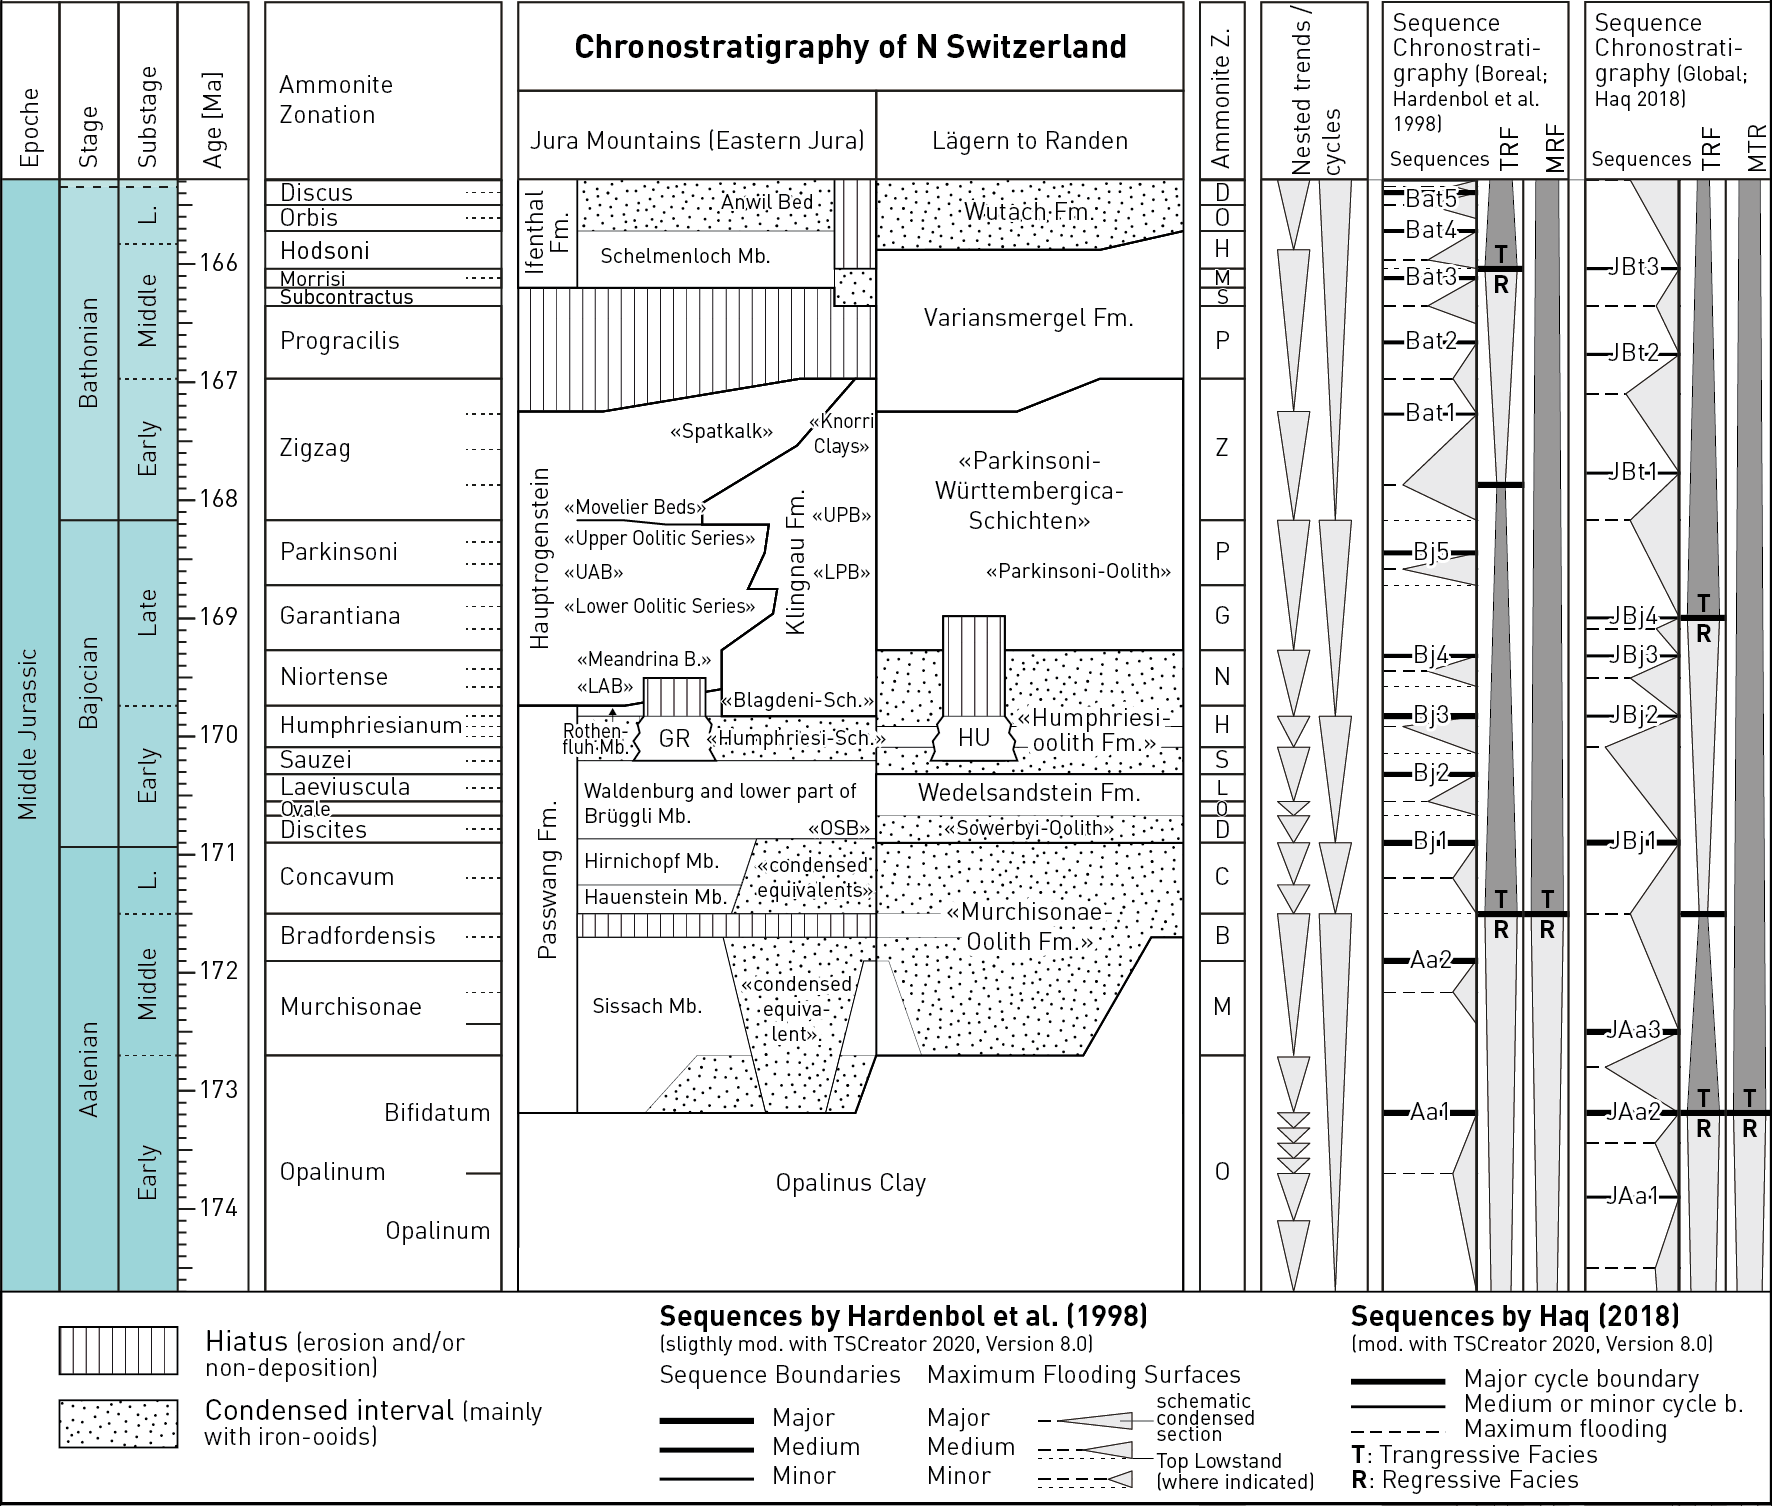
Fig. 4‑35:Biostratigraphy and lithostratigraphy of the Middle Jurassic (Aalenian to Bathonian) of Northern Switzerland with sequence stratigraphic correlation
Biostratigraphy and lithostratigraphy based on Bläsi et al. (2013) and Meier & Deplazes (2014). Chronostratigraphy is based on the chronostratigraphic chart of the International Commission of Stratigraphy, v. 10/2020, Hesselbo et al. (2020) and TSCreator 2020 (Version 8.0); Ammonite zonation after Cariou & Hantzpergue (1997), Dietze et al. (2011, 2014, 2021); Sequence chronostratigraphy and nomenclature after Hardenbol et al. (1998), Haq (2018) and slightly modified using TSCreator 2020 (Version 8.0). Abbreviations: refer to Fig. 4‑34.
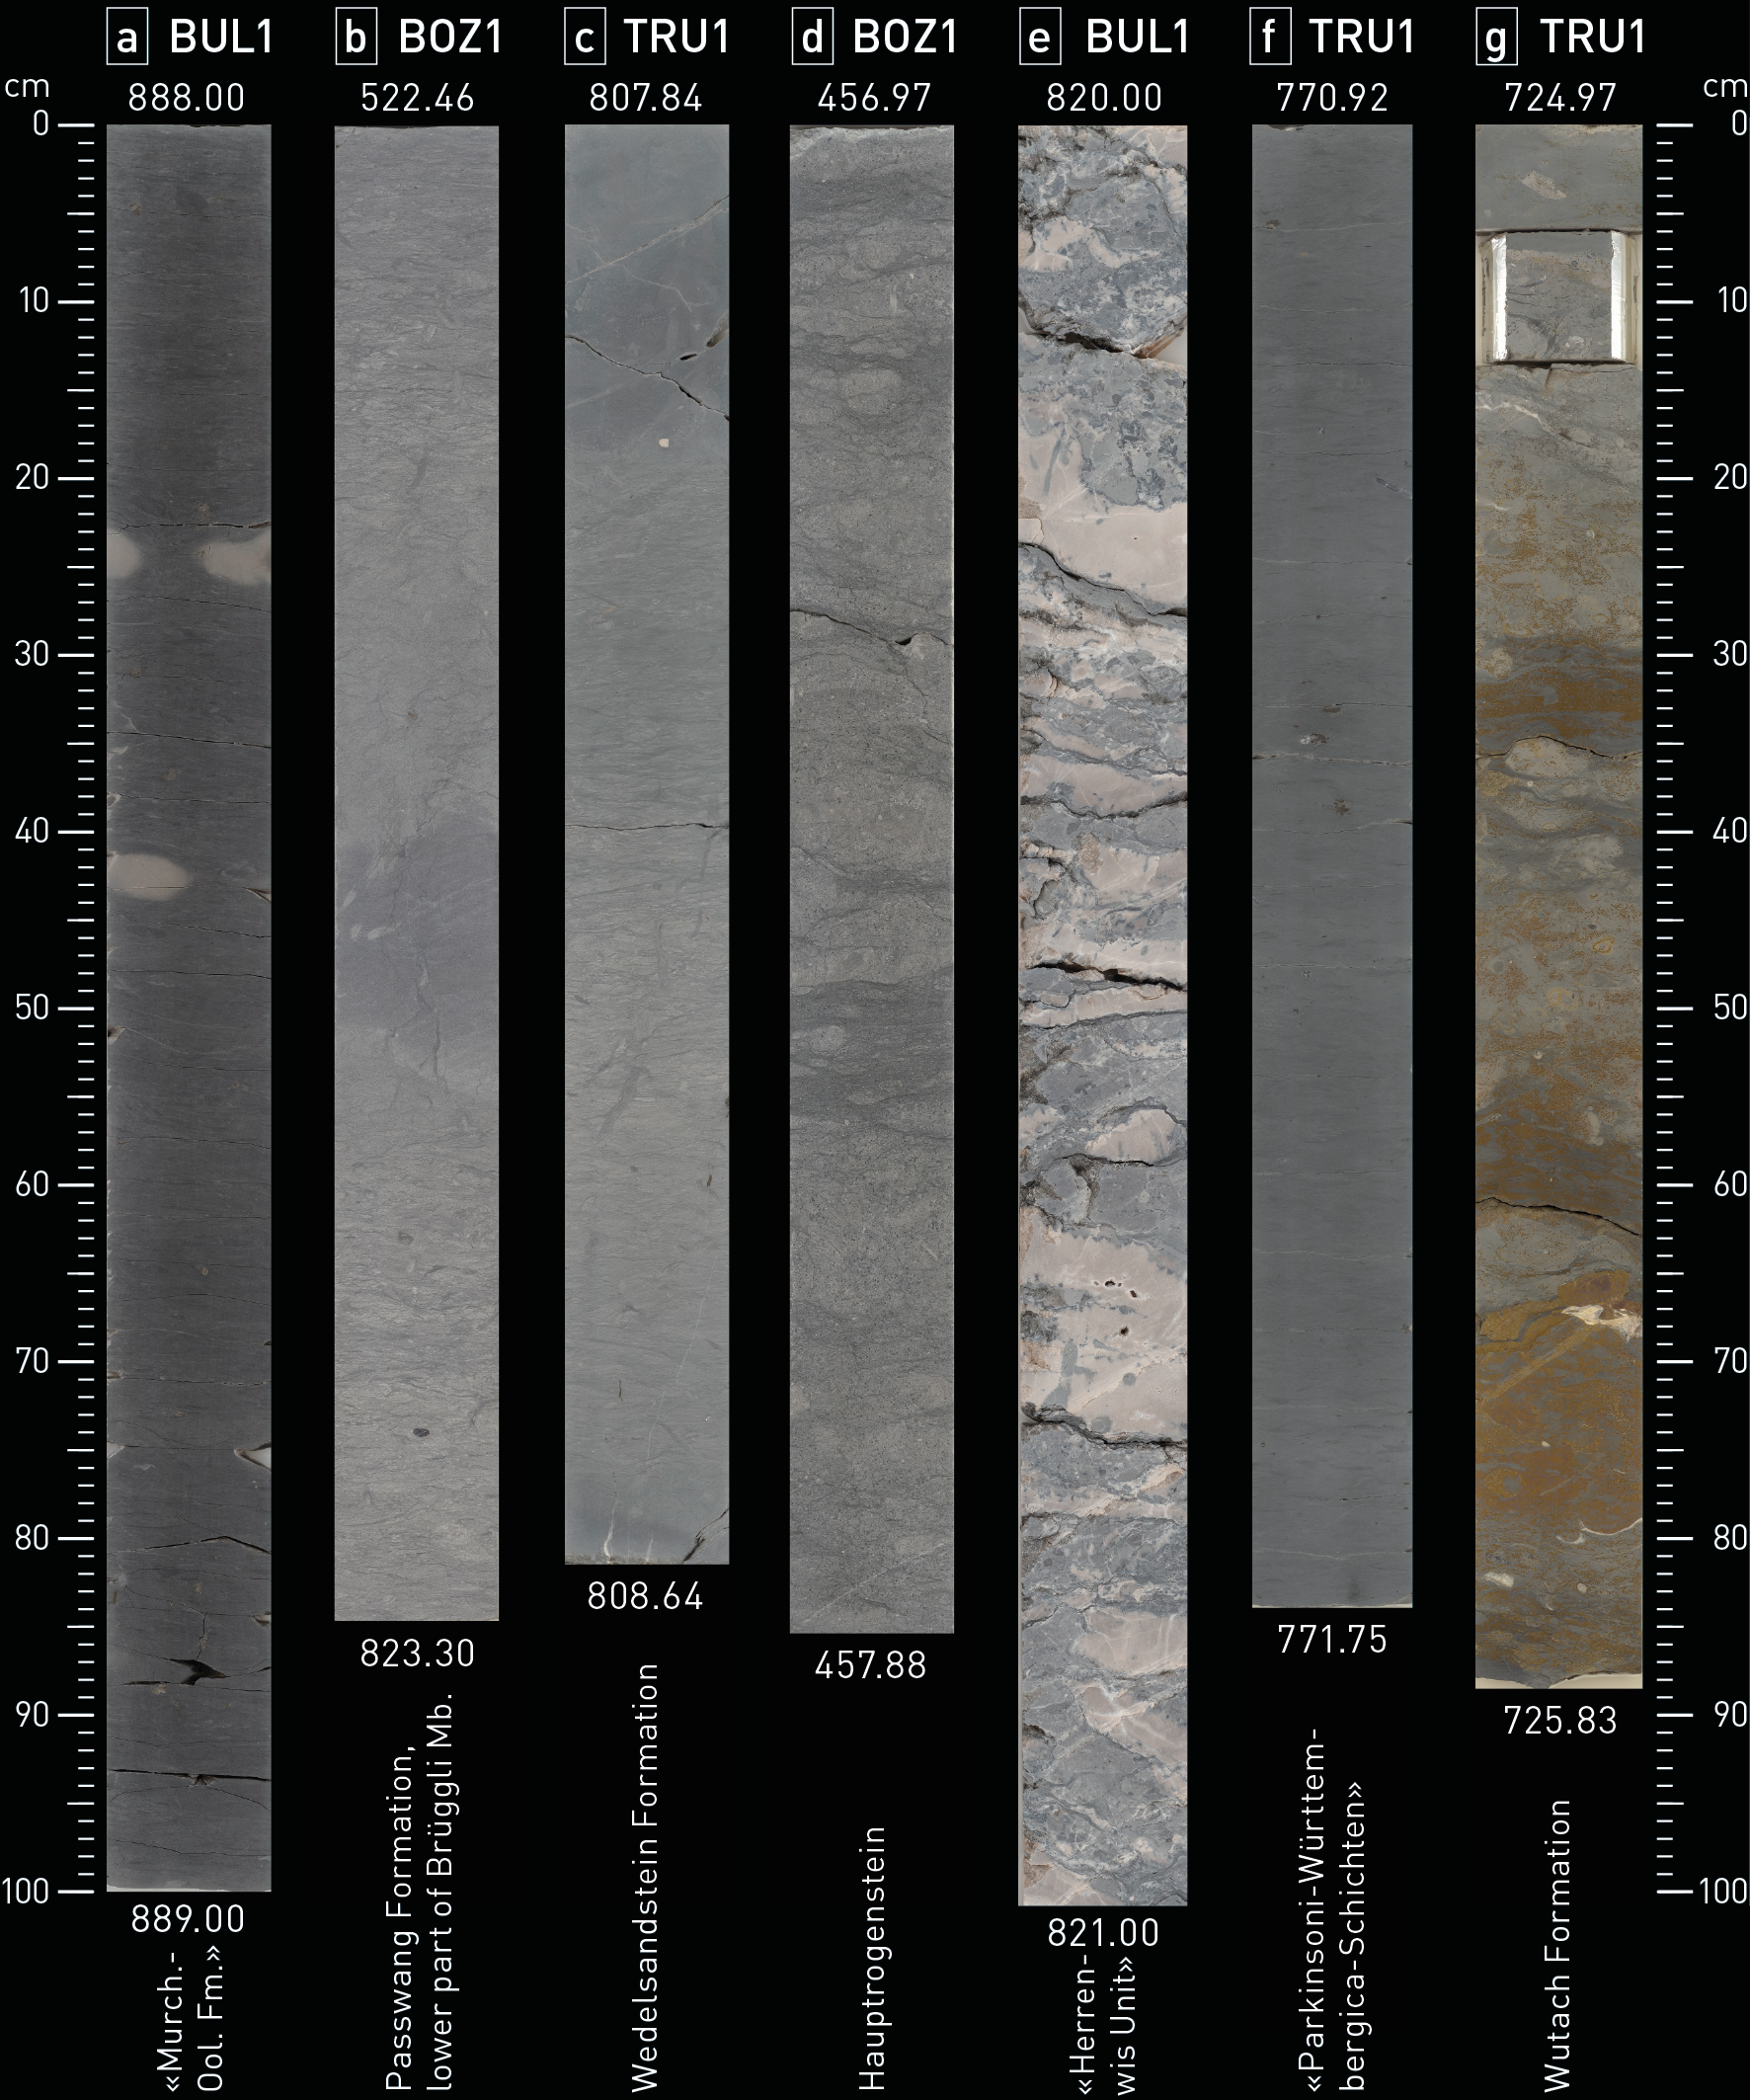
Fig. 4‑36:Selected core photos of the Dogger Group above Opalinus Clay (slabbed cores)
(a) Dark grey, silty to sandy claystone with siderite nodules; (b) light grey, silty to sandy limestone, bioclastic and bioturbated, and dark grey silty marl, bioturbated; (c) dark grey sandy limestone, bioclastic, bioturbated, and dark grey sandy marl, bioturbated; (d) light grey oolitic limestone, bioclastic, irregularly wavy bedded, ooids with black coatings and with interbeds of medium grey calcareous marl; (e) beige grey (matrix) to pale pink (corals) coral limestone, fossiliferous matrix (echinoderms, bivalves), corals often bored and few vugs; (f) dark grey silty claystone (calcareous), moderately fossiliferous (e.g. belemnites), pyrite; (g) repeated gradual transition of light grey iron-oolitic limestone to dark grey, iron-oolitic marl, reddish brown iron-ooids, very fossiliferous (esp. oysters).
In JO, the Dogger Group above Opalinus Clay can be subdivided into the following units:
«Condensed equivalents of the Sissach Member, Hauenstein Member and/or Hirnichopf Member»: In JO, the lowermost members of the Passwang Formation are condensed and only up to ca. 2 m thick. They consist of undulating, fossiliferous, iron-oolitic and calcareous hardgrounds (Wohlwend et al. 2019).
Waldenburg Member and lower part of Brüggli Member: These two members are treated as one ca. 20 – 25 m thick stratigraphic unit (Wohlwend et al. 2019), which can be subdivided into two parts in the boreholes of JO. The lower and larger part consists mostly of silty to sandy marl with numerous dm- to m-scale beds of mainly bioturbated, partly bioclastic, silty to sandy limestone (Fig. 4‑36b). The facies and thickness of the dm- to m-scale beds show nested trends, which are at least partly cyclic in nature. These trends or cycles can generally be correlated within JO (Fig. 4‑37). Based on thin sections of the TBO campaign, these beds show no elevated porosity. Towards the upper part, silty claystone with some interbeds of partly iron-oolitic limestone dominate.
«Humphriesi-Schichten» (upper part of Brüggli Member): This ca. 5 m thick unit is a prominent marker unit in the upper part of the Passwang Formation (Bläsi 1987, Wohlwend et al. 2019). It consists of fossiliferous iron-oolitic limestone and marl that stand out because of their reddish colour (Fig. 4‑37).
Rothenfluh Member: This lithostratigraphic unit is part of the Passwang Formation, where it is overlain by Hauptrogenstein (BOZ2 and BOZ1); outside the platform, the equivalent unit becomes part of the Klingnau Formation (RIN) (Gonzalez & Wetzel 1996). The Rothenfluh Member consists of an alternation of mostly bioclastic argillaceous, silty to sandy marl with decimetre-scale, partly nodular beds of bioclastic limestone.
Klingnau Formation: This unit consists mostly of fossiliferous, often nodular, calcareous, and argillaceous marl with some decimetre-scale beds of limestone. Sparse calcareous ooids are evidence of the adjacent oolitic facies of the Hauptrogenstein from which they were transported.
Hauptrogenstein: This formation was subdivided into up to eight informal subunits (Schmassmann 1945, Gonzalez & Wetzel 1996). In JO only the easternmost part of the strata of the Hauptrogenstein carbonate platform is encountered and – depending on the interfingering with the Klingnau Formation – a different succession of lithostratigraphic units can be distinguished. In general, the lower and larger part decreases in total thickness from 54 m in the west (BOZ2) to ca. 8 m in the east (RIN). It is characterised by predominantly oolitic and bioclastic limestone (Fig. 4‑36d) with dm- to m-scale beds of sandy marl in the lowermost section, otherwise calcareous marl with some ooids dominates. The ooids show typically black coatings. In BOZ2 the upper part of the Hauptrogenstein consists of «Movelier Beds», the lateral equivalent of the Klingnau Formation in BOZ1, and «Spatkalk» with a total thickness of 26 m; in BOZ1 and RIN only «Spatkalk» with a thickness of 12 m and 18 m is present. These units consist of bioclastic calcareous marl, bioclastic limestone and limonitic bioclastic limestone with some iron-ooids towards the top.
Ifenthal Formation: This formation was subdivided into several members by Bitterli-Dreher (2012). However, most of the members seem to be condensed in the study area. In JO, the lower part is characterised by fossiliferous limestone and bioclastic calcareous marl with some iron-ooids. This lower part may correspond to the Schelmenloch Member. The upper part is characterised by iron-oolite and iron-oolitic limestone with several hardgrounds (Fig. 4‑34).
Fig. 4‑37:Detailed correlation of the sedimentary succession directly above the Opalinus Clay in boreholes of JO
In the formation microresistivity imaging (FMI) data, more conductive lithologies appear darker (e.g. claystone), whereas more resistive lithologies appear lighter (e.g. limestone or sandstone).
Dogger Group above Opalinus Clay in NL and ZNO
In NL and ZNO, the Dogger Group above Opalinus Clay starts with the «Murchisonae-Oolith Formation». The thickness decreases from western NL (ca. 15 m) to eastern NL (7 m) and is condensed in ZNO (≤ 1 m) (Fig. 4‑33). It consists of several nested trends or cycles of claystone, siltstone, marl, limestone and iron-oolite. Some of these nested facies trends might be similar to the ‘coarsening-upward’ or ‘shallowing upward’ successions as described by Burkhalter (1996). Some of these nested trends seem to correspond to boreal or global sequences as proposed by Hardenbol et al. (1998) or Haq (2018) (Fig. 4‑35).
In NL, the overlying Wedelsandstein Formation increases significantly in thickness from the west (2 m in BAC1) to the area where it underlies the «Herrenwis Unit» in eastern NL (28 m in BUL1). It mainly comprises claystone and silty claystone with a few decimetre-scale calcareous beds. In ZNO, the thickness varies between ca. 25 and 35 m and mainly consists of silty marl and argillaceous siltstone with many beds of argillaceous, silty to sandy limestone (Fig. 4‑33).
The following «Humphriesioolith Formation» is only up to 2 m thick in NL and consists predominantly of iron-oolitic to limonitic, argillaceous to calcareous beds. In ZNO this formation reaches a thickness of ca. 10 – 13 m and consists in the lower and upper part of iron-oolitic and bioclastic limestone to marl and iron-oolite and, in the middle part, of calcareous to argillaceous marl.
The «Herrenwis Unit» is found only in the eastern part of NL. It consists of ca. 40 m thick strata associated with an isolated carbonate platform that is embedded in argillaceous strata (Fig. 4‑33) and extends over several square kilometres. It consists in STA3 and BUL1 of coral limestone intercalated with marl and up to several-metre-thick bioclastic limestone (encrinite) and occasional beds of argillaceous marl. In STA2, the basinal part of the «Herrenwis Unit» comprises a medium- to thick-bedded succession of bioclastic limestone, bioclastic calcareous marl and bioclastic argillaceous marl.
The overlying unit «Parkinsoni-Württembergica-Schichten» fills up the positive relief created by the «Herrenwis Unit» in NL. Accordingly, this unit decreases in thickness from BAC1 with 48 m to STA3 with 2 m (including the overlying Variansmergel Formation). In ZNO, the thickness of the «Parkinsoni-Württembergica-Schichten» unit varies between ca. 30 and 35 m. It consists of (silty) claystone and silty marl with some decimetre-scale beds of bioclastic limestone.
The Variansmergel Formation has a thickness of ca. 2 – 5 m in NL and ca. 12 m in ZNO. Its composition is similar to the «Parkinsoni-Württembergica-Schichten», but generally with more decimetre-scale bioclastic limestone beds.
Finally, the Wutach Formation has a thickness of ca. 1 – 5 m and consists of a very fossiliferous succession of (iron-oolitic) argillaceous marl, iron-oolitic, bioclastic limestone and iron-oolite with several hardgrounds.
In NL and ZNO the Dogger Group above Opalinus Clay can be subdivided into the following units:
«Murchisonae-Oolith Formation»: In general, this formation can be separated into two parts (Fig. 4‑33, Fig. 4‑38). The lower part reaches the largest thickness in eastern NL, with 11 m at BAC1. It consists of an alternation of dm- to m-scale beds of calcareous marl and sandy, silty to bioclastic limestone with some iron-ooids and limonitised components. This part terminates with cross-bedded limonitic limestone to iron-oolite and a hardground at the top. The lower part is similar to corresponding outcrops of the Sissach Member at the Surb River or Acheberg east of NL (Wohlwend et al. 2019). Within NL, the lower part decreases in thickness and is condensed to a calcareous bed in BUL1 as well as in ZNO. The upper, ca. 4 – 11 m thick part of the «Murchisonae-Oolith Formation» consists in NL of silty claystone (Fig. 4‑36a) and argillaceous marl with bioclastic limestone and hardgrounds in the upper part. In ZNO the corresponding unit has a thickness of ≤ 1 m and consists of an argillaceous siltstone with a calcareous, iron-oolitic hardground at the top.
Wedelsandstein Formation: In NL the Wedelsandstein Formation consists of at least two facies trends or cycles of predominantly claystone to silty claystone, some argillaceous marl and decimetre-scale calcareous beds at the top, often including a hardground (Fig. 4‑38). Towards the west in NL, and especially as seen in the drill cores of BAC1, the Wedelsandstein Formation is strongly reduced and difficult to delineate solely based on lithological criteria; for this reason biostratigraphic evidence was additionally considered (Nagra (ed.) 2023a, Dossier IV). In ZNO the lower and larger part of the Wedelsandstein Formation mainly comprises argillaceous to calcareous siltstone with many dm- to m-scale beds of mostly bioturbated and bioclastic, partly micritic, silty to sandy limestone (Fig. 4‑36c). The dm- to m-scale beds show nested facies trends or cycles, which can be at least partly correlated within ZNO (Fig. 4‑39). Based on the thin sections from cores retrieved during the TBO drilling campaign, these beds show no elevated porosity. Towards the upper part, silty claystone with some calcareous interbeds dominate. The Wedelsandstein Formation is almost time-equivalent to the Waldenburg Member and lower part of the Brüggli Member in JO (Fig. 4‑37).
«Humphriesioolith Formation»: In NL this formation is thin (2 m) and even missing in STA3. Its composition varies in terms of content of iron-ooids, limonitic components, carbonate and silt from borehole to borehole, but is dominated by marl. In ZNO the «Humphriesioolith Formation» can be divided into three parts by the occurrence of iron-ooids: a lower iron-oolitic interval, a marly interval with calcareous beds without iron-ooids, and an upper iron-oolitic interval (Fig. 4‑39).
«Herrenwis Unit»: In the eastern part of NL, the first evidence for the presence of the «Herrenwis Unit» was provided by 2D seismic data, resulting in the description of a sedimentary body forming a positive relief on top of the underlying sedimentary rocks (Meier & Deplazes 2014 and references therein, Fig. 4‑40, Fig. 4‑41). This unit was recognised for the first time during the BUL1 campaign. The term «Herrenwis Unit» was introduced as an informal stratigraphic unit of undefined rank named after the BUL1 borehole locality "Herrenwis" (Nagra (ed.) 2021a, Dossier III). The «Herrenwis Unit» could already have been drilled in the Eglisau-2 borehole from 1957 (Cadisch 1959) if the final depth is taken into account and the rudimentary recording is reinterpreted. In STA3 and BUL1, the isolated carbonate platform is dominated by coral and bioclastic limestones, which are partly porous, and some beds of argillaceous marl (Fig. 4‑36e). The 40-metre-thick coral reef exhibits a large number of specimens and low species diversity (i.e. consisting of a few taxa), which is typical for Bajocian reef environments (Ruchat et al. 2024). At least two notable decreases in species diversity exist that partly coincide with increased clay-mineral contents in this unit. The «Herrenwis Unit» terminates with a prominent hardground. The more argillaceous basinal part of the «Herrenwis Unit» or the periplatform wedge was drilled in STA2 and its north-westernmost extent also in the Weiach borehole.
«Parkinsoni-Württembergica-Schichten»: This unit mostly consists of an alternation of lenticular- to flaser-bedded claystone and silty marl with decimetre-scale beds that occur more frequently towards the top (Fig. 4‑36f). In the lower or lowermost part, iron-oolitic to limonitic horizons can occur that may partly correspond to the «Parkinsoni-Oolith».
Variansmergel Formation: This formation has a similar facies to the «Parkinsoni-Württembergica-Schichten», but it is generally more fossiliferous, including brachiopods, bivalves and crinoids partly concentrated in coquina beds.
Wutach Formation: This formation corresponds partly to the Ifenthal Formation in JO (Fig. 4‑34) and represents a condensed succession of iron-oolite, iron-oolitic limestone and marl (Fig. 4‑36g).
Fig. 4‑38:Detailed correlation of the sedimentary succession directly above the Opalinus Clay in boreholes of NL
In the formation microresistivity imaging (FMI) data, more conductive lithologies appear darker (e.g. claystone), whereas more resistive lithologies appear lighter (e.g. limestone or sandstone).
Fig. 4‑39:Detailed correlation of the sedimentary succession directly above the Opalinus Clay in boreholes of ZNO
In the formation microresistivity imaging (FMI) data, more conductive lithologies appear darker (e.g. claystone) whereas more resistive lithologies appear lighter (e.g. limestone or sandstone). In RHE1, thicknesses are larger because it is an inclined borehole.
Fig. 4‑40:Subcrop map (top reflection of the «Herrenwis Unit») of the geophysical survey area acquired in NL with seismically derived extent of the isolated carbonate platform and of the periplatform wedge
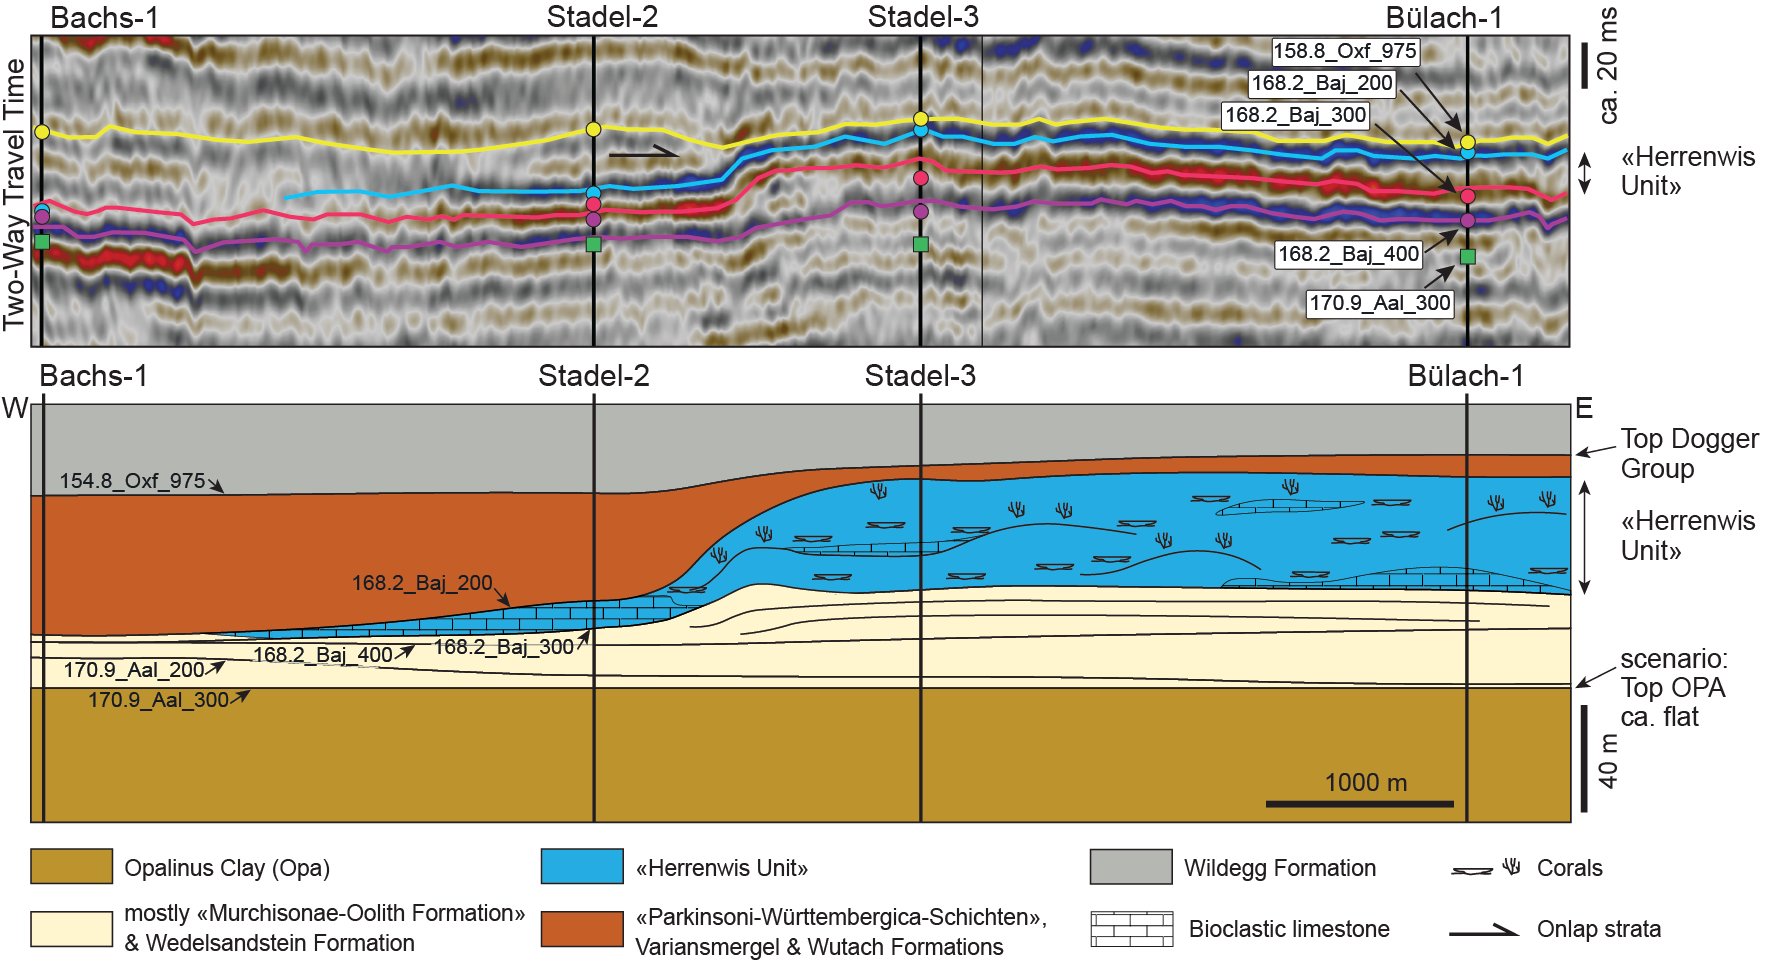
Fig. 4‑41:E-W-oriented seismic profile across the western edge of the «Herrenwis Unit» and conceptual sketch of the extent of the «Herrenwis Unit» and adjacent units
The upper panel is flattened to ca. Top Keuper Group, the lower panel to Top Opalinus Clay. Refer to Nagra (2024b and 2024f) for discussion of the seismic reflection data.
Compared to the Opalinus Clay, the overlying units of the Dogger Group generally exhibit increased vertical and lateral variability in thickness and facies, reflecting locally diverse depositional environments. This is also expressed by the high number of different lithostratigraphic units at formation and member levels (Fig. 4‑34). A significant portion of these units is organised by nested facies trends or cycles, which typically start with argillaceous sedimentary rocks that become more silty and finally calcareous to iron-oolitic at the top (Fig. 4‑35). However, the thickness of the elements of the individual facies trends may vary strongly laterally depending on basin bathymetry and bottom currents.
The first interval from the Top Opalinus Clay to Top «Humphriesioolith Formation» / «Herrenwis Unit» / « Humphriesi-Schichten» of the Passwang Formation shares more similarities in JO and ZNO than in NL (Fig. 4‑33). In JO and ZNO, the «Condensed equivalents of the Sissach Member, Hauenstein Member and/or Hirnichopf Member» and the «Murchisonae-Oolith Formation» are strongly condensed. This succession is dominated by an argillaceous to silty sediment with few calcareous, iron-oolitic beds. In contrast, in western NL the «Murchisonae-Oolith Formation» starts with an up to 11 m thick more calcareous interval that thins out towards the east. The overlying Wedelsandstein Formation and equivalent parts of the Passwang Formation (Fig. 4‑37, Fig. 4‑38, Fig. 4‑39) are very similar in JO and ZNO, whereas in NL this unit is more similar to the Opalinus Clay and is dominated by claystone and silty claystone, with less calcareous, sandy beds. In eastern NL, this interval terminates partly with the thin «Humphriesioolith Formation» and is then overlain by the 40-metre thick «Herrenwis Unit», an isolated coral reef carbonate platform embedded in argillaceous sedimentary rocks.
The second interval, which extends to the Top Dogger Group above Opalinus Clay, has, in terms of facies, more similarities in NL and ZNO compared to JO. It is dominated by relatively homogeneous claystone and silty marl of the «Parkinsoni-Württembergica-Schichten» (Fig. 4‑33). The thickness varies strongly; thickness is minimal over the «Herrenwis Unit» and is much greater outside of the isolated carbonate platform of the «Herrenwis Unit» (Fig. 4‑41). In JO, the second interval has different characteristics; generally, the strata have an increased carbonate content, and oolitic and bioclastic limestone related to the extended Hauptrogenstein platform appear.
The Dogger Group above Opalinus Clay spans most of the Middle Jurassic, from the Middle Aalenian to the Callovian and partly also to the earliest part of the Late Jurassic (Early Oxfordian). Within this interval, five timelines were picked (170.9_Aal_200 to 168.2_Baj_100; Fig. 4‑33). These timelines were picked based on the integration of detailed biostratigraphic, chemostratigraphic and lithofacial (e.g. hardground) criteria (for data please refer to Dossiers III and IV of data reports of the TBO campaign, see Tab. 2‑1). The timelines generally follow lithostratigraphic boundaries, but partly cross or are within lithostratigraphic boundaries, reflecting lateral facies changes in time-equivalent periods (Fig. 4‑33).
The Dogger Group above Opalinus Clay in the study area was deposited in a shallow epicontinental sea bordered by the Vindelician Land in the east, the Alemannic Land to the south, the Celtic Platform to the west and the London-Brabant Massif and Rhenish Massif to the north (Fig. 3‑9). The transgression of the sea onto the Alemannic Land, which began in the Late Toarcian, continued and the last small remnants or islands on the former southern edge (e.g. Windgällen) were also flooded in the course of the Aalenian and Bajocian (Trümpy 1959). Overall, the depositional environment is dominated by fine-grained siliciclastic input from these landmasses and/or from even farther source areas to the north, leading to relatively high sedimentation rates (Fig. 4‑4, Fig. 4‑5, Fig. 4‑6). Additionally, also shallow marine environments dominated by in-situ carbonate production were associated with high sedimentation rates (Hauptrogenstein, «Herrenwis Unit»). Periods with high sedimentation rates are interrupted by intervals with condensation with very low sedimentation rates or even no net deposition. In several intervals, the vertical facies associations are organised in nested facies trends or cycles, which start with argillaceous sedimentary rocks that become more silty and finally calcareous to iron-oolitic at the top. Some of these facies trends seem to reflect changes in relative sea level and/or climate variability, and their boundaries might be partly related to boreal or global sequence boundaries (Fig. 4‑35). However, these facies trends are often not complete. Their strata may strongly vary laterally in thickness and facies depending on basin bathymetry and bottom currents causing sediment mobilisation, transport, and accumulation. The depositional evolution of the Dogger Group above Opalinus Clay is subdivided here into four time intervals (Fig. 4‑33):
The first time interval (170.9_Aal_300 to 170.9_Aal_200) spans the Middle Aalenian (Murchisonae to lower part of Bradfordensis ammonite Zones; Fig. 4‑33, Fig. 4‑42). It includes, in JO, the interval from the Top Opalinus Clay to the top of the lower part of the Passwang Formation (Sissach Member to lower part of the Waldenburg Member, Fig. 4‑37). In NL and ZNO, it corresponds to the interval from the Top Opalinus Clay to the top of the lower part of the «Murchisonae-Oolith Formation» (Fig. 4‑33, Fig. 4‑38, Fig. 4‑39). This first time interval is characterised by strong condensation in JO, eastern NL (BUL1) and ZNO, which is reflected in the occurrence of calcareous and iron-oolitic hardgrounds. Only in the western part of NL was an interval several metres thick and comprised of marl, bioclastic limestone and iron-oolite deposited (BAC1). A similar succession exists ca. 10 km to the east of NL at the Surb River and Acheberg (Wohlwend et al. 2019), indicating a potential eastward extension of this facies. The interval in NL also includes cross-bedded limonitic limestone, suggesting transport by bottom currents. This interval could have accumulated in a local depression, or it could have accumulated by local carbonate production (e.g. crinoids) and transport by bottom currents forming a positive relief.
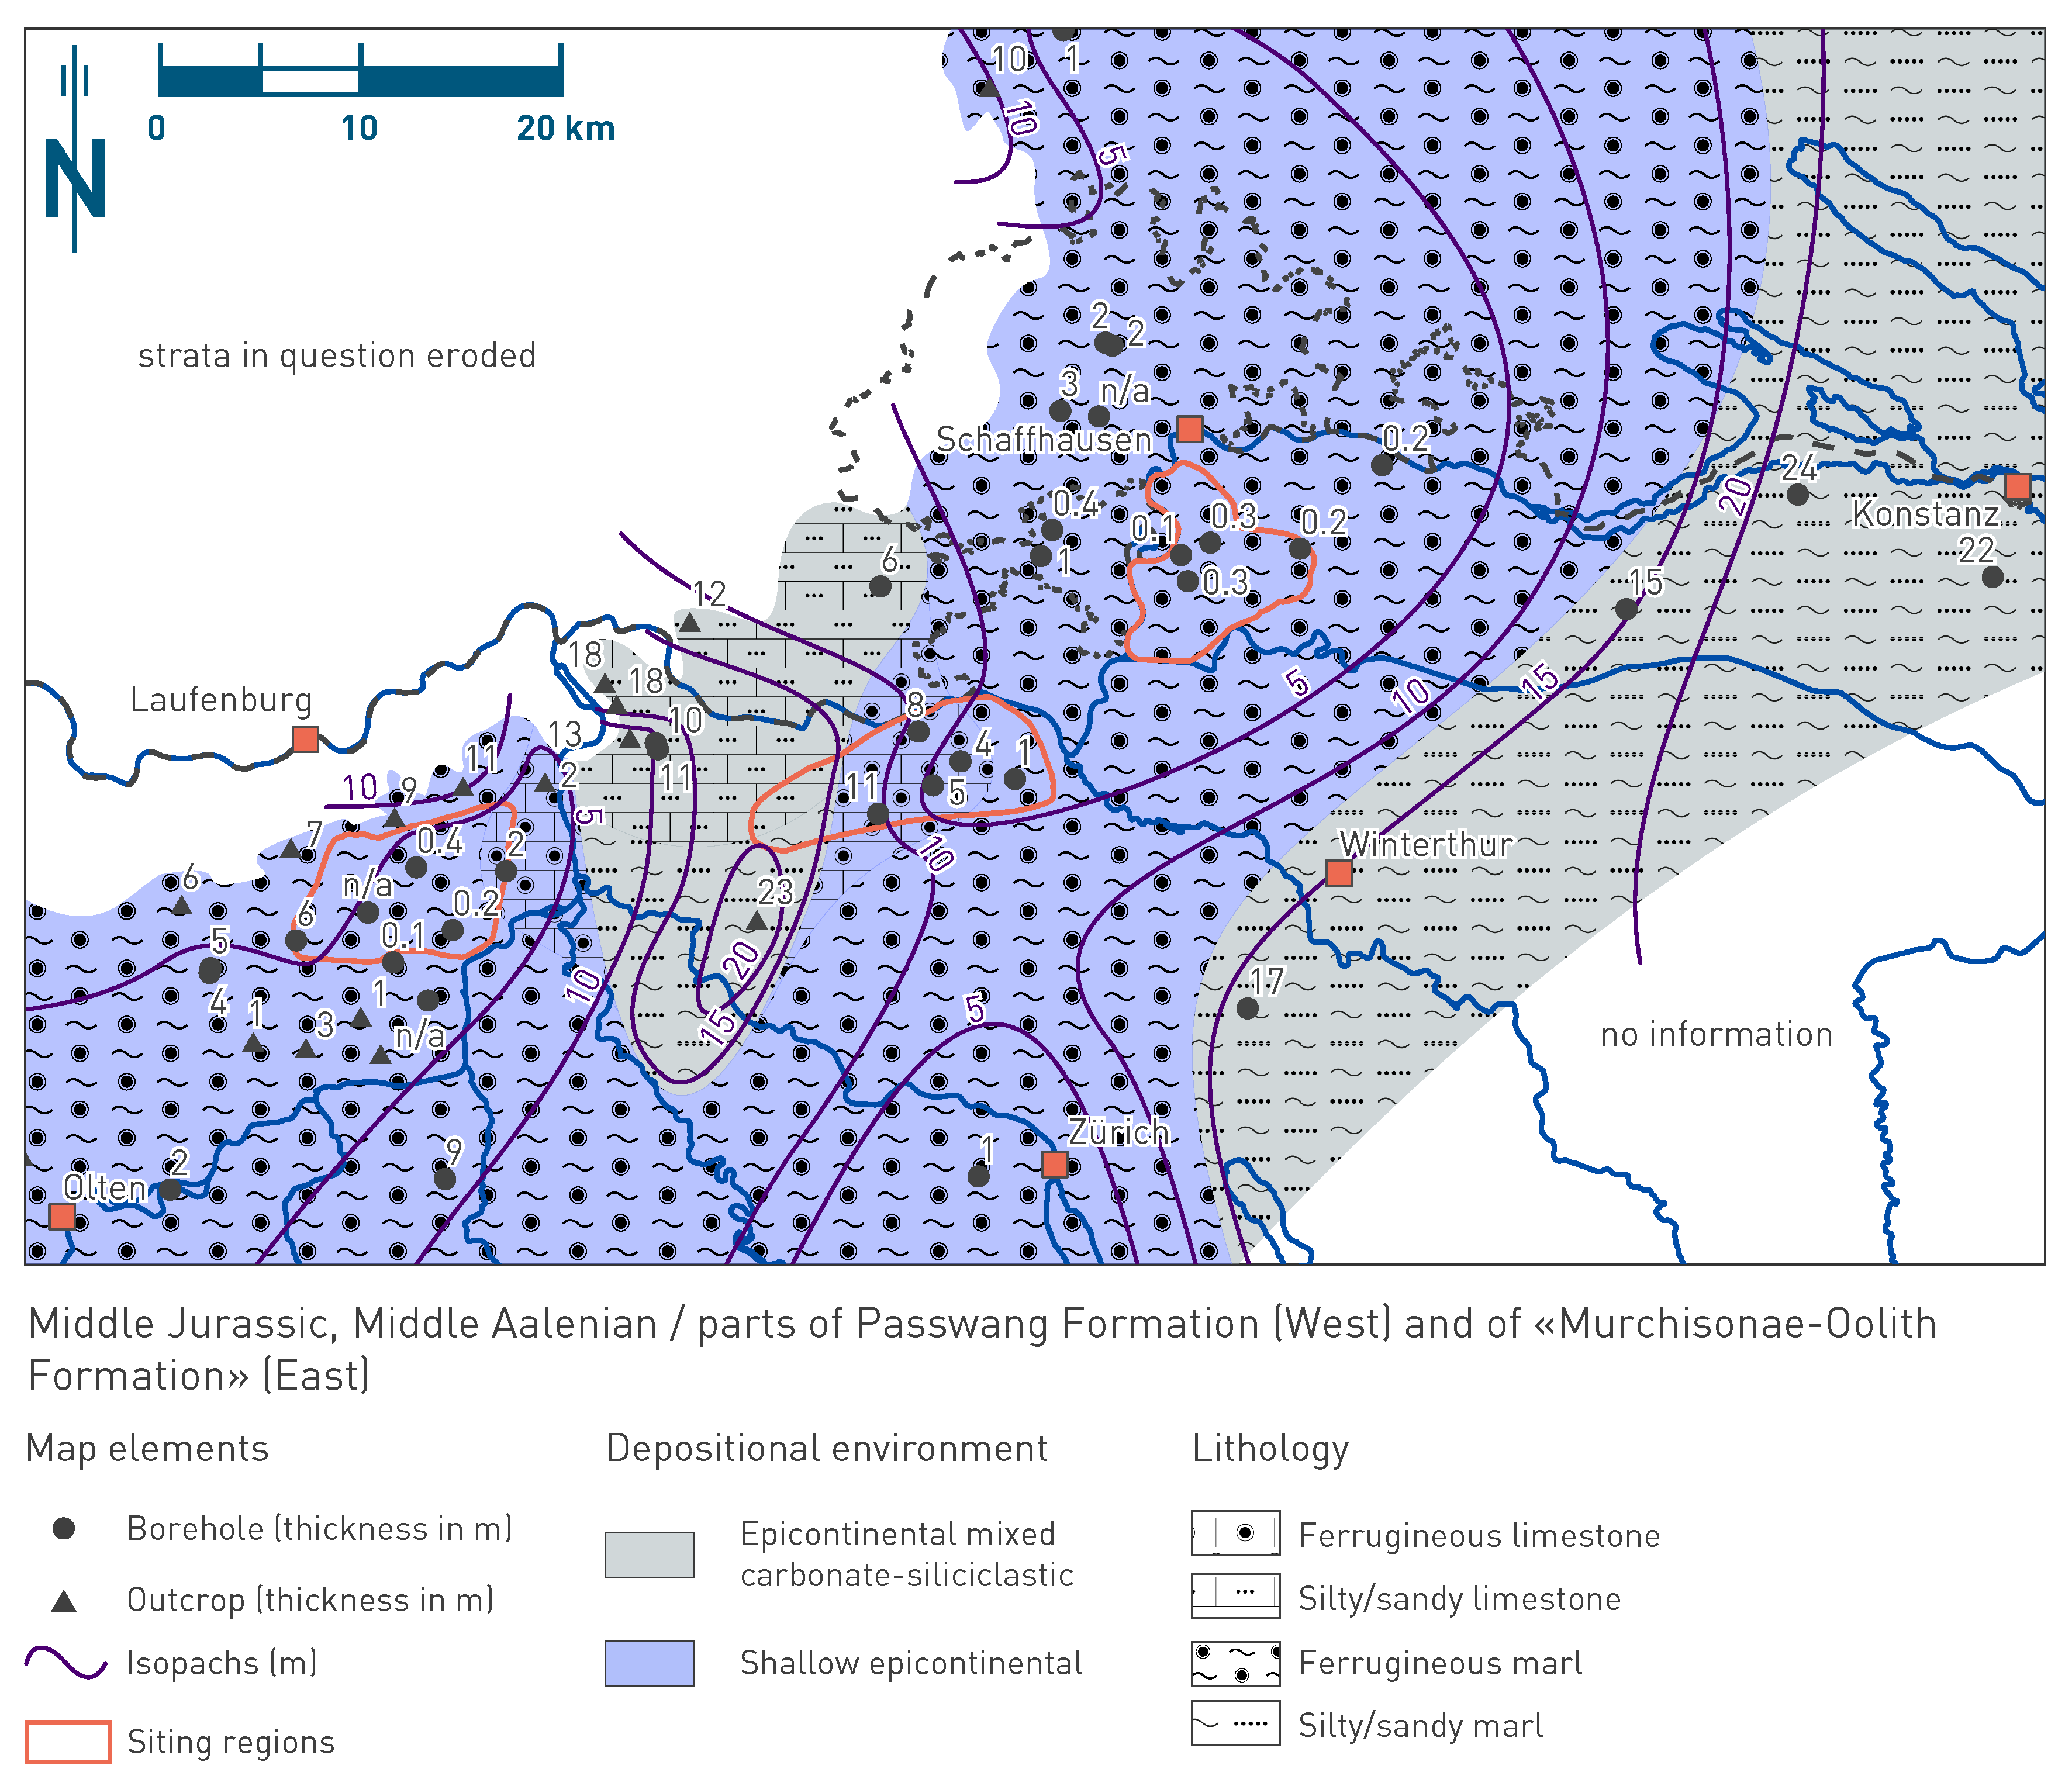
Fig. 4‑42:Map of depositional environments during Middle Aalenian
Refer to Fig. 4‑3 for a schematic representation of depositional environments. The north arrow refers to present-day geographic north. Map shows the setting during the "first time interval" (170.9_Aal_300 to 170.9_Aal_200) as discussed in the text.
The second time interval (170.9_Aal_200 to 168.2_Baj_300) spans the late Middle Aalenian to Early Bajocian (Bradfordensis to Laeviuscula Zones; Fig. 4‑33, Fig. 4‑43). In JO, it corresponds to most of the middle part of the Passwang Formation (i.e. most of the Waldenburg Member and lower part of the Brüggli Member), whereas in NL and ZNO, mostly to the Wedelsandstein Formation and the lower iron-oolitic part of the «Humphriesioolith Formation». Within this interval, an additional timeline (168.2_Baj_400) was identified at the top of calcareous beds that enables this interval to be separated into at least two facies trends or cycles. In the second time interval, the depositional environments in JO and ZNO show many similarities with a mainly silty and argillaceous sediment with many calcareous (mostly bioclastic but also micritic) to sandy beds. These beds or successions of beds can be partly correlated on a local scale, i.e. between boreholes within the siting regions (Fig. 4‑37, Fig. 4‑39). However, these beds do not represent regional marker beds such as some of the calcareous and iron-oolitic hardgrounds. The beds of the Wedelsandstein Formation might trace storm events or phases with elevated transport that brought sediments e.g. from carbonate platforms in the west into the area and formed sheet-like deposits. Locally, production of carbonates (crinoids) may also have occurred. Generally, these successions were formed during times of high sedimentation. In NL this interval is dominated by claystone to silty claystone and shows a clear thickness increase from west to east (Fig. 4‑38). For example, there are pronounced thickness increases for the uppermost facies trend (168.2_Baj_400 to 168.2_Baj_300) from ca. 6 m in STA2 to 19 m in STA3 over a distance of only 1.8 km. Assuming that this facies trend represents the same time interval, sedimentation rates must have increased significantly from west to east. In combination with seismic facies analysis (Fig. 4‑41), this sediment body is interpreted as an argillaceous drift deposit that formed a positive relief and basis for the following depositional processes that generated the «Herrenwis Unit».
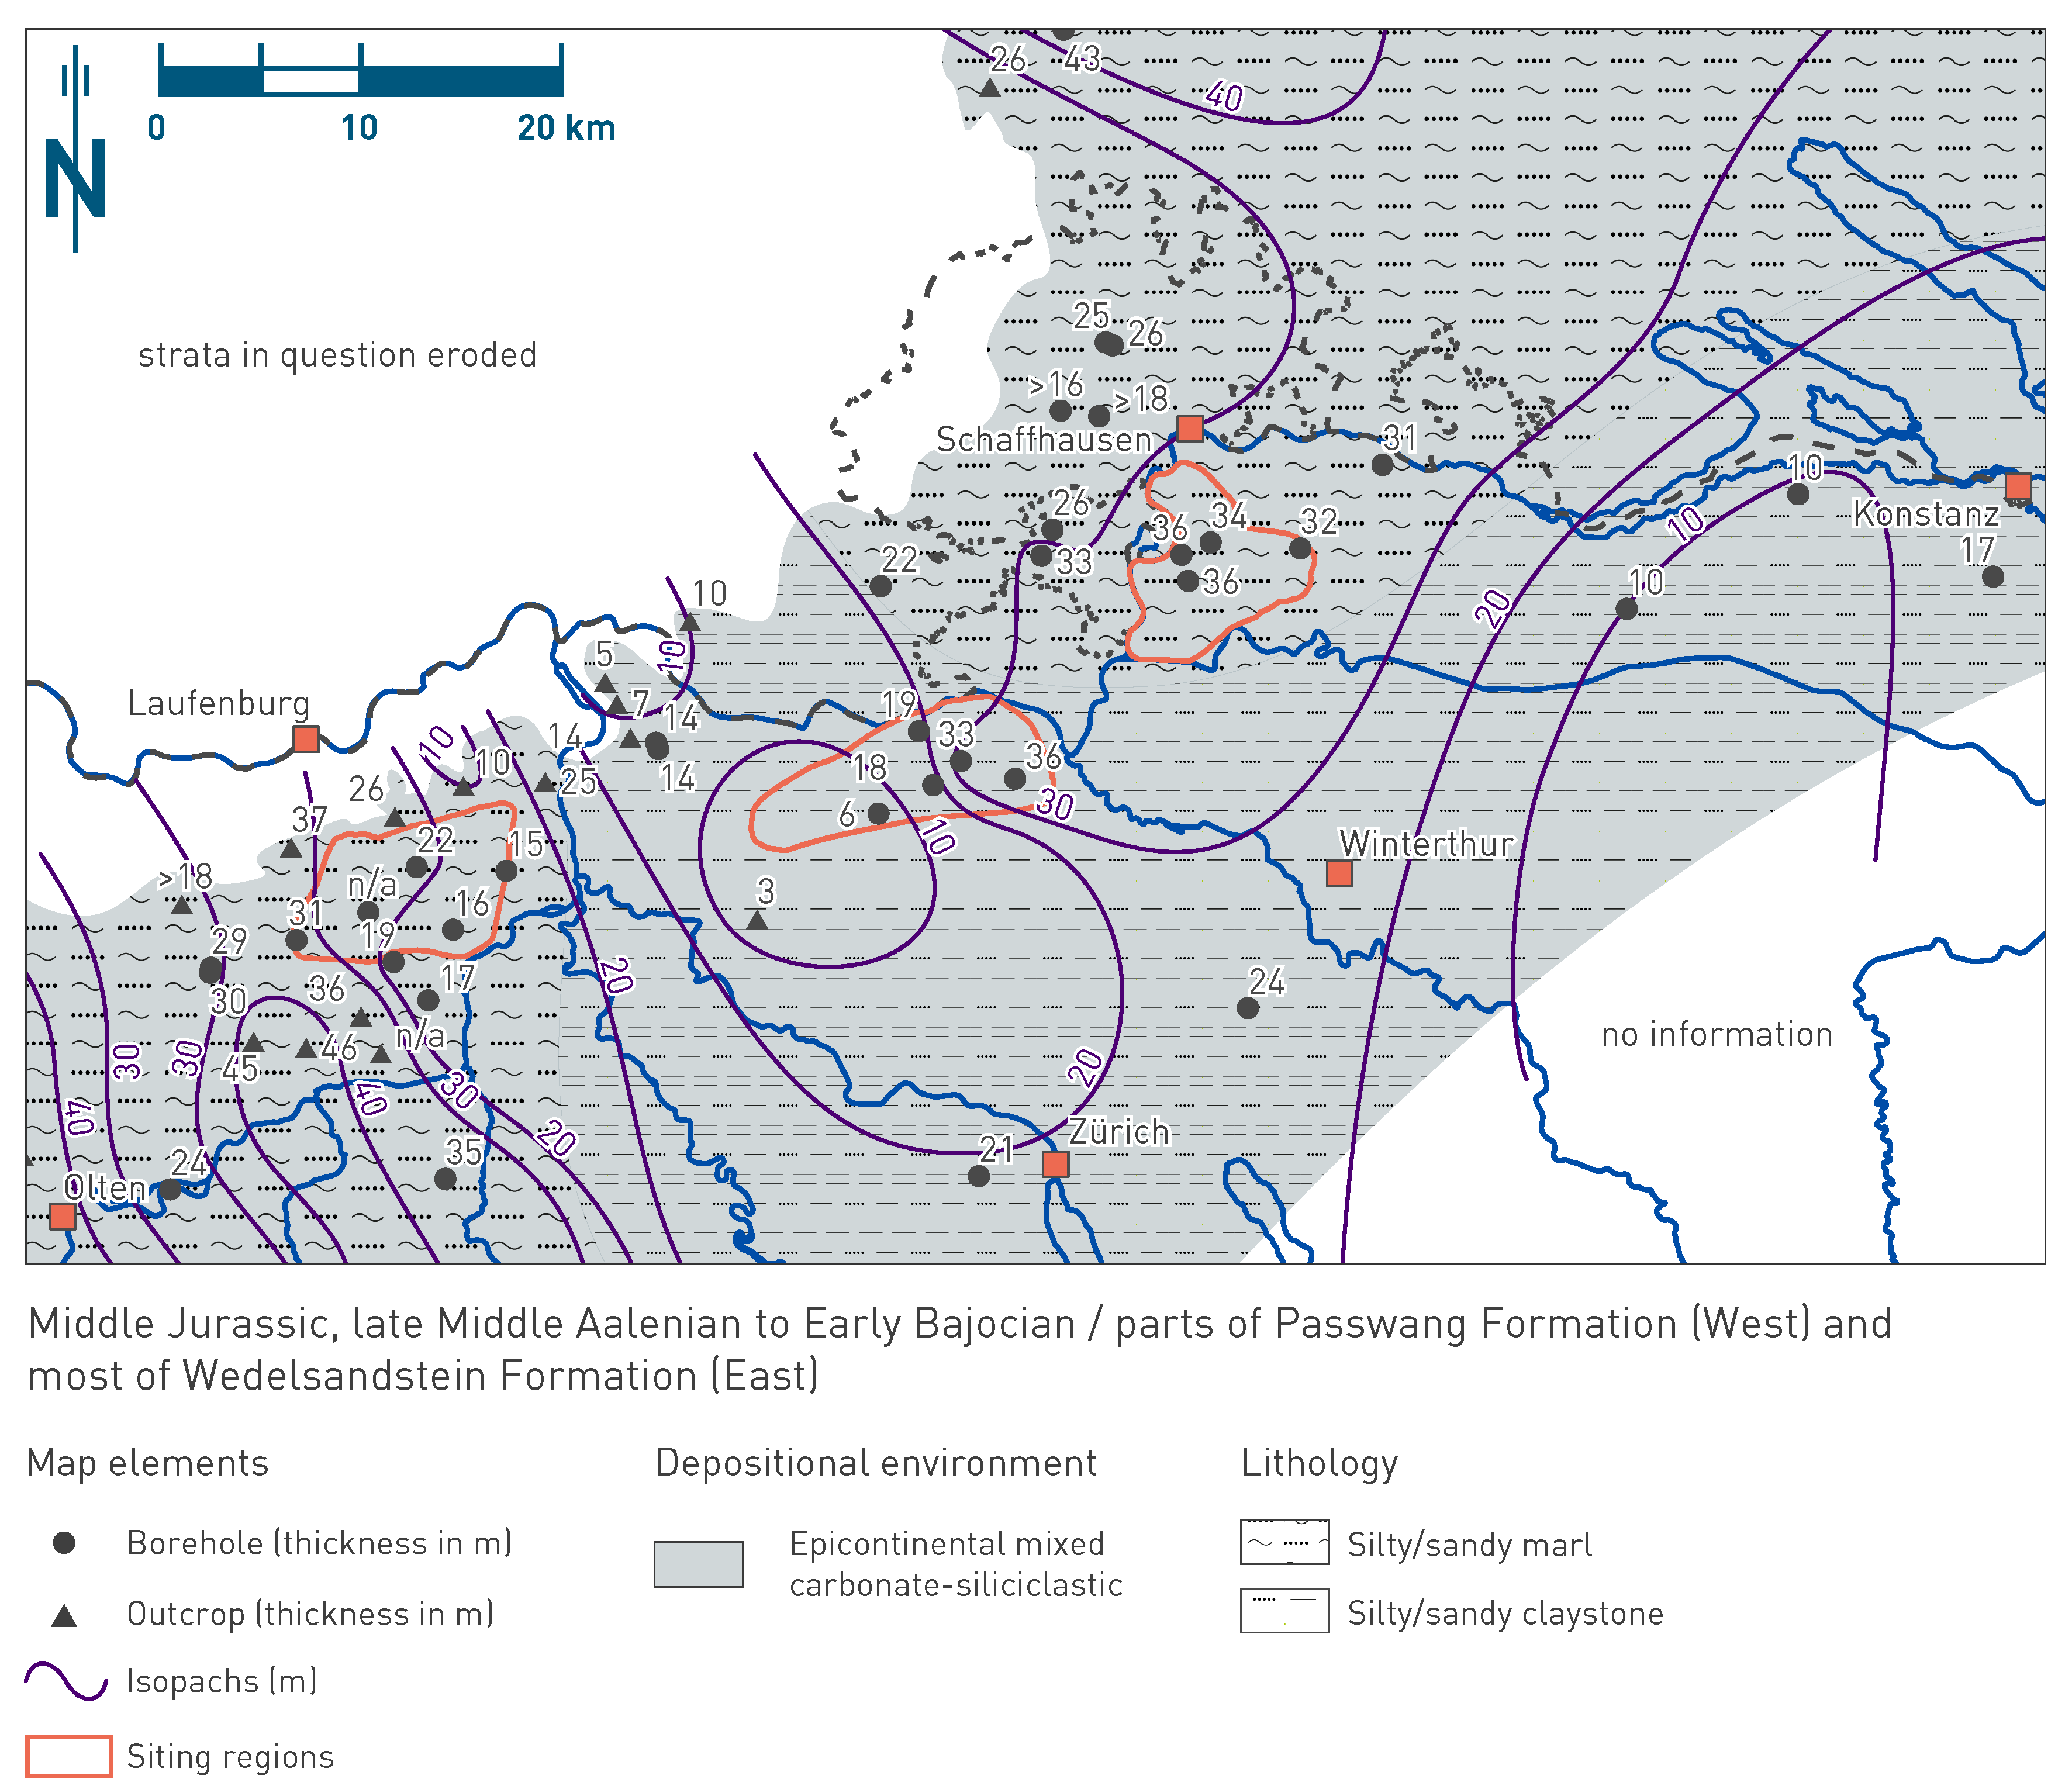
Fig. 4‑43:Map of depositional environments during late Middle Aalenian to Early Bajocian
Refer to Fig. 4‑3 for a schematic representation of depositional environments. The north arrow refers to present-day geographic north. Map shows the setting during the "second time interval" (170.9_Aal_200 to 168.2_Baj_300) as discussed in the text.
The third time interval (168.2_Baj_300 to 168.2_Baj_200) spans the Early Bajocian (Sauzei to Humphriesianum Zones; Fig. 4‑33, Fig. 4‑44). In JO it corresponds to an interval in the upper Passwang Formation (uppermost part of the Brüggli Member and the «Humphriesi-Schichten»), in western NL (BAC1) mostly to the «Humphriesioolith Formation», in eastern NL to the «Herrenwis Unit», and in ZNO to the middle and upper parts of the «Humphriesioolith Formation» (Fig. 4‑33). In JO the third time interval is mostly characterised by low sedimentation rates. Iron-oolitic sediments were partly produced in situ during phases of sediment starvation, perhaps in relatively elevated regions and transported and accumulated in depressions or as offshore bars. In eastern NL, the isolated carbonate platform of the «Herrenwis Unit» developed during this time interval (Fig. 4‑40, Fig. 4‑41). The carbonate platform, as found in STA3 and BUL1, mainly consists of in-situ grown coral bioherms (plate- and pillarstone sensu Insalaco 1998), but also some bioclastic limestone (rudstone; Ruchat et al. 2024). In STA2 the more basinward part of the carbonate platform, the periplatform wedge, was drilled with an intercalation of siliciclastic and calcareous sedimentary rocks that contain few transported coral fragments (Fig. 4‑38). The carbonate platform developed on top of the positive relief of the underlying argillaceous units, probably a sediment drift deposit (mostly Wedelsandstein Formation). On top of this positive relief, the conditions for coral growth were more favourable, probably because of better light conditions (shallower water depth) and oxygen availability (current circulation). The carbonate platform is interpreted to consist of several horizontally 100 m- to decametre-scale mounded coral bioherms or patch-reefs with flanking or intercalated bioclastic limestone as observed in time-equivalent reefs in Lorraine and Burgundy (Geister & Lathuilière 1991, Brigaud et al. 2024; Fig. 4‑45) and central Morocco (Ait Addi 2015). Regional time-equivalent reefs (Fig. 4‑44) can be found at the Gisliflue ca. 20 km northeast of Olten (Wullschleger 1966, Gonzalez & Wetzel 1996) and potentially in the less well documented boreholes around Jestetten north of NL (Franz 2022, Geyer et al. 2023). Within the «Herrenwis Unit», several phases can be distinguished which can be traced by changes in the ecological associations and seem to be partly also mimicked by clay-mineral content. The coral growth, and correspondingly the «Herrenwis Unit», end with a prominent unconformity which might be correlated with a major transgression ('Vesulian Transgression' in eastern France; Durlet & Thierry 2000). The build-up of the biohermal «Herrenwis Unit» represents deposition during a phase of high sedimentation rate, which was followed by a phase of strong condensation, reworking, and partly infilling of the underlying «Herrenwis Unit». During the third time interval, western NL was characterised by a siliciclastic basinal depositional environment outside of the «Herrenwis Unit», with low sedimentation rates. In ZNO, the third time interval was dominated firstly by similar fine-grained siliciclastic sedimentation with medium to low sedimentation rates. Secondly, a succession of iron-oolitic accumulations or hardgrounds were formed, indicating low to very low sedimentation rates.
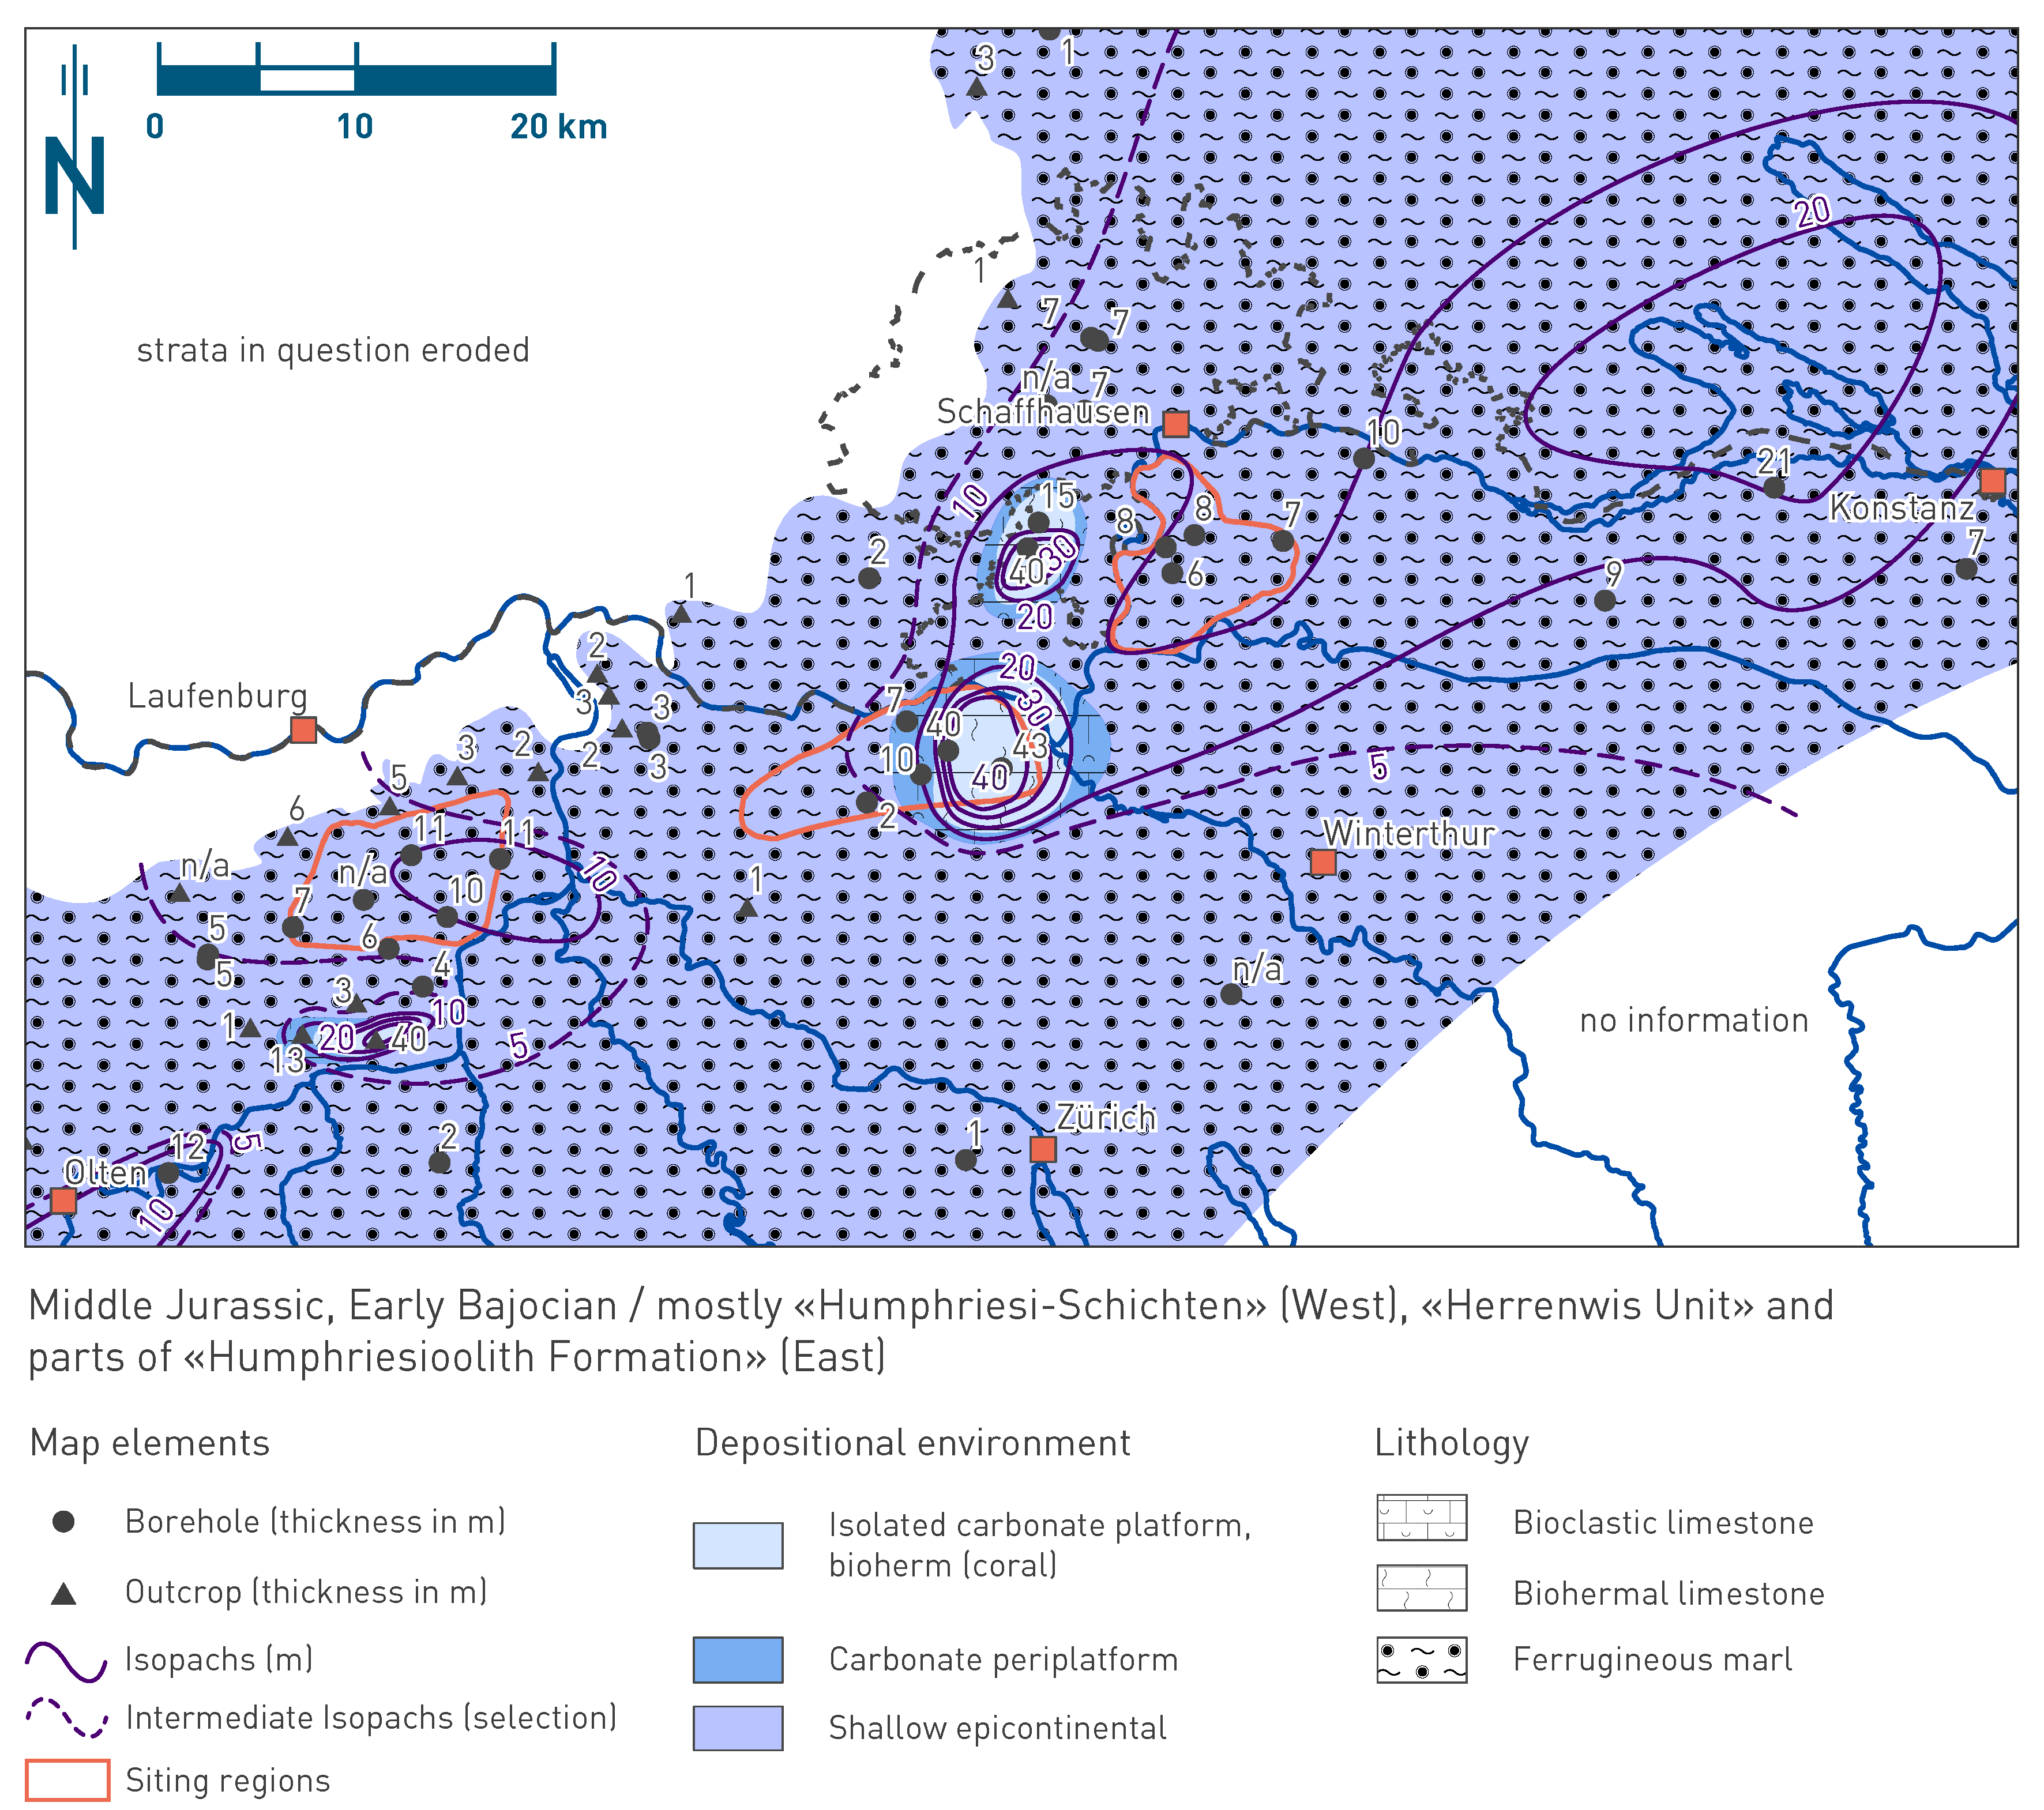
Fig. 4‑44:Map of depositional environments during the Early Bajocian
Refer to Fig. 4‑3 for a schematic representation of depositional environments. The north arrow refers to present-day geographic north. Map shows the setting during the "third time interval" (168.2_Baj_300 to 168.2_Baj_200) as discussed in the text.
Fig. 4‑45:Bioherms at two levels (Calcaire à polypiers inférieur et supérieur) shown as a time-equivalent analogue for the bioherms of the «Herrenwis Unit»
Quarry near Malancourt-la-Montagne (Lorraine, France; see Geister & Lathuilière 1991; photo and interpretation by A. Ruchat).
The fourth time interval (168.2_Baj_200 to 154.8_Oxf_975) spans the Late Bajocian to Early Oxfordian (Fig. 4‑33, Fig. 4‑46). In JO it corresponds to the upper Passwang Formation, Hauptrogenstein, Klingnau and Ifenthal Formations. In NL and ZNO it corresponds to the «Parkinsoni-Württembergica-Schichten», Variansmergel and Wutach Formations. In JO the fourth time interval is dominated by the progression of the oolitic and bioclastic Celtic Platform (Hauptrogenstein) from the west (Fig. 3‑9). The carbonate platform interfingers to the east with a more basinal depositional environment, which is characterised by a mixture of calcareous input from the platform and siliciclastic "background" sedimentation in the basin. The Hauptrogenstein comprises three shallowing-upward successions, each capped by a hardground (Gonzalez & Wetzel 1996; Fig. 4‑35). Within these successions, the oolitic and bioclastic platform advances from west to east. This phase of the fourth time interval is dominated by high to very high sedimentation rates. This contrasts with the deposits of the overlying Ifenthal Formation that was formed during a time interval characterised by low to very low sedimentation rates (Fig. 4‑4). In NL the depositional environment of the fourth time interval must have been strongly influenced by the underlying «Herrenwis Unit». The basin west of the isolated carbonate platform was filled by mostly argillaceous sediments associated with high to very high sedimentation rates. This is corroborated by onlaps of the corresponding «Parkinsoni-Württembergica-Schichten» and Variansmergel Formation on the «Herrenwis Unit» as seen in seismic profiles (Fig. 4‑41). In the area above the isolated carbonate platform of the «Herrenwis Unit», this phase was characterised by non-deposition, condensation (hardgrounds) and episodes of minor argillaceous deposition, reflecting low to very low sedimentation rates. In ZNO the depositional environment during this time interval was similar to the conditions in western NL, with siliciclastic basinal deposition and high sedimentation rates. In JO, NL and ZNO, the fourth time interval ends with condensation, i.e. with a phase characterised by low to very low sedimentation rates (Wutach and Ifenthal Formations respectively; Fig. 4‑4, Fig. 4‑5 and Fig. 4‑6).
Fig. 4‑46:Map of depositional environments during Late Bajocian to Early Oxfordian
Refer to Fig. 4‑3 for a schematic representation of depositional environments. The north arrow refers to present-day geographic north. Map shows the setting during the "fourth time interval" (168.2_Baj_200 to 154.8_Oxf_975) as discussed in the text.
The Wildegg Formation forms the uppermost part of the upper confining units in the NL and ZNO siting regions (Section 4.5.3.4). It was deposited during the Late Jurassic in a shallow marine epicontinental setting (Chapter 3). The depositional environment corresponded to a mixed carbonate-siliciclastic setting with a depositional centre between Olten, Aarau and Brugg. In the JO siting region, the upper part of the Wildegg Formation is partly eroded.
Fig. 4‑47:Map of depositional environment during the Late Jurassic (Middle to Late Oxfordian) preserved in the Wildegg Formation
Refer to Fig. 4‑3 for a schematic representation of depositional environments. The north arrow refers to present-day geographic north.
In Northern Switzerland, the thickness of the Wildegg Formation decreases from west to east (Fig. 4‑47). In the JO siting region, it has a thickness of a ca. 250 to 260 m, in NL ca. 50 to 100 m, and in ZNO ca. 10 to 20 m. The Wildegg Formation consists mostly of limestone, argillaceous limestone and calcareous marl (Fig. 4‑48, Fig. 4‑49; Allenbach 2001, Deplazes et al. 2013). Individual limestone beds are mostly bundled in few metre- to decametre-scale thick successions which alternate with calcareous marl successions. The most characteristic, the Gerstenhübel Bed, and also the thinner of these limestone successions (Fig. 4‑48) can be followed over large distances of 25 km or more in the study area (Gygi & Persoz 1986, Deplazes et al. 2013).
The Wildegg Formation can be subdivided into the Birmenstorf Member (only up to few metres thick) at the base and the younger Effingen Member, which makes up the vast majority of the formation:
Birmenstorf Member: In the JO siting region, the Birmenstorf Member has a thickness of up to ca. 4 m. It consists of bioclastic and glauconitic limestone (biomicrite) and is very fossiliferous, with sponges, ammonites and belemnites (Fig. 4‑49a). At the base it may include some iron-ooids. Towards the east, the Birmenstorf Member is gradually replaced by condensed units from bottom to top: «Glaukonitsandmergel Bed», «Mumienkalk Bed» and «Mumienmergel Bed» (Gygi 2012). The latter two units were incorporated into the Birmenstorf Member by Jordan & Deplazes (2019); together they generally reach a thickness of mostly ca. 1 m, rarely up to few metres (e.g. TRU1). They consist of fossiliferous, glauconitic, partly iron-oolitic to oncolitic calcareous to argillaceous marl and argillaceous limestone (biomicrite) (Fig. 4‑49b). Characteristic for some parts of this interval are so-called "Mumien" (mumies) consisting of partly encrusted, subangular to rounded limestone oncolites and lithoclasts.
Effingen Member: This member forms by far the largest part of the Wildegg Formation. The principal lithologies of (argillaceous) limestone (micrite) and calcareous marl are partly bioturbated, bioclastic, often pyritic and contain some quartz and feldspar (silty-sandy) (Fig. 4‑49d – g). In the lower part of the Effingen Member, sponge bioherms may also occur (Fig. 4‑49c).
The Wildegg Formation is dominated by an alternation of (argillaceous) limestone and calcareous marl successions which have similar characteristics over Northern Switzerland (Fig. 4‑48). However, the thickness of the entire formation and its individual stratal successions decreases strongly from west to east in the study area. Some of these successions can be partly correlated over large distances of more than 25 km (Deplazes et al. 2013). The most prominent limestone succession, the Gerstenhübel Bed, may even be correlated over the entire study area, although its thickness and facies change laterally. Additionally, especially in the interval below the Gerstenhübel Bed, the correlation of the succession is less clear compared to the interval above the Gerstenhübel Bed.
The Wildegg Formation was deposited in the Late Jurassic during the Middle to the Late Oxfordian (Gygi 1969). Timelines were picked mostly near the Gerstenhübel Bed (154.8_Oxf_750 and 154.8_Oxf_700). The top of the Wildegg Formation is diachronous (Deplazes et al. 2013).
The Wildegg Formation was deposited in a shallow epicontinental sea in the carbonate-siliciclastic Swabian facies realm, with a depositional centre that corresponds to the present-day area between Olten, Aarau and Brugg (Chapter 3). Mass wasting deposits, especially in the lower Effingen Member, indicate relief contrasts in the basin. Towards the west, the Effingen Member was bounded by the eastern part of the Celtic Platform consisting of a carbonate shoal with oolites and coral bioherms (Günsberg Formation) and a backreef environment with a lagoonal facies (Vellerat Formation; Gygi 2000a, Strasser et al. 2012). The patch-reef belt migrated south-eastwards towards the basin during the Oxfordian (Gygi 1986). To the south, the shelf sea merged into the open Piemont – Liguria Ocean. The nearest mainlands were the London-Brabant, Rhenish and Bohemian Massifs in the north and east. During the first phase of the deposition of the Wildegg Formation, sedimentation rates were low to very low, particularly in the eastern Birmenstorf Member. In contrast, during the deposition of the Effingen Member sedimentation rates were very high within the depositional centre between Olten, Aarau and Brugg, although with an eastward-decreasing trend (Fig. 4‑4, Fig. 4‑5, Fig. 4‑6). During the Late Jurassic, accommodation space was created by subsidence as the compacted sedimentary rock thickness exceeded the estimated water depth of ca. 50 – 100 m. The development of the depositional centre can be explained by differential subsidence (Allenbach 2001, 2002). The sediment accumulation pattern may also have been characterised by reworking by bottom current systems, perhaps along the eastern side of the carbonate platform (sediment drift deposits). The partly correlatable limestone and calcareous marl successions might reflect climate cycles in combination with relative sea level changes (Allenbach 2001, Deplazes et al. 2013). The depositional evolution of the Wildegg Formation is subdivided here into three time intervals (Fig. 4‑48):
The first time interval (154.8_Oxf_975 to 154.8 Oxf_750) approximately corresponds to the Birmenstorf Member and the Effingen Member below the Gerstenhübel Bed. This time interval starts with a phase of condensation especially in the east, where only a succession of hardgrounds is preserved. In the west, a somewhat thicker succession with sponge bioherms was deposited. The Effingen Member below the Gerstenhübel Bed is mainly interpreted as a deposition formed during relatively low sea-level conditions (Gygi et al. 1998, Allenbach 2001). In this setting, more siliciclastic sediment must have reached the basin that led to an overall increase in the deposition of siliciclastics. At the same time, the area of carbonate production in the shelf environment decreased, leading to a lower calcareous input.
The second time interval (154.8_Oxf_750 to 154.8 Oxf_700) approximately corresponds to the deposition of the Gerstenhübel Bed. It was possibly deposited during relatively high sea-level conditions. With a higher sea level, more siliciclastic material was trapped in the flooded coastal plains and the transport distances of the siliciclastics to the shallow basin increased. On the platform, carbonate production may have increased as accommodation space increased, and as the siliciclastic input may have decreased (less turbidity); at the same the increased calcareous production may have caused an increased calcareous export into the shallow basin.
The third time interval (154.8_Oxf_700 to 154.8 Oxf_300) approximately corresponds to the Effingen Member above the Gerstenhübel Bed. It may correspond to a second phase of deposition during relatively low sea-level conditions that was followed by a second phase of deposition during relatively high sea-level conditions, which is reflected by the uppermost Effingen Member and the overlying Villigen Formation. The top of the Effingen Member is probably diachronous. In the east the mostly carbonate-dominated sedimentation of the Villigen Formation started slightly earlier, whereas in the west the mixed siliciclastic-carbonate facies lasted longer.
Fig. 4‑48:Stratigraphic borehole correlation of the Wildegg Formation
For lithological nomenclature refer to Naef et al. (2019). Clay-mineral content after Becker & Marnat (2024) Some of the boundaries and lithologies as discussed in the original reports were adjusted to integrate all presented borehole data.
Fig. 4‑49:Selected core photos of the Wildegg Formation
(a) Reddish brown iron-oolite (hardground) below glauconitic, bioclastic argillaceous to calcareous marl and limestone with many light grey sponges; (b) Reddish grey iron-oolitic limestone (hardground) below grey glauconitic argillaceous marl with reworked iron-ooids in the lower part and oncolitic limestone bed; (c) dark grey bioclastic, glauconitic, argillaceous marl with many light grey sponges; (d) dark grey calcareous marl; (e) & (f) intercalation of light grey limestone with cm- to dm-scale beds of calcareous marl; (g) dark grey argillaceous marl, silty with centimetre-scale limestone layers.
The Malm Group above Wildegg Formation overlies the upper confining units of the host rock. It forms the Malm aquifer in NL and ZNO; in JO this aquifer exists in part of the siting region at shallow level (Section 4.5.3.3, Fig. 4‑50). The sedimentary succession was deposited during the Late Jurassic in a shallow marine epicontinental sea (Chapter 3).
Fig. 4‑50:Map of depositional environments during the Late Jurassic (Late Oxfordian to Early Tithonian) preserved in the Malm Group above Wildegg Formation
Refer to Fig. 4‑3 for a schematic representation of depositional environments. The north arrow refers to present-day geographic north.
In the three siting regions, the Malm Group above Wildegg Formation comprises the Villigen Formation, Schwarzbach Formation as well as the «Felsenkalke» and «Massenkalk» (Fig. 4‑51). The top of this unit is truncated by a major diachronic erosive unconformity, overlain by residual deposits from the Eocene («Siderolithic Group»; Chapter 3). At the northeastern boundary of the map of Fig. 4‑50 in southern Germany, the last preserved Mesozoic rocks are of Early Tithonian age (Hangende Bankkalke Formation; Zaugg et al. 2008, Koch 2019). In the southwest of the map, the erosion has nearly reached the base of the Villigen Formation. North of Olten, at the western edge of the map, even the Wildegg Formation is missing, and the erosion has reached late Middle Jurassic sediments. In the JO siting region, an approximately 50 m succession of the Malm Group above Wildegg Formation, i.e. Villigen Formation, was found in the BOZ1, and BOZ2 boreholes (Fig. 4‑50). In the NL and ZNO siting regions, parts of the «Felsenkalke» and «Massenkalk» are preserved beneath the unconformity. The thickness of the Malm Group above Wildegg Formation has been confirmed in boreholes, between 175 and 250 m in NL and between 230 and 240 m in ZNO.
The Villigen Formation mostly consists of well-bedded limestone (mudstone, packstone, (bio-) micrite) with generally similar characteristics in all the siting regions (Fig. 4‑51, Fig. 4‑52a – c). Some of the layers are glauconitic and some fossiliferous with sponges (boundstone), crinoids, bivalves, and ammonites. In NL and ZNO, the Villigen Formation has a thickness between ca. 60 and 80 m (Fig. 4‑51). The Villigen Formation is subdivided into the Geissberg, Crenularis, Wangen and Letzi Members in the western part of Northern Switzerland, and into the Hornbuck, Küssaburg and Wangental Members in the eastern part (Gygi 1969, 2000b).
The Schwarzbach Formation (former «Mittlere Malmmergel») consists mostly of a bedded succession of glauconitic limestone (argillaceous) and some glauconitic, calcareous marl (Fig. 4‑52d). It has similar characteristics in the NL and ZNO siting regions and is a lateral equivalent of the Baden Member of the Burghorn Formation. The limestones consist of different carbonate textures (mudstone, wackestone, some packstone) and lithotypes (micrite, biomicrite, biopelmicrite). The Schwarzbach Formation has an increased clay-mineral content in comparison to the underlying and overlying formations (Fig. 4‑51). The boundary to these formations is gradual rather than abrupt. The Schwarzbach Formation is fossiliferous and comprises sponges, ammonites, belemnites, bivalves, and some crinoids. Traces of bioturbation are common. It has a thickness in the range between ca. 10 and 25 m.
The «Felsenkalke» (former «Quaderkalk», «Plattenkalk» or «Bankkalk») and «Massenkalk» represent two different facies units that were deposited next to each other. They are regarded here in combination as an informal unit in the rank of a formation and have a thickness in the range between ca. 85 and 155 m (Fig. 4‑51). They share similar characteristics in NL and ZNO. The «Felsenkalke» unit largely consists of typically micritic, mostly well-bedded limestone (mudstone, wackestone to packstone, micrite, biopelmicrite) with decimetre-scale marl and limestone (argillaceous) interbeds (Fig. 4‑52e). Many horizons of the «Felsenkalke» are fossiliferous, including ammonites, some sponges, belemnites, crinoids, and brachiopods. The «Massenkalk» consists of massive limestone with algal sponge bioherms (boundstone, packstone, biomicrite to pelmicrosparite) up to decametres in size (Fig. 4‑52f). Additionally, benthic fauna such as echinoderms can be found. The strata of the «Massenkalk» are originally dominated by siliceous sponges and also diagenetic siliceous nodules may occur. In some intervals, the sponges are no longer visible because of dolomitisation and dedolomitisation, leading to a saccharoidal limestone (Koch 2011). Such saccharoidal limestones are characterised by brown-yellow colour, variable dolomitic content and vugs (Geyer et al. 2023). These processes can also spread from the «Massenkalk» into the «Felsenkalke». The differentiation between the two facies units in boreholes can be gradual. «Felsenkalke» and «Massenkalk» also contain palaeokarst features that are filled with siderolithic claystone («Boluston»; Fig. 4‑52g, Chapter 3).
The Villigen Formation is dominated by limestone and shows relatively low variability (Fig. 4‑51). Lateral correlation of calcareous successions can be guided by marker beds such as the «Knollen Bed», which, however, could not be identified in all boreholes. Occurrence of sponges, especially in the Hornbuck Member, may lead to lateral and vertical variability as they can form bioherms of very local extent.
The Schwarzbach Formation shows relatively low variability and can be laterally well correlated (Fig. 4‑51). Additionally, the general succession of more calcareous to argillaceous beds within the Schwarzbach Formation seems to be correlatable, especially in the boreholes of NL.
The facies units of the «Felsenkalke» and «Massenkalk», interfinger laterally and vertically, but both facies units are dominated by limestones. The sponge bioherms of the «Massenkalk» probably formed mounds that were surrounded by the well-bedded «Felsenkalke». These mounds can have lateral extents of few decametres to several kilometres (Geyer et al. 2023). Additionally, beds particularly enriched in fossils and glauconite exist. One of these beds, the «Glauconitic Marker Bed», was identified as a marker horizon by Gygi (2000a).
The Villigen Formation was deposited in the Late Jurassic during the Late Oxfordian to Early Kimmeridgian (Gygi 2000a). The Schwarzbach Formation was deposited mainly in the later Early Kimmeridgian and the «Felsenkalke» and «Massenkalk» in the Late Kimmeridgian. Timelines were picked approximately at the boundaries of the formations (154.8_Oxf_300, 149.2_Kim_700, 149.2_Kim_400, 149.2_Kim_100). However, the top of the «Felsenkalke» and «Massenkalk» is a major unconformity and is therefore diachronous.
The Villigen Formation, Schwarzbach Formation, «Felsenkalke» and «Massenkalk» were deposited in a basinal domain of the epicontinental sea that connects the Celtic or Rauracian Platform in the west and the Swabian Basin in the northeast (Fig. 3‑10). The nearest mainlands were the London-Brabant and Rhenish Massifs in the north and the Bohemian Massif in the east. To the south, the Helvetic and Briançonnais shelf margin merged into the Piemont – Liguria Ocean (Gouffon 2024). Calcareous oolites were deposited on the carbonate platform to the west and mostly at the platform margin coral bioherms also grew (Olten Member of the Balsthal Formation; Gygi 1990). The depositional environment of the study area was dominated by a carbonate ramp, locally with bioherms partly in a basinal setting and sedimentation rates that were generally high (Fig. 4‑5, Fig. 4‑6). However, glauconitic, fossiliferous and nodular horizons indicate depositional phases with reduced sedimentation rates. Sponges occur throughout the Malm Group above Wildegg Formation, particularly extensive sponge bioherms exist in the Hornbuck Member of the Villigen Formation and in the «Massenkalk». In comparison to the Early Oxfordian, the environment documents a general decrease in terrestrial input and an increase in carbonate production also in deeper water. An exception is the time interval during which the deposits of the Schwarzbach Formation were formed, which reflects an intermittent relative increase in argillaceous input relative to carbonate production and input. The variations in terrestrial and carbonate input could reflect variations related to climate and eustatic sea level changes (Gygi 2000b).
Fig. 4‑51:Stratigraphic borehole correlation of the Malm Group above Wildegg Formation
For lithological nomenclature refer to Naef et al. (2019). Clay-mineral content after Becker & Marnat (2024). Some of the boundaries and lithologies as discussed in the original reports were adjusted to integrate all presented borehole data.
Fig. 4‑52:Selected core photos of the Malm Group above Wildegg Formation
(a) Top Hornbuck Member (627.20 m) with grey to beige biohermal limestone, very fossiliferous (sponges, echinoderms) and dark grey bioclastic calcareous marl; (b) medium light limestone, with interlayers of dark grey argillaceous to calcareous marl; (c) light grey limestone, strongly bioturbated with thin seams of claystone, mostly reduced to stylolites; (d) dark grey bioclastic calcareous marl, glauconitic, fossiliferous (bivalves, belemnites, crinoids), bioturbated, with grey interlayers of limestone, argillaceous, bioturbated; (e) medium grey limestone, with thin beds of calcareous marl; (f) beige-grey, massive limestone, fossiliferous (many sponges); (g) beige limestone with palaeokarst fissures filled with variegated claystone.
The Opalinus Clay exhibits similar characteristics in all the siting regions, with high clay-mineral content and relatively small vertical and lateral variability. This can be attributed to deposition in an epicontinental marine basin characterised by clay-mineral-rich input, generally high sedimentation rates and a relatively homogeneous environment. The thickness of the Opalinus Clay is similar in all three siting regions (104 – 122 m). In NL, the Opalinus Clay is slightly thinner compared to JO and ZNO, but the layers directly above the Opalinus Clay have a higher clay-mineral content compared to the other siting regions (> 35% over large sections). In the eastern part of NL, the clay-mineral-rich zone including Opalinus Clay and these overlying rocks reaches thicknesses > 130 m.
In all the siting regions, the lower and upper confining units of the Opalinus Clay have an overall high clay-mineral content but are more variable (e.g. intercalated sandy, calcareous, or dolomitic interlayers).
Underlying the Opalinus Clay, the Staffelegg Formation is dominated by strata rich in clay minerals, including more calcareous intercalations. These units reflect marine conditions with changing depositional environments. The lateral extent of the individual units is large, therefore the differences between the siting regions and the variability within the siting regions are small in this formation.
The stratigraphic succession further below (Klettgau Formation) is more variable and preserves intercalated terrestrial and marine sedimentary rocks. The stratigraphically uppermost, potentially water-conductive unit is the Seebi Member, which is thickest and most porous in ZNO (sandstone and dolomitic breccia), thinner and less porous in NL (mainly dolostone) and absent in JO. The next prominent unit with low clay-mineral content is the Gansingen Member. It is thickest, dolomite-rich and most porous in JO and increasingly thinner and more anhydritic towards the east. Sandy intercalations lower in the succession (Ergolz Member) were deposited in fluvial channels in a floodplain environment. These facies are local, difficult to predict, and can be present in all the siting regions.
Further down-section, above the regional Muschelkalk aquifer (Schinznach Formation), the Bänkerjoch Formation is represented by an evaporitic to clay-mineral-rich succession, mainly deposited in a sabkha environment.
The successions above the Opalinus Clay differ between the three siting regions. In JO and ZNO, the generally clay-mineral-rich units following the Opalinus Clay contain numerous calcareous and sandy beds. In NL, the decametre-thick interval above the Opalinus Clay exhibits a higher clay-mineral content compared to JO and ZNO. In the eastern part of NL, this clay-mineral-rich succession is interpreted to result from a depositional positive relief formed by marine bottom currents during the Bajocian. This topographically high area favoured the growth of an isolated carbonate platform several square kilometres in size («Herrenwis Unit»). Up-section, clay-mineral-rich deposits dominate in NL and ZNO with thickness variations reflecting the filling of the basin around the carbonate platform. As a result of this depositional succession, the «Herrenwis Unit» represents an isolated body embedded in clay-rich rocks.
In contrast, in JO carbonate deposition is represented by strata in the upper part of the Dogger Group (Hauptrogenstein). The easternmost part of the carbonate platform and its margin are recognised in the JO siting region (platform in the west, basin towards the east).
The uppermost unit (Wildegg Formation) below the regional Malm aquifer is represented by successions of limestone and calcareous marl with a pronounced reduction in thickness from west to east in the study area.
Key points:
- The tectonic evolution of Northern Switzerland is linked to the evolution of the surrounding tectonic domains. These are the Konstanz – Frick Trough (and in general the pre-structured Paleozoic basement), the Jura Fold-and-Thrust Belt, the Upper Rhine Graben and the Hegau – Bodensee Graben.
- In general, inherited faults act as zones of weakness within the less deformed rock volume and later deformation preferentially localises along them.
- The geodynamic evolution is summarised by two phases of sedimentation and burial
(Mesozoic and Paleogene – Neogene) separated by a phase of subaerial exposure. Miocene NW propagation of the Alps formed the Jura Fold-and-Thrust Belt. - The Triassic salt layers acted as décollement level during the NW-propagation of the Alpine front in the eastern Jura Fold-and-Thrust Belt. No evidence for a secondary décollement within the Opalinus Clay was observed within the siting regions.
- All the siting regions show areas devoid of seismically mappable faults. NL includes the largest of such areas.
In this section, the structural setting of the three siting regions within the framework of the tectonic setting of Northern Switzerland is described. In the context of the siting process for a deep geological repository, knowledge of the occurrence and architecture of faults is relevant as such structures may affect the properties of the rock volume. The following sections are focused on the siting regions and the framework of consideration is enlarged only sporadically. The chapter starts with a terminology section (Section 4.3.2), as structural geology terms might have slightly different meanings within different scientific communities. Section 4.3.3 provides an overview over the regional tectonic setting, with the focus on the larger tectonic structures such as the Konstanz – Frick Trough. Section 4.3.4 provides a description of the structures encountered during the characterisation of the siting regions, taking into account the interpretation of the 3D seismic reflection data and the observations from the recently drilled deep boreholes (Tab. 2‑1). A focused description of deformation in the Opalinus Clay is given in Section 5.5.
The general geological evolution of Northern Switzerland has briefly been introduced in Chapter 3. Section 4.3.5 elaborates on the tectonic evolution since Early Jurassic times in more detail and adds insights gained from the structural investigations during SGT Stage 3 and from recent investigations of the burial and temperature history by analyses of veins from outcrops and drill cores. Section 4.3.6 characterises key factors that influenced the present-day structural inventory in the siting regions. The chapter concludes with Section 4.3.7. Neotectonic activity (i.e. indications for post-Pliocene tectonic deformation) are discussed in Section 6.2.
Considering the different spatial scales of geological structures observed in the three siting regions, it is necessary to use a unifying terminology for a comparative analysis of the siting regions. For the sake of consistency with previous work carried out by Nagra, in this chapter the terminology originally employed for the description of structures recorded in the cores of the TBO boreholes is adapted (Tab. 2‑1).
Generally, a distinction is made between Mohr-Coulomb brittle failure and ductile deformation. Stylolites, shear zones and mylonites as defined in Ebert & Decker (2019) were identified as ductile structures. The Mohr-Coulomb brittle failure structures are called fractures as an overarching term. Extensional fractures are called joints; these may be barren or veins when filled. The term fault refers to fractures that have experienced shearing detectable on the scale of observation (e.g. in hand specimens). To better convey the variable dimension covered by the term fault, faults were subdivided according to their size into regional fault zones, local faults, small-scale faults and micro faults (Fig. 4‑53). The structural terminology used in this report is summarised in Tab. 4‑1.
Tab. 4‑1:Summary of the structural terminology for faults across the observation scales
|
Tectonic structure |
Definition |
Dimensions |
|---|---|---|
|
Regional tectonic elements |
Regional tectonic element is an overarching term encompassing (i) regional fault zones and (ii) zones of increased tectonic complexity. |
km-scale length |
|
Regional fault zone |
Regional fault zones encompass seismically mappable, relatively closely spaced and clustered faults in the Mesozoic strata associated with established Northern Switzerland tectonic elements. |
km-scale length Displacement is variable among the structures and dependent on structural style (typically 10 m to 10s of metres) |
|
Zones of increased tectonic complexity |
Overarching term including (a) zones characterised by an increased number of local faults mapped in seismic reflection data, but devoid of a distinct regional trend, (b) zones with diffuse deformation linked to a regional fault zone and (c) structural setting known to bear the potential for increased sub-seismic deformation, e.g. in connection with major regional basement structures. |
km-scale length |
|
Local fault |
Seismically mappable faults or faults identified in outcrops that are solitary structures and are not part of the regional fault system. |
100s of metres scale length Displacement is dependent on structural style (typically m to few 10s of m) |
|
Seismically mappable fault |
Seismically mappable faults are faults matching the criteria defined by a number of fault diagnostic signatures in seismic reflection data (Nagra 2024a, 2024b, 2024c). |
Faults with vertical offset > 5 – 10 m can be detected consistently in the central part of the three siting regions. In many cases, also smaller features can be detected by 3D seismic reflection data |
|
Sub-seismic faults |
Faults that are too small to be detected by faulting diagnostic signatures in seismic reflection data. |
Maximum vertical offset of subseismic fault is < 10 m in the central part of the three siting regions. In many cases, also smaller features can be detected by 3D seismic reflection data (Nagra 2024a, 2024b, 2024c) |
|
Small-scale fault |
A small-scale fault is a complex planar structural discontinuity with a significant width that is characterised by displacement and shear indicators. A small-scale fault is further characterised by (i) the occurrence of multiple structures, (ii) different structure types (e.g. micro faults or veins) and / or (iii) the formation of fault rock (clay gouge, cataclasite, dilation breccia etc.). |
10s of metres to few m estimated length Displacement dependent on structural style (typically cm to m) |
|
Micro fault |
Plane of shear failure, i.e. slickensides with evidence for plane-parallel movement. A micro fault is a single, thin, planar and sharp structural discontinuity with negligible volume. Micro faults show shear indications such as different types of striation. |
< few m estimated length Measured displacement is dependent on structural style (typically mm to a few cm) |
|
Joint |
A barren, closed fracture on which there is no measurable slip or dilation at the scale of observation (Hancock 1985). |
< few m estimated length |
|
Vein |
Mineral infill of a fracture with a dilatational component. |
< few m estimated length |
|
Fracture |
General term for any type of Mohr-Coulomb failure, i.e. it is applicable to structures formed by extension or shear. Fractures include approximately planar discontinuities such as faults, joints and veins (Peacock et al. 2016). |
< few m estimated length |
|
Stylolite |
Irregular, commonly jagged surface in a rock formed by local removal of material by pressure solution (Passchier & Trouw 1998). |
< few m estimated length |
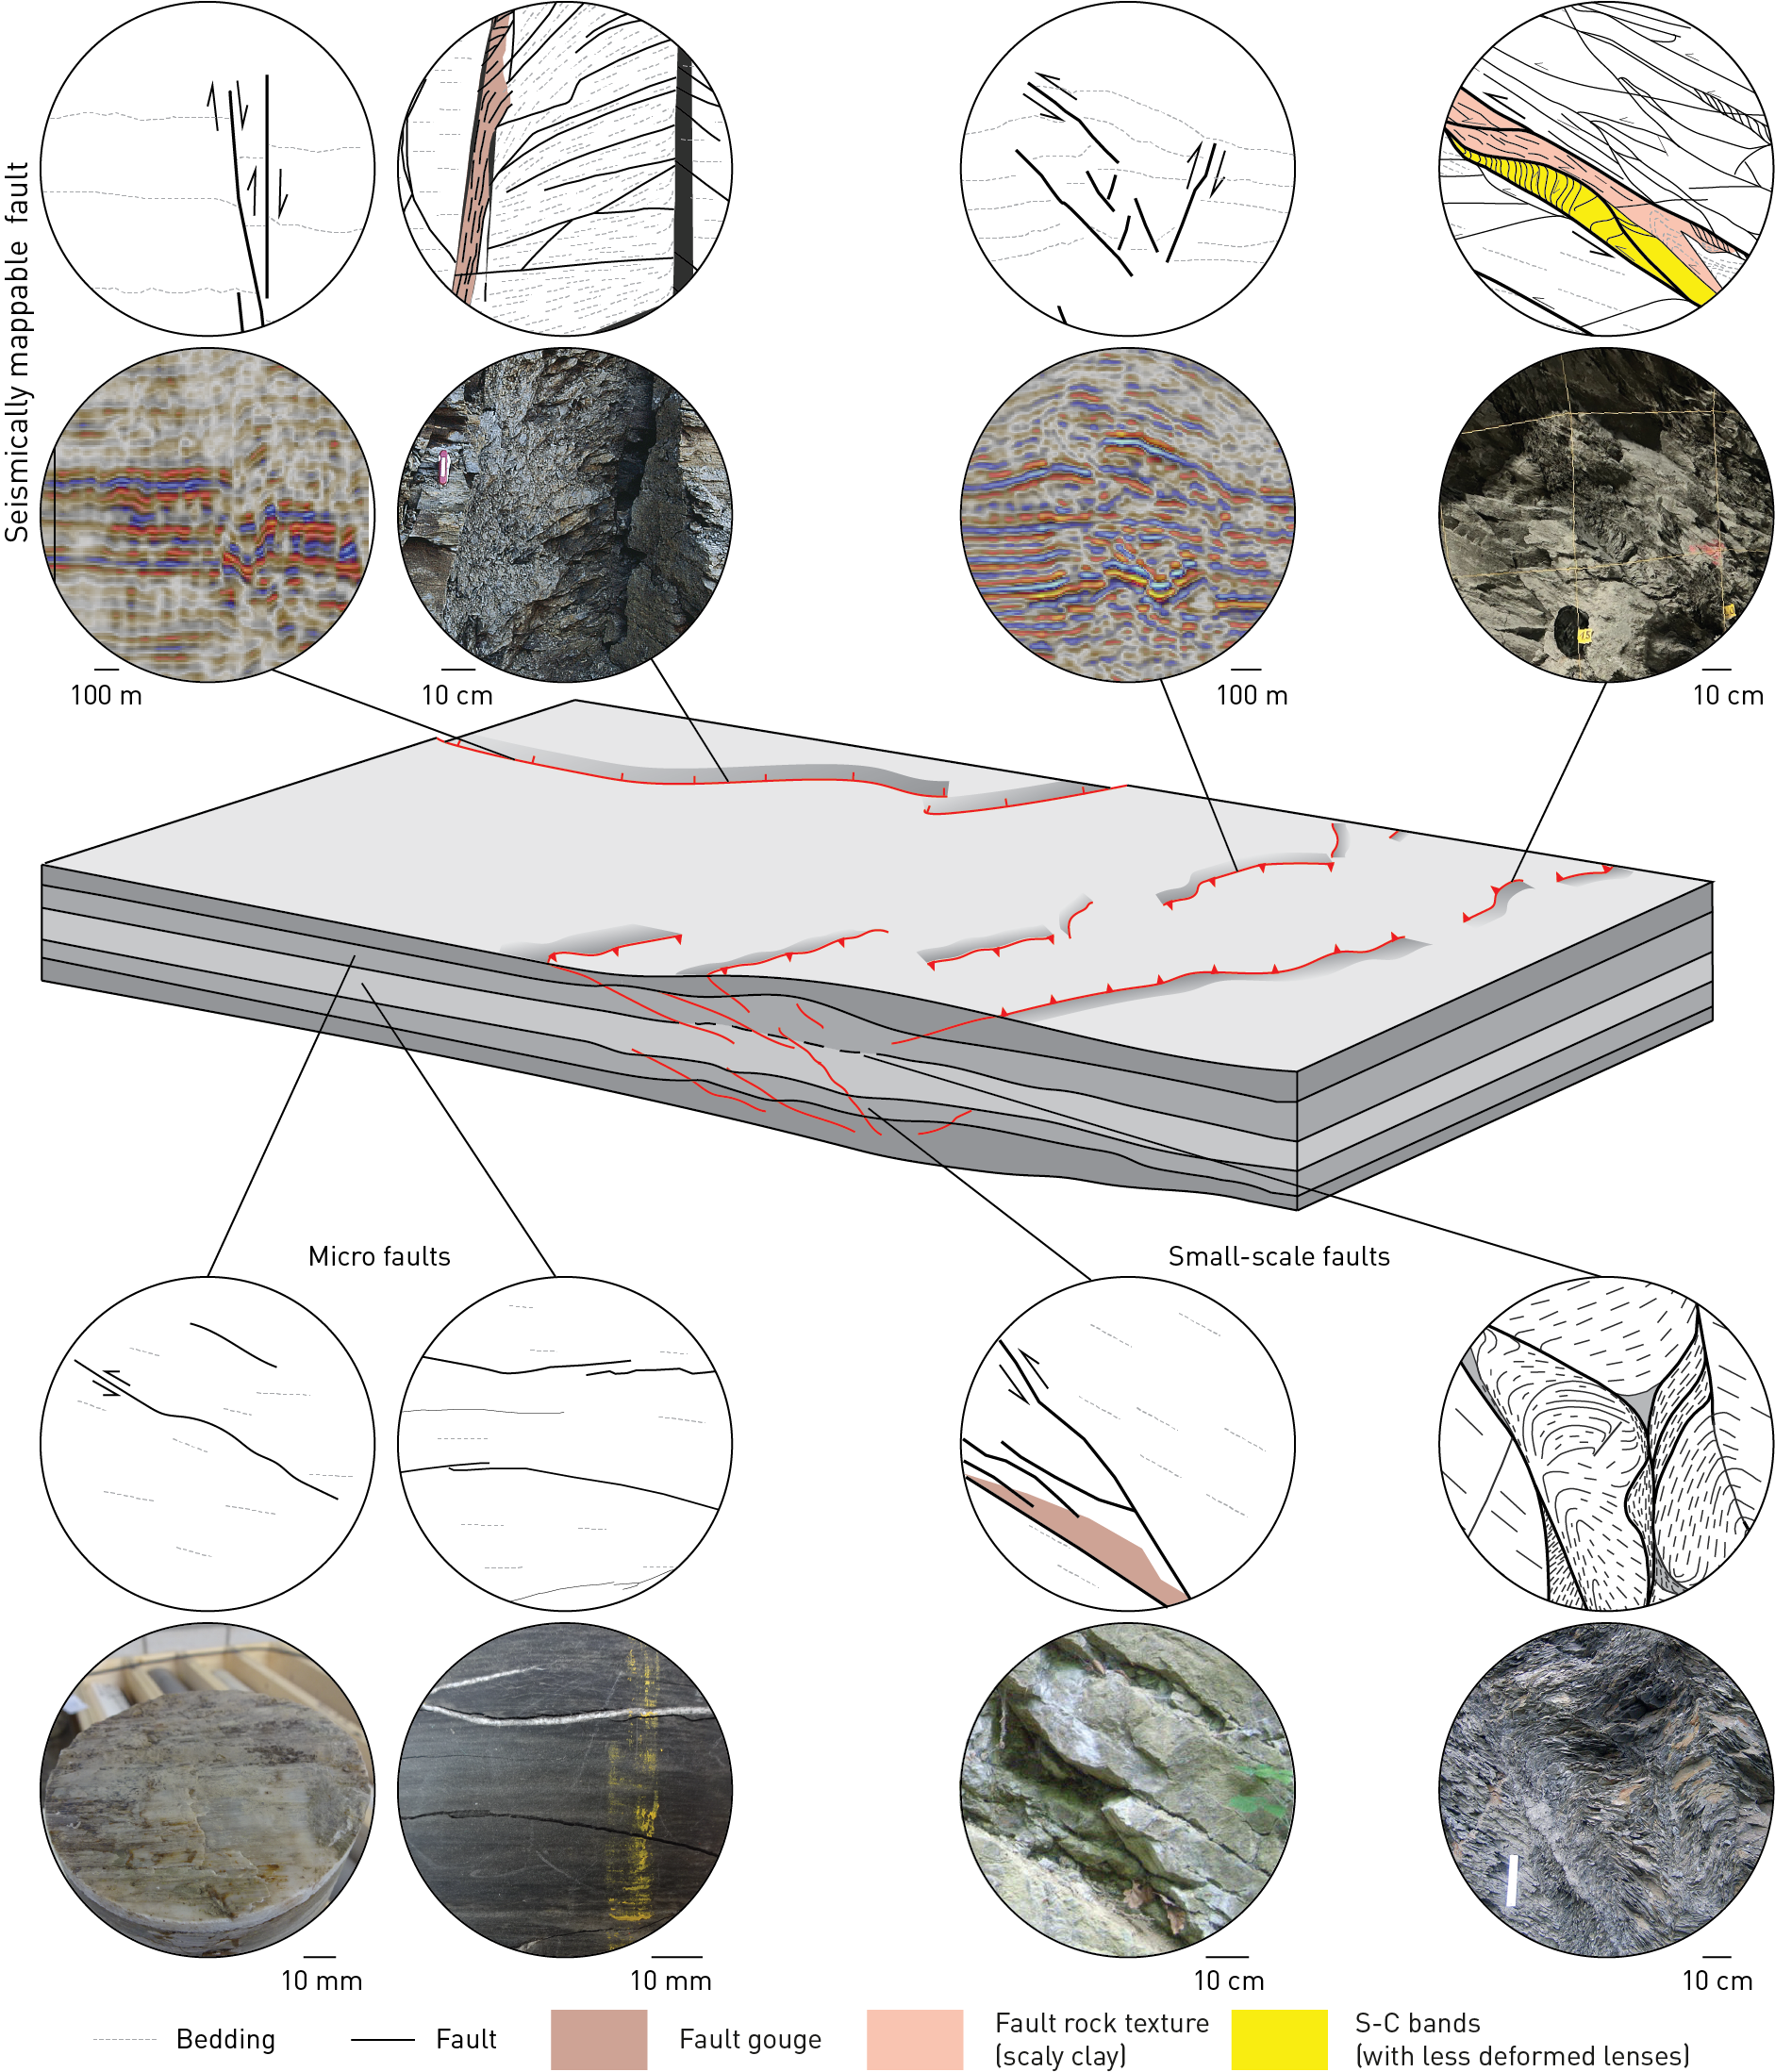
Fig. 4‑53:Conceptual block diagram showing fault terminology across the observation scales
Note the mechanical stratigraphy indicated by the grey shading and the highly segmented faults. The seismically mappable normal fault represents the Neuhausen Fault with outcrop in Siblingen. The seismically mappable reverse fault is the Baden – Irchel – Herdern Lineament and the "Main Fault" in the Mont Terri rock laboratory as an outcrop example (modified after Jaeggi et al. 2017).
As elaborated in Chapter 3, the study area is situated in the North Alpine Foreland. The siting regions sit between the Upper Rhine Graben in the west, the Hegau – Bodensee Graben in the northeast and the Jura Fold-and-Thrust Belt in the south (Fig. 4‑54). In addition, Jura Ost and Nördlich Lägern are located above the Konstanz – Frick Trough, whereas Zürich Nordost is mostly north of it. As the regional tectonic domains strongly control the structural inventory encountered in the siting regions, they are introduced below.
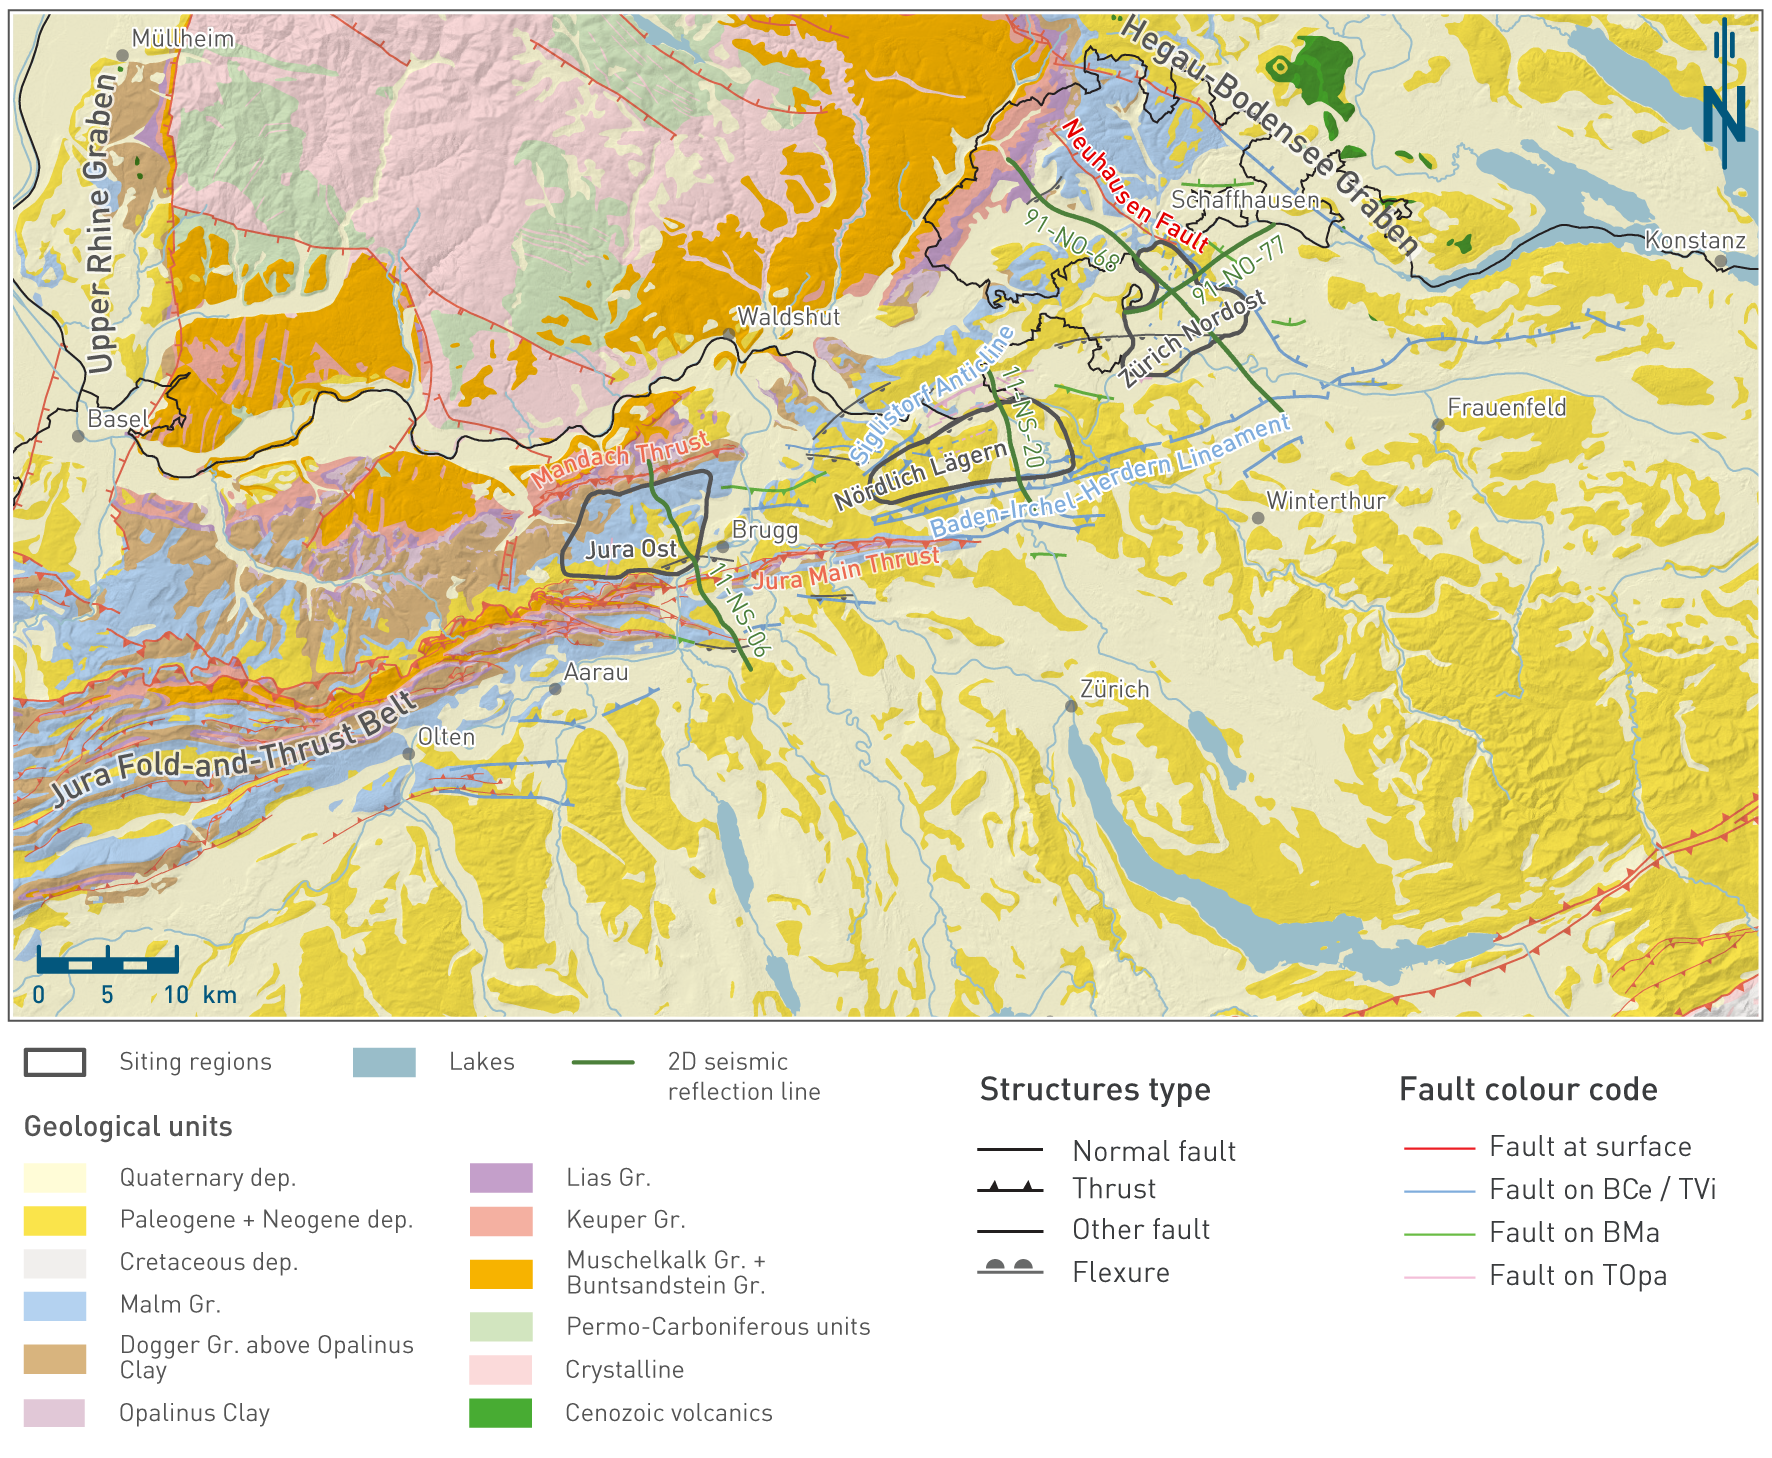
Fig. 4‑54:Geological map of Northern Switzerland with the siting regions and major faults
Geological units from 1:500'000 geological map with the addition of the Opalinus Clay outcrops in Northern Switzerland (©swisstopo). Fault traces from seismic interpretation are based on 2D seismic reflection (Madritsch et al. 2013, Meier et al. 2014) and 3D seismic reflection interpretation (Nagra 2024a, 2024b, 2024c). They are shown on the highest stratigraphic horizon where the specific fault segment was picked (different colours in the map view). Only horizons from Top Opalinus Clay and higher stratigraphic levels are shown. Note that only a selection of the structures from 3D seismic interpretation is shown to highlight the structural trends of regional importance. See Fig. 4‑61, Fig. 4‑65 and Fig. 4‑69 for the complete fault pattern.
Konstanz – Frick Trough (Permo-Carboniferous Trough)
The oldest tectonic domain, thought to have acted as an inherited zone of crustal weakness for an extended period of time, is the so-called Konstanz – Frick Trough, which is a graben filled with Permo-Carboniferous sedimentary rocks (Chapter 3). Available knowledge on the buried Konstanz – Frick Trough is derived from boreholes, 2D seismic reflection lines and 3D seismic reflection surveys (e.g. Diebold et al. 1991, Marchant et al. 2005, Madritsch et al. 2013, Naef & Madritsch 2014). Despite extensive subsurface data across the area under consideration, the robustness of the delimitation of the Konstanz – Frick Trough varies considerably (Madritsch et al. 2018). Its northern boundary is well constrained by boreholes, seismic reflection data and outcrops of crystalline basement in the neighbouring Black Forest Massif. The southern boundary is less well defined. It is suspected to roughly coincide with the front of the Internal Jura (Diebold & Noack 1997, Laubscher 1985, Malz et al. 2016). A tentative map of potential Carboniferous troughs underneath the entire Swiss Molasse Basin was presented by Leu (2008).
The Konstanz – Frick Trough is subdivided into a western segment (between Frick and the lower Aare Valley) and an eastern segment (east of the lower Aare Valley; Diebold et al. 1991). The transition between the two segments occurs across a system of NW-SE-trending faults (Fig. 4‑55, Vorwald Fault). The western segment is characterised by a wider and deeper central depocentre, whereas the eastern segment has wider trough shoulders with decreased sedimentary infill. JO is located above the western segment, whereas NL and the S-SW corner of ZNO are located above the eastern segment (Fig. 4‑55). The transition between the western and eastern segments occurring around an inherited fault system provides evidence for the major control exerted by such inherited faults – and by the pre-structured basement in general – on later deformation.
The main understanding of the tectonic evolution of the Konstanz – Frick Trough derives from the analysis of its sedimentary filling. From this, a three-stage subsidence history has been proposed (Diebold et al. 1991). Late Carboniferous deposition of organic-rich sediments was followed by the main subsidence phase in the Early Permian (~ 295 Ma onwards; Madritsch et al. 2018). Deposition of Late Permian sediments occurred during the late- to post-rifting stages of trough formation (~ 265 Ma).
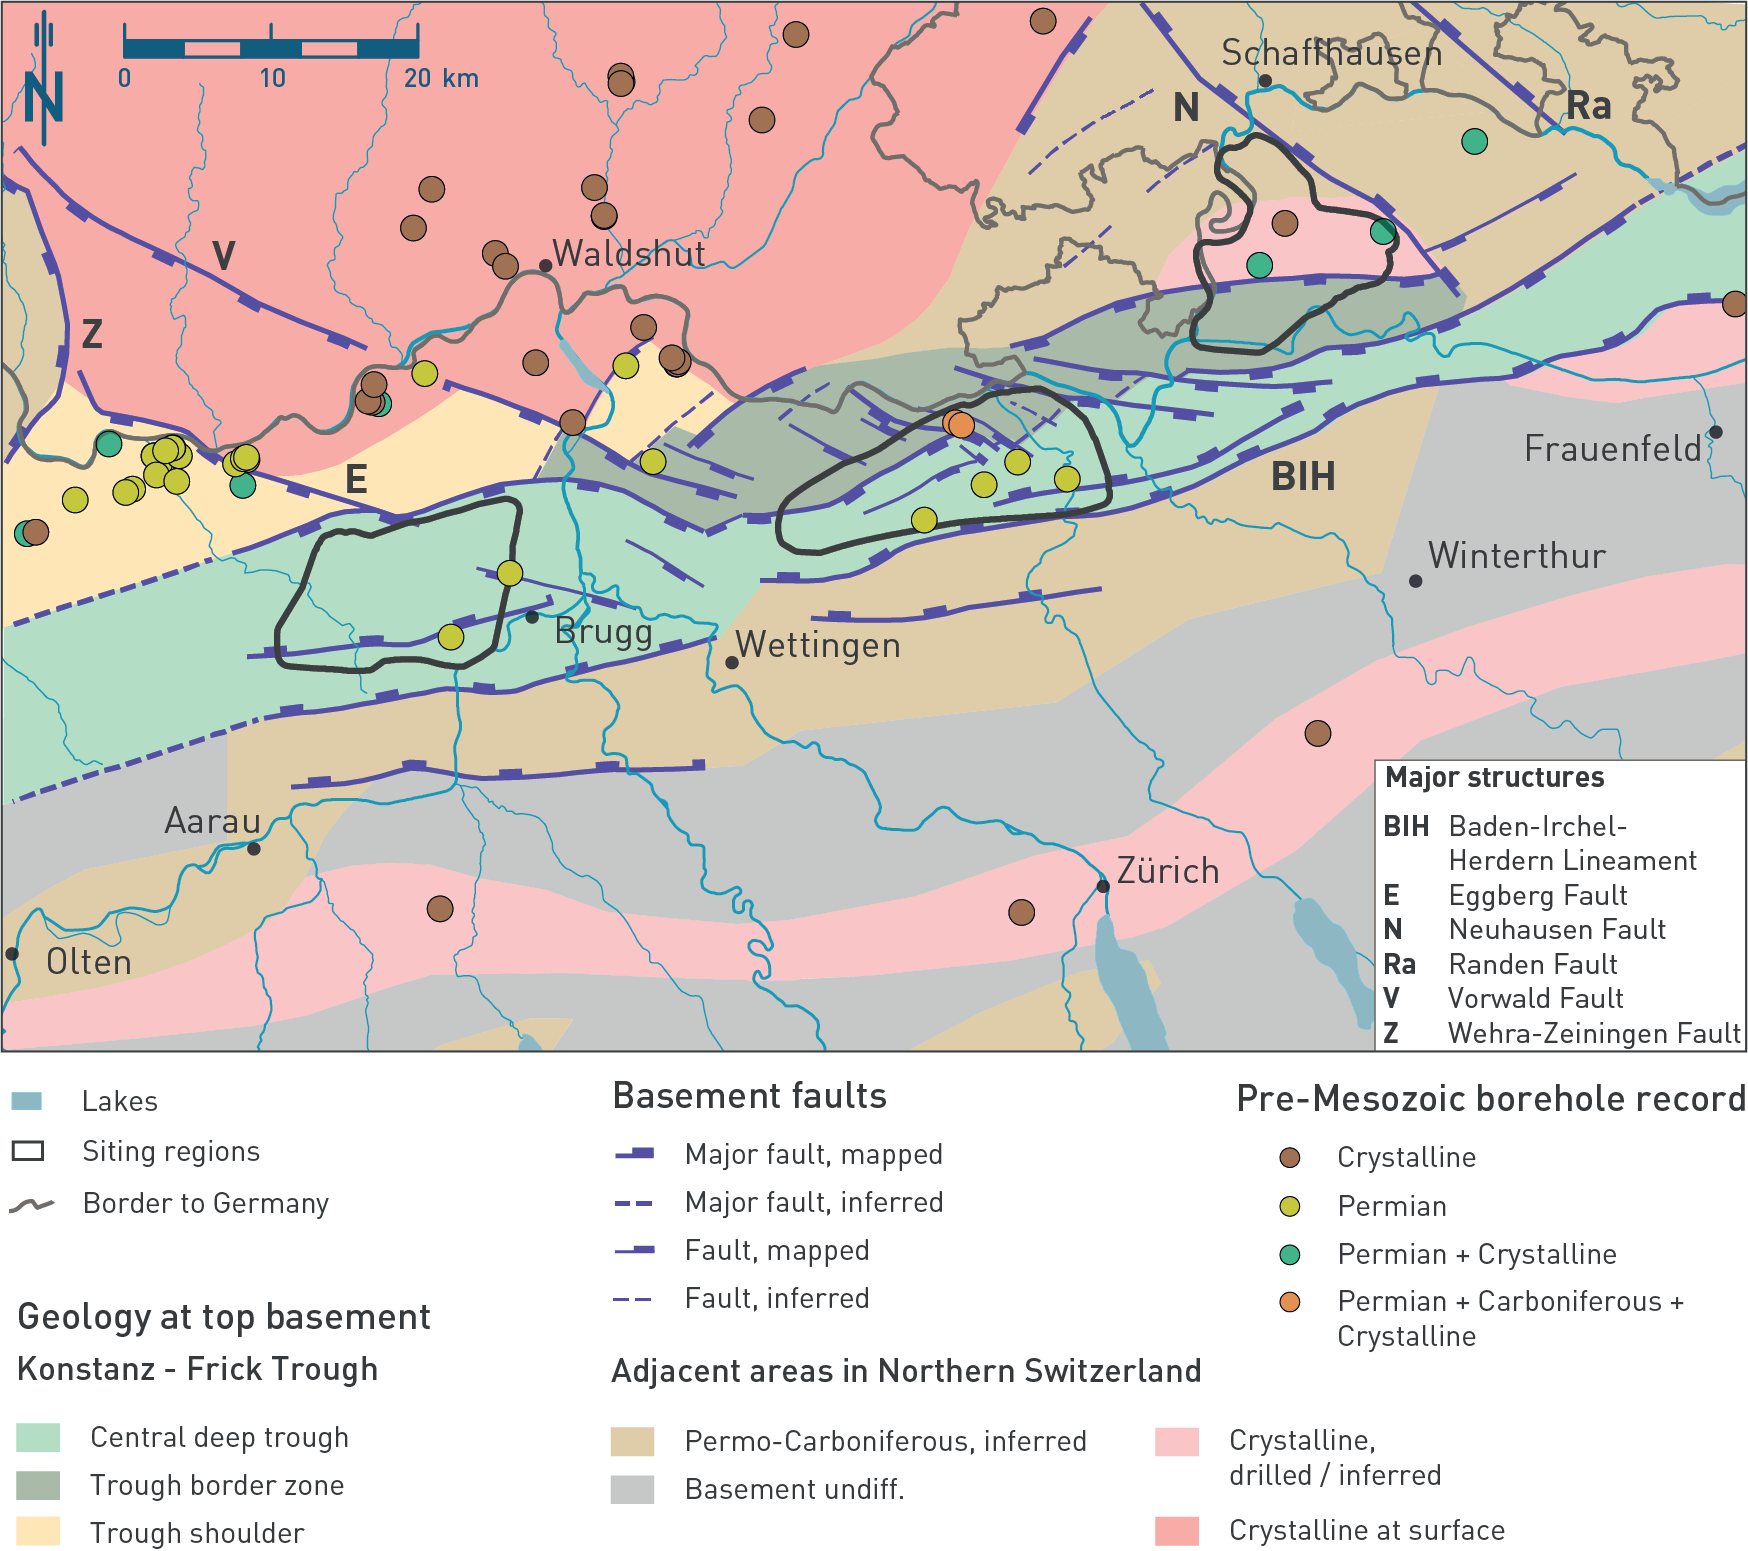
Fig. 4‑55:Conceptual tectonic map at top basement showing the main faults and the extent of the Konstanz – Frick Trough
Modified after Madritsch et al. (2018) and Naef & Madritsch (2014). The borehole symbol refers to the pre-Mesozoic record encountered in the borehole.
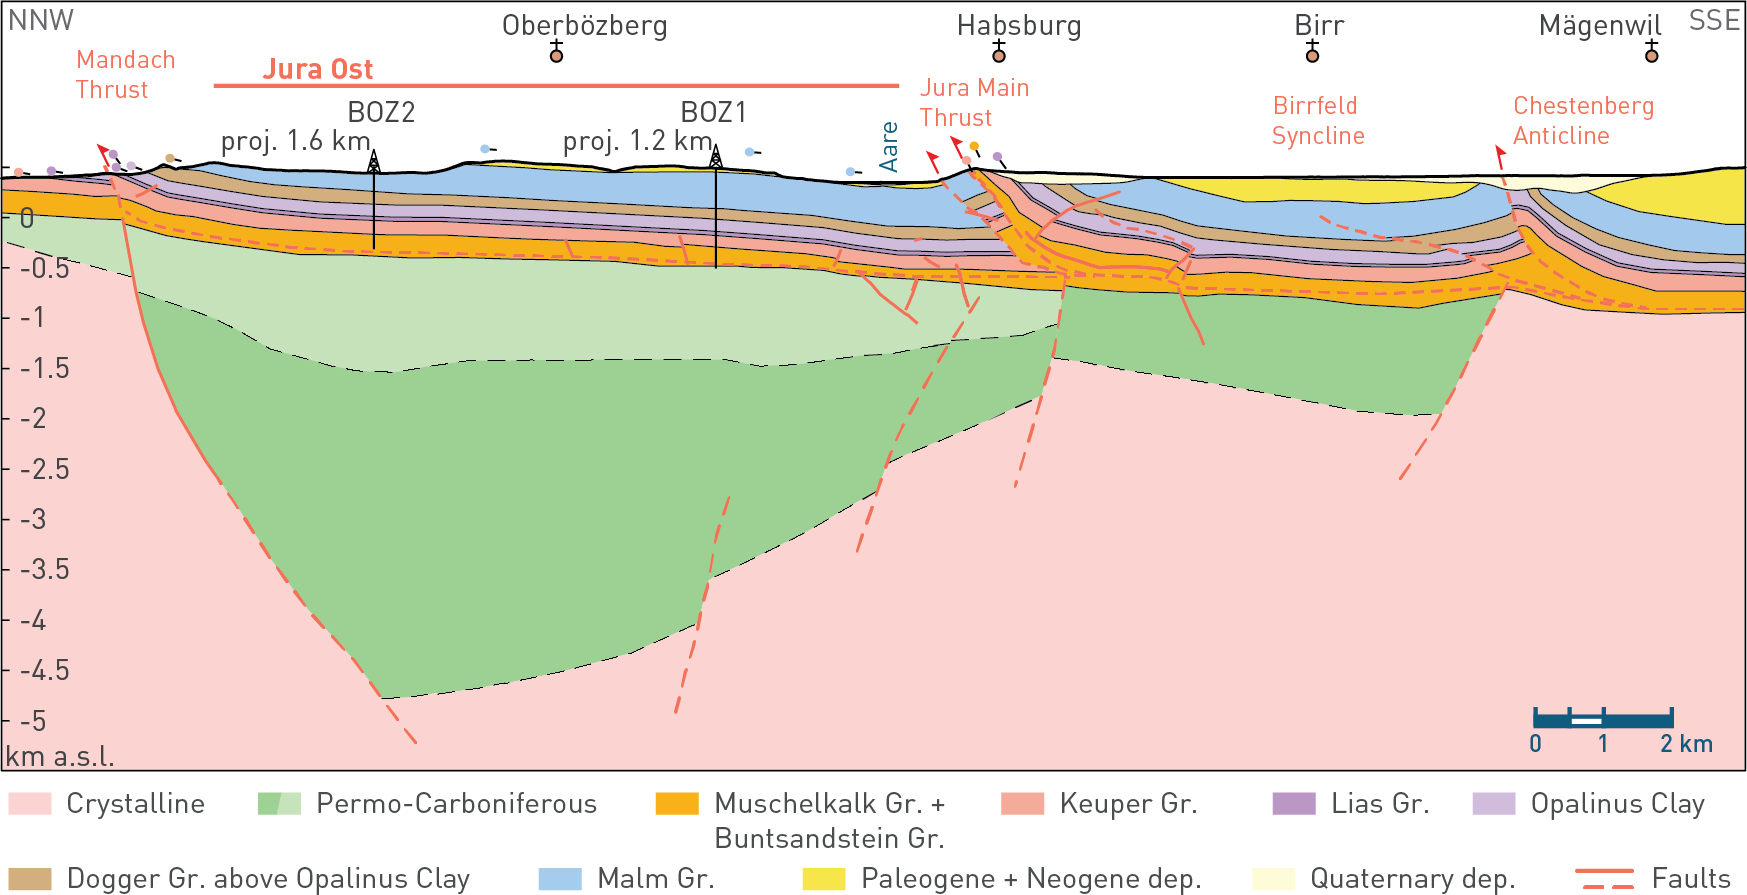
Fig. 4‑56:Large-scale geological cross-section through Jura Ost
Geological section drawn along the 2D seismic reflection line 11-NS-06. Section trace located in Fig. 4‑54. The section is based on Meier et al. (2014). Results from 3D seismic reflection interpretation were integrated within the 3D seismic perimeter (Nagra 2024a). The symbols above the topographic profile indicate bedding dip measured in nearby outcrops. Gr.: Group, Dep.: deposits.
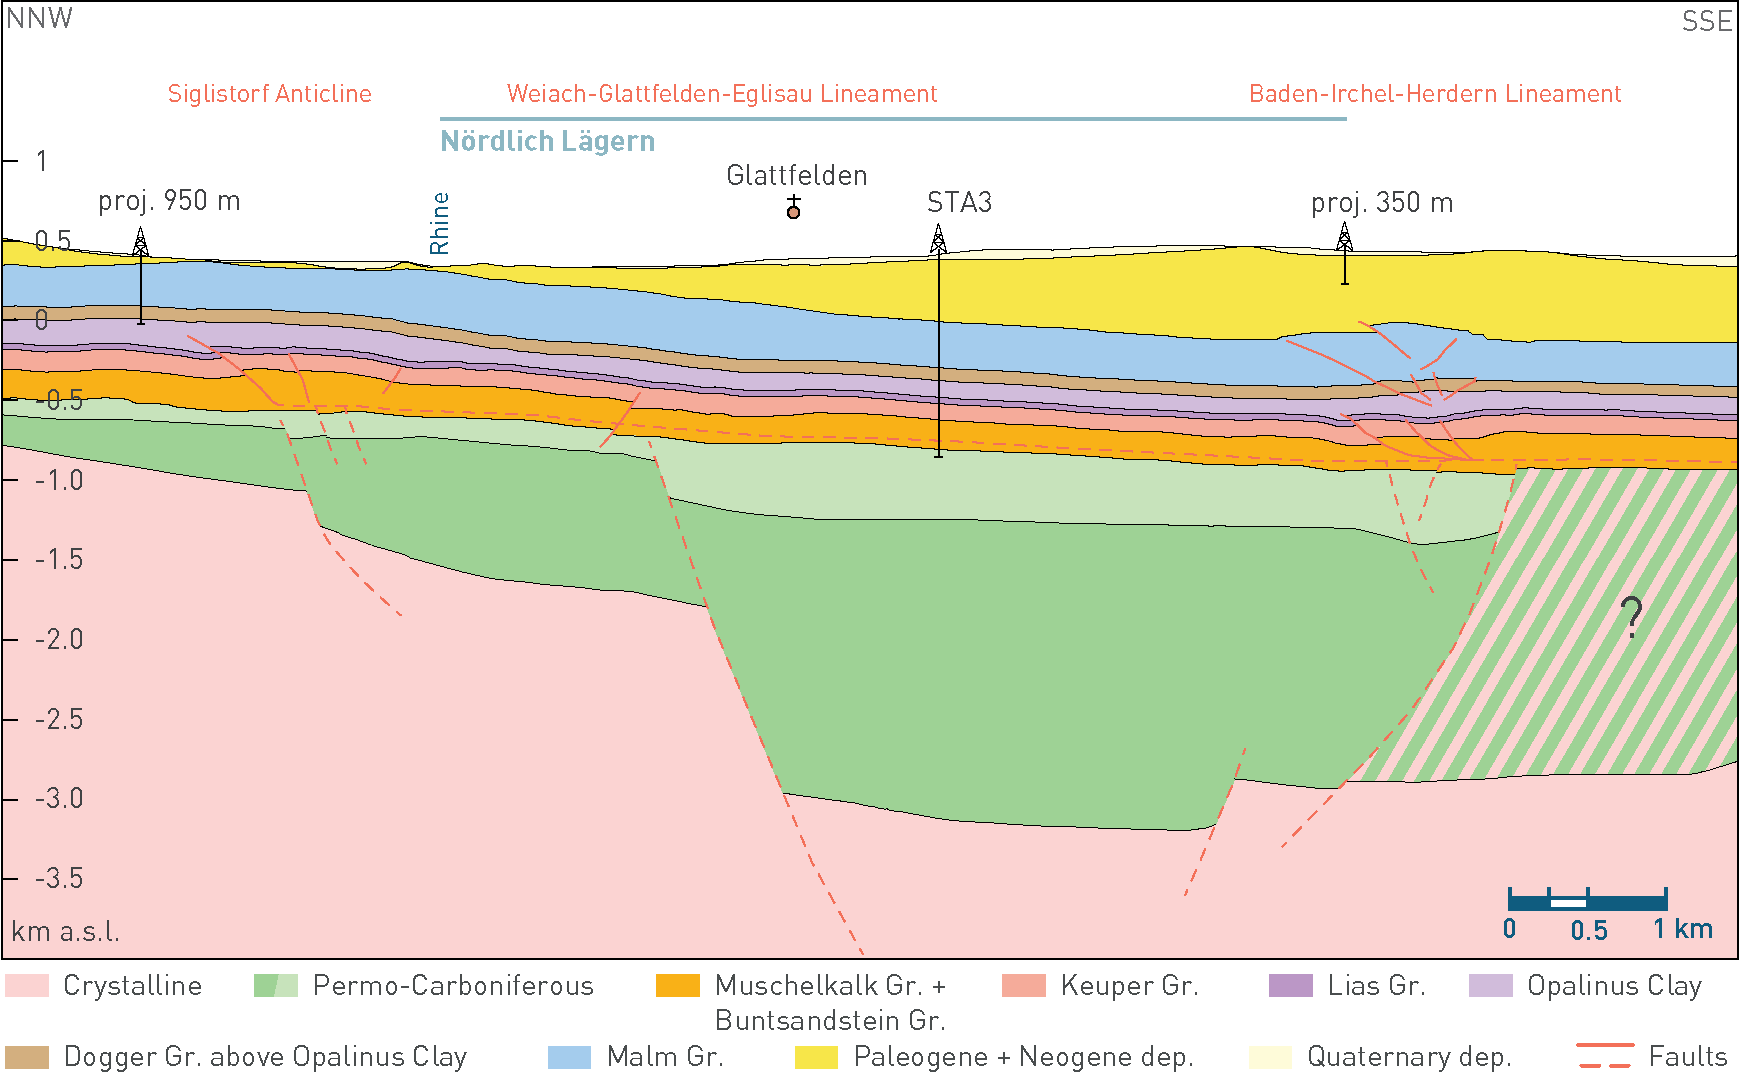
Fig. 4‑57:Large-scale geological cross-section through Nördlich Lägern
Geological section drawn along the 2D seismic reflection line 11-NS-20. Section trace located in Fig. 4‑54. The section is based on Meier et al. (2014) and Jordan et al. (2015). Results from 3D seismic reflection interpretation were integrated within the seismic perimeter (Nagra 2024b). Gr.: Group, Dep.: deposits. Green hatched area refers to either crystalline or Permo-Carboniferous deposits.
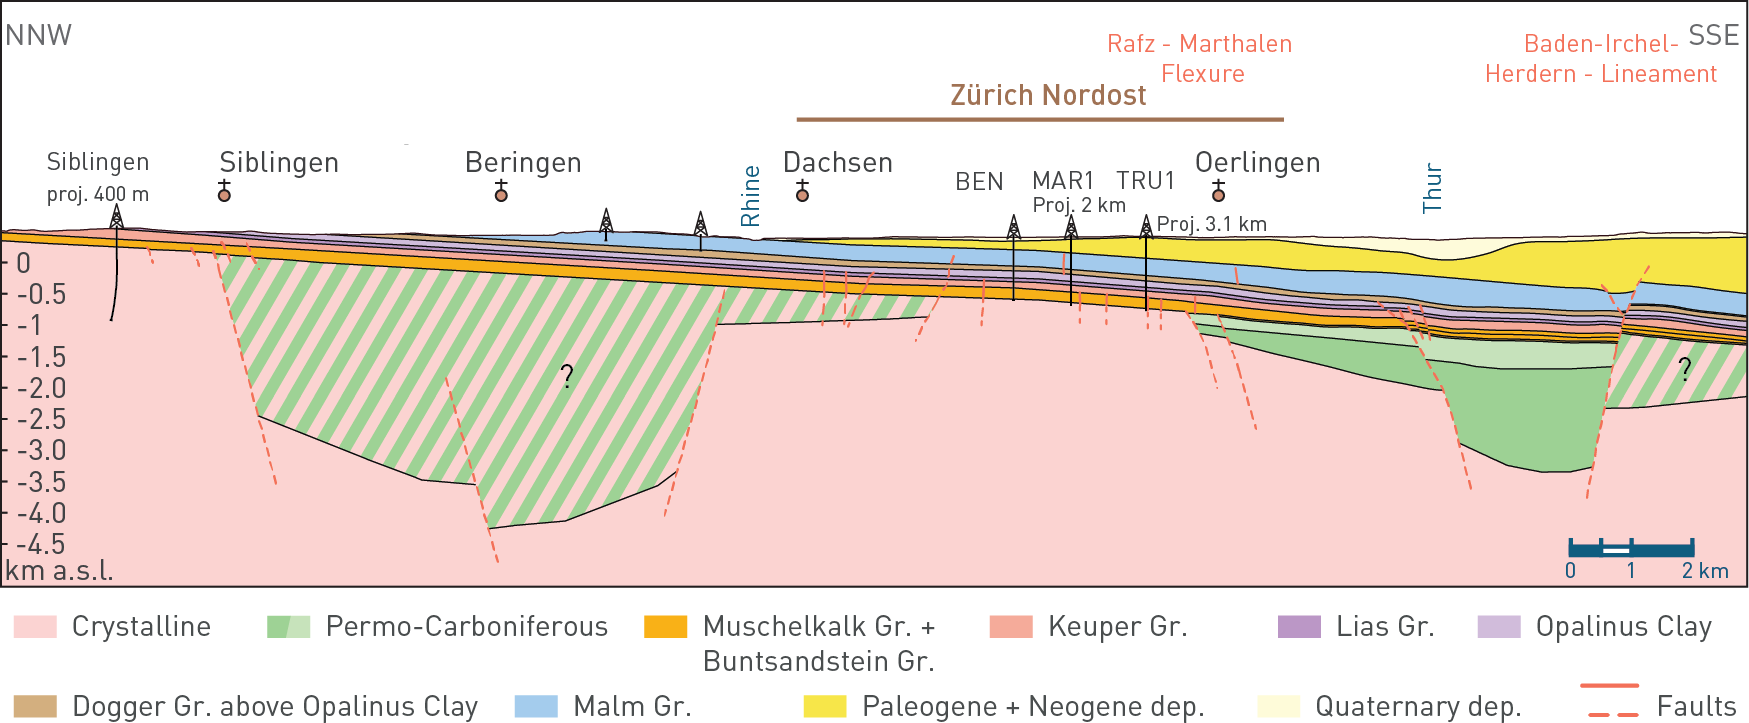
Fig. 4‑58:NNW-SSE large-scale geological cross-section through Zürich Nordost
Geological section drawn along the 2D seismic reflection line 91-NO-68. Section trace located in Fig. 4‑54. The section is based on Meier et al. (2014) and Jordan et al. (2015). Results from 3D seismic reflection interpretation were integrated within the seismic perimeter (Nagra 2024c). Gr.: Group, Dep.: deposits. Green hatched area refers to either crystalline or Permo-Carboniferous deposits.
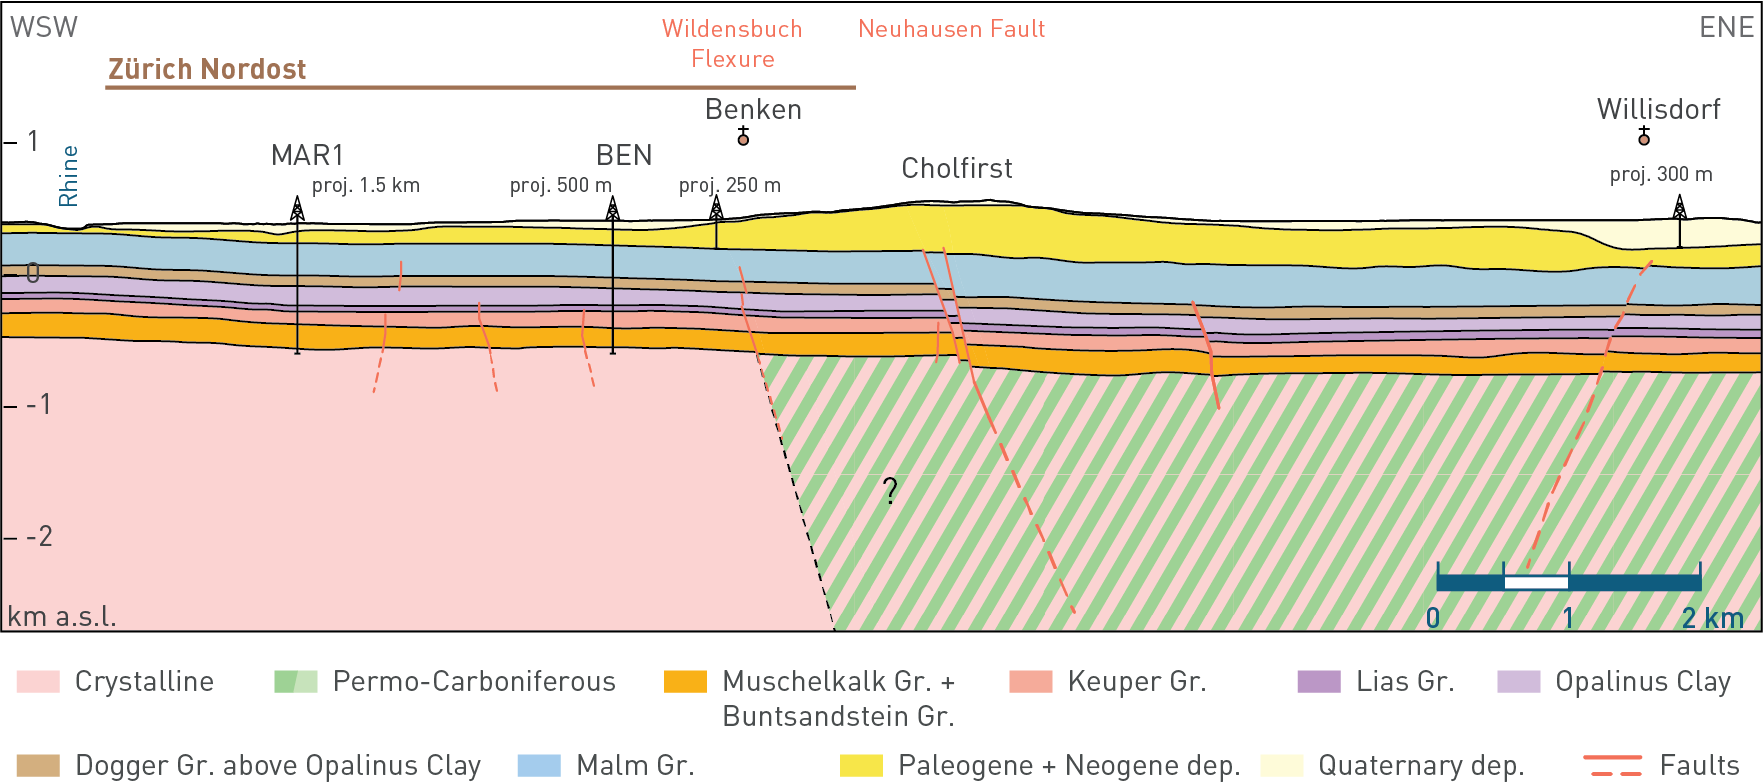
Fig. 4‑59:WSW-ENE large-scale geological cross-section through Zürich Nordost
Geological section drawn along the 2D seismic reflection line 91-NO-77. Section trace located in Fig. 4‑54. The section is based on Meier et al. (2014) and Jordan et al. (2015). Results from 3D seismic reflection interpretation were integrated within the seismic perimeter (Nagra 2024c). Gr.: Group, Dep.: deposits. Green hatched area refers to either crystalline or Permo-Carboniferous deposits.
Jura Fold-and-Thrust Belt (Internal and External Jura)
The Jura Fold-and-Thrust Belt forms some of the hills around the siting regions Jura Ost and Nördlich Lägern. It is an arc-shaped mountain range of ~ 300 km length and a maximum transect width of ~ 75 km (e.g. Marro et al. 2023, Schori 2021) and represents the outermost fold-and-thrust belt segment of the central and western European Alps. It is subdivided into a more deformed (i.e. shortened) Internal Jura (also referred to as the Folded Jura) and a substantially less deformed but still detached external domain (External Jura, formerly referred to as the "deformed Tabular Jura" or "Vorfaltenzone"; Gouffon 2024). The autochthonous part of the Jura is referred to as Tabular Jura (e.g. Sommaruga 1997).
The Internal Jura is estimated to be displaced up to 30 km to the NW in its central segment consisting of well-developed fault-bend and fault-propagation folds that resulted in local duplication of the Mesozoic cover (e.g. Laubscher 1965, Burkhard 1990, Philippe et al. 1996, Sommaruga 1997, Affolter & Gratier 2004, Ortner et al. 2024). The External Jura is composed of more deformed zones characterised by thrusts and narrow anticlinal folds that are termed "faisceaux", and of gently folded, broad synclinal blocks (i.e. plateau in Sommaruga 1997). The faisceaux (i.e. regional fault zones) were used to delimit the siting regions in previous stages of the Sectoral Plan (Nagra 2008b, 2014b). The plateaux of the External Jura (from the central and western Jura) are represented in Northern Switzerland by less deformed Mesozoic blocks. JO and NL are located within such types of blocks. The Mesozoic block hosting JO is referred to as the Herznach – Bözberg Tafel (Diebold et al. 2006). Zones of gently dipping to flat-lying Mesozoic strata are encountered in all the siting regions (Fig. 4‑54 to Fig. 4‑59). In ZNO only the SW corner (i.e. south of the Rafz – Marthalen Flexure) is part of the detached sedimentary cover. The majority of ZNO is autochthonous.
The flexural North Alpine Foreland, which encompasses the Jura Fold-and-Thrust Belt, was formed during the Alpine orogenesis. In addition to the contractional folding and thrusting of the Jura, the build-up of the Alps resulted in an extensional overprint prior to the contraction in relation with the northward propagation of the foreland. The formation of the Jura Fold-and-Thrust Belt is associated with the NW propagation of Alpine deformation along Middle Triassic evaporites (e.g. Burkhard 1990). Deformation in Northern Switzerland initiated around 14.3 Ma, as documented by, for instance, décollement-related calcite cements in the Schafisheim borehole (Looser et al. 2021). The general evolution of the Jura Fold-and-Thrust Belt is further elaborated in Section 4.3.5.
Hegau – Bodensee Graben
The tectonic domain of the Hegau – Bodensee Graben exerts a major control on the structural setting of the ZNO siting region. The Hegau – Bodensee Graben is a NW-SE oriented graben controlled by multiple faults extending to the NW from the Bodensee. Its southwestern border coincides with the Neuhausen Fault, which affects the northeastern edge of ZNO. The Hegau – Bodensee Graben formed as part of the Freiburg – Bonndorf – Bodensee Fault Zone, which extends from the Bodensee to the Upper Rhine Graben and forms a conjugate fault system with the latter (Egli et al. 2017). The central part of the Hegau – Bodensee Graben experienced a few hundred metres of tectonic subsidence (Ibele 2015).
Field evidence indicates that the Freiburg – Bonndorf – Bodensee Fault Zone evolved within the framework of strike-slip tectonics at least since the Middle Miocene along inherited structures (Egli et al. 2017). Deformation also resulted in the development of predominantly NE-SW-trending normal faults, which are kinematically compatible with the overall dextral character. The graben structures are considered as a local kinematic response to crustal scale strike-slip tectonics induced by the far field Alpine compression, with extension occurring on suitably oriented pre-existing structures (Egli et al. 2017).
The main tectonic activity in the Hegau – Bodensee Graben occurred during Late Miocene to Pliocene times (Schreiner 1992). Early stages were accompanied by volcanic activity (Schreiner 1992, Wittmann 1937). Volcanic activity in the Hegau region has been dated to Middle to Late Miocene (Schreiner 1992). Tectonic activity in the graben has increased syn- and post-rift sedimentation of the Upper Marine Molasse (Ibele 2015). The NE-dipping Randen Fault, located ~ 10 km NE of Zürich Nordost, has experienced a total of 170 m normal offset since the Middle Miocene (Schreiner 1992).
Upper Rhine Graben
The Upper Rhine Graben is part of the European Cenozoic Rift System (ECRIS), which extends from the Bohemian Massif to the Mediterranean Sea (e.g. Dèzes et al. 2004, Bourgeois et al. 2007). The formation of the southern Upper Rhine Graben started in the Late Eocene (Rotstein & Schaming 2011, Dèzes et al. 2004). The main rifting phase ended in Rupelian times, although localised extension continued during the Miocene and until the present day (Giamboni et al. 2004, Rotstein & Schaming 2011).
The Upper Rhine Graben is partly controlled by inherited structures stemming from the Variscan orogeny and the subsequent Permo-Carboniferous extensional tectonics (that also formed the Konstanz – Frick Trough; Giamboni et al. 2004, Rotstein & Schaming 2011). According to Rotstein & Schaming (2011), the tectonic evolution of the Upper Rhine Graben can be subdivided into two phases, including an early rifting stage and a later transtensional – transpressional stage. The rifting phase was controlled by a normal faulting stress regime with an E-W-trending, horizontal minimum principal stress axis (SHmin), whereas the strike-slip-dominated later stage was characterised by a NNW-SSE-trending, horizontal maximum principal stress axis (SHmax). Uplift of the graben shoulders (i.e. Black Forest and Vosges Massifs) accompanied rifting. This uplift resulted in a general southward dip of Mesozoic strata in Northern Switzerland, which is preserved in the less deformed blocks of the region (e.g. Müller et al. 2002).
Summary
In summary, the tectonic evolution of the siting regions is conceptualised as the interplay among the tectonic processes responsible for the development of the major tectonic domains described above. The Variscan orogeny and the formation of the Konstanz – Frick Trough resulted in NW‑SE, NNE-SSW, and ENE-WSW-trending structures, which are zones of weakness in the basement. The formation of the Upper Rhine Graben resulted in uplift of the Black Forest Massif, which in turn produced tilting of the Mesozoic strata and normal faulting. Further tilting and extensional overprint were induced by the northward migration of the Alpine forebulge. The development of the Hegau – Bodensee Graben influenced mainly ZNO, which was affected by oblique extension within the framework of transtensional deformation. On the other hand, the development of the Jura Fold-and-Thrust belt produced shortening of the Mesozoic strata, with a decreasing intensity from west to east (Fig. 4‑60).
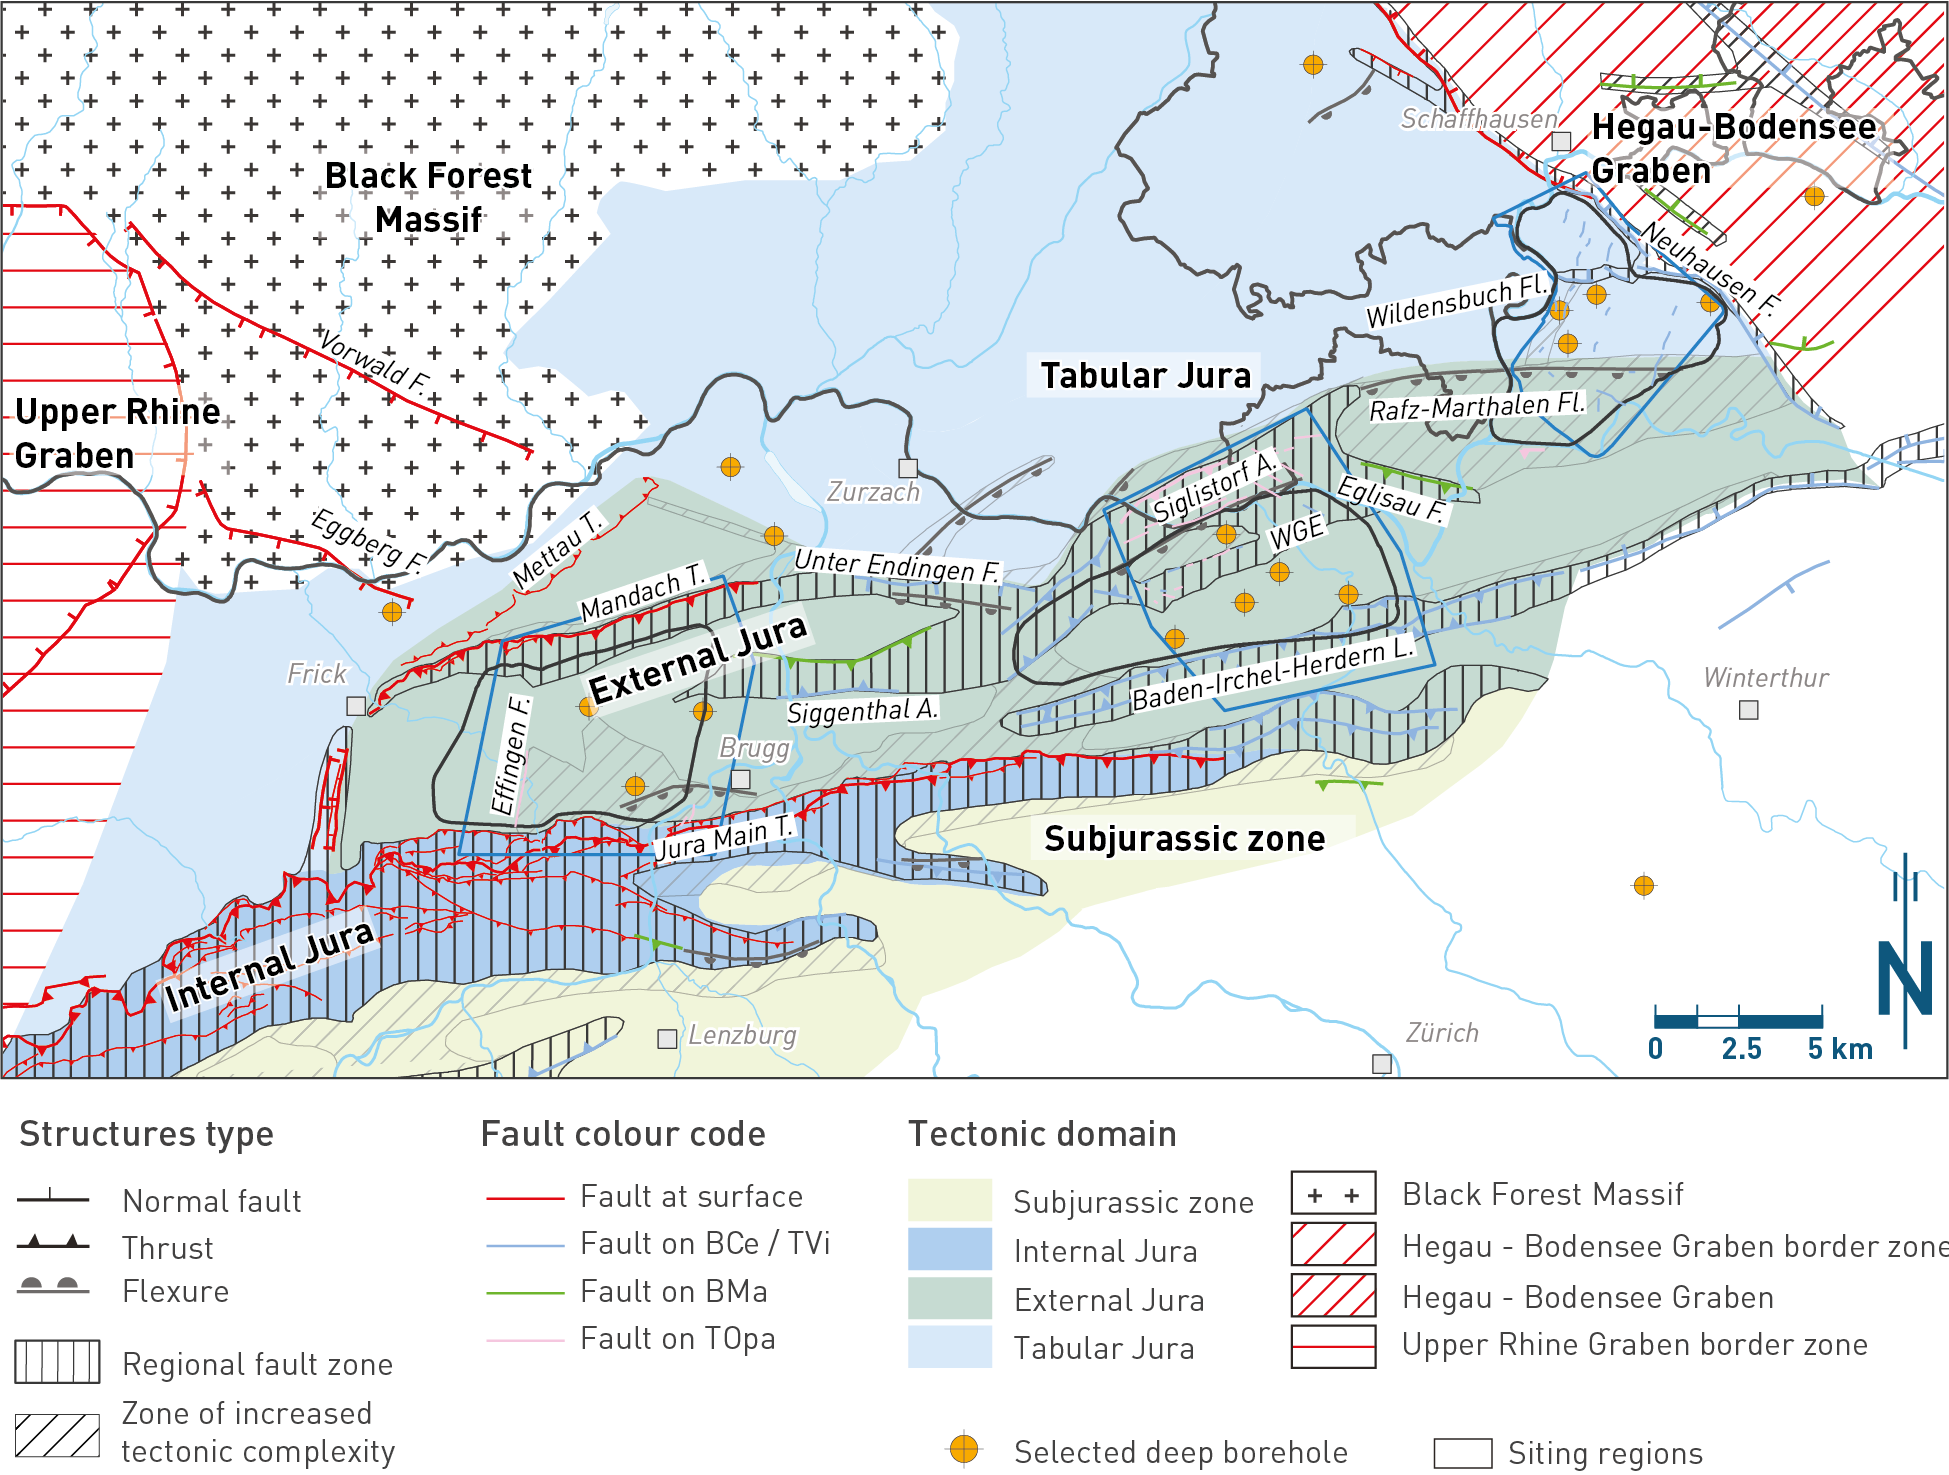
Fig. 4‑60:Tectonic map of Northern Switzerland showing regional fault zones and regional tectonic domains
This report uses historic names of tectonic structures to ensure continuity with the existing literature. Surface fault traces are based on Nagra (2014b). Fault traces from seismic interpretation are based on 2D seismic reflection (Madritsch et al. 2013, Meier et al. 2014) and 3D seismic reflection interpretation (Nagra 2024a, 2024b, 2024c). They are shown on the highest stratigraphic horizon where the specific fault segment was picked (different colours in the map view). Only horizons from Top Opalinus Clay and higher stratigraphic levels are shown. Note that only a selection of the structures from 3D seismic interpretation is shown to highlight the structural trends of regional importance. See Fig. 4‑61, Fig. 4‑65 and Fig. 4‑69 for the complete fault pattern. A.: Anticline, F.: Fault, Fl.: Flexure, L.: Lineament, T.: Thrust. WGE: Weiach – Glattfelden – Eglisau Lineament.
As shown in the previous section, the siting regions are located away from major deformation zones and are bounded by regional fault zones (Section 4.3.3, Fig. 4‑54). The central part of all the siting regions is characterised by gently SSE-dipping to flat-lying Mesozoic strata (Fig. 4‑56, Fig. 4‑57, Fig. 4‑58, and Fig. 4‑59). The central areas are typically several square kilometres in size.
In the following section, the inventory of structures encountered in the siting regions is described from west (JO) to east (ZNO). The focus is on the interpretation of the seismic reflection data and the data from retrieved core material.
Jura Ost
Within Jura Ost, the Jura Main Thrust and the Mandach Thrust delimit the southern and the northern border of the siting region, respectively (Fig. 4‑54, Fig. 4‑56, Fig. 4‑61). In between, the Mesozoic units form a less deformed block of gently SSE dipping strata (Diebold et al. 2006). Fault trace maps based on the interpretation of 3D seismic reflection data (Fig. 4‑61) show a limited number of discrete, seismically mappable faults in the less deformed block. Furthermore, they show a higher number of fault segments at the Near Top Muschelkalk Group horizon compared to the Near Top Lias Group and Top Opalinus Clay horizons (Fig. 4‑61). Similarly, fracture frequency measured in the BOZ1 and BOZ2 boreholes shows higher values in the mechanically competent units (e.g. Muschelkalk Group) and lower ones in the less competent units (clay-mineral-rich units, e.g. Opalinus Clay). Small-scale faults (referred to as fault zones in Nagra (ed.) 2022a and 2022b, Dossier V) were encountered predominantly in the Triassic units (9 out of 16 in BOZ2 and 18 out of 30 in BOZ1, Fig. 4‑61). The observation of a higher number of low-angle small-scale faults in the Triassic evaporites supports the concept of a décollement horizon within the Triassic evaporites allowing strain from the Alpine orogeny to be transferred NNW-wards.
Of the micro faults observed in the two boreholes 69% show reverse shear sense indicators. Normal faulting was described for 27% of the micro faults, whereas strike-slip dominated movement was found in 4% of the cases (Fig. 4‑61). The predominance of thrust-related structures encountered in the boreholes is associated with the shortening related to the formation of the Jura Fold-and-Thrust Belt overprinting the precursor geological history.
The Jura Main Thrust, which is exposed in the southernmost portion of JO, represents the northern boundary of the Internal Jura (Fig. 4‑60). As it is located close to the margin of the 3D seismic perimeter, the fault geometry is not well imaged within the 3D seismic volume; therefore, its interpretation is based on regional 2D seismic reflection lines and surface mapping (Fig. 4‑61). The Jura Main Thrust consists of an imbricate fan soling out in the Triassic evaporites (Fig. 4‑56). It accommodated 2 to 5 km of shortening during Jura-related folding and thrusting, as estimated from balanced geological sections. These also show that the shortening decreases towards the east (Jordan et al. 2015). The Jura Main Thrust is roughly located over the southern border fault of the western segment of the Konstanz – Frick Trough (Diebold et al. 1991, Madritsch et al. 2018). East of JO, the Lägern Anticline, located south of NL, represents the eastern continuation of the Jura Main Thrust (Fig. 4‑60).
The Mandach Thrust is known from surface mapping (Diebold et al. 2006, Bitterli-Dreher et al. 2007). It is located approximately 6 km north of the Jura Main Thrust and strikes roughly E-W. It can be traced at the surface for ~ 15 km (Diebold et al. 2006, Bitterli-Dreher et al. 2007). In the fault trace maps obtained from seismic reflection data, fault traces associated with the Mandach Thrust can be mapped up to the Near Top Lias Group but not above, mainly due to near-surface effects altering the seismic reflection image (Fig. 4‑61; Nagra 2024a). The Mandach Thrust is interpreted as a thrust ramp splaying out from the Muschelkalk Group evaporite décollement (e.g. Laubscher 1985, Nagra 2019b). Consequently, the strata above the décollement and south of the Mandach Thrust are considered as detached (i.e. part of the External Jura). About 500 m of shortening was accommodated by the Mandach and the Mettau Thrusts located further to the north during folding and thrusting of the Jura (Fig. 4‑60; Malz et al. 2020). The Mandach Thrust is located along the northern edge of the Paleozoic graben. The northern boundary fault of the Konstanz – Frick Trough within JO also offsets the Base Mesozoic unconformity, as a result of Paleogene extensional reactivation (Laubscher 1986). The step below the décollement level (i.e. Muschelkalk evaporites) appears to have localised later deformation, in particular by controlling thrust ramp development at this site (Fig. 4‑62).
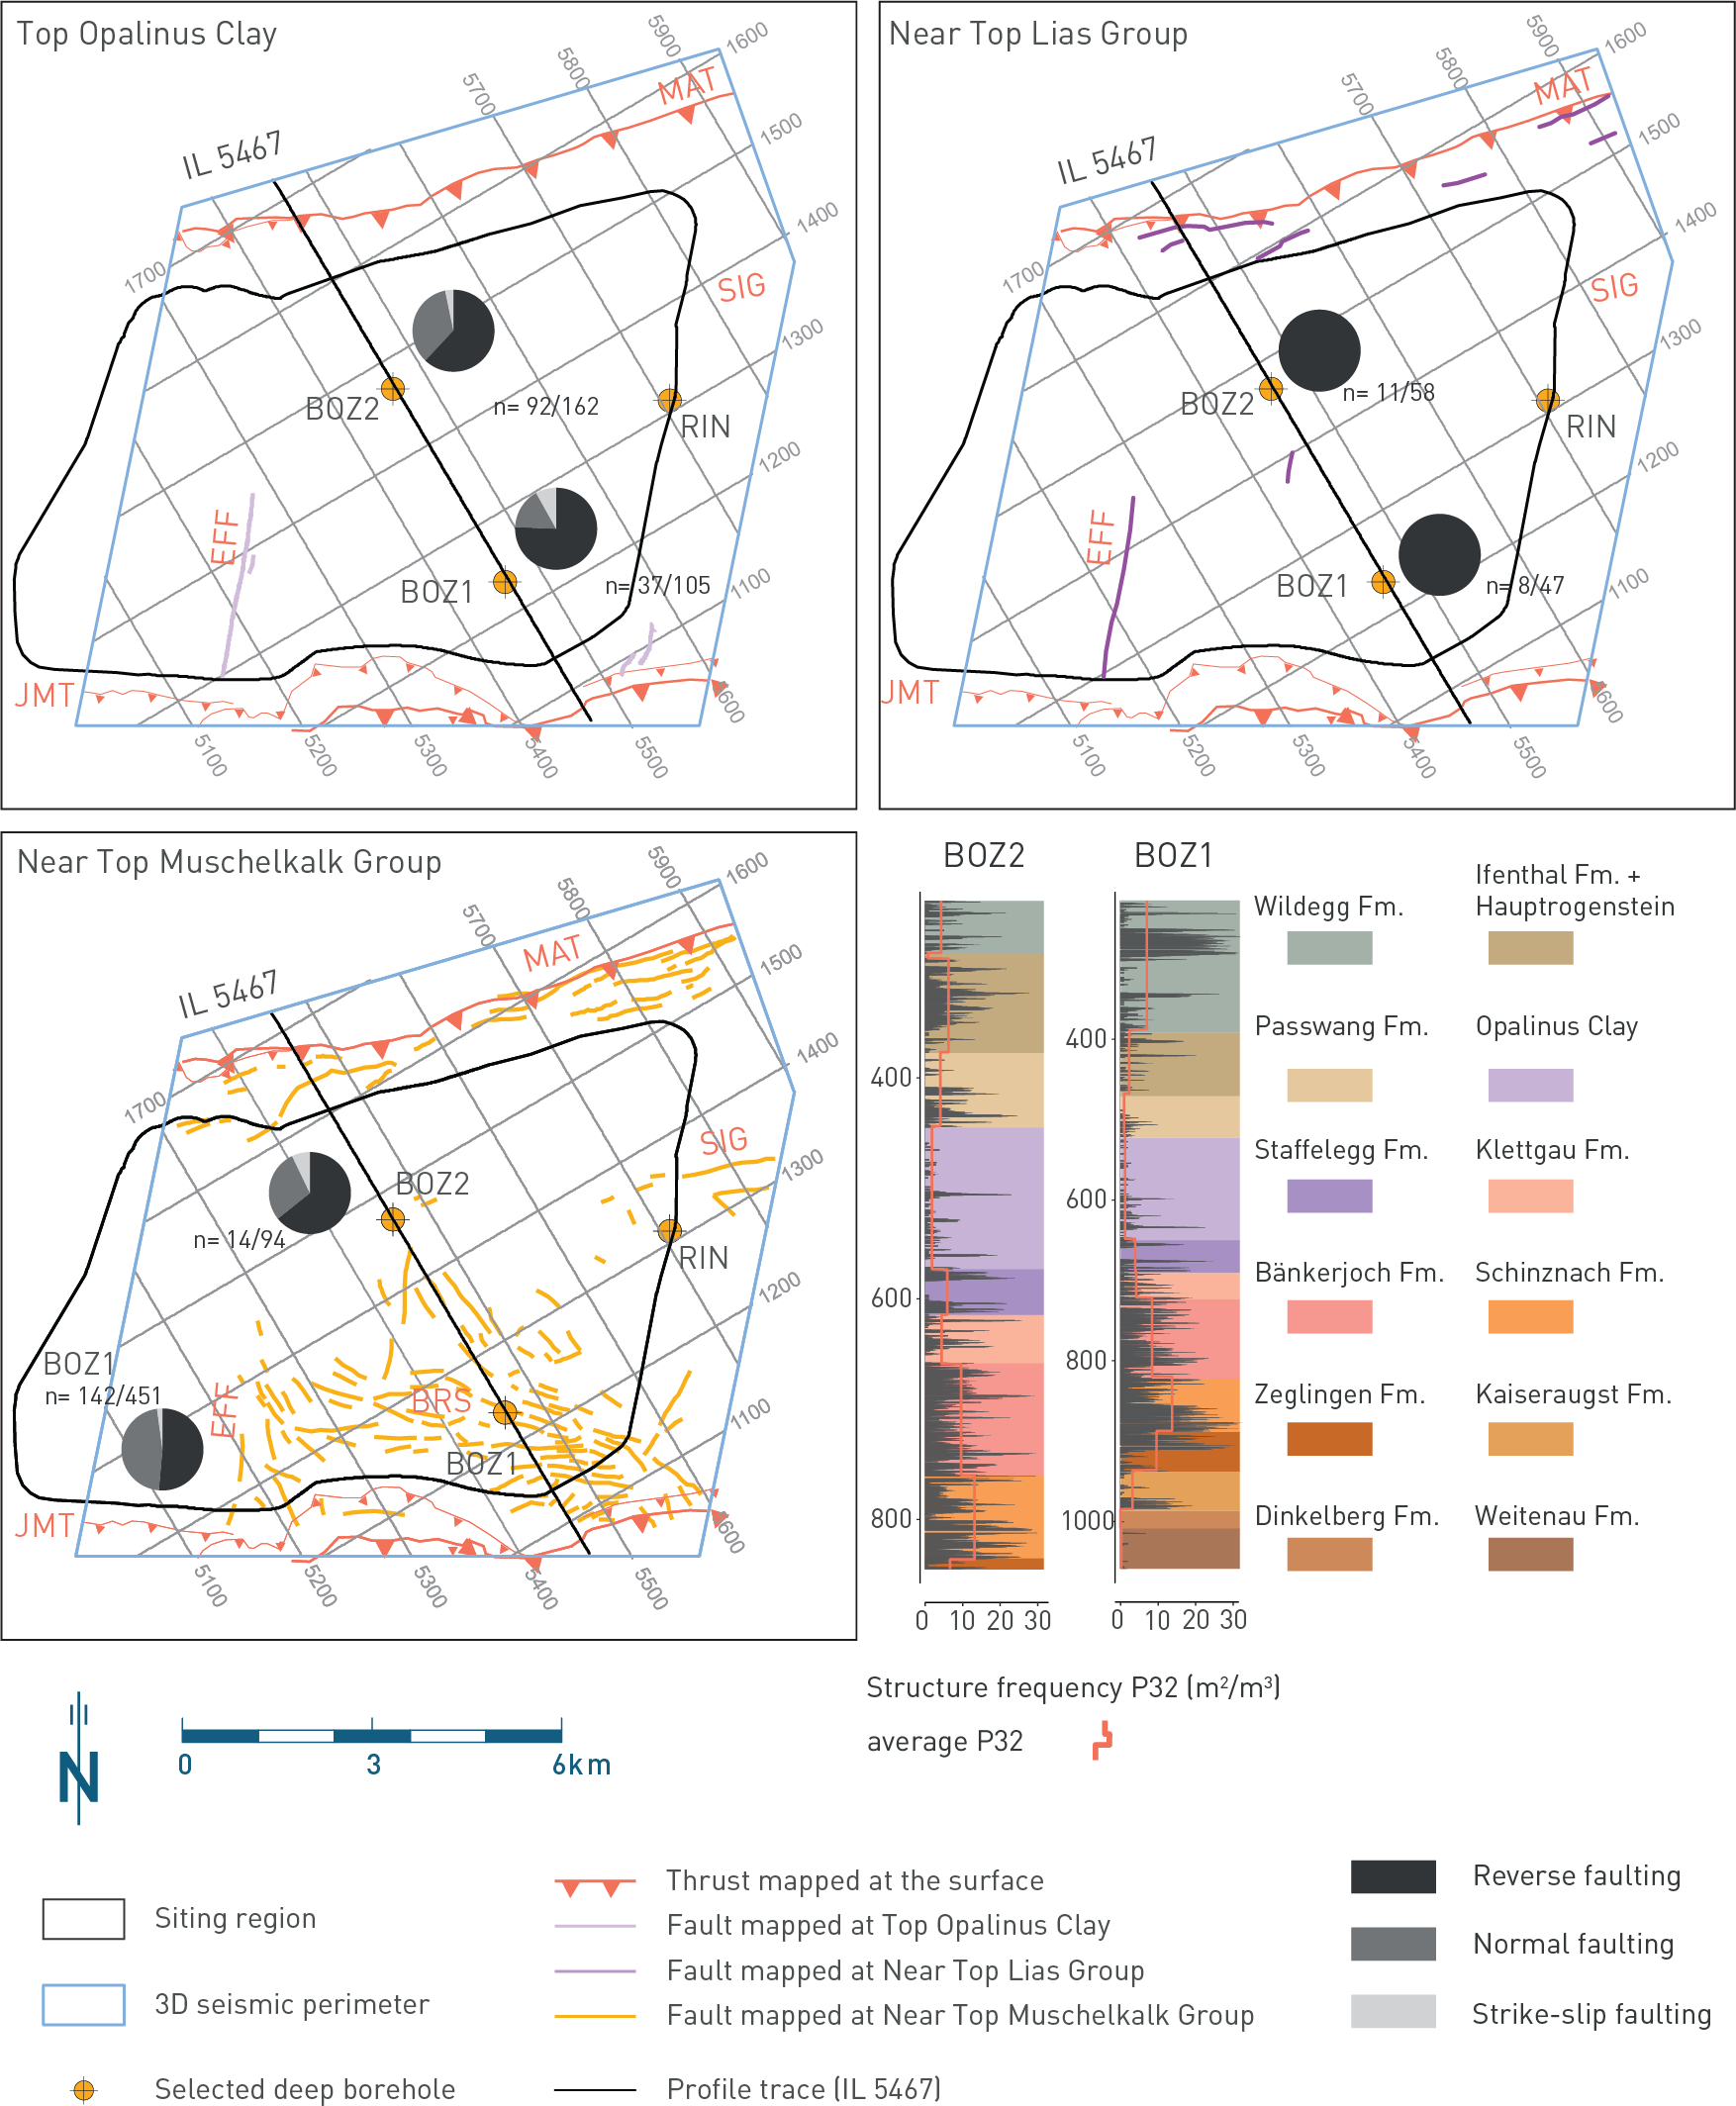
Fig. 4‑61:Fault map for JO (shown on three stratigraphic levels) and fracture frequencies in the recent deep boreholes
Fault maps based on seismic reflection interpretation reported in Nagra (2024a). Pie charts show the distribution of shear sense indicators within the Opalinus Clay, the Lias Group and the Muschelkalk Group, respectively. The numbers after 'n=' represent the total number of micro faults with shear sense indication ratio to total number of micro faults. Reverse faulting encompasses all dip-slip upward movements. P32 values refer to the fracture area in a unit volume, i.e. the intersection area of the plane with the cylindrical core and, as such, represents a non-directional intrinsic measure of the degree of rock mass fracturing, incorporating both a frequency measure and a fracture-size component (Ebert & Decker 2019, Dershowitz 1985, Dershowitz & Herda 1992). MAT: Mandach Thrust; SIG: Siggenthal Anticline, EFF: Effingen Fault: JMT: Jura Main Thrust, BRS: "Brugg Strukturzone".
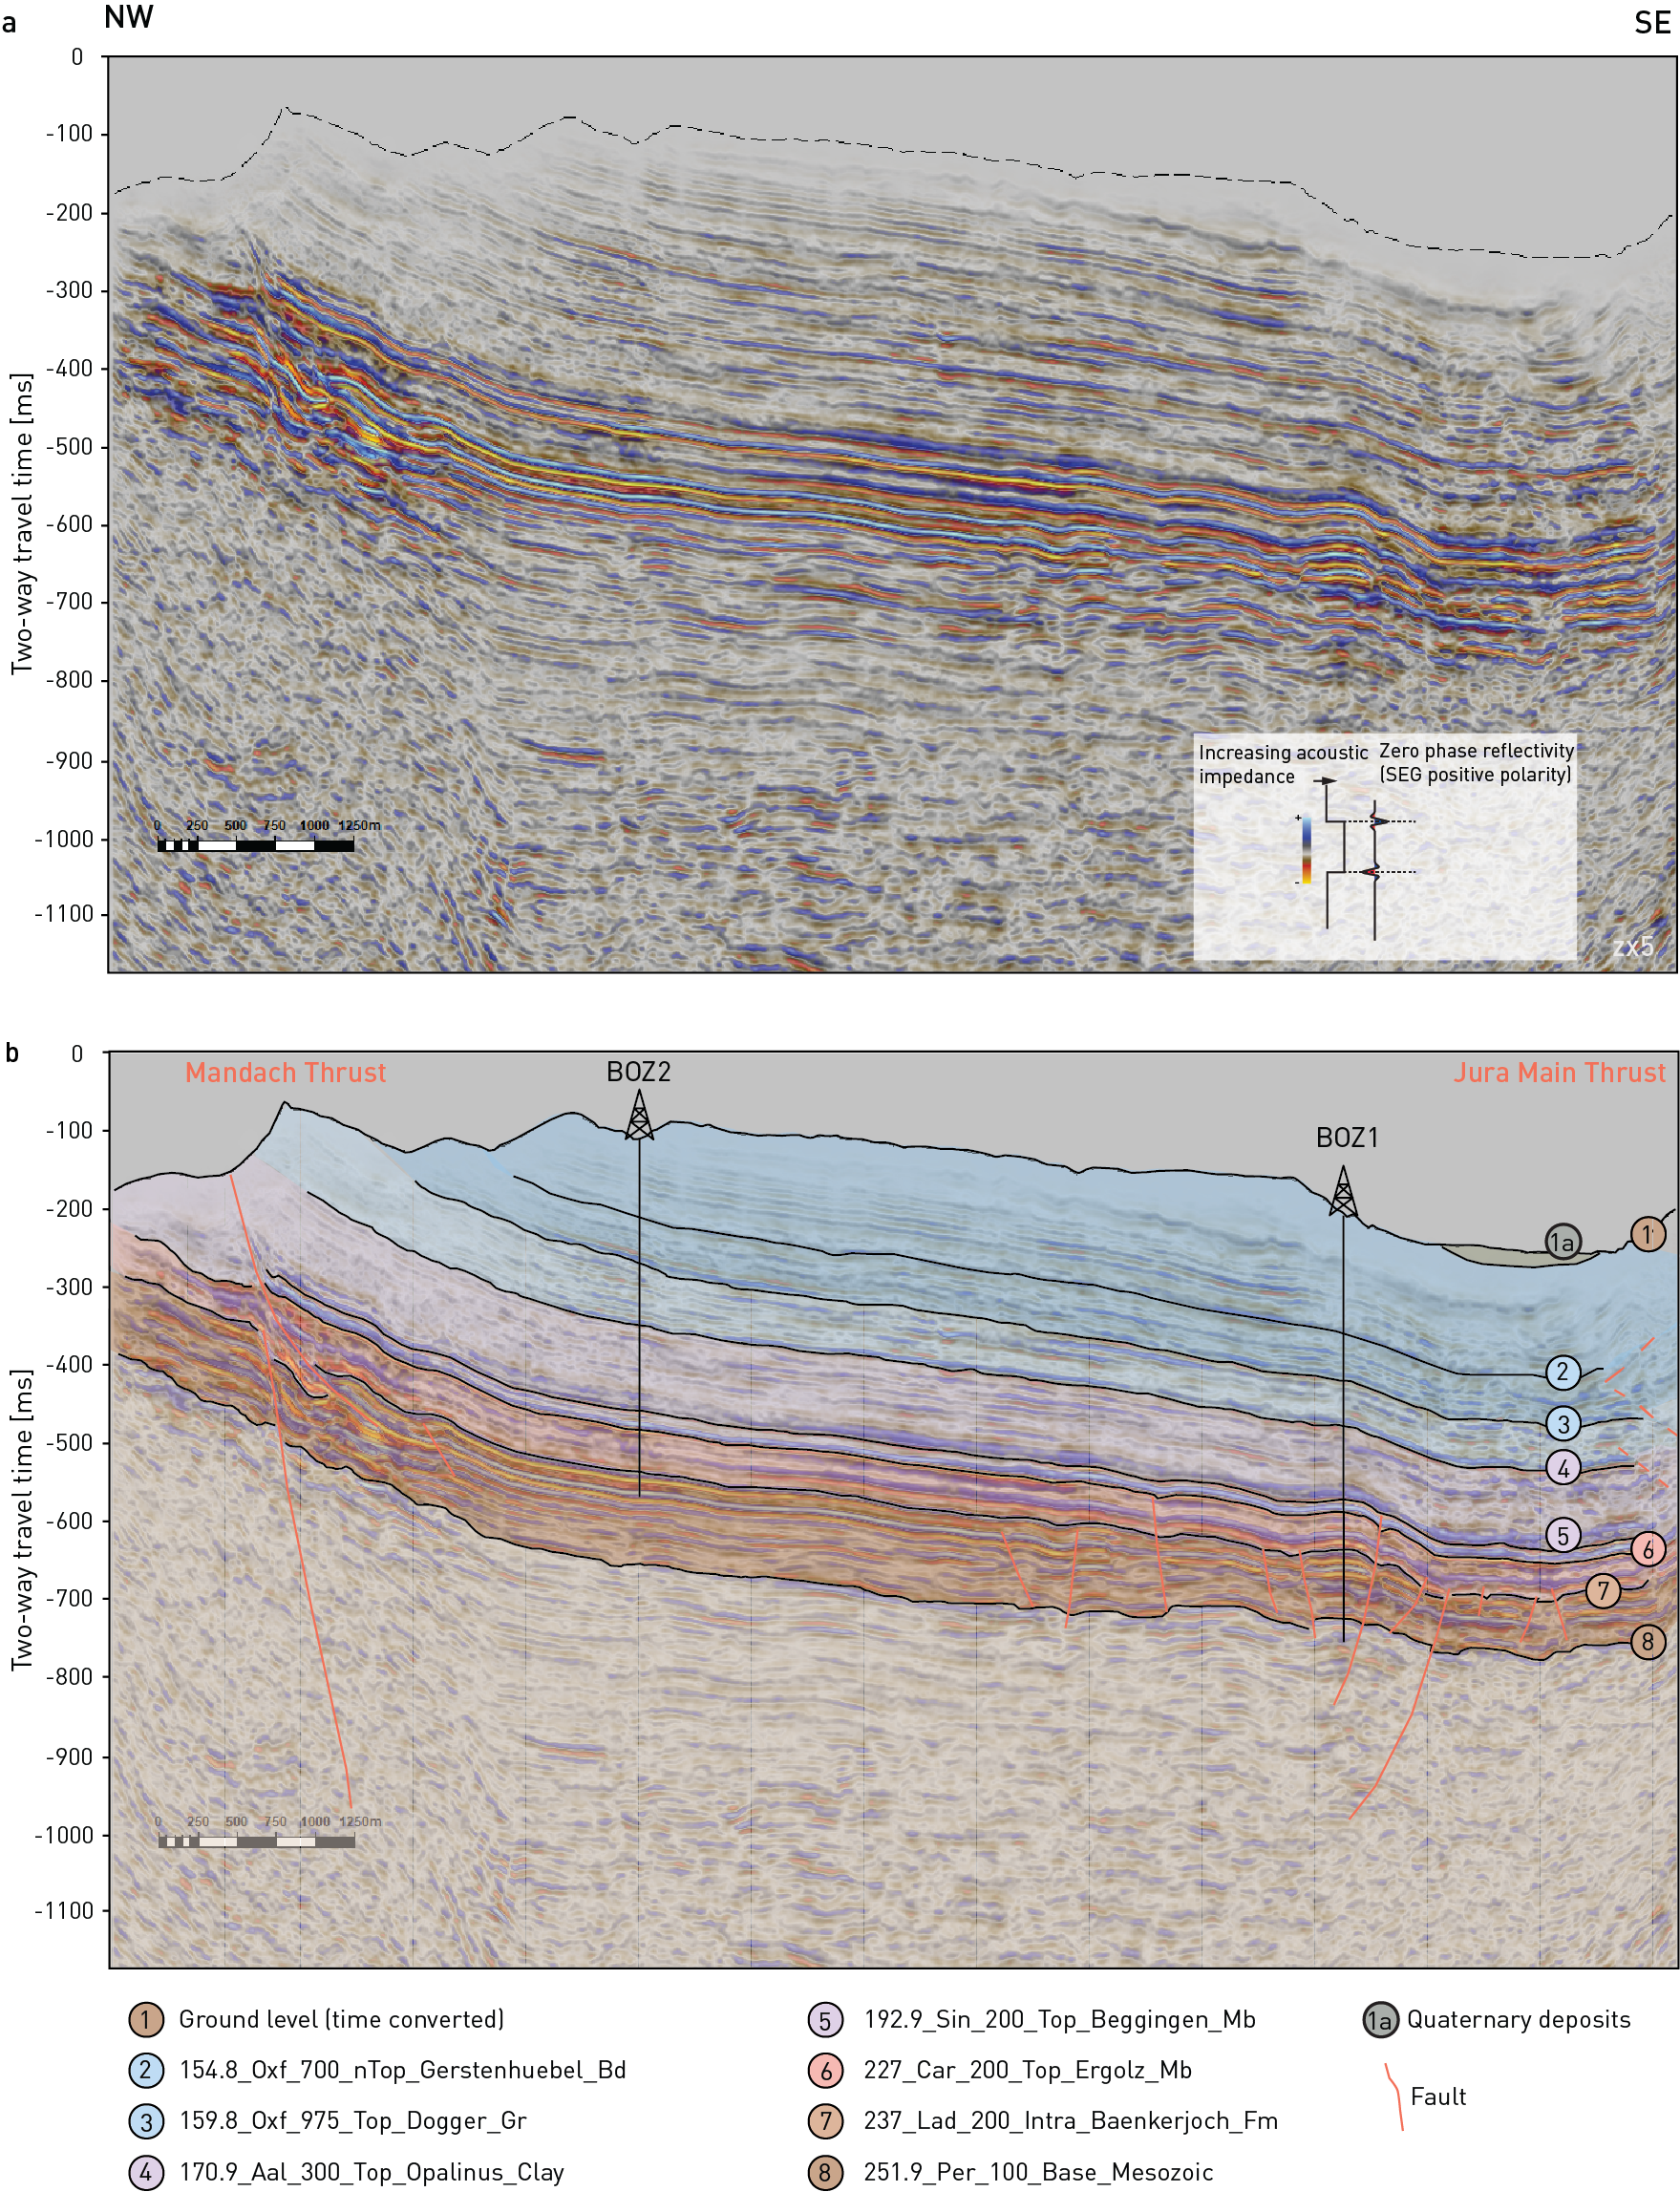
Fig. 4‑62:NW-SE cross-section in time domain extracted from 3D seismic reflection data through Jura Ost
View is along acquisition inline 5467, modified after Nagra (2024a). (a) Uninterpreted. (b) Interpreted. Note that the recognition of fault signatures within the Opalinus Clay is strongly hampered by the presence of multiples. The vertical axis was stretched 5 times (Z × 5). Seismic display is PreSTM-ref reflectivity with an overlay of relative acoustic impedance. Profile trace shown in Fig. 4‑61. Bd: Bed; Gr: Group; Mb: Member; Fm: Formation.
In the easternmost sector of JO, the western termination of the Siggenthal Anticline occurs between the Jura Main Thrust and the Mandach Thrust (Fig. 4‑61; Bitterli-Dreher et al. 2007). This structure continues – and is well exposed – east of the 3D seismic perimeter. It is a north-vergent anticline associated with a thrust ramp rooting in the Triassic evaporites (Nagra 2019b, 2024a). No major Paleozoic structures occur beneath this structure, and nucleation does not appear therefore to be controlled by inherited structures underlying the décollement (Nagra 2024a, Madritsch et al. 2024). Seismic reflection interpretation in the NE corner of JO is hampered by data quality inhibiting a more detailed analysis (Nagra 2024a). Seismically mappable fault segments associated with the Siggenthal Anticline are mapped on Near Top Muschelkalk Group and concentrate at the corner of the siting region. However, a few fault segments showing a similar orientation are mapped at a close distance from the BOZ2 borehole (Fig. 4‑61). Micro faults in BOZ2 are predominantly ENE-WSW-trending, hence displaying a similar orientation (Nagra (ed.) 2022b).
Located in the SW sector of the block, the Effingen Fault represents a major structural element in JO. It is a normal fault known from seismic reflection data interpretation and reaching from the pre-Mesozoic basement into the Wildegg Formation (Fig. 4‑63; Nagra 2019b). It strikes NNE-SSW and dips towards the E.
A cluster of faults is observed on Near Top Muschelkalk Group in the central to south-eastern part of the 3D seismic survey and grouped under the term "Brugg Strukturzone" (Fig. 4‑61; Nagra 2024a). They display only a mild expression at the level of the Near Top Lias Group (Fig. 4‑61). They encompass thrust imbricates from the Jura Main Thrust in the south as well as a NW-SE-trending zone with a change from contractional features to extensional features indicative for a strike-slip-dominated deformation. Micro faults mapped in BOZ1 within the Muschelkalk Group show comparable orientations (NW-SE-trending and subordinate NE-SW-trending) to the faults detected in the 3D seismic reflection data (Fig. 4‑61; Nagra (ed.) 2022a).
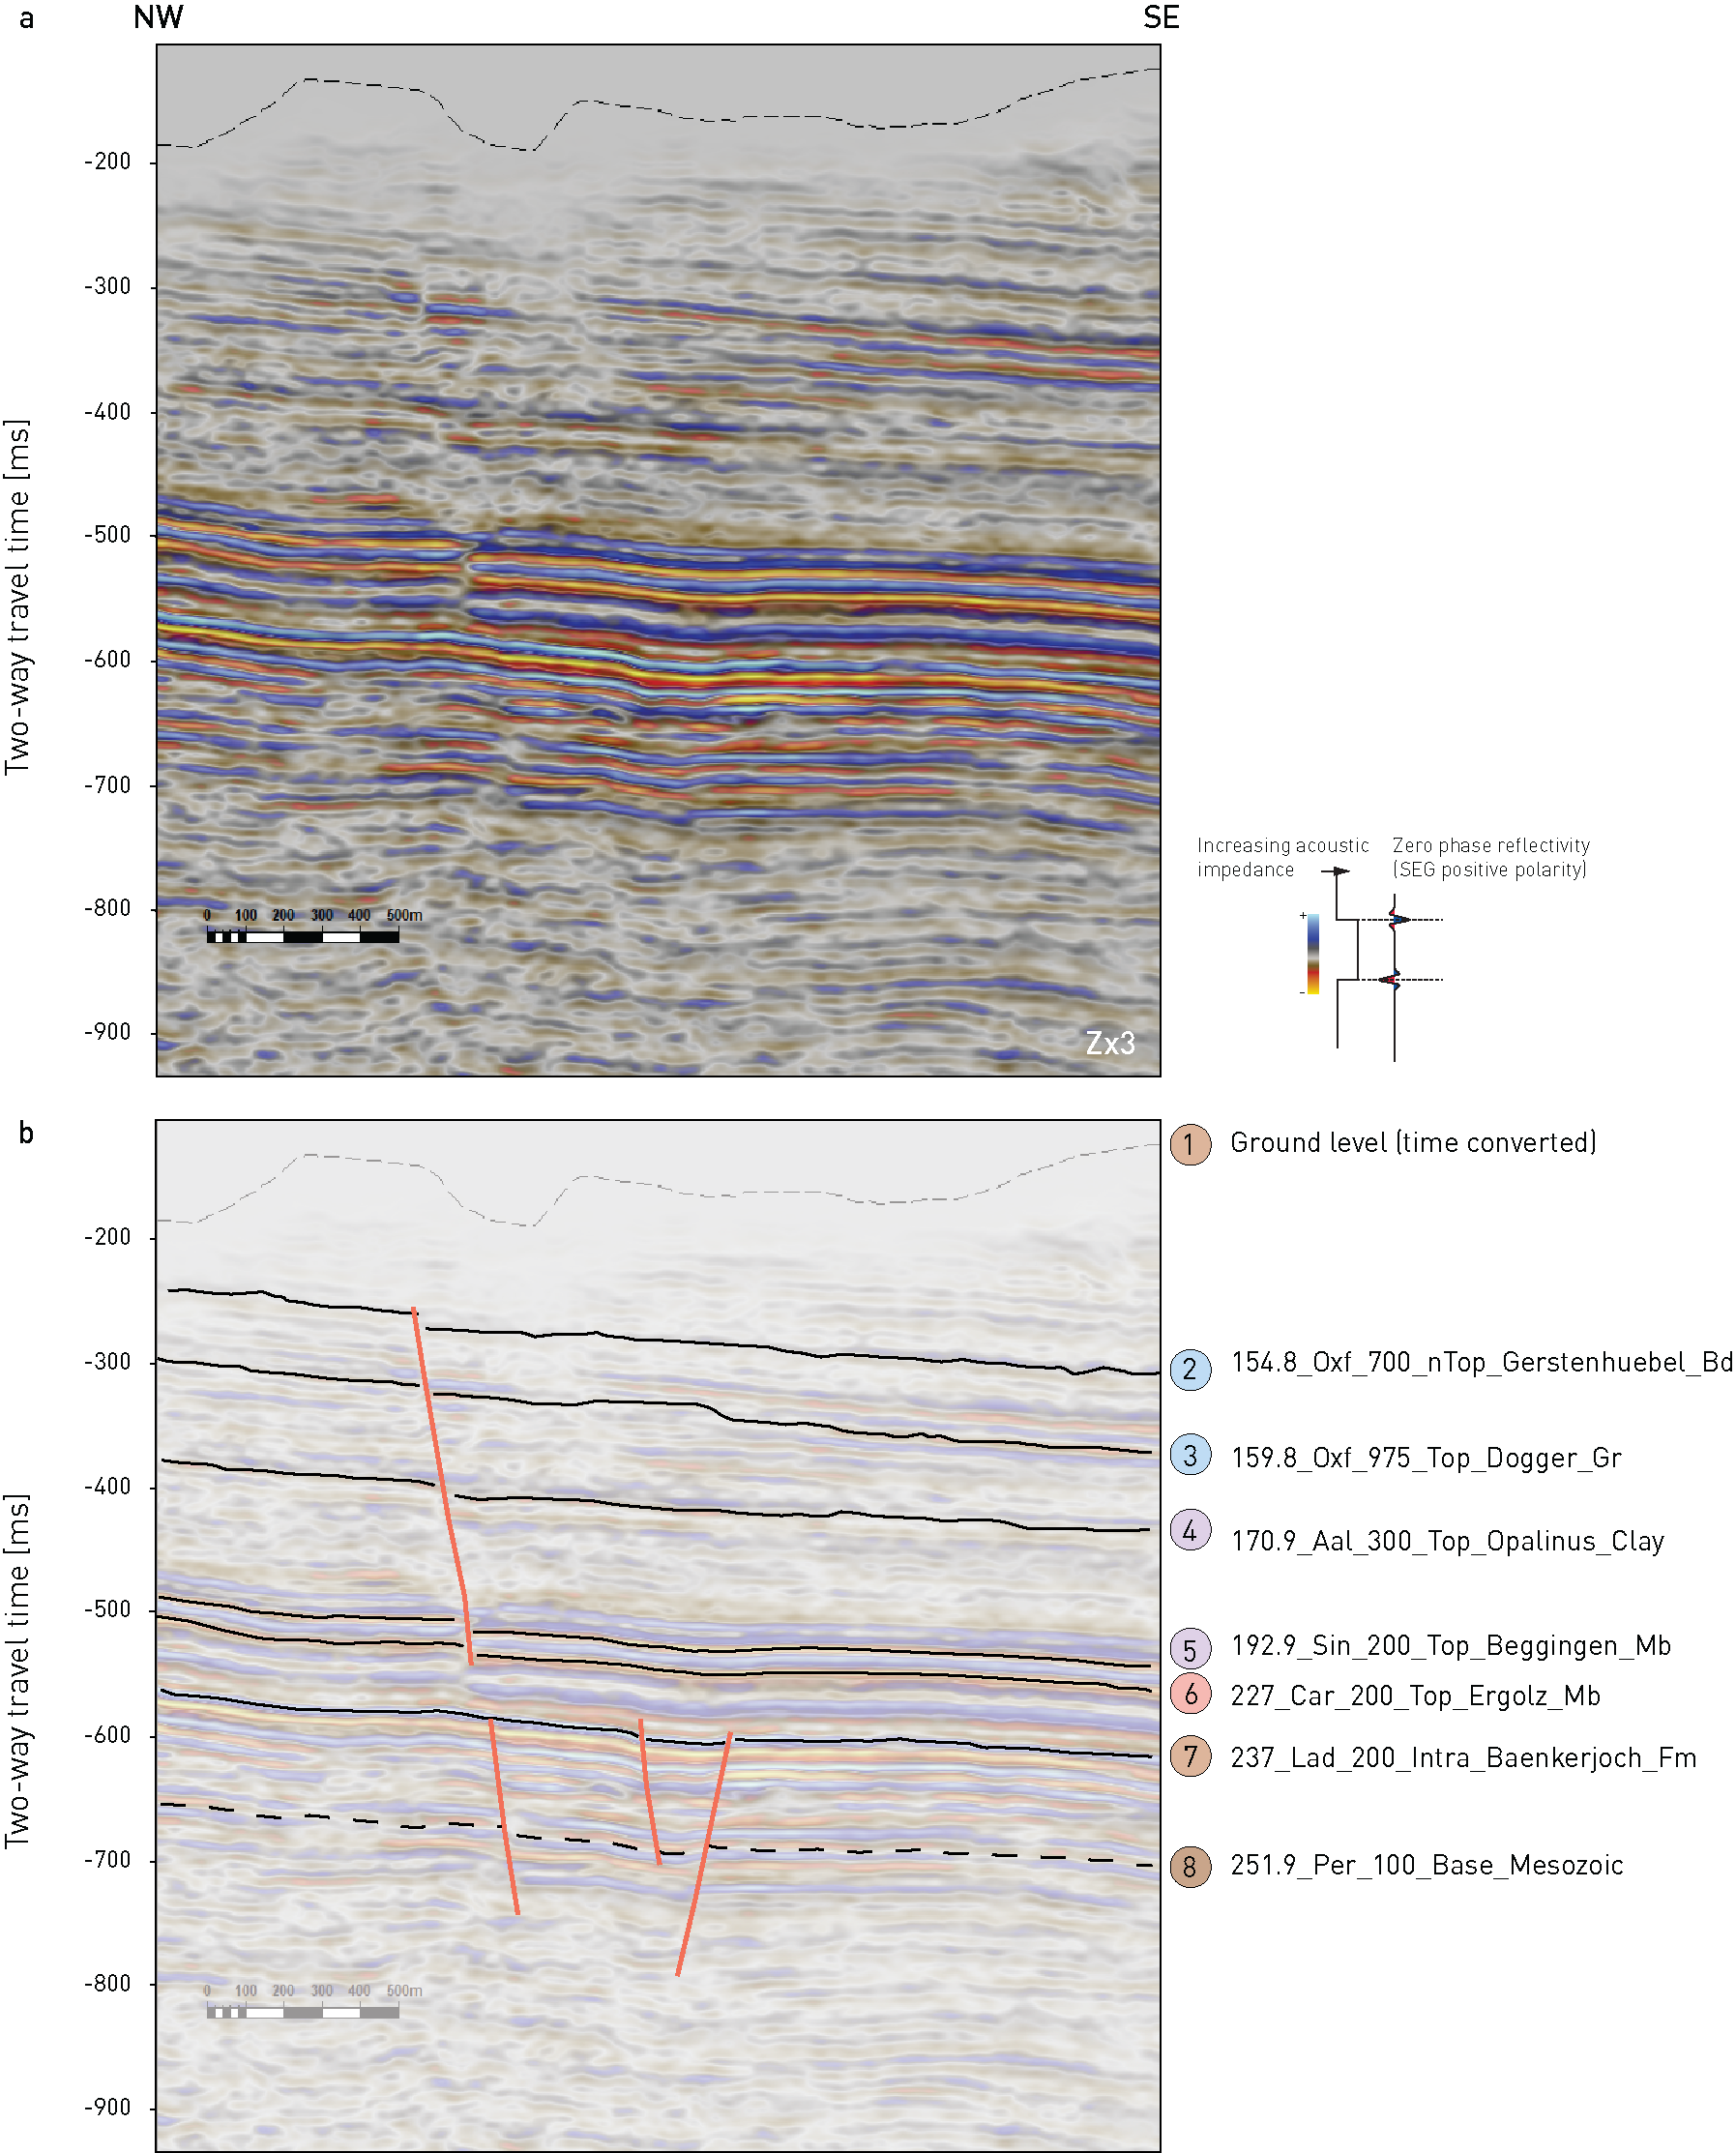
Fig. 4‑63:Cross-section extracted from 3D seismic reflection data showing the Effingen Fault
Modified after Nagra (2024a). (a) Uninterpreted. (b) Interpreted. Seismic display is PreSTM-ref reflectivity with an overlay of relative acoustic impedance. Note the slight normal fault offset along the Effingen Fault for instance at the Top Ergolz Member. The vertical axis was stretched 3 times (Z × 3). Bd: Bed; Gr: Group; Mb: Member; Fm: Formation.
Nördlich Lägern
Nördlich Lägern is characterised by a relatively large (compared to JO and ZNO) less deformed block located between the Baden – Irchel – Herdern Lineament to the south and the Weiach – Glattfelden – Eglisau Lineament to the north (Fig. 4‑64). Discrete seismically mappable faults are predominantly observed at the level of the Top Muschelkalk Group (Fig. 4‑65). Less numerous fault segments are seen in the seismic reflection dataset at Near Top Lias Group and Near Top Opalinus Clay levels. This agrees well with the observed differences in fracture frequencies in the boreholes (Fig. 4‑65). Similarly to JO, a strong influence of mechanical stratigraphy is shown by higher fracture frequencies in the competent units (e.g. Malm and Muschelkalk Groups) and lower fracture frequencies in the less competent units (clay-mineral-rich units, e.g. Opalinus Clay). Small-scale faults (referred to as fault zones in Nagra (ed.) 2023a, 2022c, 2022d, 2021a, Dossier V) were encountered predominantly in the Triassic units (9 out of 15 in BAC1, 17 out of 25 in STA2, 17 out of 31 in STA3 and 34 out of 50 in BUL1). As in JO, the observed higher number of small-scale mostly low-angle faults in the Triassic evaporites provides supporting evidence for strain localisation within the main Jura décollement level in this region.
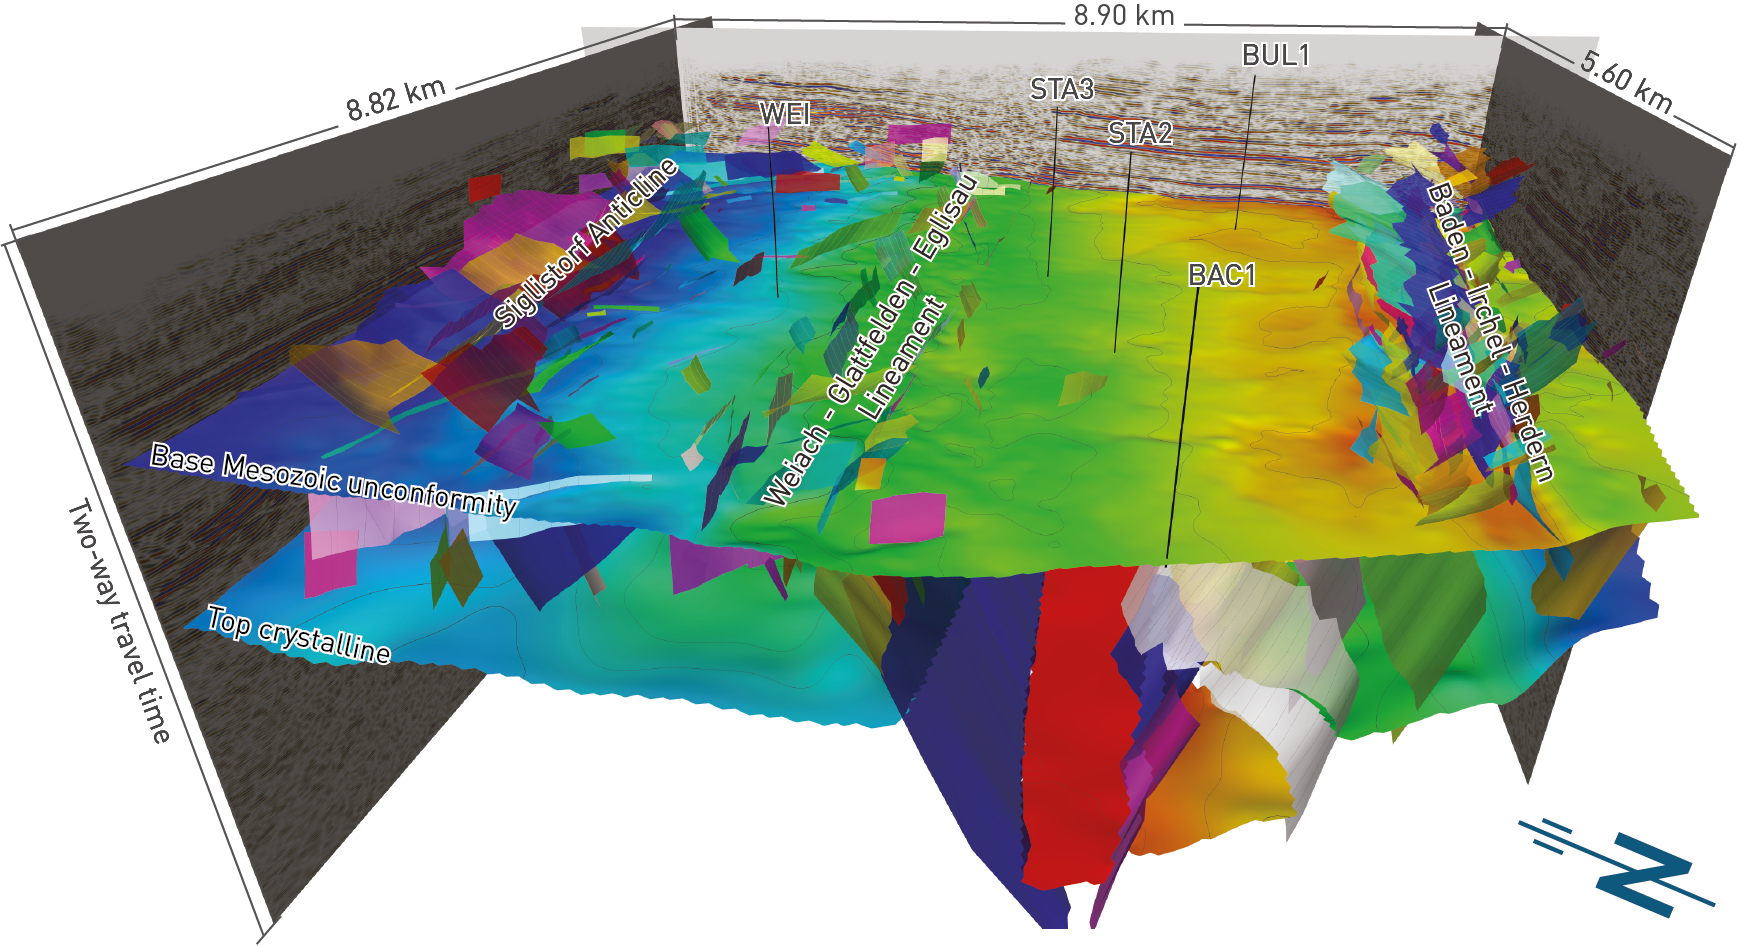
Fig. 4‑64:3D view showing the less deformed block in NL between the regional fault zones
Modified after Zambrano et al. submitted. Two horizons are shown for orientation. North is indicated by the blue arrow. Note that the z axis is in time.
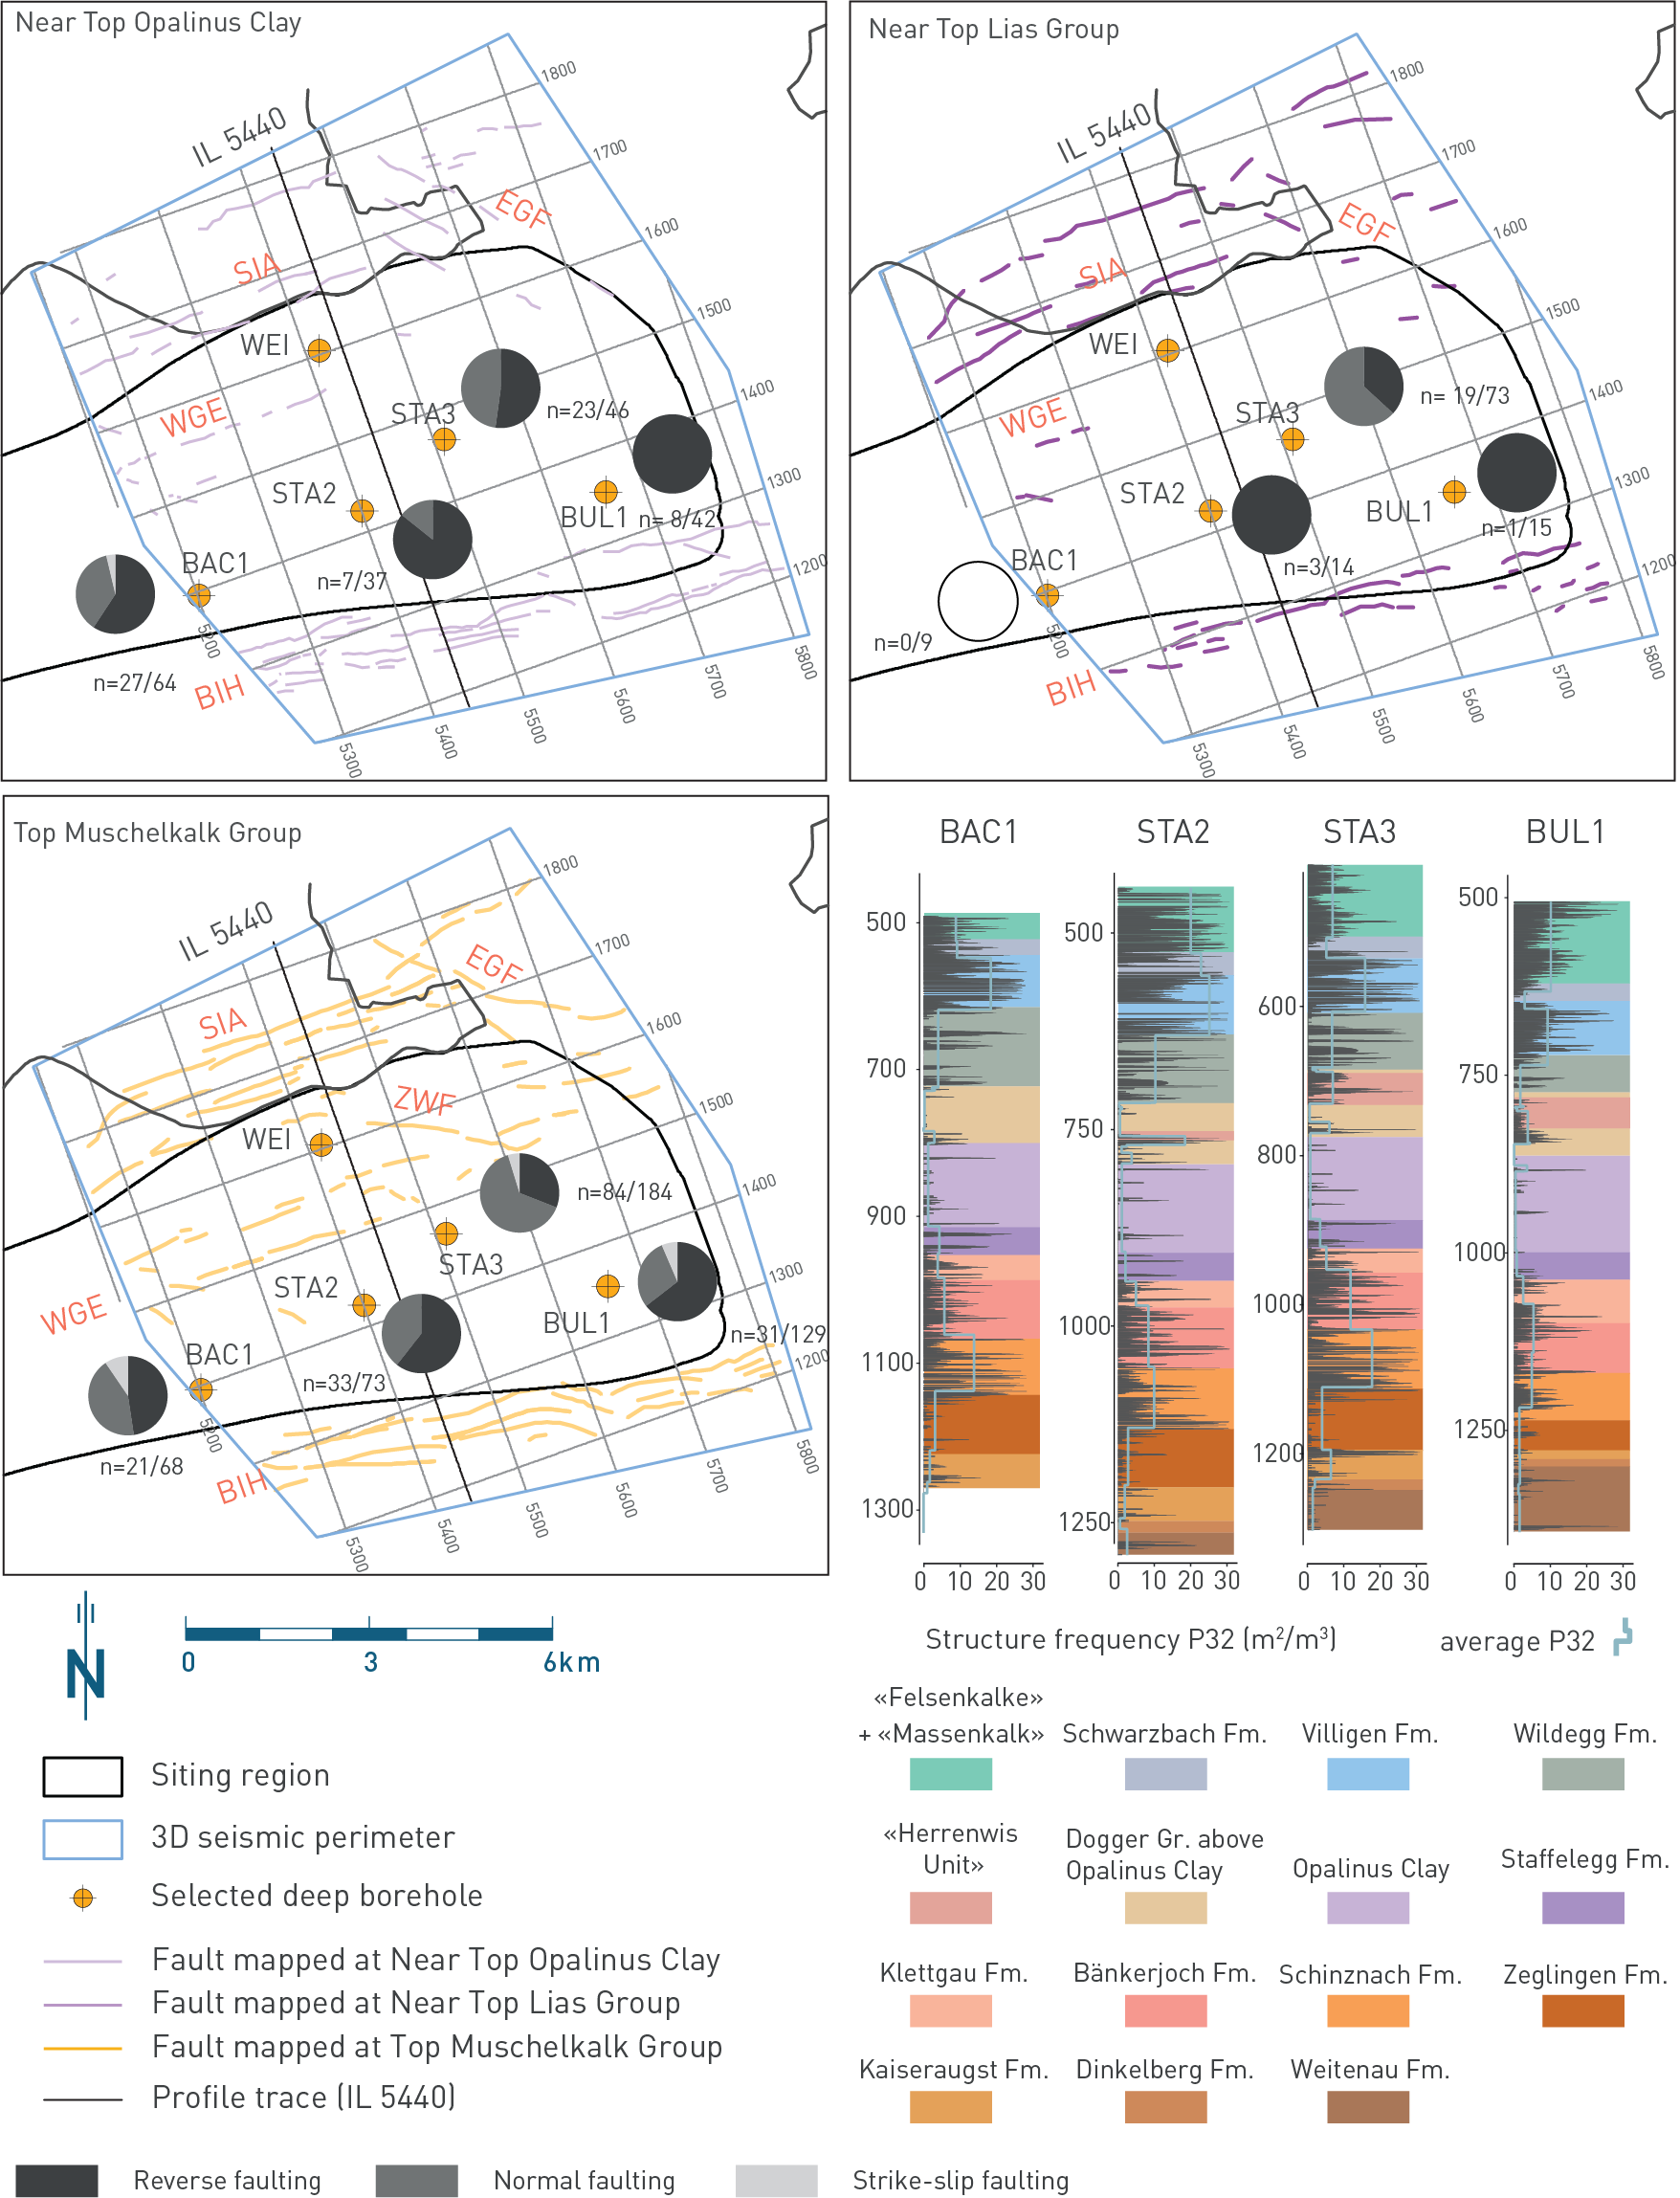
Fig. 4‑65:Fault maps for NL (shown on three stratigraphic levels) and fracture frequencies in the recent deep boreholes
Fault maps based on seismic reflection interpretation reported in Nagra (2024b). Pie charts show the distribution of shear sense indicators within the Opalinus Clay, Lias Group and Muschelkalk Group, respectively. The numbers after 'n=' represent the total number of micro faults with shear sense indication/total number of micro faults. Reverse faulting encompasses all dip-slip upward movements. P32 values refer to the fracture area in a unit volume, i.e. the intersection area of the plane with the cylindrical core and, as such, represents a non-directional intrinsic measure of the degree of rock mass fracturing, incorporating both a frequency measure and a fracture-size component (Ebert & Decker 2019, Dershowitz 1985, Dershowitz & Herda 1992). SIA: Siglistorf Anticline, EGF: Eglisau Fault, ZWF: Zweidlen Fault, WGE: Weiach – Glattfelden – Eglisau Lineament, BIH: Baden – Irchel – Herdern Lineament.
All recent boreholes were drilled within the less deformed block. Shear sense indicators on micro faults show a predominance of reverse faulting with approximately 71% reverse shear sense mapped. Normal faulting was described for 23% of the micro faults, whereas strike-slip faulting was found in 6% of the cases (Fig. 4‑65). Thrust-related features are consistent with shortening related to the formation of the Jura Fold-and-Thrust Belt. Multiple micro faults showing two different sets of striae/shear fibre lineation on a single slickenside were observed in the drill cores. This indicates two slip directions, both probably related to thrusting during the formation of the Jura Fold-and-Thrust Belt. NNE- and NNW- thrusting directions inferred from these micro faults are consistent with shortening directions reported from outcrops in Northern Switzerland (Madritsch 2015).
North of the Lägern Anticline, the Baden – Irchel – Herdern Lineament is located above faults of the underlying Konstanz – Frick Trough (Fig. 4‑66). It is composed of multiple thrusts and backthrusts arranged in a narrow, steep belt (Fig. 4‑67; Zambrano et al. submitted). Several authors have interpreted it as a composite triangle zone including a series of fish-tail structures (Laubscher 1985, Malz et al. 2016, Nagra 2024b). Within this structure, the Opalinus Clay allowed significant decoupling of the deformation between a lower competent layer (thick-bedded to massive limestones and dolostones of the Upper Muschelkalk Group) and an upper competent unit (thick-bedded to massive limestones of the Malm Group). The Opalinus Clay appears to have been shortened and locally thickened by roughly coaxial strain between the two disharmonically folded, competent rock panels located above and below it. The upper competent panel is antiformally folded, while the lower competent panel is synformally folded, resulting in a tectonically thickened Opalinus Clay in the core of both folds (Nagra 2024b). It should be noted that, although within the Baden – Irchel – Herdern Lineament the Opalinus Clay acted as a decoupling unit, no evidence was found within the siting regions along the boreholes for a décollement in the Opalinus Clay. This shows that, within the less deformed block, the Opalinus Clay did not act as décollement level.
The link of the Baden – Irchel – Herdern Lineament to the substratum (i.e. strata below the décollement in the Triassic evaporites) has been conceptualised differently over time. Malz et al. (2016) proposed an evolution of the Baden – Irchel – Herdern Lineament influenced by pre-thrusting normal faulting affecting the Base Mesozoic unconformity and overlying Mesozoic succession. These authors interpreted no faults cutting from the Paleozoic units into the Mesozoic strata. Recent structural interpretation of the 3D seismic reflection data indicated the occurrence of reverse faults offsetting both the upper part of the Paleozoic succession and Mesozoic strata, therefore cutting across the Base Mesozoic unconformity (Nagra 2024b). Consequently, the formation of the Baden – Irchel – Herdern Lineament is proposed to have occurred by post-detachment shortening involving both the Mesozoic succession and the underlying Upper Paleozoic sedimentary fill of the Konstanz – Frick Trough. This would be associated with late-stage bulk shortening triggering mild basin inversion of the Konstanz – Frick Trough (Zambrano et al. submitted).
The structural style of the Baden – Irchel – Herdern Lineament varies along strike. The contractional structure characterising the Baden – Irchel – Herdern Lineament south of NL, clearly related to Jura shortening, deamplifies progressively and fades away eastwards. South of ZNO, the composite triangle zone is no longer present, and a pronounced normal fault occurs instead in the Mesozoic succession (hard- linked with the underlying Late Paleozoic fault). This normal fault was extensionally reactivated, propagating into and offsetting the overlying Mesozoic units (Fig. 4‑60). The extensional reactivation was probably associated with the northward migration of the flexural forebulge (Chapter 3).
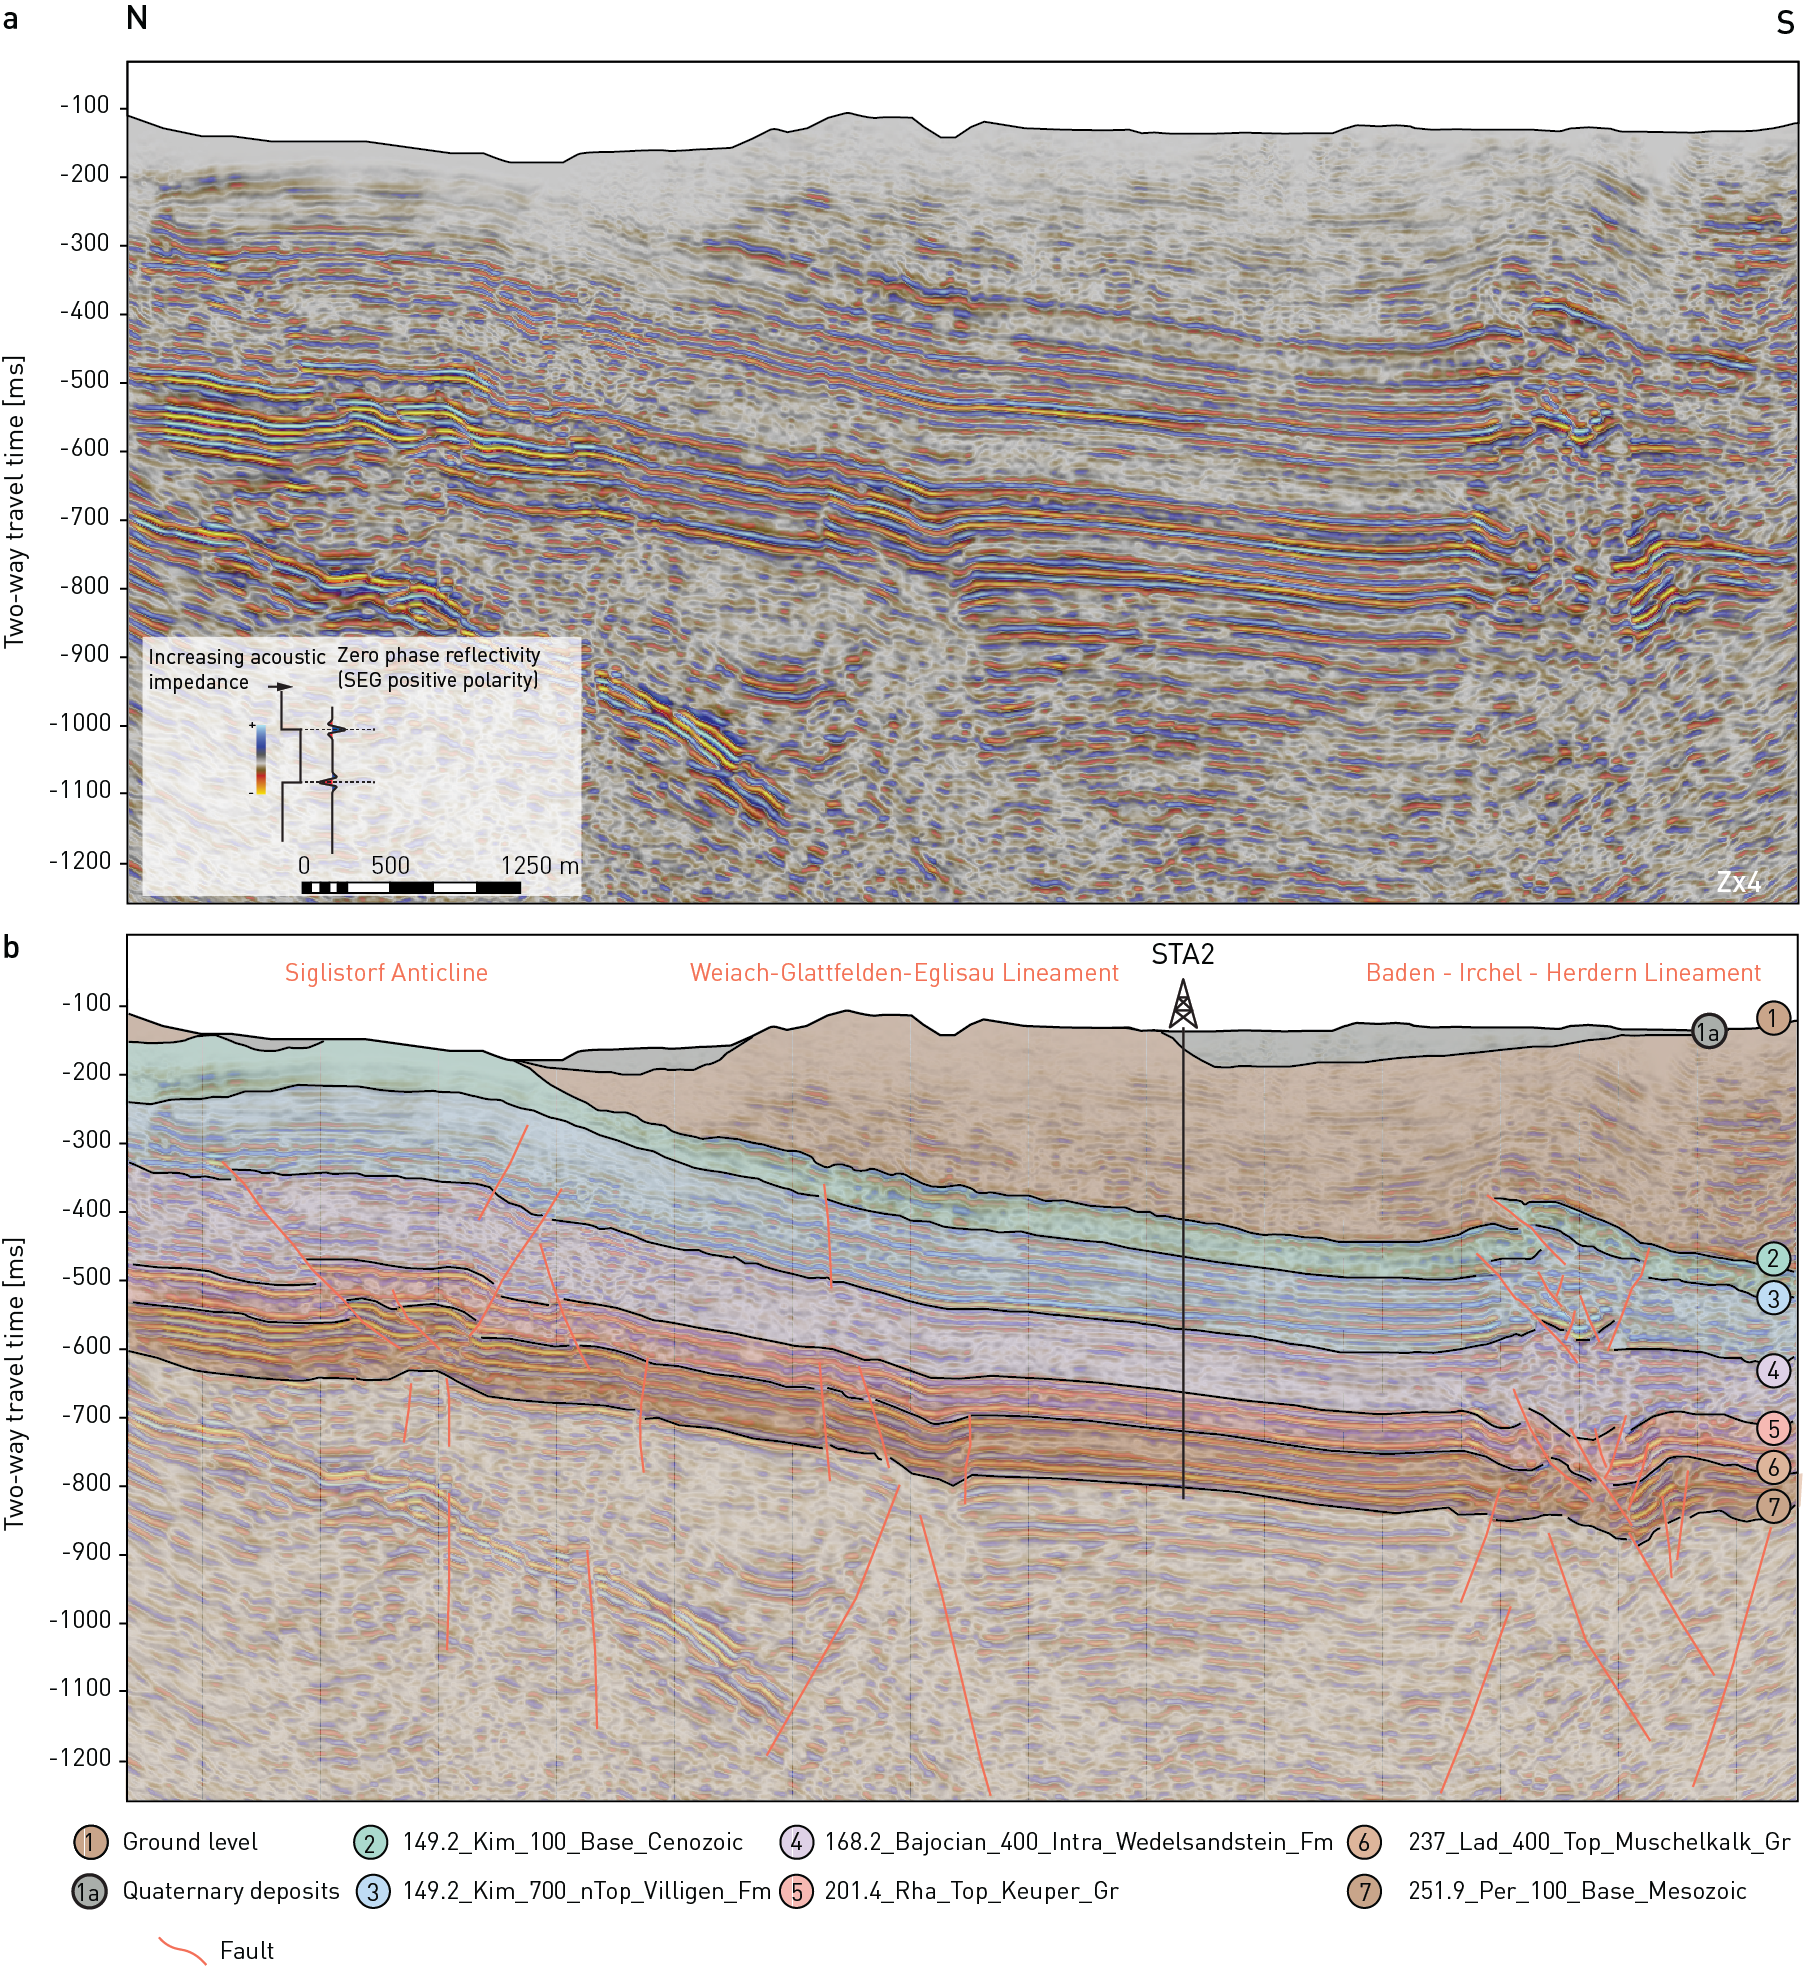
Fig. 4‑66:N-S cross-section in time domain through the 3D seismic reflection data across NL
View is along the acquisition inline 5440, modified after Nagra (2024b). (a) Uninterpreted. (b) Interpreted. Note that the recognition of fault signatures within the Opalinus Clay is strongly hampered by the presence of multiples. The vertical axis was stretched 4 times (Z × 4). Seismic display is PreSTM-ref reflectivity with an overlay of relative acoustic impedance. Note that Top Opalinus Clay could not be picked. Colour shade is given to a larger interval including clay-mineral-rich units above and below the Opalinus Clay with a similar rheology. Profile trace shown in Fig. 4‑65.
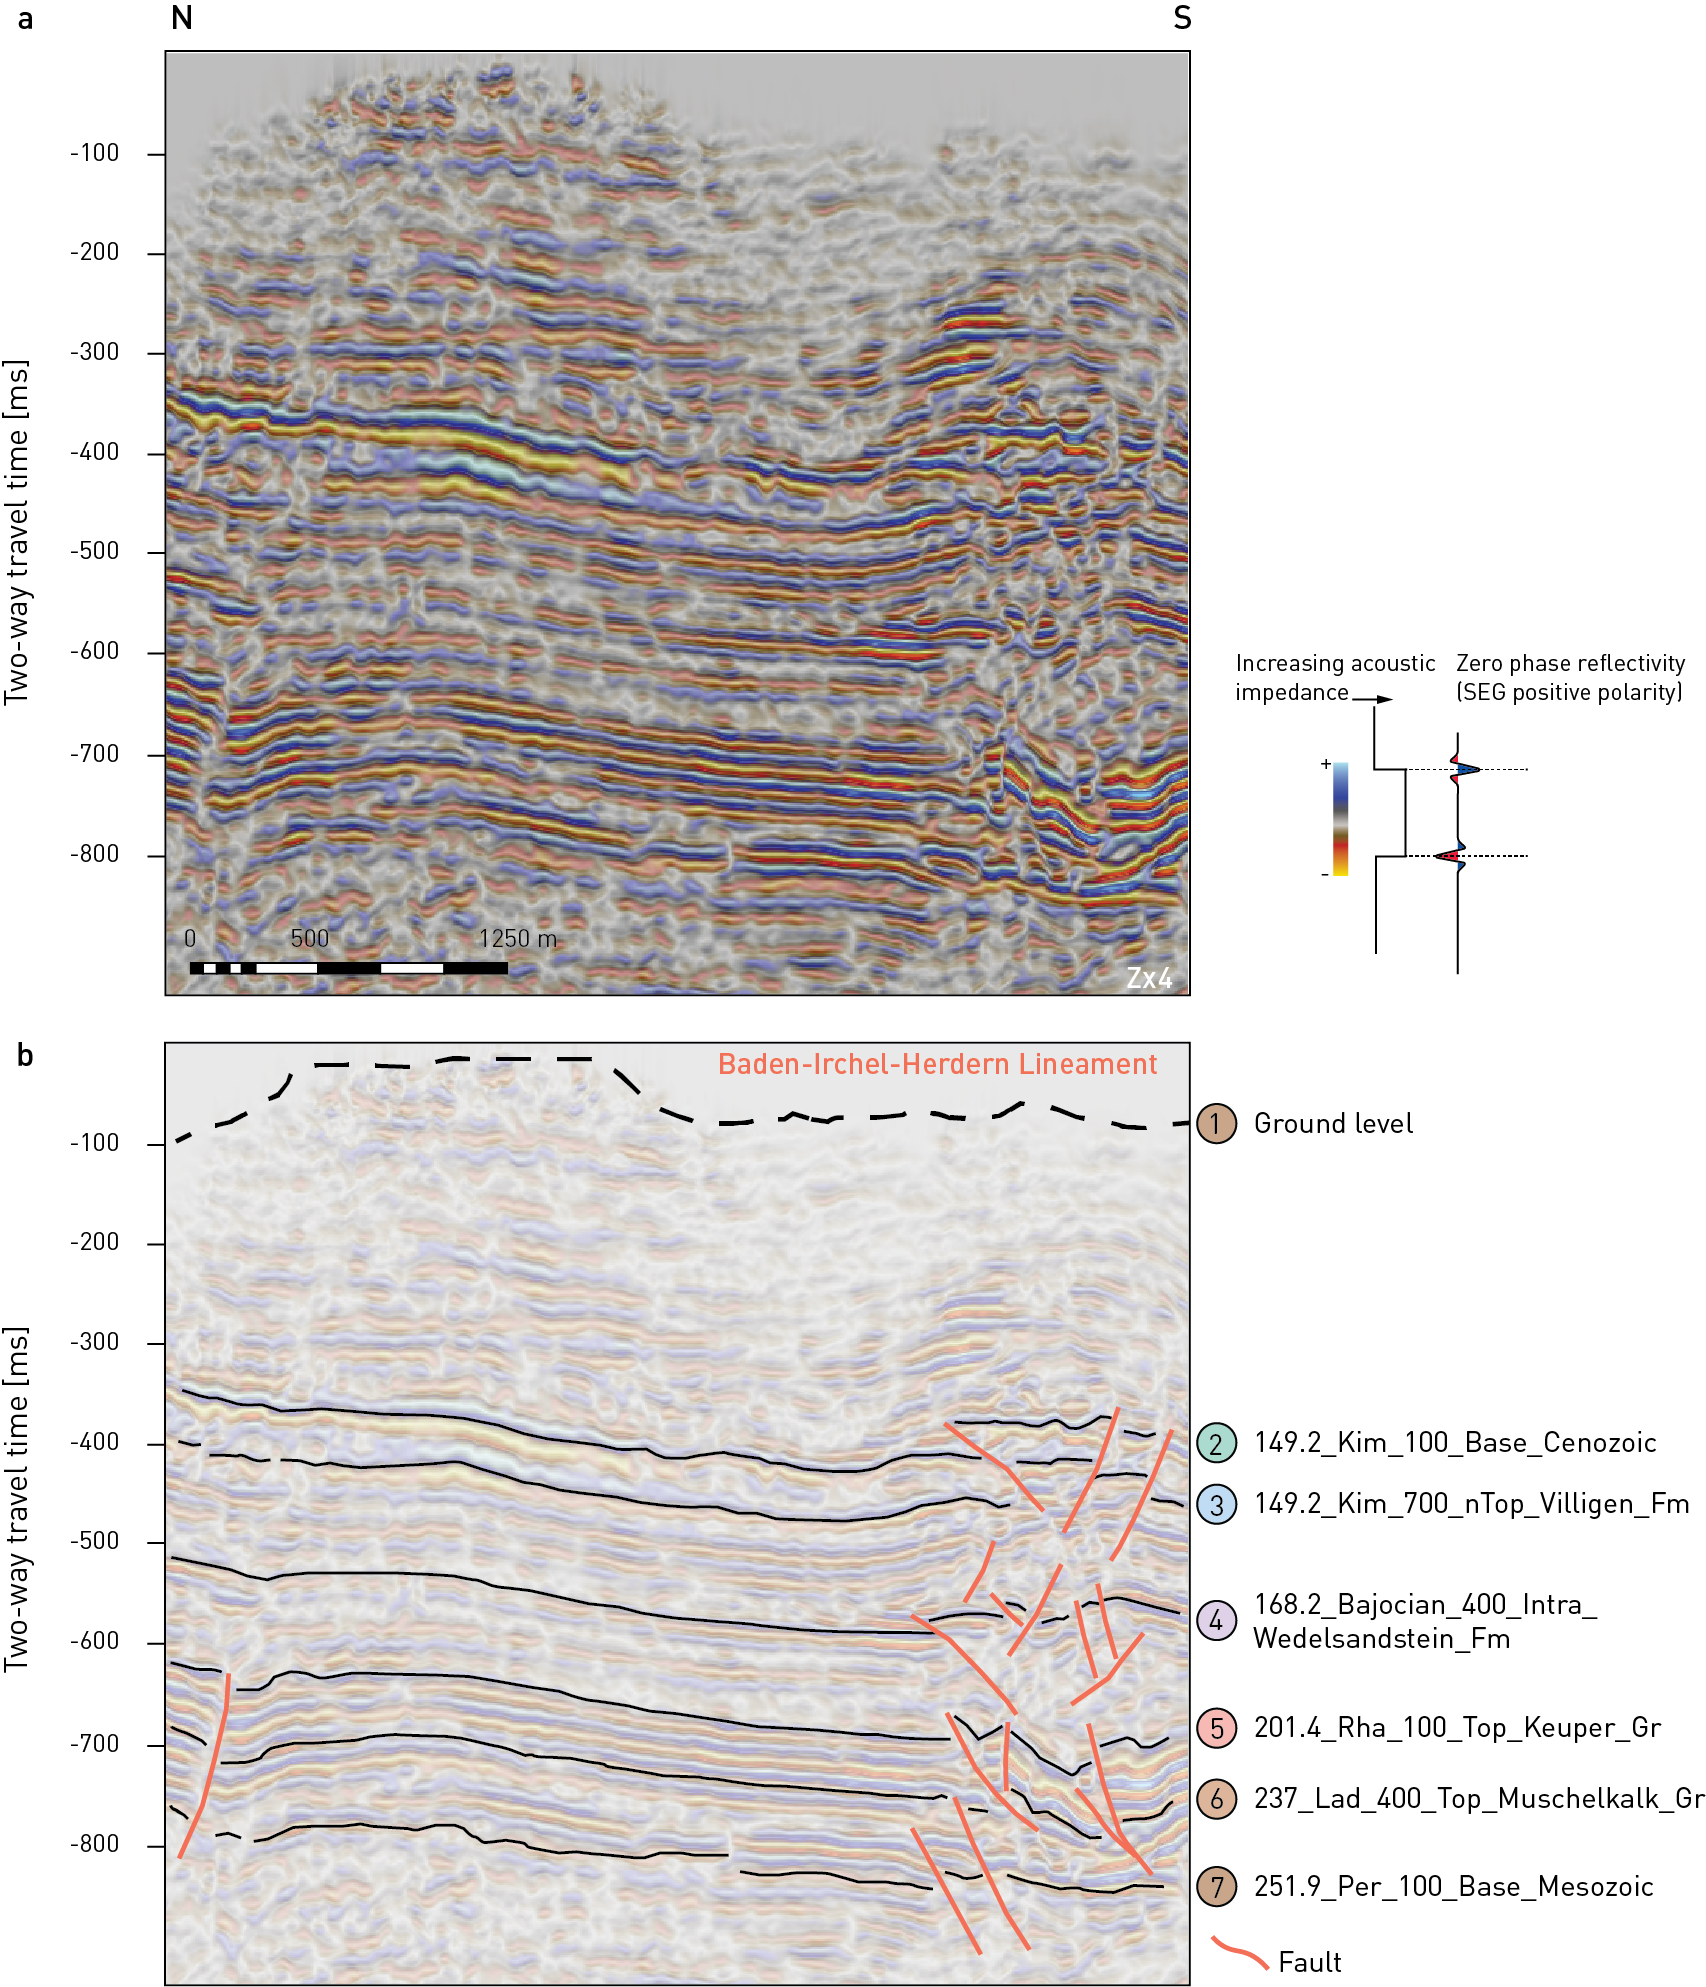
Fig. 4‑67:Focused view in time domain showing interpreted fault geometries in the Baden – Irchel – Herdern Lineament
View is along the acquisition inline 5403, modified after Nagra (2024b). (a) Uninterpreted. (b) Interpreted. Seismic display is PreSTM-ref reflectivity with an overlay of relative acoustic impedance. Note the antiform and synform above 168.2 Bajocian 400 and below 201.4 Rha 100, respectively. The vertical axis was stretched 4 times (Z × 4).
In NL, the Konstanz – Frick Trough is more symmetric than in JO (Fig. 4‑56 and Fig. 4‑57). In particular, the northern shoulder of the trough is wider and characterised by the occurrence of several normal faults (Fig. 4‑55). These faults appear to have controlled the localisation of later deformation during the Jura-related shortening episodes, which resulted in the development of multiple deformed zones including the Siglistorf Anticline and the Weiach – Glattfelden – Eglisau Lineament in the Mesozoic cover (Fig. 4‑66). Therefore, structural development in the northern sector of NL shows a striking difference with respect to JO, where a narrower deformation zone (associated with the Mandach Thrust) developed at a substratum step produced by a single normal fault of the Konstanz – Frick Trough. The Weiach – Glattfelden – Eglisau Lineament is well imaged at the Top Muschelkalk Group level (Fig. 4‑65). It is a high-angle, strongly segmented, ENE-WSW-trending fault array. From west to east, fault segments can be seismically mapped with a length ranging from 300 m to 1 km (Fig. 4‑65). Vertically, the high-angle faults mostly terminate below Near Top Lias Group. Only a few segments affect the units above the Opalinus Clay (Fig. 4‑66). Multiple seismic reflection interpretations identified a hard linkage of the Weiach – Glattfelden – Eglisau Lineament between the substratum (i.e. strata below the décollement level in Middle Triassic evaporites) and the sedimentary cover (Fig. 4‑66). This hard linkage suggests a formation of the Weiach – Glattfelden – Eglisau Lineament postdating décollement-related deformation north of it (i.e. at a distal position with respect to the Alps), as it would otherwise be transported foreland-ward during activity along the décollement.
The Siglistorf Anticline consists of an up to ~ 2-km-wide, composite pop-up including highly segmented thrust and backthrust splays (Fig. 4‑68). In the Malm Group, deformation is accommodated by folding rather than faulting (Fig. 4‑60). 2D cross-section balancing revealed shortening of approximately 200 m across it (Jordan et al. 2015). Although the control exerted by normal fault-related substratum steps on later thrust ramp development appear evident, it remains unclear to what degree the faults that controlled the localisation of the Siglistorf Anticline are linked across the Base Mesozoic unconformity. Schöpfer et al. (2024) discuss multiple scenarios involving both décollement-related deformation and deformation involving the basement. However, Nagra’s current 3D seismic reflection interpretation favours a model, where the faults in the Upper Paleozoic succession, control the localisation of the Siglistorf Anticline and the faults above the Triassic evaporites, as the geometry of the latter faults is consistent with décollement-related deformation (Nagra 2024b).
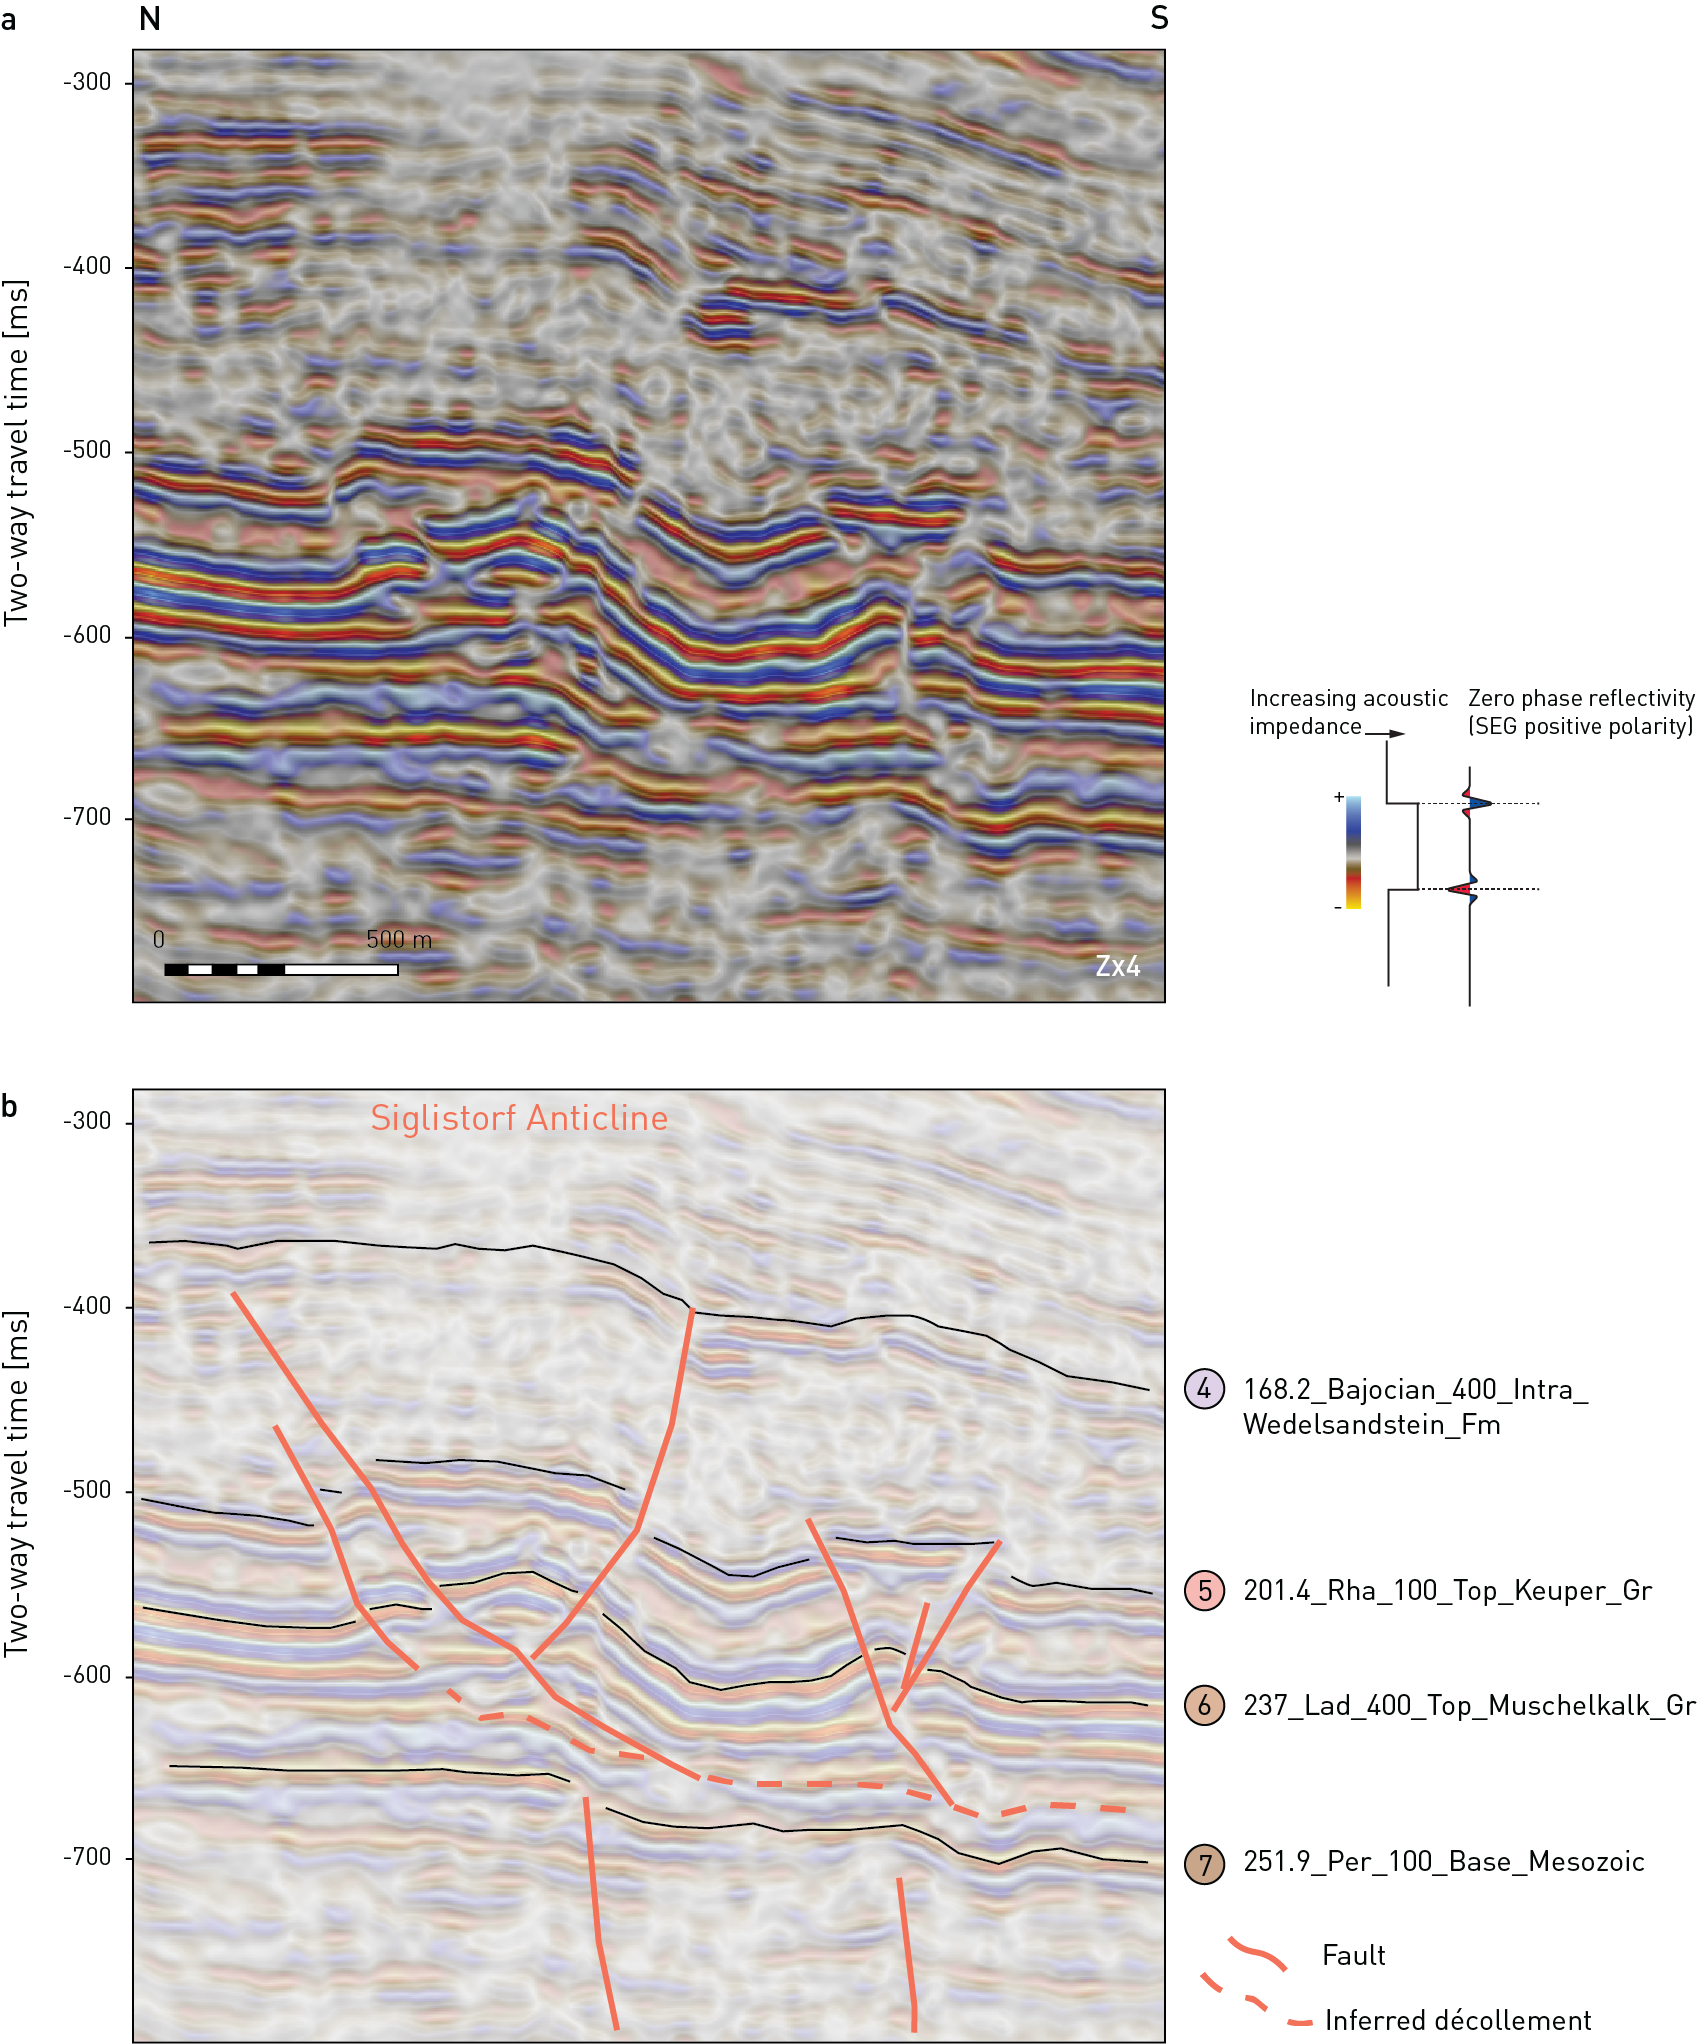
Fig. 4‑68:Focused view in time domain showing the relationship of thrusting in the Siglistorf Anticline and the underlying faults in the Paleozoic strata
View is along the acquisition inline 5239, modified after Nagra (2024b). (a) Uninterpreted. (b) Interpreted. Seismic display is PreSTM-ref reflectivity with an overlay of relative acoustic impedance. The thrust affecting the Mesozoic sequence appears to flatten within the Triassic evaporite interval. The faults in the Paleozoic strata produced the steps at the Base Mesozoic unconformity as a result of minor Paleogene extensional reactivation. The vertical axis was stretched 4 times (Z × 4).
The Eglisau Fault and the Zweidlen Fault are known only from seismic reflection interpretation (Fig. 4‑65; Nagra 2014b, 2019c). They strike roughly NW-SE in a Hercynian orientation. These structures can be traced from the pre-Mesozoic substratum into the sedimentary cover (Fig. 4‑65). This indicates a strong influence of inherited Paleozoic faults on faulting within the sedimentary cover. They are mainly expressed at Top Muschelkalk Group level, but indications are found up to Base Malm Group for the Eglisau Fault and Near Top Lias Group for the Zweidlen Fault (Fig. 4‑65; Nagra 2019c, 2024b). The Eglisau Fault can be subdivided into two segments (Nagra 2019c, Madritsch et al. 2013). The northern one (i.e. north of the Siglistorf Anticline and north of the contractional deformation front of the Alps) is a steeply dipping normal fault. The southern segment shows evidence for contractional deformation, with still observable normal faulting at the Base Mesozoic unconformity level. The Zweidlen Fault appears to terminate at its intersection with the Weiach – Glattfelden – Eglisau Lineament. It is in its present-day geometry mostly a steep reverse fault dipping towards the NE, rooting in the Paleozoic basement.
Zürich Nordost
Zürich Nordost differs tectonically from JO and NL as the Mesozoic here is mostly autochthonous (Nagra 2014b, Birkhäuser et al. 2001). However, the proximity to the Hegau – Bodensee Graben affected the siting region with transtensional deformation expressed by an increased number of high-angle faults (Fig. 4‑58 and Fig. 4‑59). Major tectonic structures are the Neuhausen Fault, which represents the northeastern boundary of the siting region, and the Rafz – Marthalen Flexure (Fig. 4‑69). The predominance of normal faulting is recorded by the shear sense indicators observed in the boreholes, mainly in the Muschelkalk Group in MAR1 (Fig. 4‑69) but also in general, with approximately 55% normal faulting observed, particularly within the Opalinus Clay (Fig. 4‑69). Reverse faulting was described for 37% of the micro faults, whereas strike-slip faults represent 8% of the cases, homogeneously distributed over the entire stratigraphic column (Fig. 4‑69). In addition to extension associated with the Hegau – Bodensee Graben, normal faulting related to the northward migration of the Alpine flexural forebulge and Miocene contraction related with folding and thrusting of the Jura in the SW corner of ZNO is also likely to have occurred within ZNO. The Rafz – Marthalen Flexure is considered the northern front of this contractional deformation (south of the deep boreholes, e.g. Birkhäuser et al. 2001, Müller et al. 2002, Marchant et al. 2005, Nagra 2019d). The mechanical stratigraphy observed in JO and NL is confirmed in ZNO. Higher fracture frequencies are observed in the competent units and lower frequencies in the less competent units (e.g. Opalinus Clay; Fig. 4‑69). Small-scale faults (referred to as fault zones in Dossier V of TBO reports, see Tab. 2‑1) were encountered predominantly in the Triassic units (21 out of 26 in MAR1, 4 out of 4 in RHE1 and 11 out of 17 in TRU1).
The Neuhausen Fault is the most prominent fault in ZNO. It is a NE-SW-trending normal fault exposed at the surface north of ZNO (Fig. 4‑70; Hofmann 1981). Its vertical offset is about 60 m (Birkhäuser et al. 2001). Kinematically linked to the Neuhausen Fault is the Wildensbuch Flexure, which is a WNW-ESE-trending normal fault (Nagra 2024c). The Wildensbuch Flexure was intensively studied as a case example of a soft-linked fault and to analyse in detail fault architecture in relation to mechanical stratigraphy (Roche et al. 2020).
The Rafz – Marthalen Flexure (Fig. 4‑60) developed in the Mesozoic strata overlying the northern rim of the Konstanz – Frick Trough or southern border of the Benken Horst (Fig. 4‑55; Nagra 2014b, Birkhäuser et al. 2001). It is expressed as a mild change in dip azimuth of the Mesozoic strata (Nagra 2024c).
Prominent local faults identified in the 3D seismic reflection data are the Rheinau Fault, the Trüllikon Fault and the Uhwiesen Fault (Fig. 4‑69; Nagra 2024c, 2019d). The Uhwiesen Fault appears as a NW-SE-trending subvertical fault mainly expressed at Near Top Muschelkalk Group and Top Lias Group levels. The Trüllikon Fault (formerly referred to as Trüllikon Anticline), is a N-S-trending fault best imaged at the Near Top Muschelkalk Group level. The orientation of micro faults observed in TRU1 in the Muschelkalk Group are well aligned with the Trüllikon Fault traces from seismic reflection interpretation (Fig. 4‑69; Nagra (ed.) 2021c).
The Near Top Muschelkalk Group is also affected by numerous fault segments, especially in the "Strukturzone von Niderholz", that are not discretely observable above the Opalinus Clay (Birkhäuser et al. 2001, Nagra 2024c, 2019d). They represent high-angle faults that might be linked to the transtensional opening of the Hegau – Bodensee Graben. The high-angle faults, producing discrete strain (i.e. displacement) accumulation mostly evident in the Muschelkalk Group, are accompanied by folds. Folding also affects unfaulted strata at higher stratigraphic levels. However, it is characterised by fold amplitudes progressively decreases at higher stratigraphic levels (Nagra 2024c).
Typically, no evidence for seismically mappable faults was observed above the Opalinus Clay for the high-angle faults, which indicates that strain was accommodated in a more distributed manner in the Opalinus Clay and above (Section 5.5). The Rheinau Fault represents an exception, as fault segments were seismically mapped also above the Opalinus Clay (Fig. 4‑72). Therefore, the segments above and below the Opalinus Clay are conceptually connected in the seismic interpretation. The Rheinau Fault, which consists of a nearly vertical fault in the competent units above (Malm Group) and below the Opalinus Clay (Muschelkalk Group), was investigated by the means of a deviated borehole (RHE1). The borehole was deviated to sample the Opalinus Clay between the two nearly vertical seismically mapped fault segments above and below the Opalinus Clay. Within the structural record of the borehole, no major faulted interval was encountered. The micro fault frequency is comparable to the vertical boreholes (TBO reports in Tab. 2‑1). At the measured depth of approximately 650 m MD, a fault with indications for oblique slip and a dip of approximately 40° was encountered. This micro fault could be kinematically related to the conceptually interpolated Rheinau Fault segments between the above and below the Opalinus Clay (Fig. 4‑72). The observations in the Rheinau borehole are consistent with the deformation behaviour of Opalinus Clay, where strain tends to be more distributed (Section 5.5.4).
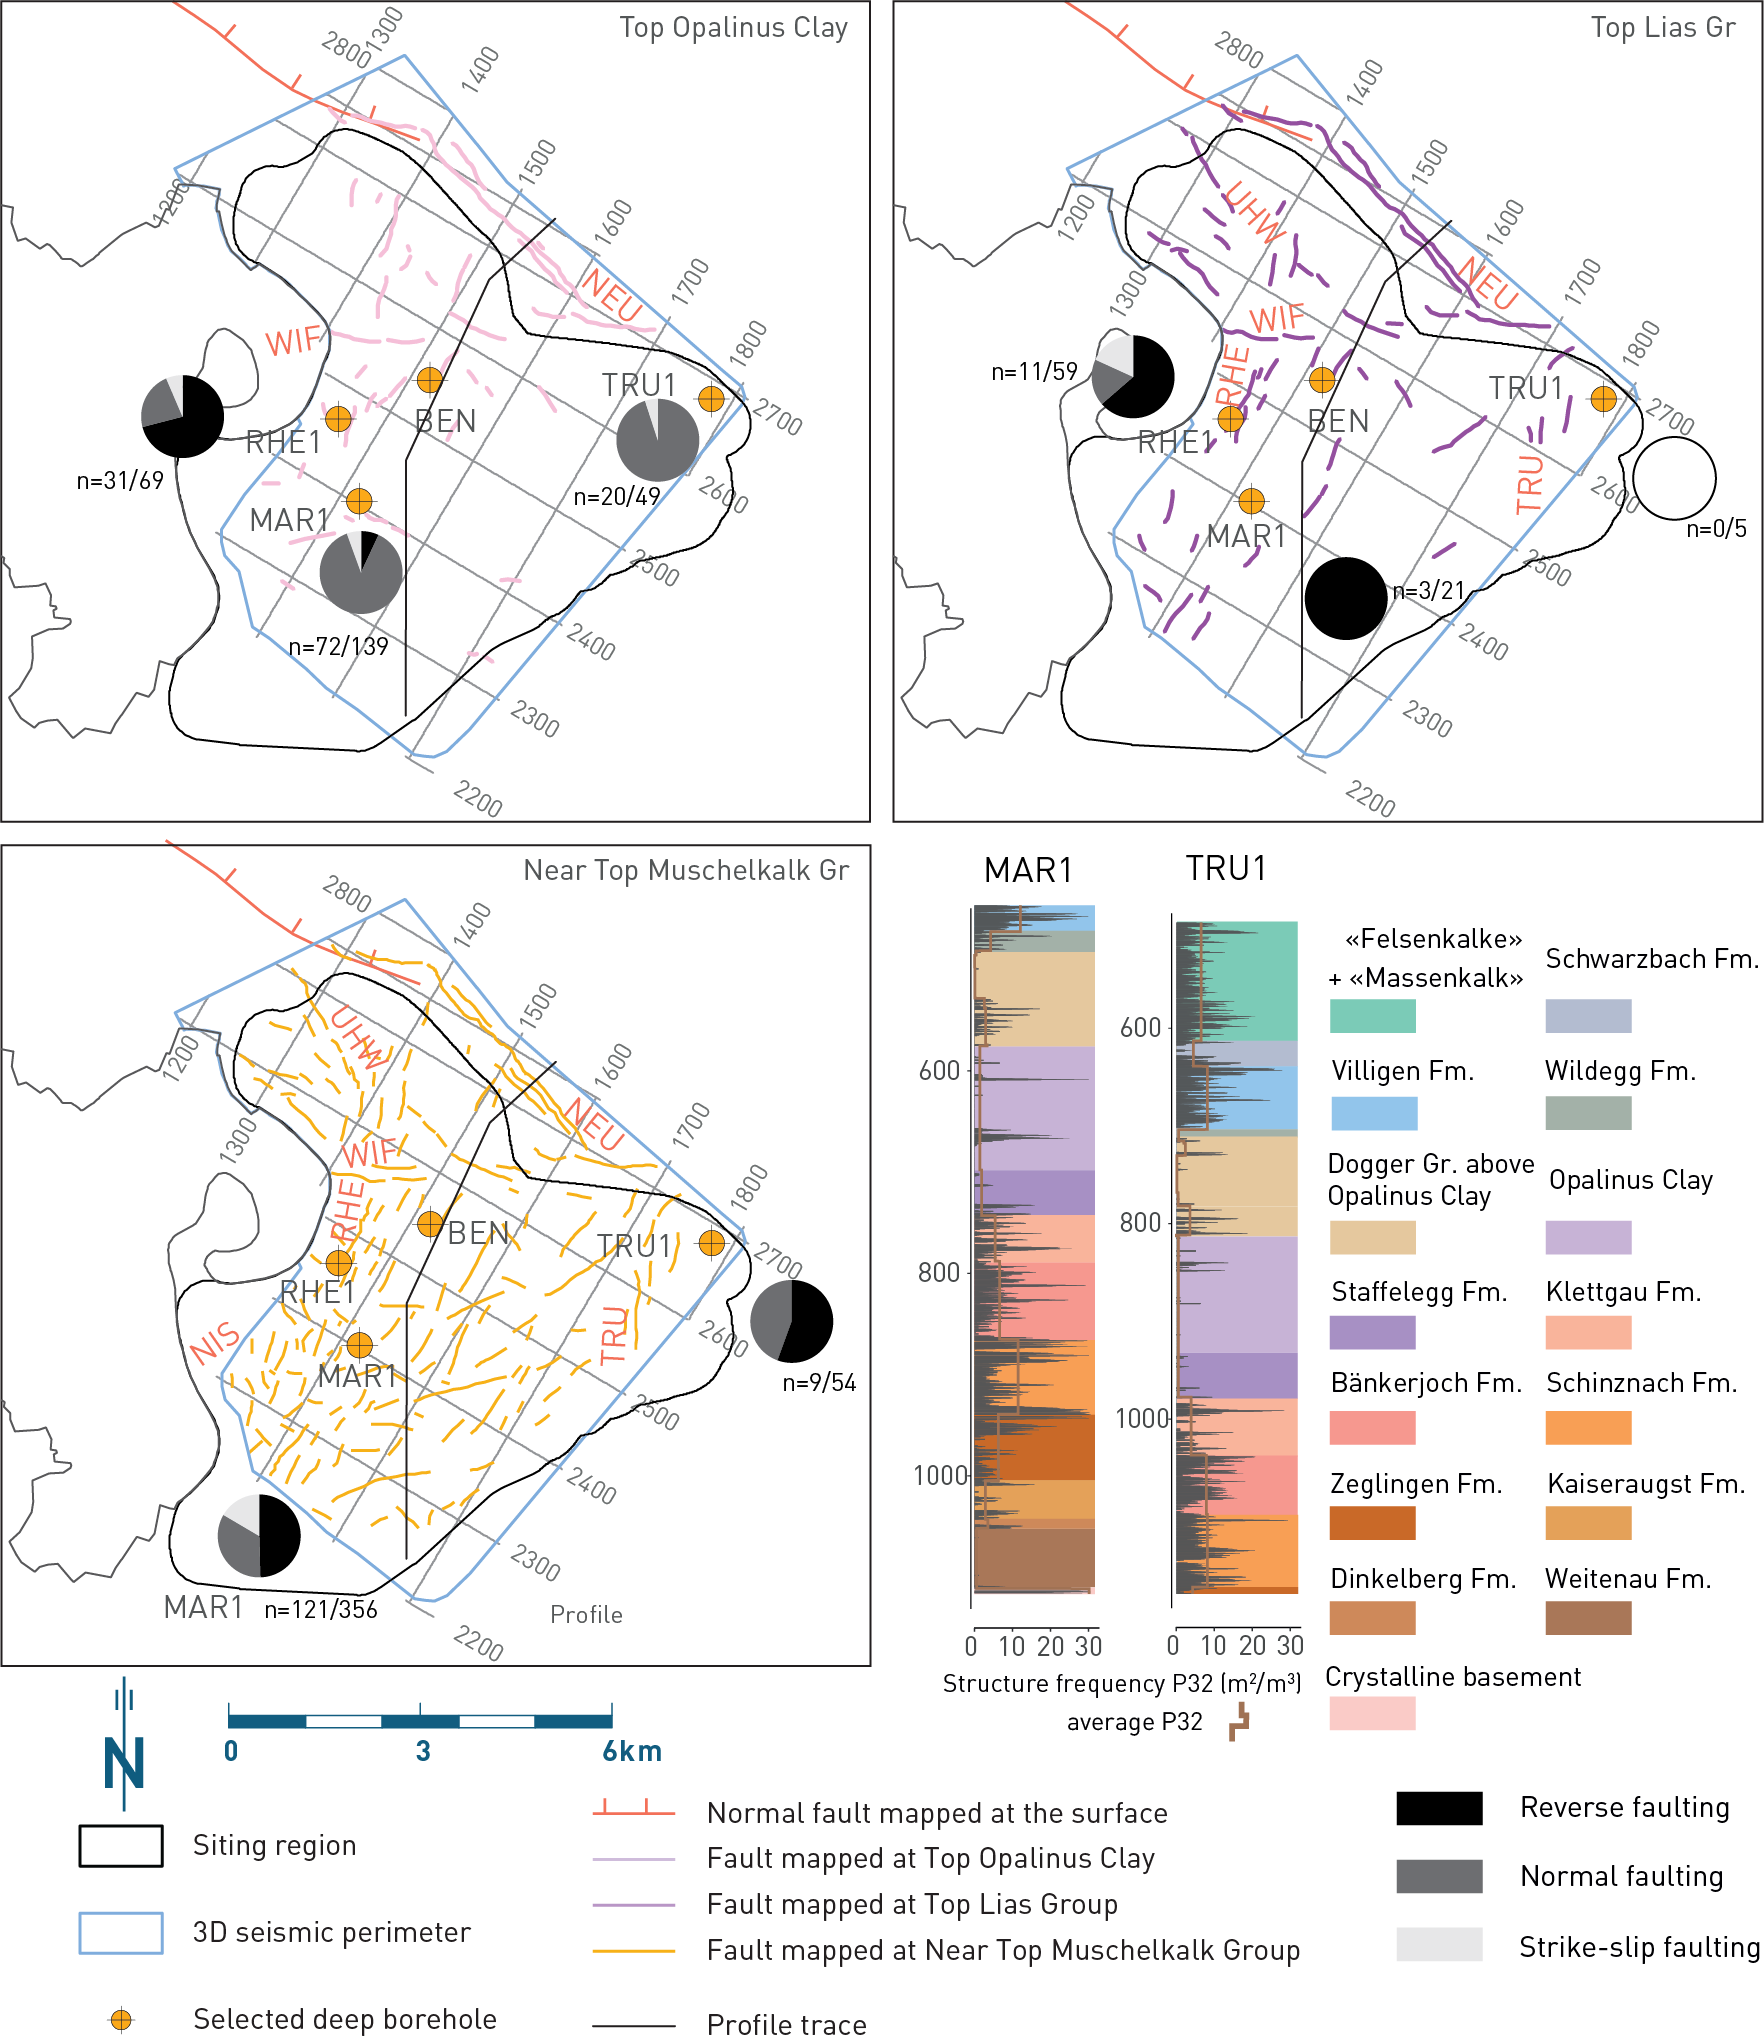
Fig. 4‑69:Fault map for ZNO (shown on three stratigraphic levels) and fracture frequencies in the recent deep boreholes
Fault maps based on seismic reflection interpretation reported in Nagra (2024c). Pie charts show the distribution of shear sense indicators within the Opalinus Clay, the Lias Group and the Muschelkalk Group, respectively. The numbers after 'n=' represent the total number of micro faults with shear sense indication / total number of micro faults. Reverse faulting encompasses all dip-slip upward movements. P32 values refer to the fracture area in a unit volume, i.e. the intersection area of the plane with the cylindrical core and, as such, represents a non-directional intrinsic measure of the degree of rock mass fracturing, incorporating both a frequency measure and a fracture-size component (Ebert & Decker 2019, Dershowitz 1985, Dershowitz & Herda 1992). NEU: Neuhausen Fault, NIS: "Strukturzone von Niderholz", RHE: Rheinau Fault, TRU: Trüllikon Fault, UHW: Uhwiesen Fault, WIF: Wildensbuch Flexure.
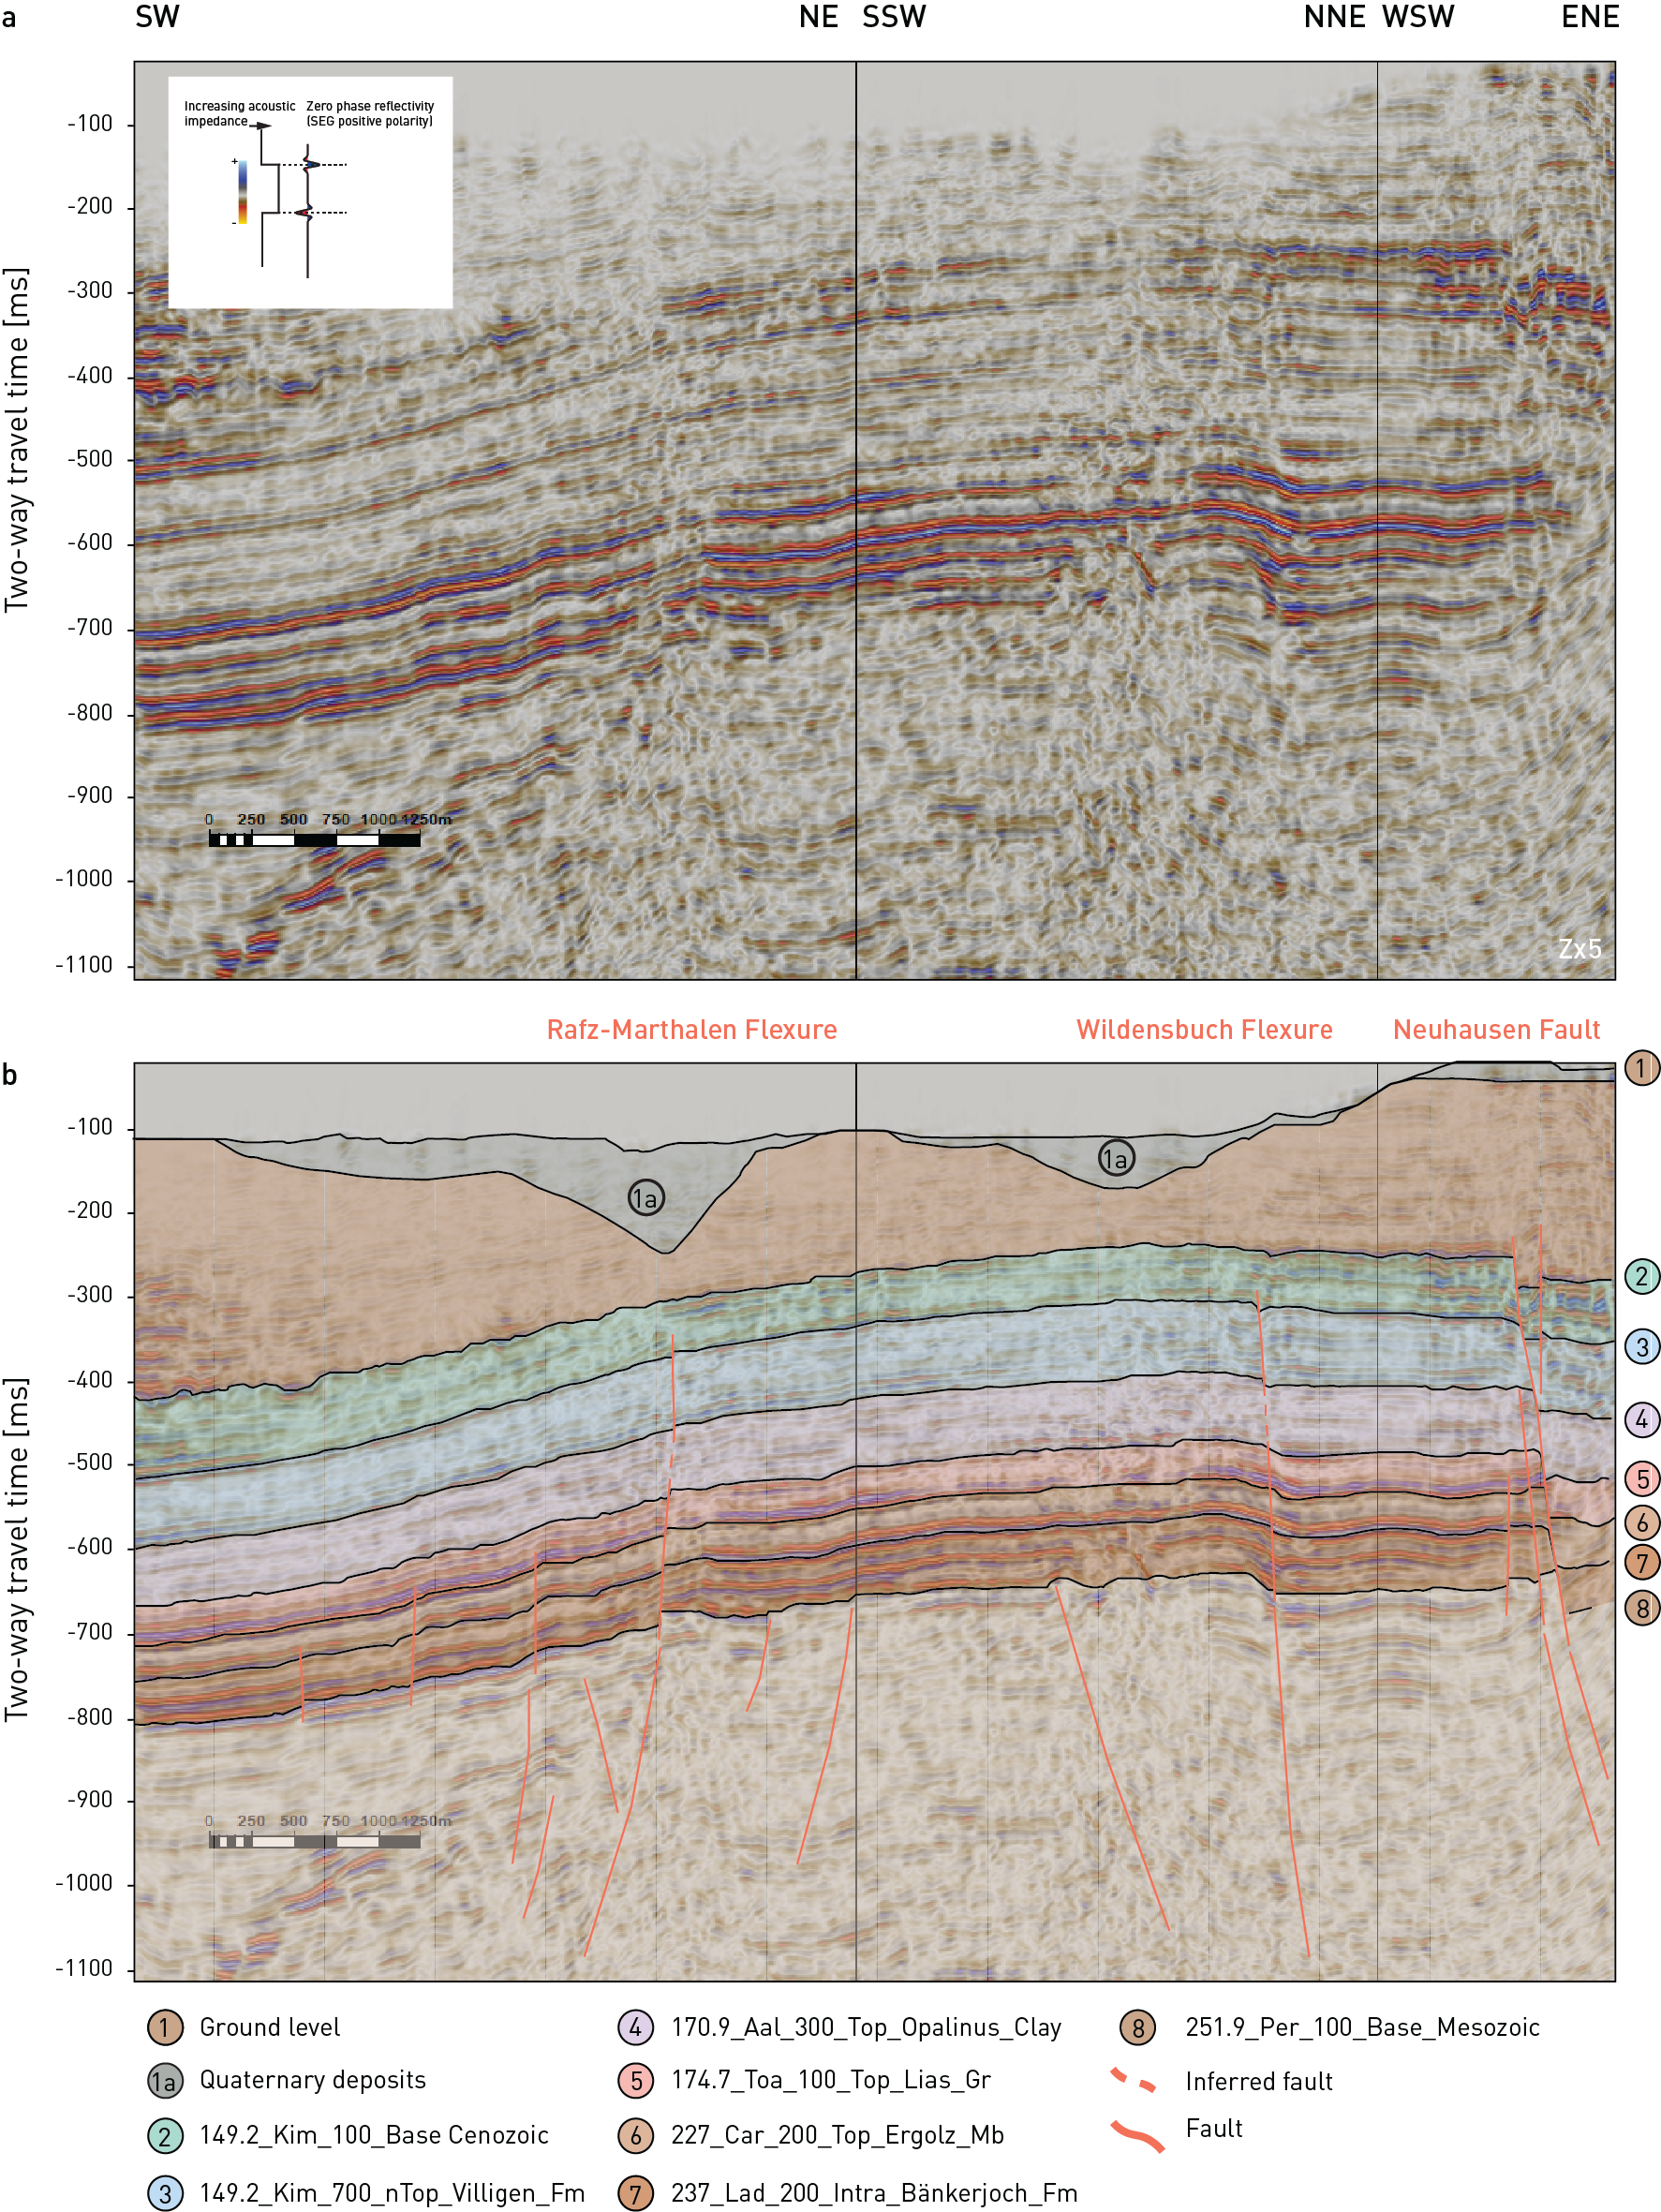
Fig. 4‑70:2D seismic reflection line extracted from 3D seismic reflection data across major structures in ZNO
Modified after Nagra (2024c). (a): Uninterpreted. (b): Interpreted. Seismic display is PreSTM-ref reflectivity with an overlay of relative acoustic impedance. Profile trace shown in Fig. 4‑69. The vertical axis was stretched 5 times (Z × 5).
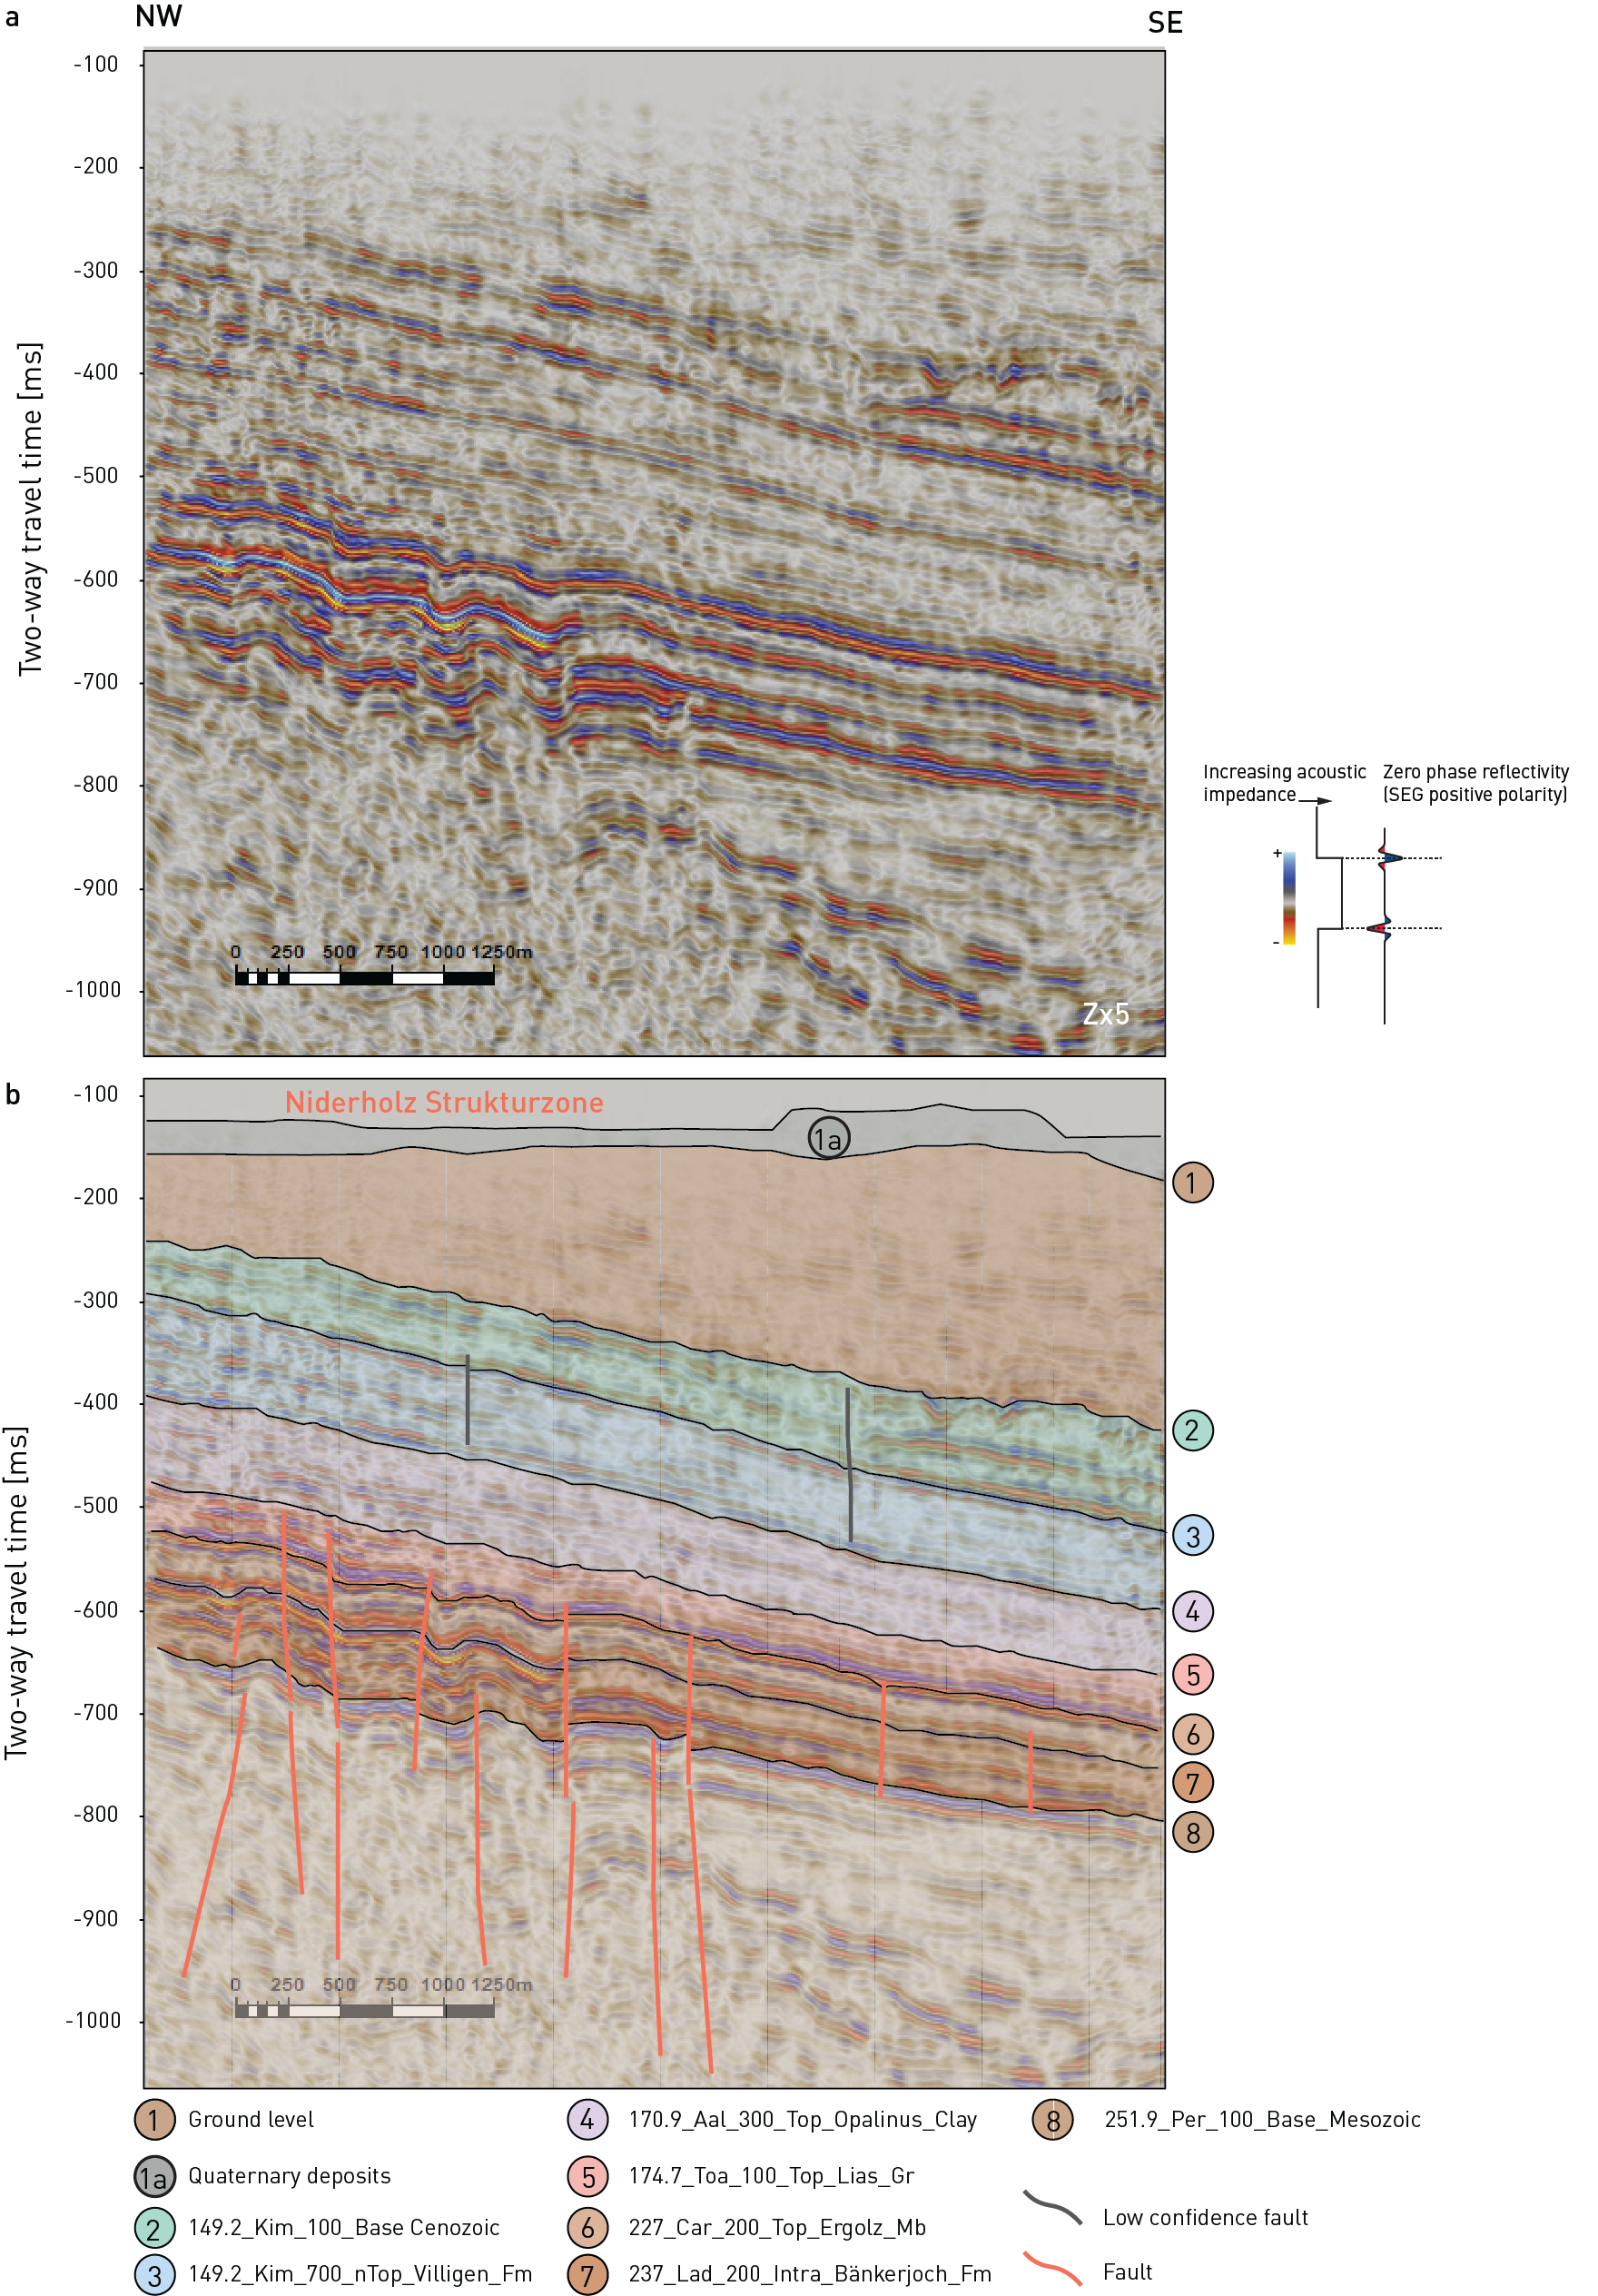
Fig. 4‑71:2D seismic reflection showing high-angle faults in the "Strukturzone von Niderholz"
View is along acquisition crossline 2320, modified after Nagra (2024c). (a): Uninterpreted. (b): Interpreted. Seismic display is PreSTM-ref reflectivity with an overlay of relative acoustic impedance. Profile trace shown in Fig. 4‑69. The vertical axis was stretched 5 times (Z × 5).
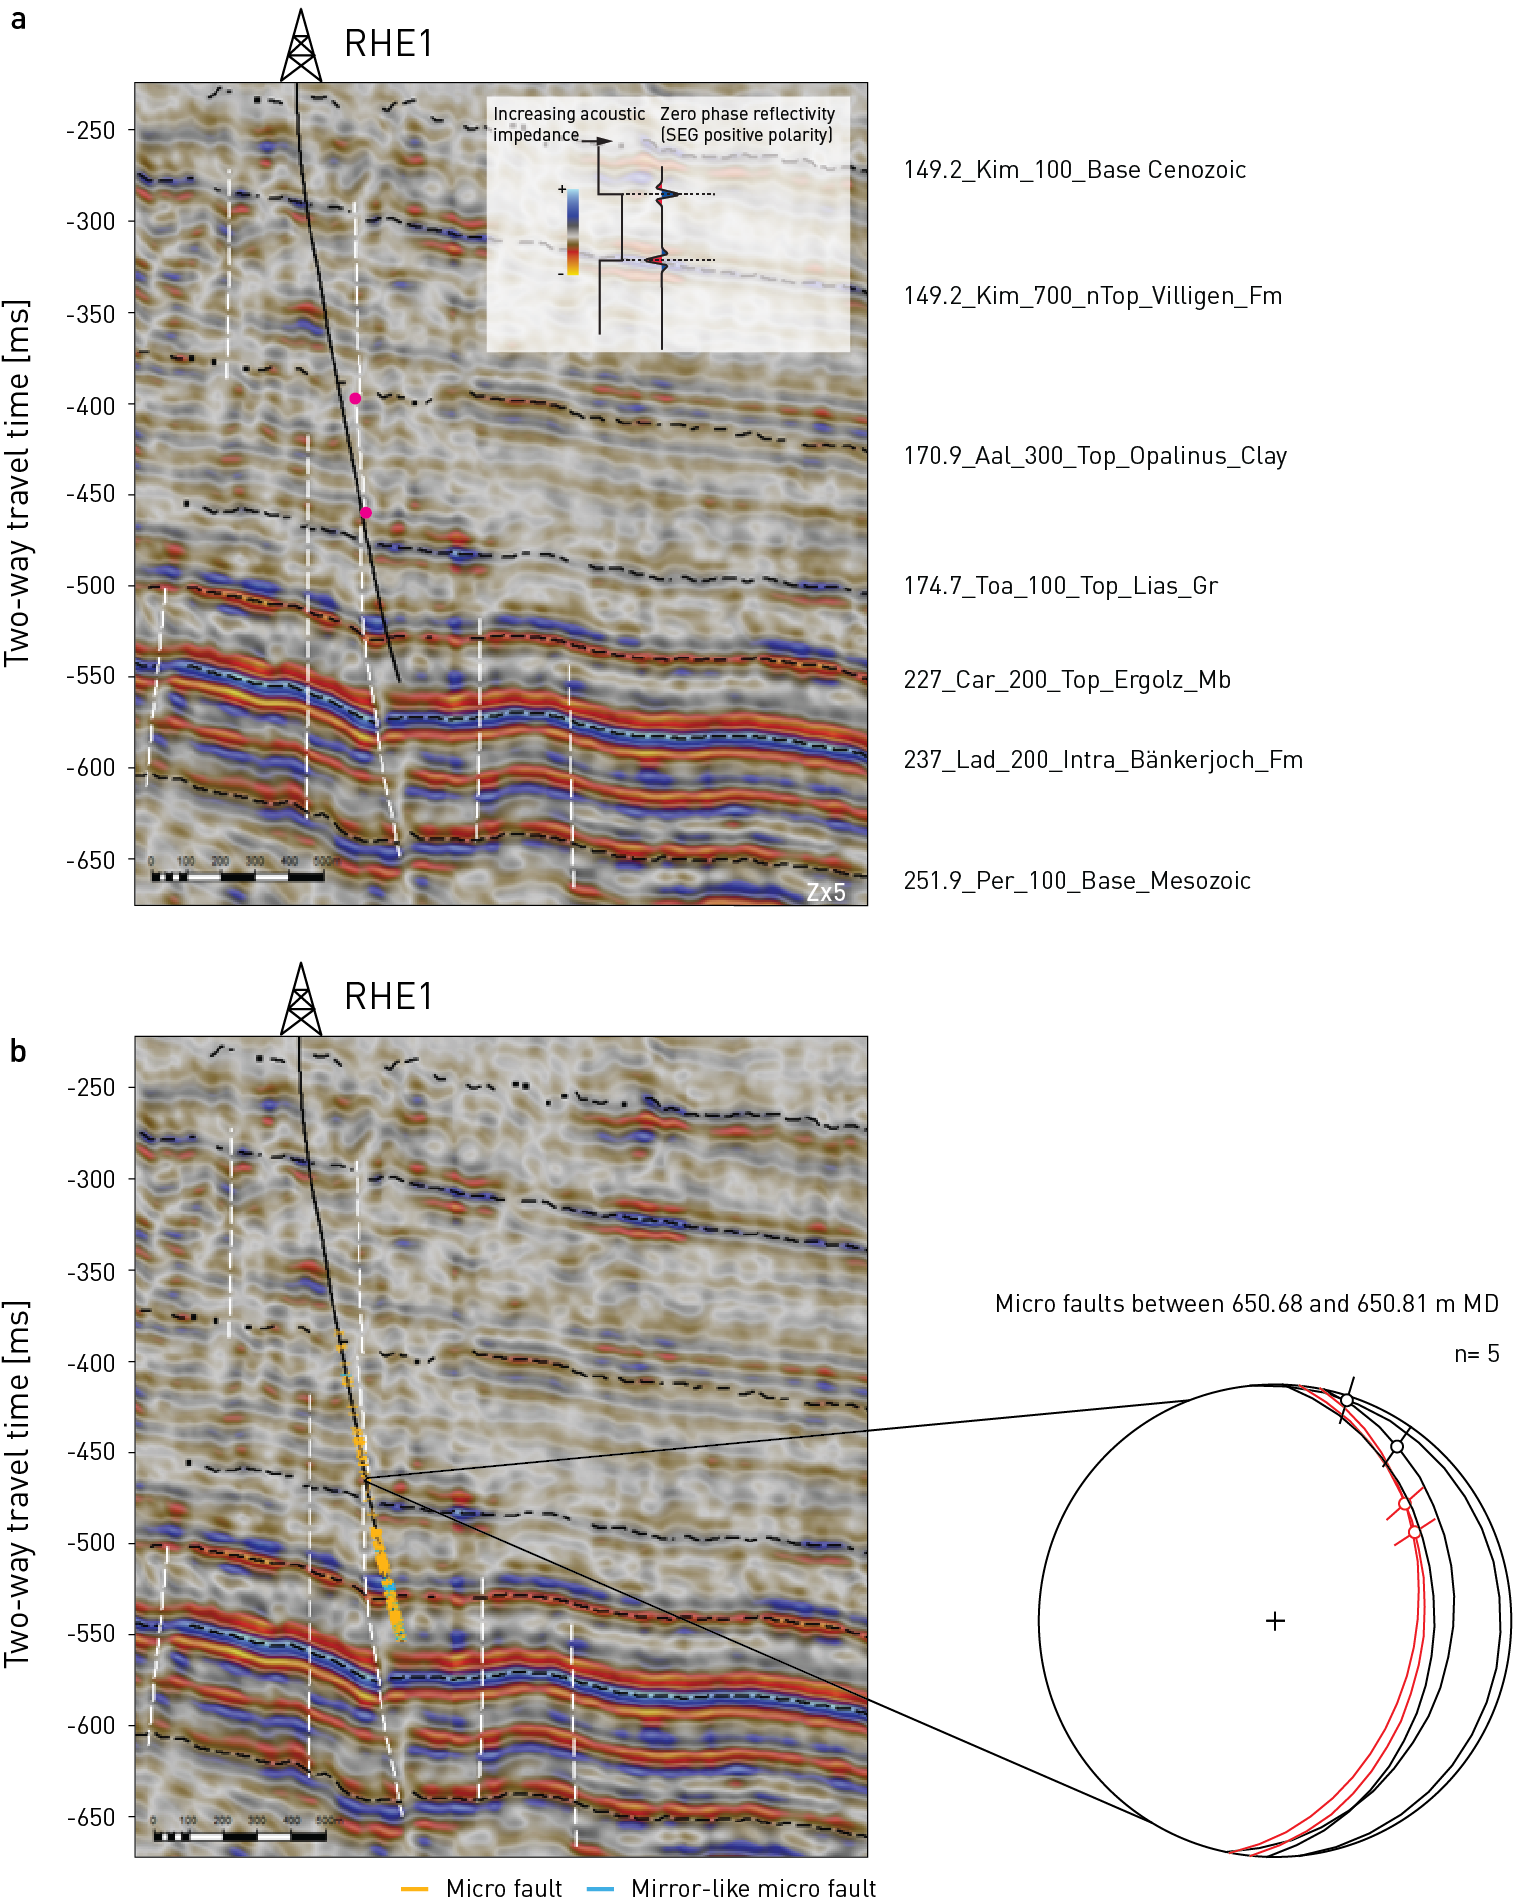
Fig. 4‑72:Rheinau Fault in a 2D seismic reflection line oriented parallel to the borehole path
Modified after Nagra (2024c). White dashed lines refer to interpreted fault segments. For the Rheinau fault, the segments mapped above and below the Opalinus Clay were conceptually connected with a separate fault stick (magenta dots) to indicate that the fault cannot directly be seen on the seismic data here in the Opalinus Clay (see Nagra 2024c for more details). (a) 2D seismic reflection line oriented parallel to the borehole path. (b) 2D seismic reflection line oriented parallel to the borehole path including structural inventory from borehole, and a lower hemisphere equal area projection showing orientation and slickenlines of micro faults encountered in the drill core at the depth of 650.7 – 650.8 m MD. The two micro faults highlighted in red could be related to the seismically mappable Rheinau Fault. Seismic display is PreSTM-ref reflectivity with an overlay of relative acoustic impedance (Nagra 2024c). The vertical axis was stretched 5 times (Z × 5).
The general geological evolution of Northern Switzerland since the Paleozoic has been introduced in Chapter 3. In the following, more details regarding the tectonic and burial temperature evolution since the Early Jurassic are presented based on the observations reported in Section 4.3.4 combined with temperature and absolute age constraints obtained by clumped isotope thermometry coupled with U-Pb and U-Th dating of carbonate cements in veins and diagenetic structures such as pore fillings. The analysis of multiple generations of carbonate cements allows tracking of the evolution of burial temperature and pore fluids across geological timescales. The elemental and isotopic compositions of such carbonate cements record both the timing of precipitation as well as the temperature and composition of the mineral-forming fluid and thereby provide information on the ambient conditions at a specific point in time (e.g. Looser et al. 2021). Time of crystallisation is recorded by the incorporation of uranium into the carbonate lattice and the temperature of crystallisation by the clumped isotope composition. The carbonate clumped isotope palaeothermometer (Δ47) allows the direct reconstruction of the formation temperature and of the oxygen isotopic composition of the mineral-forming fluid (δ18Ofluid). Δ47/(U-Pb/U-Th) thermochronometry thus contrasts other burial temperature proxies such as apatite fission tracks and (U-Th)/He thermochronometers, vitrinite reflectance, or maturation-dependent biomarkers, which yield an integrated temperature signal over time.
In the following, the geodynamic evolution since the Early Jurassic is discussed with the focus on the younger evolution as it has a more direct impact on the present-day setting and its extrapolation to the future. Oxygen isotope data of pore fluids are included in the discussion as these provide additional information on the burial setting. Details on palaeo-fluid flow are discussed in Sections 4.5 to 4.7. The present-day temperature conditions in the siting regions are elaborated in Section 4.8.
Deposition, early diagenesis and onset of burial during the Early Jurassic
In the Early Jurassic, sedimentation occurred in an epicontinental sea (Chapter 3) with lithospheric stretching creating accommodation space. Deposition rates were very low throughout the Early Jurassic, resulting in a present-day thickness of the Lias Group of only 30 – 50 m in Northern Switzerland and shallow burial conditions until the beginning of the Middle Jurassic (Section 4.2.5; Reisdorf & Wetzel 2018, Müller et al. 2002). Void-filling calcite cements in ammonites, aragonite replacement cements in bivalves, and veins in the Beggingen Member (lower Lias Group) yield U-Pb ages overlapping with the stratigraphic age of the host rocks and thus document the early Jurassic geodynamic evolution (Fig. 4‑73). In the case of the early veins, this indicates that lithification of calcareous units in the Lias Group initiated shortly after deposition. The δ18Ofluid signatures of these cements document earliest diagenesis with the mineral-forming fluids sourcing from seawater (Fig. 4‑73). One sample from the Frick clay pit (Fig. 4‑60) indicates mixing with meteoric waters infiltrated during localised temporary emergence of the Beggingen Member during the Early Jurassic, in agreement with sedimentological evidence (Section 4.2.5, Reisdorf & Wetzel 2018 and references therein). Despite overlapping U-Pb ages, the temperatures of these early calcite phases show an inconsistent picture, with values ranging between 25 and 50 °C and, in the case of one outlier, even of 70 °C. While seawater-like Δ47 temperatures are in good agreement with marine to very shallow burial conditions, the extent of the observed high temperatures of other calcite phases as well as the coeval occurrence of very different temperatures raises questions about their plausibility. The observed high temperatures may result from near-surface related kinetic effects (e.g. degassing) and should thus be interpreted with caution.
Middle Jurassic to Early Cretaceous extension and thermal anomaly
Because of the absence of the Late Jurassic and Cretaceous sedimentary rocks due to non-deposition and/or erosion, the burial and thermal evolution during the Late Jurassic and Cretaceous has been debated. Several studies reported indications for heating during the Late Jurassic and Cretaceous, but the timing of occurrence and associated temperatures could not be precisely constrained (e.g. Schegg & Leu 1998, Mazurek et al. 2006, Timar-Geng et al. 2006, Omodeo-Salé et al. 2021, Villagómez Díaz et al. 2021). It thus remained unclear whether high temperatures resulted from deep burial under (later eroded) the latest Jurassic and Cretaceous sediments or from high basal heat flow. The presented Δ47/(U-Pb) data of calcite and saddle dolomite veins and pore-filling cements indicate that, between the Middle Jurassic and Early Cretaceous, burial temperatures increased to peak temperatures of 60 °C in the upper Malm Group, 80 – 85 °C in the middle Dogger Group, and up to 100 – 115 °C in the lower Lias Group at 150 – 135 Ma (Fig. 4‑73). Primary fluid inclusions in the same cements suggesting similar or even higher temperatures corroborate these Δ47 temperatures (i.e. pressure-corrected trapping temperatures of 80 °C for the upper Malm Group, 85 – 90 °C for the middle Dogger Group, and up to 110 – 115 °C for the lower Lias Group). These temperatures are in good agreement with temperatures of up to 104 ± 9 °C obtained from calcite veins in the Opalinus Clay reported by Akker et al. (2023), although U-Pb dating of those veins was unsuccessful.
The U-Pb ages of the carbonate cements recording these temperatures overlap within error or are only slightly younger than the depositional age of the youngest preserved Jurassic sediments (Wettingen Member, «Felsenkalke» and «Massenkalk») which have a Late Kimmeridgian stratigraphic age corresponding to 150 – 149 Ma. This suggests relatively shallow burial depths for the time of occurrence of peak burial temperatures and confirms high basal heat flow as the reason for the observed heating, as proposed by Mazurek et al. (2006), rather than deep burial. The δ18Ofluid signatures of the cements recording the peak burial temperatures reflect pristine to only slightly modified seawater and contradict extensive interaction between pore fluids and host rocks at high temperatures. Instead, the observed marine-like δ18Ofluid compositions document comparably short residence time of the fluids at the recorded high temperatures, in agreement with the inferred shallow burial depths. Low (non-radiogenic) 87Sr/86Sr signatures of these cements consistent with Jurassic to Early Cretaceous seawater show no indication for interaction of the pore fluids with the crystalline basement and/or Triassic formations and speak against hydrothermal fluid ascent into the Jurassic succession (Looser 2022). Therefore, the fluids sourced either externally from downward migrating Late Jurassic to Early Cretaceous seawater or internally from marine formation waters present in the host rocks and heated rapidly due to abruptly increased basal heat flow.
The temperature anomaly diminished during the early Middle Cretaceous, as recorded by 30 °C cooling in the lower Lias Group until 120 Ma, although burial depths are thought to have remained constant or even increased during that time (Crampton & Allen 1995, Schegg & Leu 1998, Mazurek et al. 2006). Although the general thermal evolution is comparable, the peak burial temperatures indicated by carbonate cements were hotter and reached earlier than suggested previously based on thermal modelling using apatite thermochronology, vitrinite reflectance and biomarker isomerisation data. For instance, Omodeo-Salé et al. (2021) estimated peak temperatures of ~ 95 °C for the lower Dogger Group that were reached at 110 Ma and Mazurek et al. (2006) estimated peak temperatures of ~ 60 °C for the top of the uneroded Malm Group, ~ 80 °C for the lower Dogger Group, and, interpolated from their estimates for the top of the crystalline basement, ~ 85 – 90 °C for the Lias Group at 120 – 105 Ma (Fig. 4‑73).
The time frame for the occurrence of high basal heat flow coincides with continental-scale crustal extension related to continued ocean opening and spreading at the Piemont – Liguria Ocean and Atlantic Ocean in the Late Jurassic – Early Cretaceous (e.g. Ziegler 1990, Handy et al. 2010). This tensional stress resulted in widespread extension tectonics (e.g. Trümpy 1980, Stampfli & Borel 2002) and accelerated subsidence of large parts of central Europe (Chapter 3, Section 4.2, e.g. Wildi et al. 1989). In Northern Switzerland, subsidence rates increased drastically at the beginning of the Middle Jurassic Era, as evidenced by orders of magnitude higher net sedimentation rates for the Dogger and Malm Groups compared to the Lias Group (Section 4.2; Müller et al. 2002). In this extensional regime, pre-existing Paleozoic fault systems in Northern Switzerland, such as the Konstanz – Frick Trough, are thought to have been episodically reactivated across the Jurassic (Allenbach 2002, Wetzel et al. 2003, Reisdorf & Wetzel 2018). The observed high basal heat flow could thus well have occurred related to thermal disturbances along such basement-rooted faults. Further evidence for thermal disturbances during the Jurassic and Early Cretaceous is provided by hydrothermal veins and mineral alterations in the pre-Mesozoic units in the Black Forest Massif, with radiometric ages covering the entire Jurassic and Early Cretaceous (Wernicke & Lippolt 1997, Pfaff et al. 2009, Staude et al. 2012, Brockamp et al. 2015 and references therein). As elaborated above, hydrothermal activity in Northern Switzerland would have been restricted to the pre-Mesozoic units and the lowermost Triassic sedimentary rocks without cross-formation fluid flow into the Jurassic succession whereby massive Triassic evaporites could have acted as effective seal (Mazurek et al. 2006, Looser 2022).
Eocene exhumation and evolution during the Oligocene
Cessation of the first interval of burial during the Late Mesozoic is recorded by a major erosional unconformity spanning ~ 100 Ma from the latest Jurassic to Eocene times (Herb 1988). Combined Δ47/(U-Pb) data show cooling of 25 °C at 55 to 50 Ma, which can be correlated with exhumation (Fig. 4‑73). Calcite cements precipitated in the Malm Group between Late Cretaceous and Early Eocene times show δ18Ofluid signatures overlapping with those of Jurassic porewaters. This indicates that the Mesozoic succession remained hydrologically undisturbed until the onset of exhumation at ~ 55 Ma. Starting at 50 Ma and continuing until 20 Ma, however, δ18Ofluid signatures gradually shifted to meteoric signatures with values as low as -7 ‰ resulting from infiltration of meteoric fluids and mixing with Jurassic marine porewaters. Possible transport processes are discussed in Section 4.7.
The earliest preserved deposits after erosion are continental karst infills in the uppermost Malm Group consisting of Siderolithic clays with a Middle Eocene to Early Oligocene depositional age (Mammal Paleogene zones MP13 – MP22, corresponding to 45 – 33 Ma (Rosselet 1991, Gradstein et al. 2020).
During the Oligocene, closure of the Piemont – Liguria and Valais Oceans was completed (e.g. Schmid et al. 1996). Subsequently, collision involved basal accretion of European upper crust into the Alpine wedge (Handy et al. 2010, Gleißner et al. 2021). Increased crustal loading of the lower plate resulted in down bending of the lithosphere and the consequent formation of a wedge-shaped foreland basin referred to as the Molasse Basin (Pfiffner 1986). Alternatively, it has been suggested that not flexural loading, but slab rollback is responsible for bending of the lower plate (Schlunegger & Kissling 2022). Whichever mode is preferred, the flexural foreland basin was deepest close to the orogenic front and became progressively shallower towards the north, resulting in a wedge geometry. Basin width (i.e. N-S extent) as well as possible formation of a distal forebulge is a function of the elastic thickness of the lower plate. The forebulge marked an area dominated by uplift and erosion. The lithospheric flexure resulted in a SE-directed tilting of the Mesozoic strata in Northern Switzerland (Fig. 4‑56, Fig. 4‑57 and Fig. 4‑58).
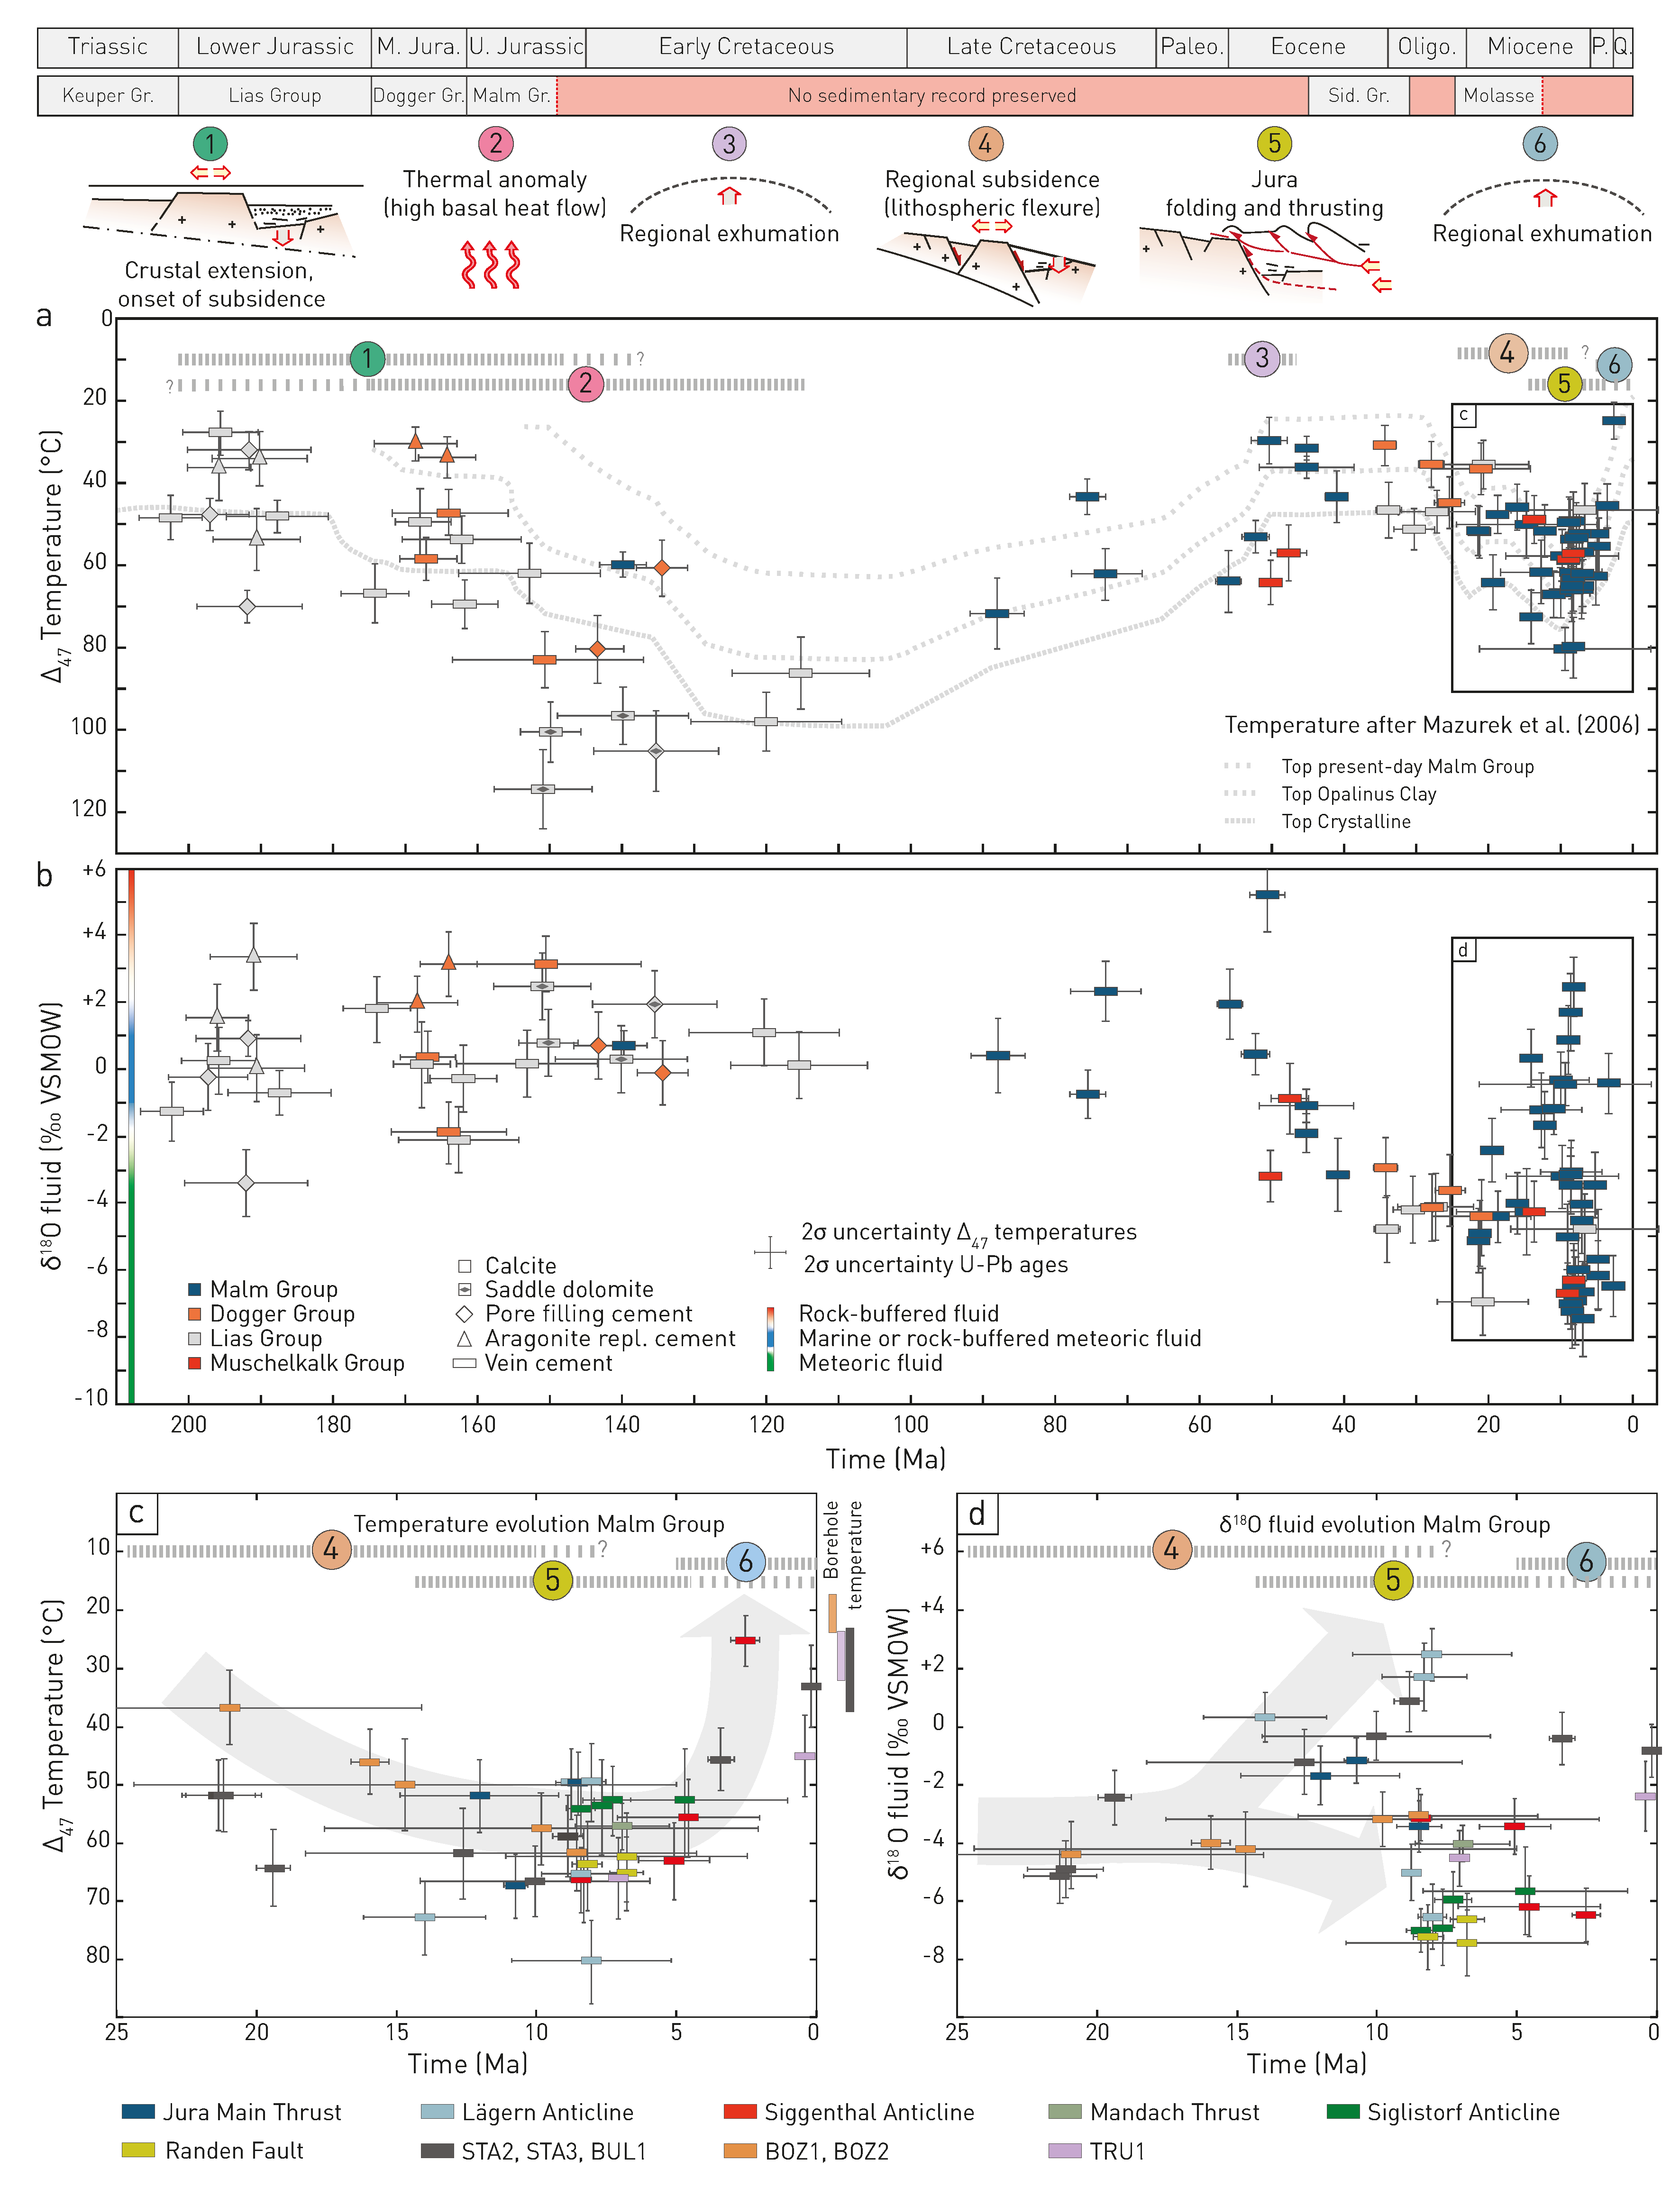
Fig. 4‑73:Evolution of burial temperature and oxygen isotope composition of pore fluids (δ18Ofluid) since the Early Jurassic
(a) Evolution of temperature since the Early Jurassic (after Mazurek et al. 2006). (b) Evolution of the oxygen isotope composition of mineral-forming fluids since the Early Jurassic. (c) Temperature evolution in the Malm Group since 25 Ma. (d) Evolution of the oxygen isotope composition of mineral-forming fluids in the Malm Group since 25 Ma. M.: Middle, U.: Upper, Paleo.: Paleocene, Oligo.: Oligocene, P.: Pliocene, Q.: Quaternary, Gr.: Group, Sid.: Siderolithic, VSMOW: Vienna standard mean ocean water, repl.: replacement.
Furthermore, flexing of the lower plate including pre-Mesozoic basement and Mesozoic cover resulted in extensional tectonics in Northern Switzerland during the Paleogene (e.g. Laubscher 1985). This normal faulting phase is recorded in Northern Switzerland, for instance, in the Mesozoic strata north of the Mandach Thrust which are at higher elevation than south of the Mandach (Nagra 2024a), in the present-day net normal offset preserved along the eastern continuation of the Baden – Irchel – Herdern Lineament (Fig. 4‑60; Meier et al. 2014) or in the normal faulting observed along the cores of the recent deep boreholes (Tab. 2‑1).
Preceded by Late Cretaceous volcanism, rifting in the southern Upper Rhine Graben started in Late Eocene times (42 – 31 Ma; Henrion et al. 2020, Ziegler 1992, Rotstein & Schaming 2011, Dèzes et al. 2004). The main rifting phase ended in the mid-Rupelian but localised extension related to a strike-slip-dominated deformation continued at least into the Pliocene (Giamboni et al. 2004, Rotstein & Schaming 2011). Rift-related surface uplift of the graben shoulders (i.e. Black Forest and Vosges Massifs) further increased southward tilting of the Mesozoic strata in Northern Switzerland (e.g. Müller et al. 2002).
Evolution during the Miocene
During the Miocene, the Alps grew by frontal and basal accretion. This has been attributed to either plate convergence (e.g. Bonnet et al. 2007, Schlunegger & Mosar 2011, Willett & Schlunegger 2010), or slab rollback and associated buoyancy-driven uplift (Schlunegger & Kissling 2015). NW-propagation of the Alpine deformation occurred along an intra-Triassic décollement level rooting underneath the External Crystlline Massifs (e.g. Buxtorf 1916, Laubscher 1961, Burkhard 1990, Ortner et al. 2024). Low strength Triassic evaporites acted as a décollement horizon facilitating the formation of a narrow taper as observed in the Jura Fold-and-Thrust Belt (e.g. Mosar 1999). Folding and thrusting in the Jura mountains 50 – 80 km north of the front of the Alpine nappes is inferred to have started in the Middle Miocene (Fig. 4‑74; Becker 2000, Looser et al. 2021, Smeraglia et al. 2021). Stratigraphic evidence from mammalian fauna place onset of Jura folding and thrusting at about 12 Ma (Becker 2000). Tectonic activity along the décollement (i.e. thin-skinned) is estimated from U-Pb calcite dating to 14.3 to 4.5 Ma in the Schafisheim borehole located south of the Internal Jura (Looser et al. 2021). Dating of regional fault zones in Northern Switzerland confirmed this age range and specifies that the main thin-skinned structures were established at 8 Ma (Fig. 4‑74; Madritsch et al. 2024). For instance, the Mandach Thrust, the Siggenthal Anticline and the Jura Main Thrust in JO and the Lägern Anticline in NL are associated with décollement-related (i.e. thin-skinned) deformation (Section 4.3.4).
Shortening north of the Subalpine Molasse generally decreases eastwards in the central North Alpine Foreland (e.g. Ortner et al. 2024 and references therein). This is also seen in the shortening estimates decreasing from JO to NL and in general from the shortening around 25 – 30 km in Central Jura and the maximum 5 km shortening estimated in JO (Fig. 4‑74; Burkhard 1990, Jordan et al. 2015). The eastward decrease of shortening and finally the change from allochthonous to autochthonous sedimentary rocks in the North Alpine Foreland can be associated with the strength of the décollement, where the thin-skinned salient of the Jura Mountains is associated with the distribution of evaporites.
As described by Madritsch et al. (2024), no clear trend of in-sequence or out-of-sequence thrusting can be deduced from the dense age data for the deformation sequence in the External Jura in Northern Switzerland (Fig. 4‑74). This is expected for a growing wedge, as it maintains its critical taper geometry (e.g. Willett 1999, Buiter 2012, Caër et al. 2018).
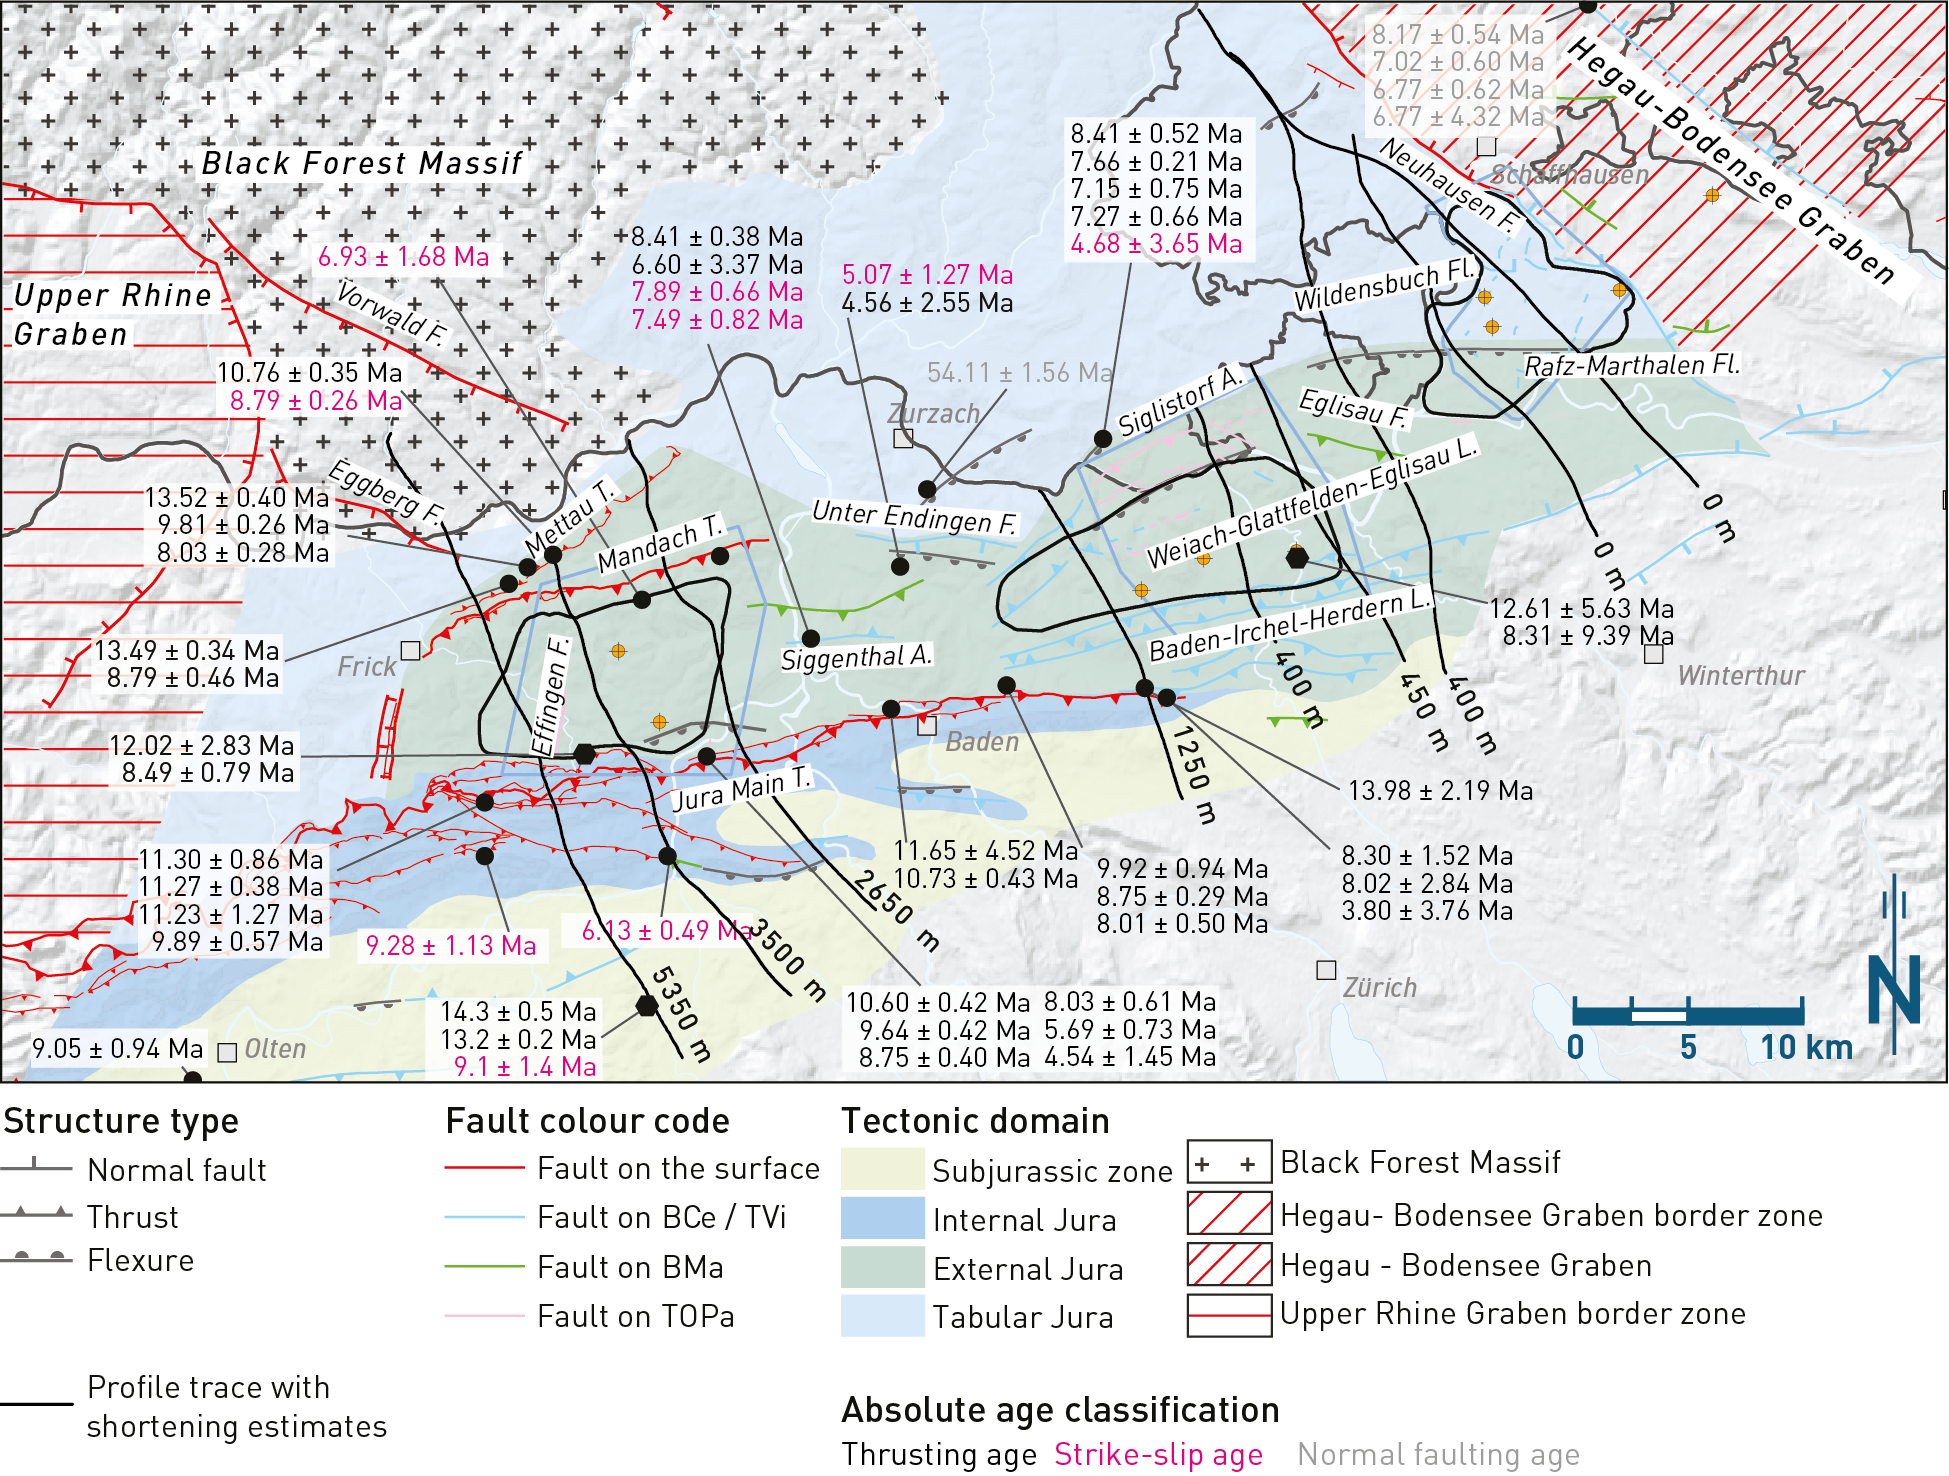
Fig. 4‑74:Simplified tectonic map of Northern Switzerland showing absolute ages obtained from veins sampled in outcrops and drill cores and shortening estimates
Surface fault traces based on Nagra (2014b). Fault traces from seismic interpretation are based on 2D seismic reflection (Madritsch et al. 2013, Meier et al. 2014) and 3D seismic reflection interpretation (Birkhäuser et al. 2001 (Nagra 2024a, 2024b, 2024c). They are shown on the highest stratigraphic horizon where the specific fault segment was picked (different colours in the map view). Only horizons from Top Opalinus Clay and higher stratigraphic levels are shown. Note that only a selection of the structures from 3D seismic interpretation is shown to highlight the structural trends of regional importance. See Fig. 4‑61, Fig. 4‑65 and Fig. 4‑69 for the complete fault pattern. Absolute ages are from Madritsch et al. (2024) and Looser et al. (2021). Colour coding indicates the kinematic association of the sampled veins. Profile traces with shortening estimates are taken from Jordan et al. (2015) and refer to shortening estimates from kinematic 2D balancing.
The Hegau – Bodensee Graben also initiated during the Early Miocene with a period of transtension (Ibele 2015 and references therein). This was followed by a main phase of strike-slip tectonism in the Late Miocene to Pliocene (Schreiner 1992, Hofmann et al. 2000, Egli et al. 2017). U-Pb age dating of calcite showed that the Randen Fault, which is part of the Hegau – Bodensee Graben, was active at the same time as the main phase of the Jura folding and thrusting (Fig. 4‑74; Madritsch et al. 2024).
Continuing lithospheric flexure during the Late Miocene (e.g. Kuhlemann & Kempf 2002, Ford et al. 2006) led to a second interval of burial of the Mesozoic formations accompanying deposition in the Molasse Basin. Maximum burial temperatures during the Miocene decreased with increasing distance from the Alpine front, which is associated with the thinning of the Molasse sedimentary wedge towards the north (e.g. Pfiffner 1986, Kuhlemann & Kempf 2002). This second interval of burial is documented in calcite cements by a temperature increase starting at ~ 20 Ma and resulting in peak burial temperatures between 10 and 5 Ma, in broad agreement with the timing suggested by previous thermochronological data (Mazurek et al. 2006, Villagómez Díaz et al. 2021) and in agreement with the maximum age for the cessation of Molasse sedimentation of ~ 11.5 Ma in Northern Switzerland (Rahn & Selbekk 2007). Peak temperatures in the Malm Group ranged between 50 – 80 °C and are thus in broad agreement with previous estimates (Fig. 4‑73; Mazurek et al. 2006).
The southward rise in temperature and the development of the Jura Fold-and-Thrust Belt, which led to localised surface uplift along thrusts and consequently the creation of new fluid migration pathways, caused local variations in the temperature and oxygen isotopic composition of calcite cements. This is reflected by calcite veins formed coevally between 10 and 8 Ma in the Malm Group at different locations that show large variability in Δ47 temperatures and the evolution of δ18Ofluid. After relatively uniform compositions until 15 Ma, both Δ47 temperatures and δ18Ofluid data show diverging trends contemporaneously with the formation of the Jura Fold-and-Thrust Belt (Fig. 4‑73).
Evolution during the Pliocene
During Pliocene times, the Alpine deformation front continued propagating northwestwards, reaching into the Plateau Jura (Schlunegger & Mosar 2011). The major thin-skinned deformation phase of the Jura Fold-and-Thrust Belt (i.e. Miocene evolution) has been followed by a thin- and thick-skinned deformation at low strain rates until the present day (e.g. Philippe et al. 1996, Pfiffner et al. 1997, Mosar 1999, Giamboni et al. 2004, Ustaszewski & Schmid 2007, Madritsch et al. 2008, Schlunegger & Mosar 2011, Lacombe & Bellahsen 2016, Caër et al. 2023). Deformation involving the substratum below Middle Triassic décollement level is corroborated by interpretations from the recent 3D seismic reflection database (Section 4.3.4, Fig. 4‑66; Zambrano et al. submitted). For instance, the Weiach – Glattfelden – Eglisau Lineament roots in the Paleozoic strata but cuts through the décollement horizon and a footwall shortcut (i.e. thrusting cutting through the fault’s footwall) affecting the Paleozoic basement underneath the Mandach are evidence for the substratum involvement (Section 4.3.4). Caër et al. (2023) proposed lateral changes in deformation style along the Jura arc as the basement-involving deformation front follows the Alpine Front which has a different shape than the Jura arc. This results in deformation involving the basement in the eastern Jura Fold-and-Thrust Belt.
Miocene burial was followed by exhumation resulting in the present-day setting. The youngest preserved sedimentary rocks in Northern Switzerland are Upper Freshwater Molasse sedimentary rocks dated to 11.5 Ma and thus constrain the initiation of net erosion in the Molasse Basin (Rahn & Selbekk 2007). Based on existing data von Hagke et al. (2015) showed that exhumation may have commenced sometime between about 12 and 4 Ma and heat flux probably increased over time. Numerous studies propose onset of large-scale foreland exhumation to occur between 6 and 4.5 Ma (Kuhlemann & Kempf 2002, Cederbom et al. 2004, 2011, Schlunegger & Mosar 2011, von Hagke et al. 2014, Looser et al. 2021). Reported Δ47/(U-Pb) data from calcite cements of the Siggenthal Anticline and STA2 record cooling from 63 to 25 °C between 5.0 and 2.5 Ma (Fig. 4‑73) agreeing with the aforementioned estimates. This in turn is in agreement with rapid incision pulse triggered by capture of the former Aare-Danube River by the Rhone-Doubs system at 4.2 – 2.9 Ma with incision of 300 – 500 m in the lower Aare Valley (Chapter 3, Fig. 3‑11). The recorded 25 °C at 2.5 Ma suggests a remaining sedimentary overburden, in agreement with incision of another 100 – 200 m during the Pleistocene as recorded by gravel deposits in the lower Aare Valley (Chapter 3, Fig. 3‑11).
Quaternary tectonic activity
Tectonic deformation within the Quaternary has been postulated for Northern Switzerland. The present-day seismicity suggests that deformation in the North Alpine Foreland is ongoing (Kastrup et al. 2004, Lanza et al. 2022, Diehl et al. 2023). The inversion of focal mechanisms implies a strike-slip to normal faulting tectonic regime for the majority of the North Alpine Foreland. Indications for contraction to oblique contraction related seismicity are rare and restricted to the northwestern front of the Jura Mountains, where there is also geomorphic evidence for ongoing folding (Nivière & Winter 2000, Madritsch et al. 2010, Lanza et al. 2022). In addition, two samples provide U-Th ages within the Quaternary (Fig. 4‑73). The sample from the Villigen Formation (0.41 ± 0.01 Ma) was obtained from a slickenfibre indicating strike-slip faulting in TRU1. The other sample documents Quaternary fluid flow but is not related to tectonic activity. Further, discussion of the present-day tectonic activity (including vertical and horizontal velocities) is provided in Section 6.2 and in Nagra (2024l).
This section is dedicated to summarising key factors that influenced the present-day structural inventory. It focuses first on the encountered deformation style (i.e. influence of Paleozoic faults and mechanical stratigraphy) and then on the impact of the tectonic domains surrounding the siting regions on the structural inventory within the siting regions.
Influence of Paleozoic fault inventory on later deformation
The importance of geometric steps affecting the Base Mesozoic unconformity for subsequent deformation has been previously proposed for the Jura Fold-and-Thrust Belt (e.g. Laubscher 1961, Homberg et al. 2002, Schori et al. 2021, Schori 2021. The pre-Mesozoic tectonic evolution resulted in the formation of three distinct fault orientations (Hercynian or NW-SE-trending, Rhenish or NNW-SSW-trending, and Erzgebirgian or ENE-WSW-trending, Fig. 4‑55). These faults have acted as zones of weakness within the less deformed surrounding rock volume and were repeatedly reactivated throughout the tectonic evolution of Northern Switzerland (Section 4.3.5). Comparison of fault traces at various stratigraphic levels as performed by Schöpfer et al. (2024) indicates a strong control of these orientations on deformation in the sedimentary cover. In JO and NL, regional fault zones, with exception of the Siggenthal Anticline, are located above structures related to the Konstanz – Frick Trough (ENE-WSW-trending). This spatial coincidence calls for being consequential rather than coincidental. For NL, Butler et al. (submitted) investigated the influence of the basement topography and highlighted differences between the eastern and western segment of the Baden – Irchel – Herdern Lineament within the 3D seismic perimeter that could be associated with differences in the underlying Paleozoic fault geometry. Other examples of faults in the Mesozoic sedimentary cover with a typical Paleozoic orientation are the Neuhausen Fault, the Eglisau Fault and the Zweidlen Fault (NW-SE-trending). The Effingen Fault and the Trüllikon Fault and the Rheinau Fault are examples of faults trending NNE-SSW (Rhenish trend).
The influence of step morphology in the Base Mesozoic unconformity is further testified by a comparison between the Mandach Thrust and the Siglistorf Anticline. The Mandach Thrust is expressed throughout the Mesozoic succession as a rather narrow deformation zone. In contrast, deformation in the Mesozoic strata overlying the northern border of the Konstanz – Frick Trough in NL affects a broader zone. This marked difference is probably linked to the pronounced, single Paleozoic normal fault underlying the Mandach Thrust, whereas the Siglistorf Anticline is underlain by various smaller and more distributed Paleozoic faults (Nagra 2024a, 2024b).
The aforementioned examples from seismic reflection data interpretation provide supporting evidence for the proposed influence of the Upper Paleozoic trough and its fault pattern on the localisation of later deformation.
Mechanical stratigraphy and décollement horizons
In addition to the aforementioned stepped geometry of the Base Mesozoic unconformity, the variable mechanical properties of the Mesozoic strata also strongly influenced strain accommodation in Northern Switzerland. The overall stratigraphic column was introduced in Chapter 3 and Section 4.2. It is characterised by strong contrasts in the mechanical competence between the different units, with for instance the carbonates of the Malm Group and the Muschelkalk Group representing competent units and the clay-mineral-rich Opalinus Clay representing a less competent unit. The detailed geomechanical properties are reported in Sections 4.4 and 5.5 focusing on the Opalinus Clay. The mechanical competence contrast among different formations, also termed mechanical stratigraphy, is reflected in the fracture frequency distribution (Section 4.3.4), but also in the stress field characteristics (Section 4.4).
Two key observations in Northern Switzerland with respect to the understanding of the tectonic evolution are related to the mechanical stratigraphy. Firstly, the mechanical stratigraphy influences the fault architecture in the different units. In general, faults in Northern Switzerland appear highly segmented not only in map view, but also in vertical sections (Section 4.3.4). For instance, the surface expression of the Mandach Thrust varies along strike, being influenced by the mechanical stratigraphy and local changes in the stepped geometry of the Base Mesozoic unconformity (Malz et al. 2020). The mechanically less competent, clay-mineral-rich units are characterised by an even higher fault segmentation, with soft-linkage and fault relay zones (Roche et al. 2020, Zwaan et al. 2022). Fault architecture of these units is further detailed in Section 5.5.4.
Secondly, the typical stratigraphic column in Northern Switzerland contains multiple horizons that could act mechanically as décollement levels (e.g. Marro et al. 2023, for a recent compilation for the western Jura). Décollement level refers to the observation that the total strain accommodated above it differs from that below it. The evaporites in the Zeglingen Formation and in the Bänkerjoch Formation are considered as main décollement for the Jura Fold-and-Thrust Belt (e.g. Sommaruga et al. 2017). Additionally, the Opalinus Clay has also been proposed as a subsidiary décollement level (Matter et al. 1987, Marro et al. 2023). The detailed fault pattern observed in the Baden – Irchel – Herdern Lineament (Fig. 4‑67) requires an interval around the Opalinus Clay capable of decoupling the mechanical panel above from that below it (Laubscher 1985, Malz et al. 2016, Nagra 2024b). However, the competent panels above and below the incompetent Opalinus Clay, although independently folded in the Baden – Irchel – Herdern triangle zone in NL, are characterised by similar amounts of deformation. Therefore, at least in the siting regions, the Opalinus Clay did not allow the rock panel overlying it to be transported forelandward more than the rock panel underlying it. Also the overall degree of tectonic deformation observed within the Opalinus Clay in the boreholes within the siting regions shows that it was not acting as a secondary décollement north of the Baden – Irchel – Herdern Lineament (Section 5.5 and fracture frequency distribution in Fig. 4‑61, Fig. 4‑65, Fig. 4‑69).
As mentioned above, the evaporites in the Zeglingen Formation are considered as décollement level in the eastern Jura Fold-and-Thrust Belt. The halite intervals encountered in the recent deep boreholes vary substantially in vertical thickness (Fig. 4‑2). While the halite thickness reaches only 1.4 m in BOZ1, several decameter-thick halite deposits have been drilled in the central part of NL. In general, the halite is only slightly deformed with minor horizons of intense deformation (i.e. shear zones). Shortening estimates from the halite intervals are in broad agreement with the shortening estimates for the area north of the boreholes (distal with respect to the source of deformation, i.e. the Alps) based on balanced and restored cross-sections (Jordan et al. 2015). The halite interval in BOZ1 is more strongly deformed along with a generally more deformed Triassic evaporitic sequence than in NL (Madritsch et al. 2024; TBO reports in Tab. 2‑1). It is concluded that the Triassic evaporites encountered in the boreholes in the External Jura provide evidence for a décollement particularly in JO but also in NL. This observation based on the borehole records is well aligned with the proposed fault geometry from seismic reflection interpretation for the Siglistorf Anticline and the Mandach Thrust (Section 4.3.4).
Tectonic domains in Northern Switzerland
As introduced in Chapter 3 and detailed in the sections above, Northern Switzerland is at the interplay of the Konstanz – Frick Trough, the Jura Fold-and-Thrust Belt, the Hegau – Bodensee Graben and the Upper Rhine Graben. The following section is dedicated to illustrating the influence of these tectonic domains onto the structural inventory of the siting regions.
Paleogene to Early Neogene normal faulting in response to the uplift of the Black Forest related to the opening of the Upper Rhine Graben, the northward migration of the Alpine flexural forebulge and the lithospheric flexural bending in response to the Alpine orogeny affected Northern Switzerland (Section 4.3.5). This is recorded inter alia by (i) the general south dip of the Mesozoic strata; (ii) the net normal offset observed within Mesozoic strata along the eastern segment of the Baden – Irchel – Herdern Lineament; and (iii) the bending of the Mesozoic strata south of the Mandach Thrust, which is clearly related to a post-Mesozoic but pre-thrusting extensional reactivation of the master fault bounding the Konstanz – Frick Trough to the north. The occurrence of shear sense indicators indicative for normal faulting in the boreholes can be considered as additional evidence for this deformation stage (Fig. 4‑75).
The contractional deformation related to folding and thrusting associated with the Jura Fold-and-Thrust Belt is depicted foremost in surface topography. Its decrease towards the east is shown by the decreasing shortening estimates along 2D geological profiles across Northern Switzerland (Fig. 4‑75; Jordan et al. 2015). In addition, the relative abundance of reverse faulting shear sense indicators in the boreholes in JO and NL is also considered as evidence of the contraction-dominated deformation affecting the siting regions. The overall higher frequency of subseismic fracturing in the boreholes in JO (BOZ2, BOZ1) compared to the other boreholes is probably related to the stronger contractional overprint due to its more internal position with respect to the central Jura. The occurrence of the seismically mappable "Brugg Strukturzone", expressed in the Muschelkalk Group in the vicinity of BOZ1, could also influenced the subseismic fault density encountered along the entire borehole.
The Neuhausen Fault, marking the northeastern border of ZNO (Fig. 4‑75), is linked to the Hegau – Bodensee Graben. The oblique extension of the Hegau – Bodensee Graben probably resulted in the formation of high-angle faults in ZNO. It could further be the cause for the increased amount of normal faulting observed in the drill cores in ZNO compared to JO and NL (Fig. 4‑75).
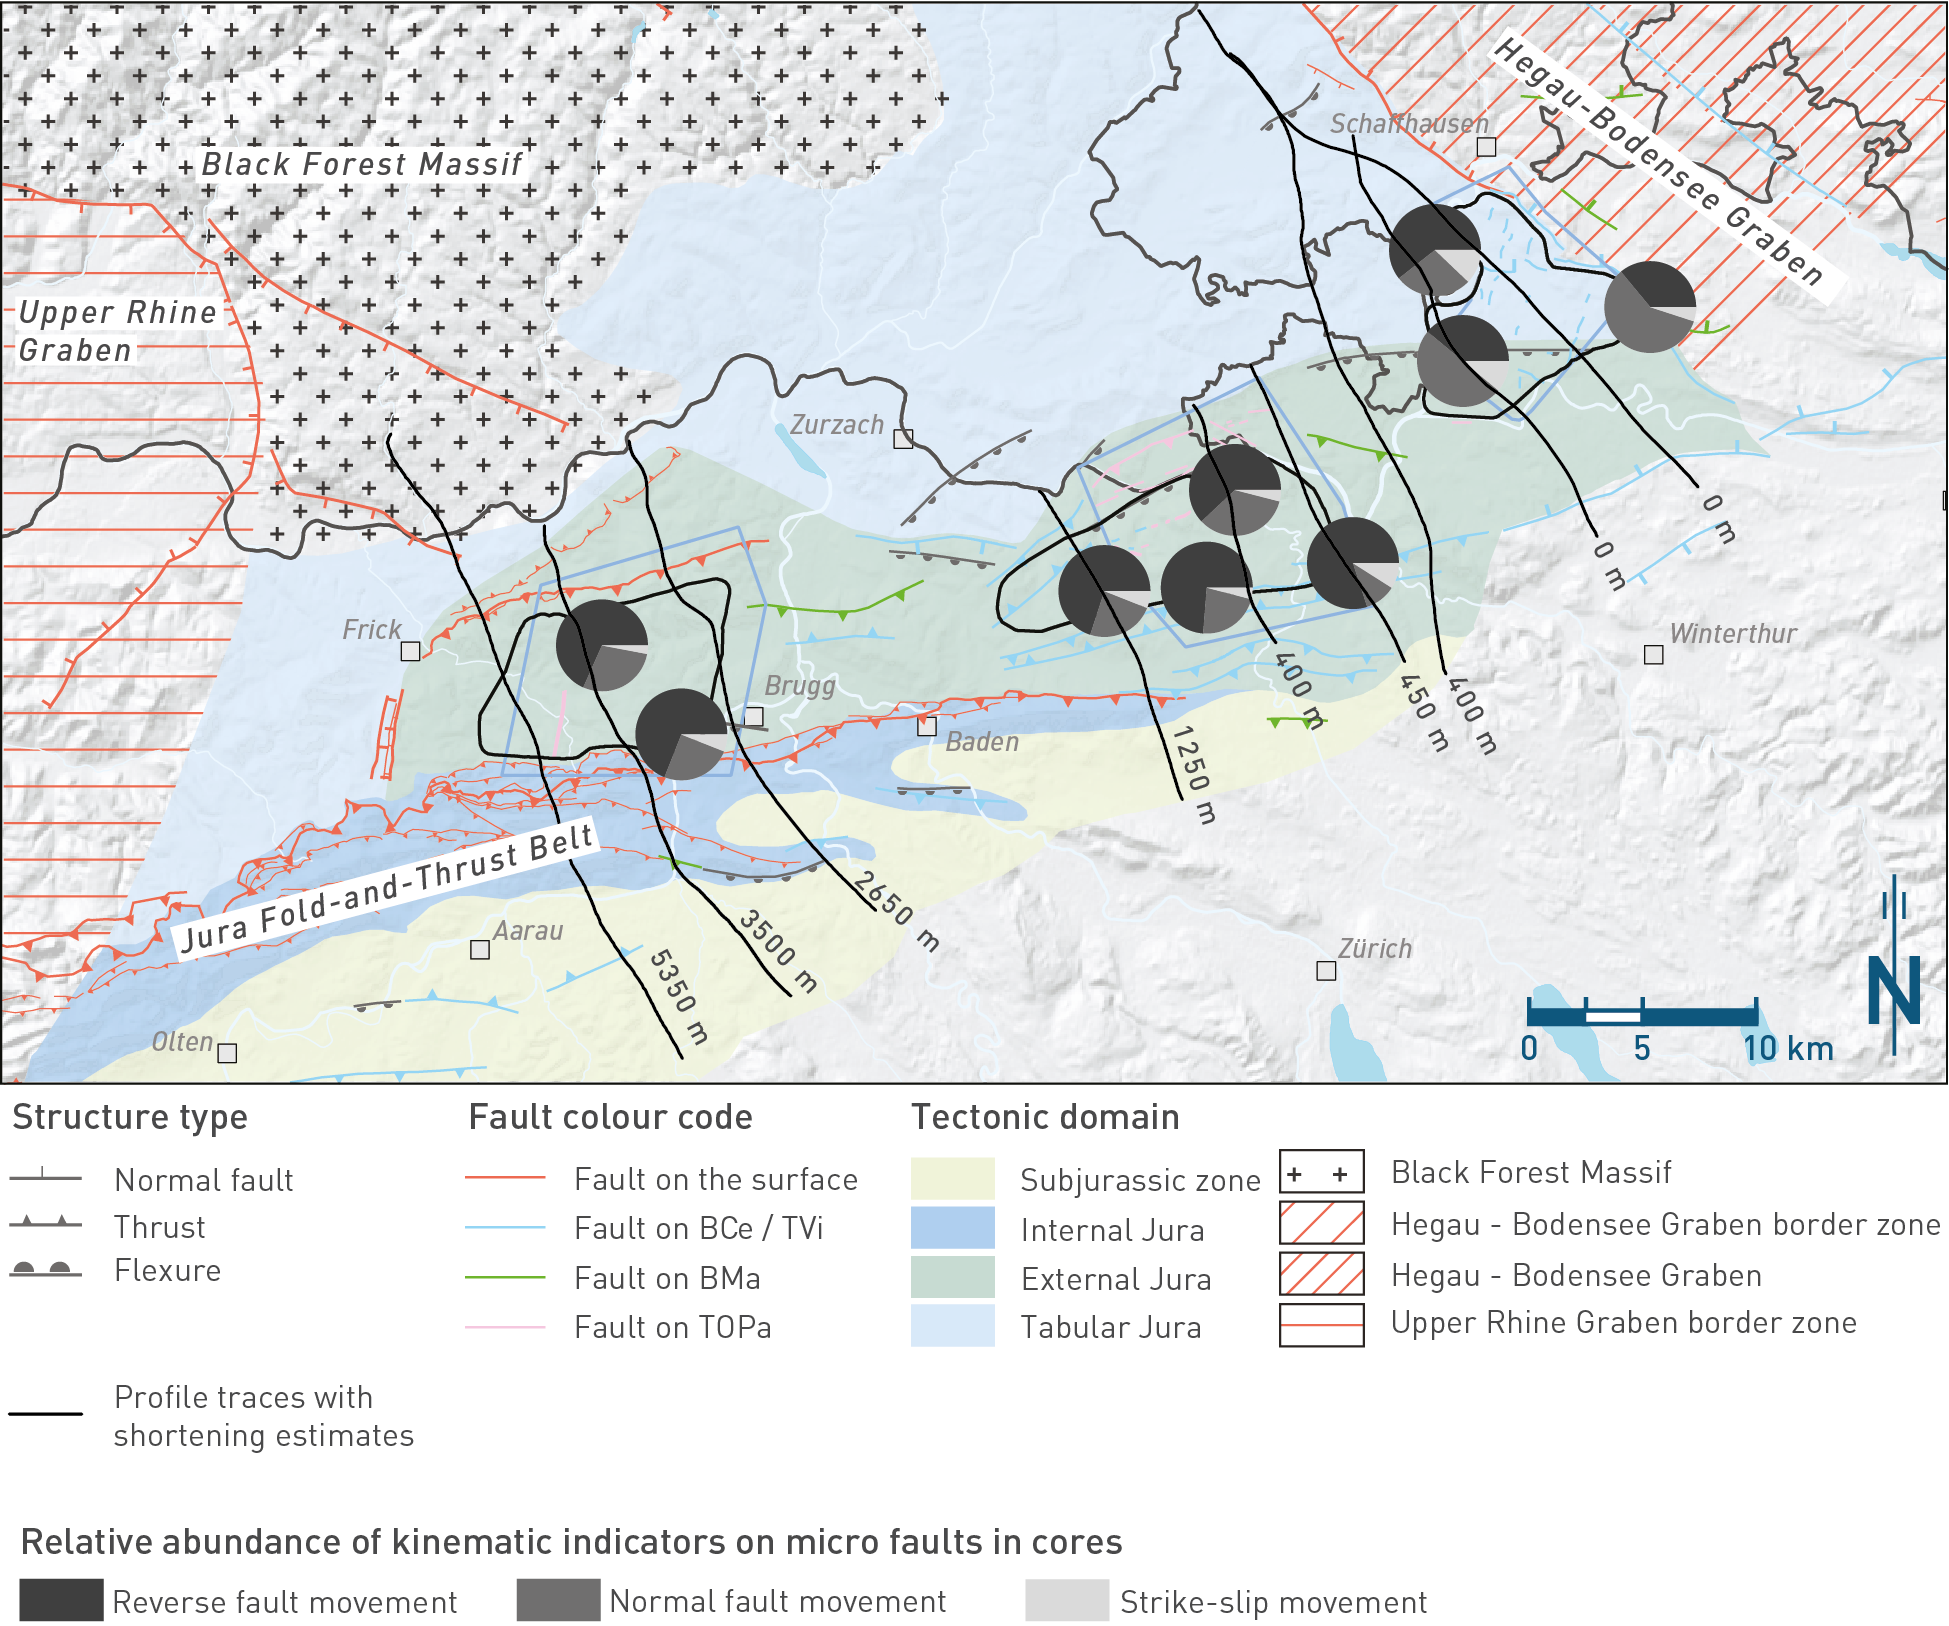
Fig. 4‑75:Tectonic map of Northern Switzerland showing the influence of the neighbouring tectonic domains
Surface fault traces based on Nagra (2014b). Fault traces from seismic interpretation are based on 2D seismic reflection (Madritsch et al. 2013, Meier et al. 2014) and 3D seismic reflection interpretation (Birkhäuser et al. 2001, Nagra 2024a, 2024b, 2024c). They are shown on the highest stratigraphic horizon where the specific fault segment was picked (different colours in the map view). Only horizons from Top Opalinus Clay and higher stratigraphic levels are shown. Note that only a selection of the structures from 3D seismic interpretation is shown to highlight the structural trends of regional importance. See Fig. 4‑61, Fig. 4‑65 and Fig. 4‑69 for the complete fault pattern. The shortening estimates were calculated based on geometric 2D section restoration along 2D seismic reflection lines documented in Jordan et al. (2015). The pie charts show the relative abundance of shear sense indicators observed in the full cored sections. Micro faults with undefined shear sense are not displayed. The charts show the influence of the Jura Fold-and-Thrust belt with a predominance of reverse faulting or thrusting in JO and NL, the influence of the transtensional activity in the Hegau – Bodensee Graben with an increased portion of normal faulting in ZNO as well as the Paleogene extension related to the migration of the Alpine forebulge.
All three siting regions show areas devoid of seismically mappable faults that are bounded by well-defined deformed areas (i.e. seismically mappable faults and folded domains). In NL, the area free of seismically mappable faults is largest.
The tectonic history of Northern Switzerland is influenced by the evolution of the Jura Fold-and-Thrust Belt, the Hegau – Bodensee Graben and the Upper Rhine Graben. The influence on the structural inventory of each tectonic domain decreases with distance from it as demonstrated for instance by the decreasing eastward shortening related to the Jura Fold-and-Thrust Belt.
The basement underlying Northern Switzerland is pre-structured with (i) the Upper Paleozoic Konstanz – Frick Trough (controlled by ENE-WSW-trending faults), (ii) Hercynian faults (NW-SE-trending), and (iii) Rhenish faults (NNE-SSW-trending). The geological past provided numerous evidence that these inherited structures exerted a strong control on the localisation of later tectonic deformation.
Observations made at multiple scales (seismic interpretation, macroscopic and microscopic core description) provide evidence that inherited structures acted as zones of weakness within the less deformed rock volume, localising later strain (i.e. by fault reactivation).
Fracture distribution testifies to the control of mechanical layering: higher fracture frequencies characterise the mechanically competent units (Malm and Muschelkalk Groups), whereas lower fracture frequencies are observed in the less competent units (Opalinus Clay, Lias Group).
In all three siting regions, no evidence for a secondary décollement within the Opalinus Clay was found.
Geodynamically, Northern Switzerland evolved from a first burial to exhumation resulting in terrestrial conditions in the Eocene. The incorporation of Northern Switzerland into the flexural foreland basin of the Alps resulted in a second burial. With the NW-propagation of the Alpine deformation front and the formation of the Jura Fold-and-Thrust Belt, Northern Switzerland evolved towards a wedge-top basin. ZNO, north of the Rafz – Marthalen Flexure (i.e. in the part considered as autochthonous), remained part of the flexural foreland basin. Neogene exhumation resulted in the present-day situation.
Detailed temperature data gained from the analysis of calcite cements provide evidence for locally higher temperatures and thermal gradients than previously estimated for the Mesozoic evolution. Final cooling after burial beneath the Molasse sedimentary rocks is suggested to have occurred essentially after 5 Ma.
Key points:
- The dominant azimuth of the maximum horizontal stress magnitude (SHmax) is oriented NNW-SSE. This orientation is consistent in all the siting regions in the Mesozoic sediments and the pre-Mesozoic basement rocks.
- Characteristics of the stress field are similar in all three siting regions, with depth and mechanical layering coupled to tectonic loading controlling stress magnitudes.
- Tectonic loading has led to higher stress magnitudes in more competent calcareous layers and can explain why tectonic overprint in these layers is often more pronounced than in the weaker clay-mineral-rich layers.
- In the three siting regions the spatial characteristics of the present-day stress field can be predicted with geomechanical-numerical models with the same degree of reliability.
- The Opalinus Clay exhibits very consistent gradients of the stress magnitudes, irrespective of the siting region considered. Minor differences in the stress regime (i.e. ratios of horizontal to vertical stress) between regions arise mainly from the different depths of the Opalinus Clay.
The stress field is an important state variable and exerts strong control on the mechanical behaviour and stability of the rock mass. For a deep geological repository, the quantification of the undisturbed present-day stress field is relevant for both short-term (construction of underground and access structures) and the long-term (thermal stresses and gas migration) considerations.
Here it is assumed that the vertical stress Sv = g · ρ · z is a principal stress (g = gravitational acceleration, ρ= rock bulk density, z = depth). Based on this assumption, the maximum and minimum horizontal stresses, SHmax and SHmin, respectively, are also principal stresses. This simplified stress tensor has only four unknowns: the orientation of SHmax and the magnitudes of SHmin, SHmax and Sv (Nagra 2024o).
In Northern Switzerland, the assumption that the vertical stress Sv is a principal stress is reasonable and can be demonstrated by 3D geomechanical-numerical models (Nagra 2024o). The minimum principal stress (SHmin) was measured by means of microhydraulic fracturing (MHF) tests, and the maximum horizontal stress (SHmax) was derived from sleeve reopening (SR) tests. The detailed evaluation and assignment to stress magnitudes are explained in Nagra (2024o).
This section summarises the key results of the 3D stress tensor description in the various regions. It focuses first on stress data of the SHmax orientation (Section 4.4.1) and secondly on stress magnitude estimates (Section 4.4.2). Section 4.4.3 illustrates the results of geomechanical-numerical models that integrate all rock property and stress data for a continuous description of the stress state in 3D, before concluding with the main insights (Section 4.4.4). A detailed overview and evaluation of stress data and model results are provided in Nagra (2024o). The quantification of the ambient stress field is also of direct importance for other aspects covered in this report, in particular for the robust self-sealing of the Opalinus Clay (Section 5.7) and scenarios of future tectonic evolution (Section 6.2).
The prevailing orientation of SHmax in the siting regions was constrained by new borehole data using the orientation of borehole breakouts, drilling-induced tensile fractures and fractures generated as a result of MHF testing (Section 4.4.3). The results (Fig. 4‑76) are very much consistent with those predating the new boreholes (Heidbach & Reinecker 2013):
-
SHmax trends in a NNW-SSE orientation, with a small counter-clockwise rotation of SHmax from east to west. The mean SHmax orientation based on the borehole data is 172 ± 9.3° (ZNO), 166 ± 10.8° (NL) and 163 ± 7.6° (JO) (Fig. 4‑76), indicating that SHmax is approximately perpendicular to the arc-shaped Jura Fold-and-Thrust Belt.
-
The dominant SHmax orientation is also stable in the vertical direction, i.e. orientations derived from boreholes (to a depth of 1.3 km) are in general agreement with SHmax orientations derived from earthquake focal mechanisms at much greater depths (up to 30 km; Nagra 2024o).
-
In individual boreholes, the SHmax orientation is relatively stable across the Mesozoic sediments, and across the Opalinus Clay in particular. The few exceptions presenting local variations of SHmax orientations are discussed in Nagra (2024o).
-
A comparison with palaeo-strain data (Madritsch & Hammer 2012) indicates broad consistency of the SHmax orientation with deformation features since Miocene times.
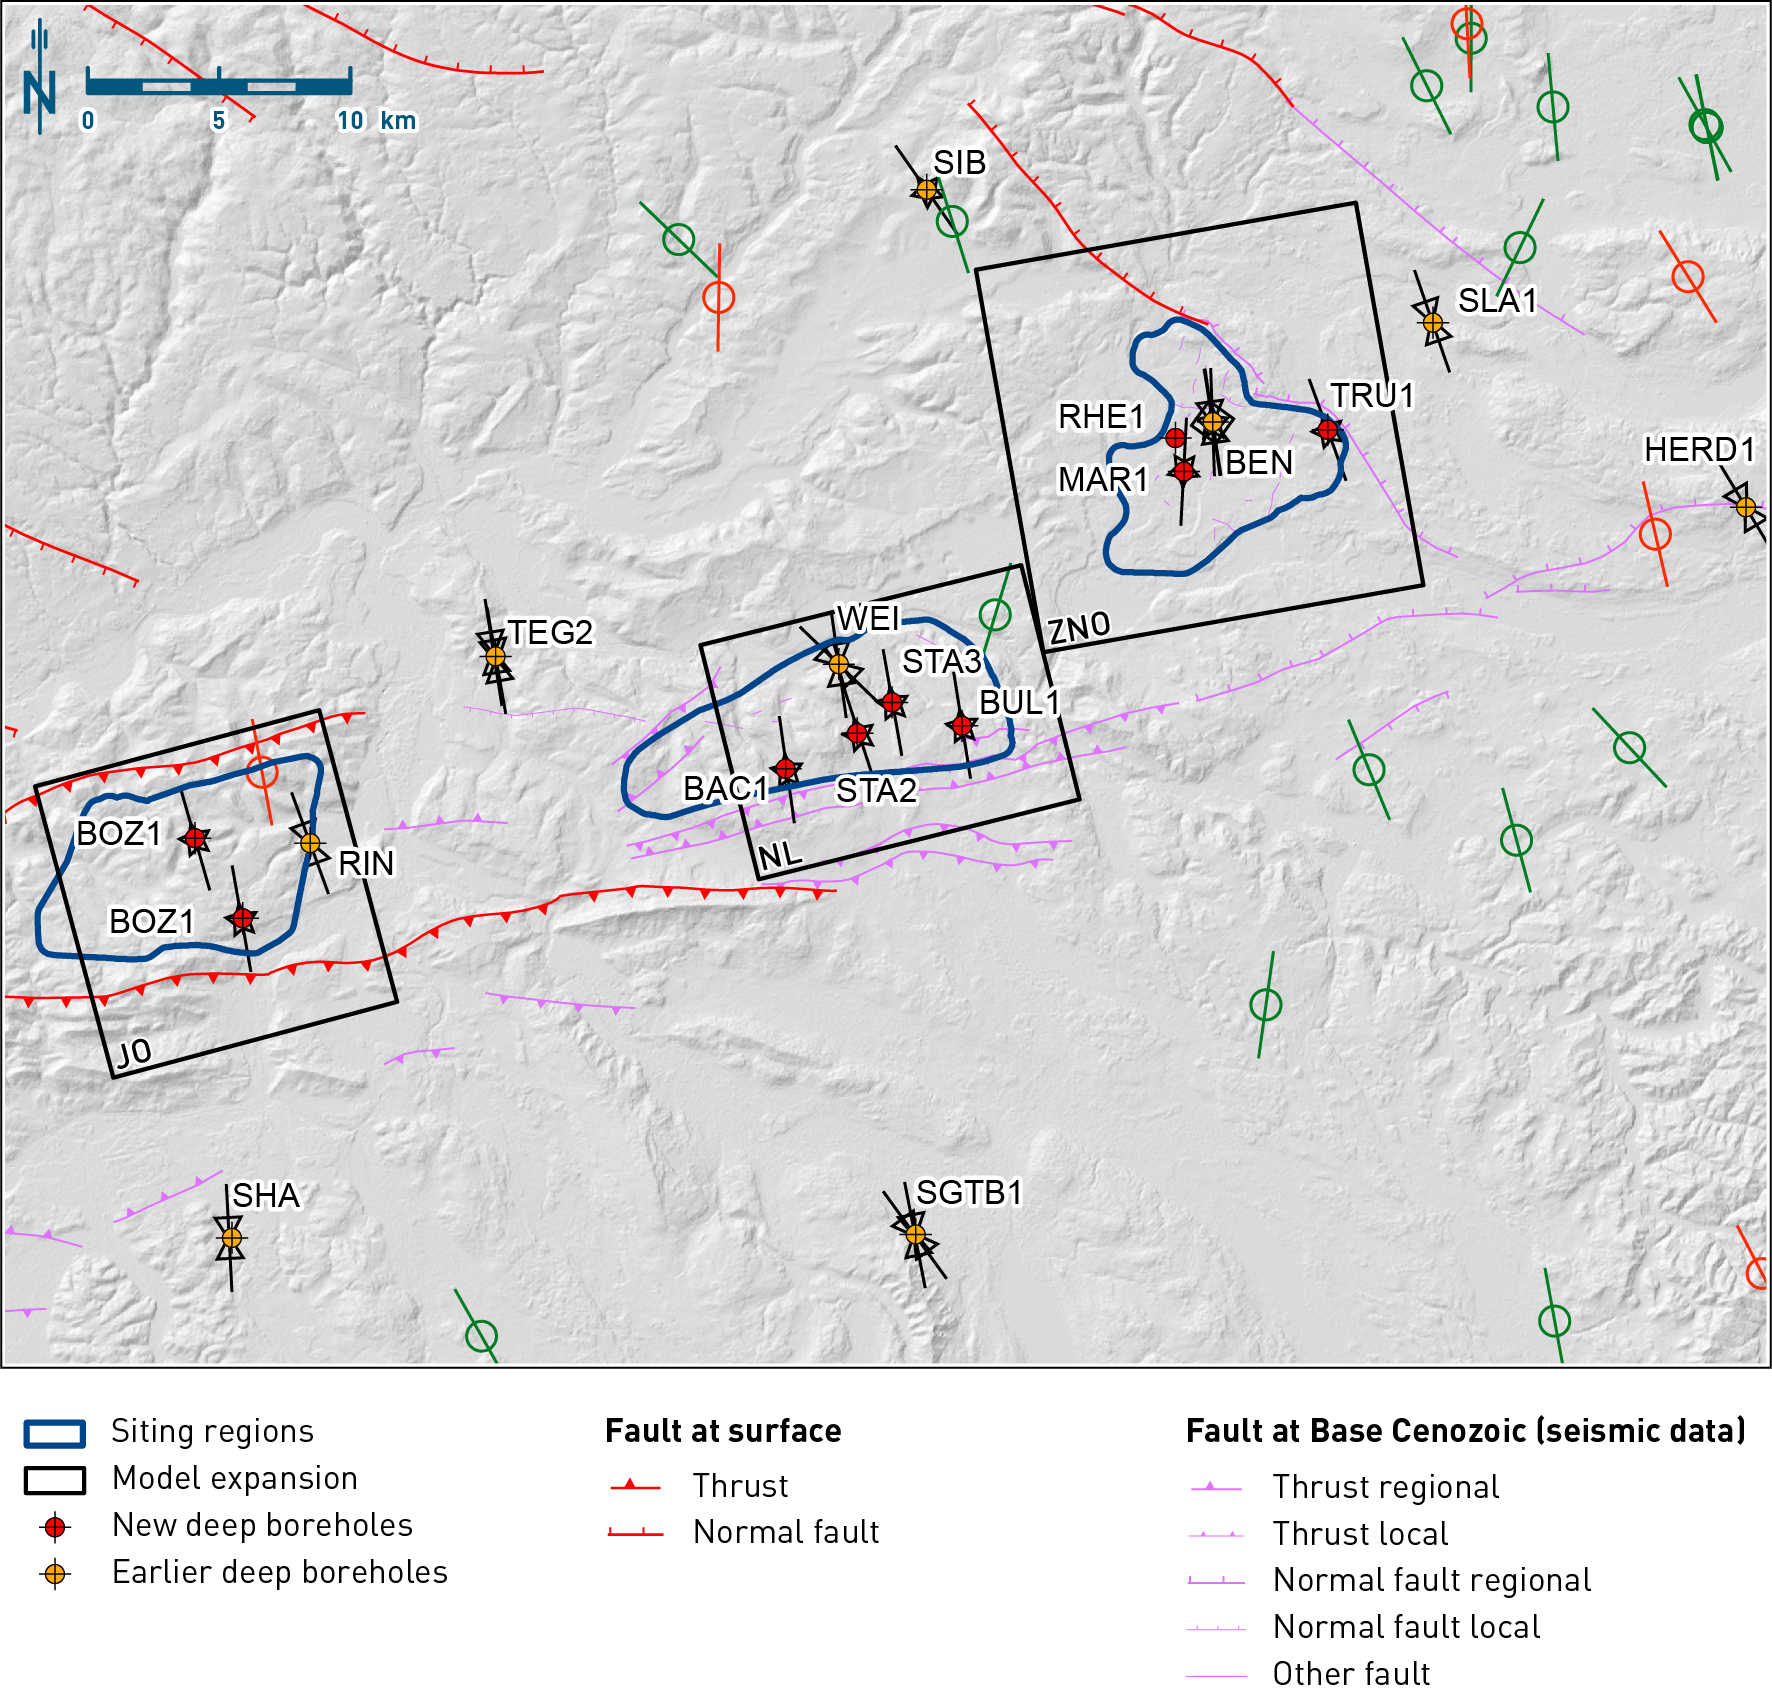
Fig. 4‑76:Orientation of maximum horizontal stress SHmax in the siting regions
Black lines indicate SHma orientations derived from borehole data. Red lines (normal faulting stress regime) and green lines (strike-slip stress regime) indicate SHmax orientations derived from earthquake focal mechanisms. Black squares indicate the extent of site-specific 3D geomechanical-numerical models. Note that only a selection of the structures from the 3D seismic interpretation on Top Villigen Formation were projected to Base Cenozoic and are shown to highlight the structural trends of regional importance.
The vertical stress Sv is estimated by integrating the bulk density of the drilled formations. Microhydraulic fracturing (MHF) tests were performed in vertical boreholes to provide quantitative information on the SHmin magnitude, and in a few cases also served to independently verify values of Sv from logs (Nagra 2024o). In comparison to previous stress testing campaigns (e.g. Nagra 2001), dry sleeve reopening (SR) tests on previously induced fractures were also performed to derive values of the SHmax magnitudes (Nagra 2024o for details).
From the 139 successful MHF tests in eight of the nine new boreholes and the following SR tests, 121 reliable SHmin magnitudes and 65 reliable SHmax magnitudes were estimated. In addition to the new tests, two measurements from the Benken borehole were also re-analysed (Nagra 2024o). This unique dataset from the three siting regions has increased the number of stress magnitude data by an order of magnitude since 2019 (Fig. 2‑3).
A representative example of the stress data obtained is shown for the STA3 borehole in Fig. 4‑77. The figure shows that values of SHmin are close to values for Sv in the shallow subsurface but become increasingly lower than Sv with greater depth. Similarly, SHmax values are greater than Sv closer to the surface while becoming lower than Sv as depth increases. This can be explained by topographic effects (Nagra 2024o).
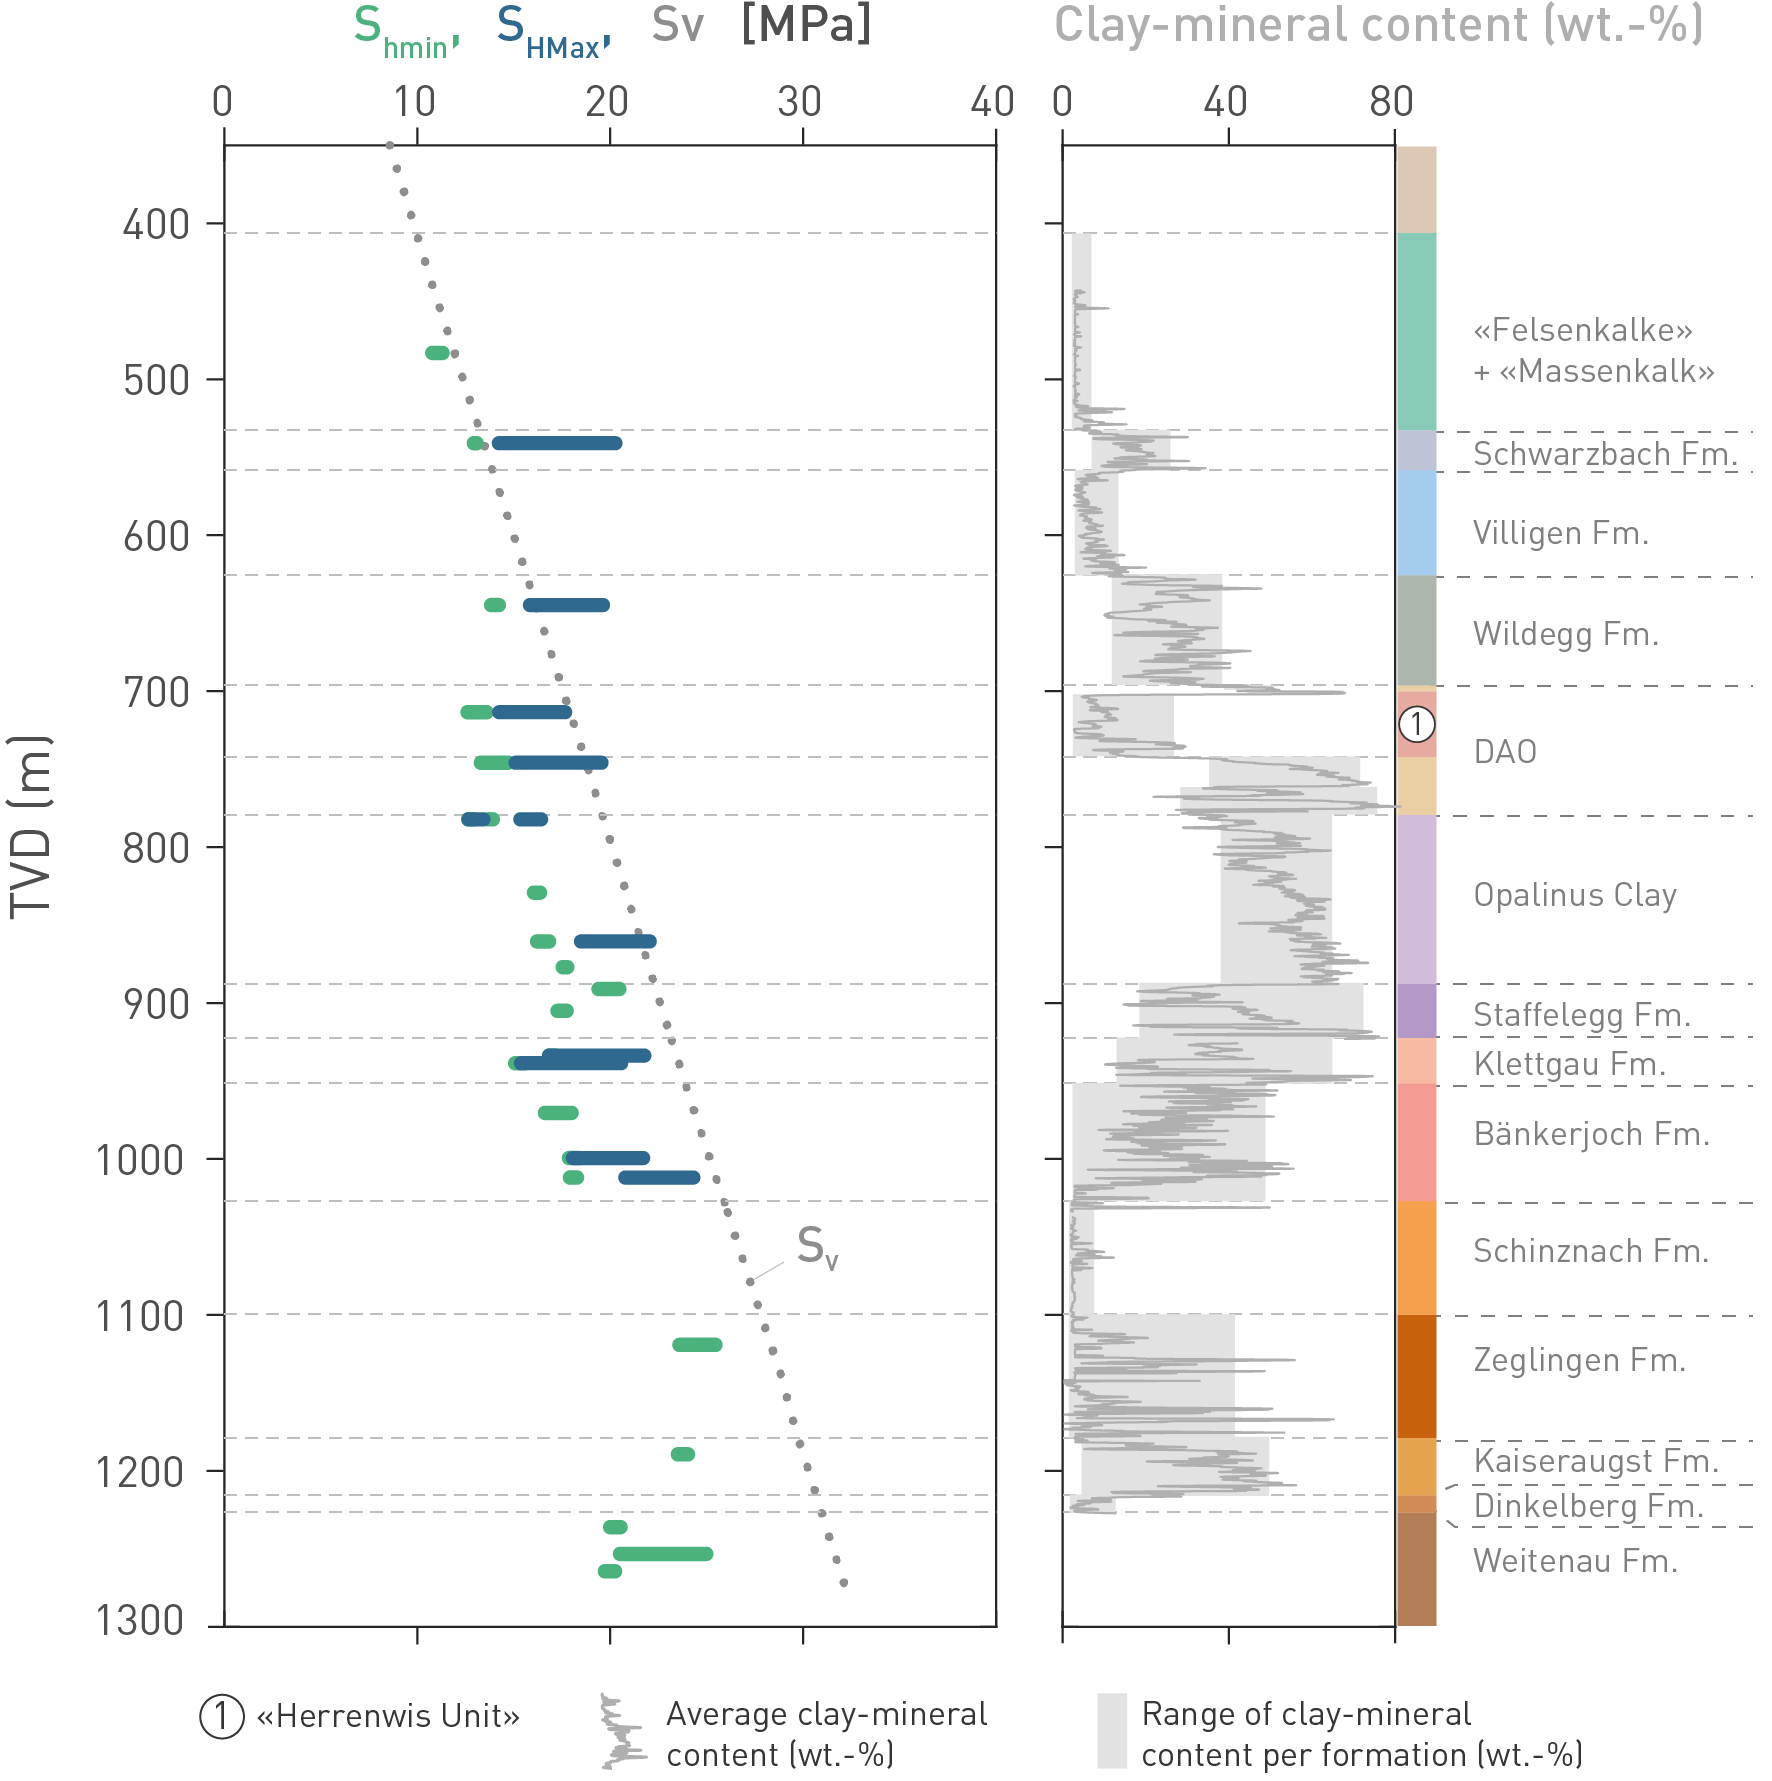
Fig. 4‑77:Stress magnitudes and comparison to clay-mineral content (proxy for layer stiffness)
Shown are data for the STA3 borehole (Nagra 2024o). Continuous line of average clay-mineral content is from Becker & Marnat (2024), and ranges per formation in grey represent the P5 to P95 interval according to Nagra (2024m). Fm.: Formation, DAO: Dogger Group above Opalinus Clay.
Hence, depth exerts an important control on the absolute stress magnitudes. It is noted that the value bands for SHmax (blue bars) are always wider than those of SHmin, because the method used to determine SHmax implies a range at least three times that of SHmin (Nagra 2024o).
Another important control on the stress magnitudes stems from mechanical stratigraphy. This is illustrated by the clay-mineral content in Fig. 4‑77 showing clear variations between formations. Formations with lower clay-mineral content, e.g. the limestones of the «Felsenkalke» and «Massenkalk» or the anhydrite-dominated Zeglingen Formation have a different gradient of SHmin (closer to Sv) than the clay-mineral-rich units of the Opalinus Clay and adjacent formations.
MHF and SR tests sample stresses of the formation on a metre scale. Hence, variability of material properties within the formation and relative contrasts between formations also impact the resulting stress magnitudes. This is highlighted in Fig. 4‑78, which summarises all obtained SHmin values as gradients of SHmin, i.e. magnitudes normalised by depth per formation and siting region. The figure indicates a relatively large variation of SHmin gradients in the Klettgau, Bänkerjoch and Zeglingen Formations. This is also consistent with the larger variation in stiffness compared to other formations (Fig. 4‑77). For the Bänkerjoch Formation two ranges were estimated to account for the bimodal nature of the data because of strongly contrasting bands of weak clay-rich rocks and stiffer anhydrites. The latter is also responsible for the Bänkerjoch and Zeglingen Formations standing out with some SHmin gradients above typical gradients for the vertical stress (24 to 25 MPa/km), whereas the Schinznach Formation exhibits consistently very low values. In the shallower formations above the Opalinus Clay, SHmin gradients tend to increase significantly, as effects of shallow burial superimpose the effects of mechanical layering, especially in the Malm limestones in the NL region, and the Hauptrogenstein and Wildegg Formation in JO.
The sketch in Fig. 4‑79 highlights how absolute depth and mechanical layering can exert a fundamental control on the stress field at different stages of tectonic loading in a highly simplified, alternating limestone and claystone sequence. With only gravitational loading (uniaxial strain condition) and assuming an elastic model, the horizontal stress Sh increases by u/(1- u)*Sv, where u is the Poisson’s ratio (e.g. Thiercelin & Plumb 1994). Since u is greater in the claystone than in the limestone, the gradient of Sh is smaller in the latter, leading to initially lower Sh values than for claystone at the formation boundaries (Fig. 4‑79a). However, with lateral tectonic loading (e.g. Miocene times, Section 3), Sh grows proportionally to the Young’s moduli in each layer, leading to much larger stress increments in the limestone than in the claystone for the same amount of lateral shortening (Fig. 4‑79b). With further tectonic loading, this initially leads to a homogenisation in stress magnitudes across the different lithologies, and eventually to a reversal of the initial situation, where the Sh values in the limestone are greater than those in the claystone. Fig. 4‑79c also highlights that Sh can exceed Sv in the shallow subsurface, as is observed with the high gradients in the Malm limestones in the NL siting region and in the Hauptrogenstein in the JO siting region (Fig. 4‑78). The simplified model also illustrates that Sh in competent layers at greater depth remains lower than Sv, even with stronger tectonic loading, as the depth effect still dominates, i.e. the shift of Sh by tectonic loading is less than the difference from initial gradients.
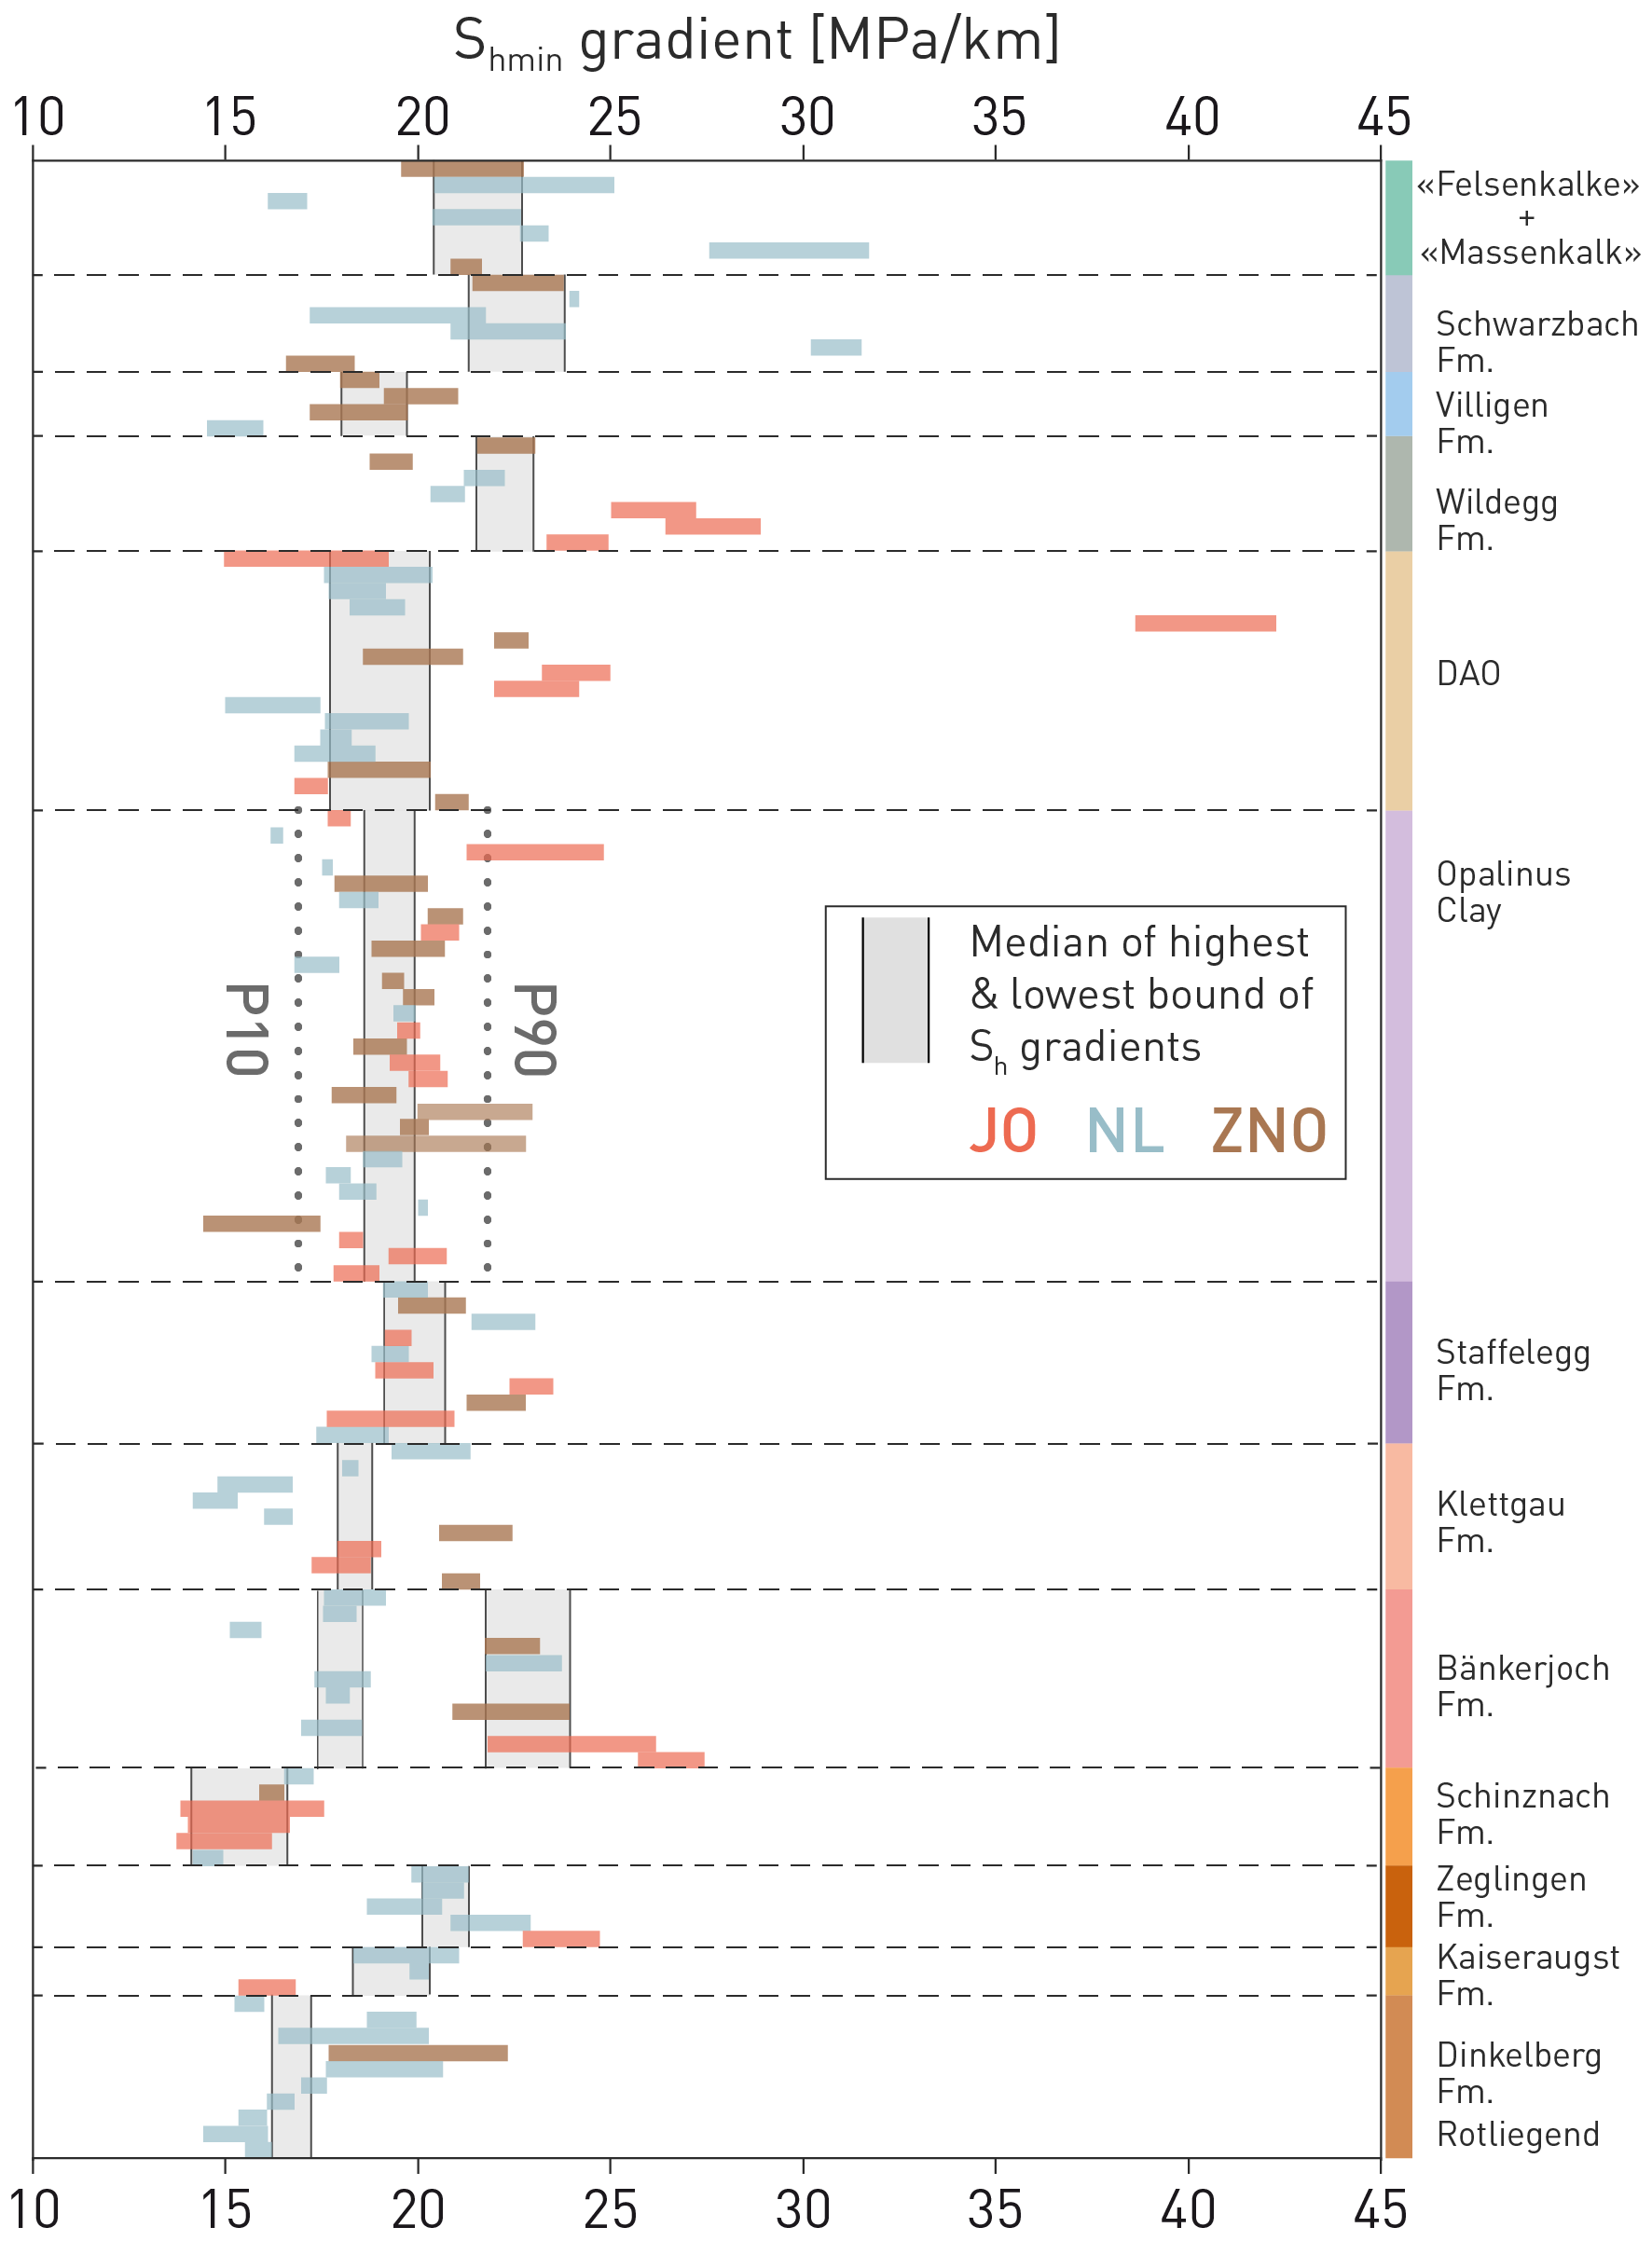
Fig. 4‑78:Control of mechanical layering on stress magnitude data
This figure displays the gradients of 121 reliable measurement of SHmin from MHF tests from the TBO campaign and two reanalysed MHF tests for the Opalinus Clay from the Benken borehole. Data are grouped by the three siting regions and sorted according to the distance to the top of each formation. Grey vertical bars show the range between the medians of the upper and lower bounds of the SHmin gradients for each formation. For the Bänkerjoch Formation two ranges are estimated. The vertical axis does not show absolute depth, just relative depth. The very high gradient of one measurement in JO in the Upper Dogger comes from a very stiff section of the Hauptrogenstein and is not representative of the entire formation.
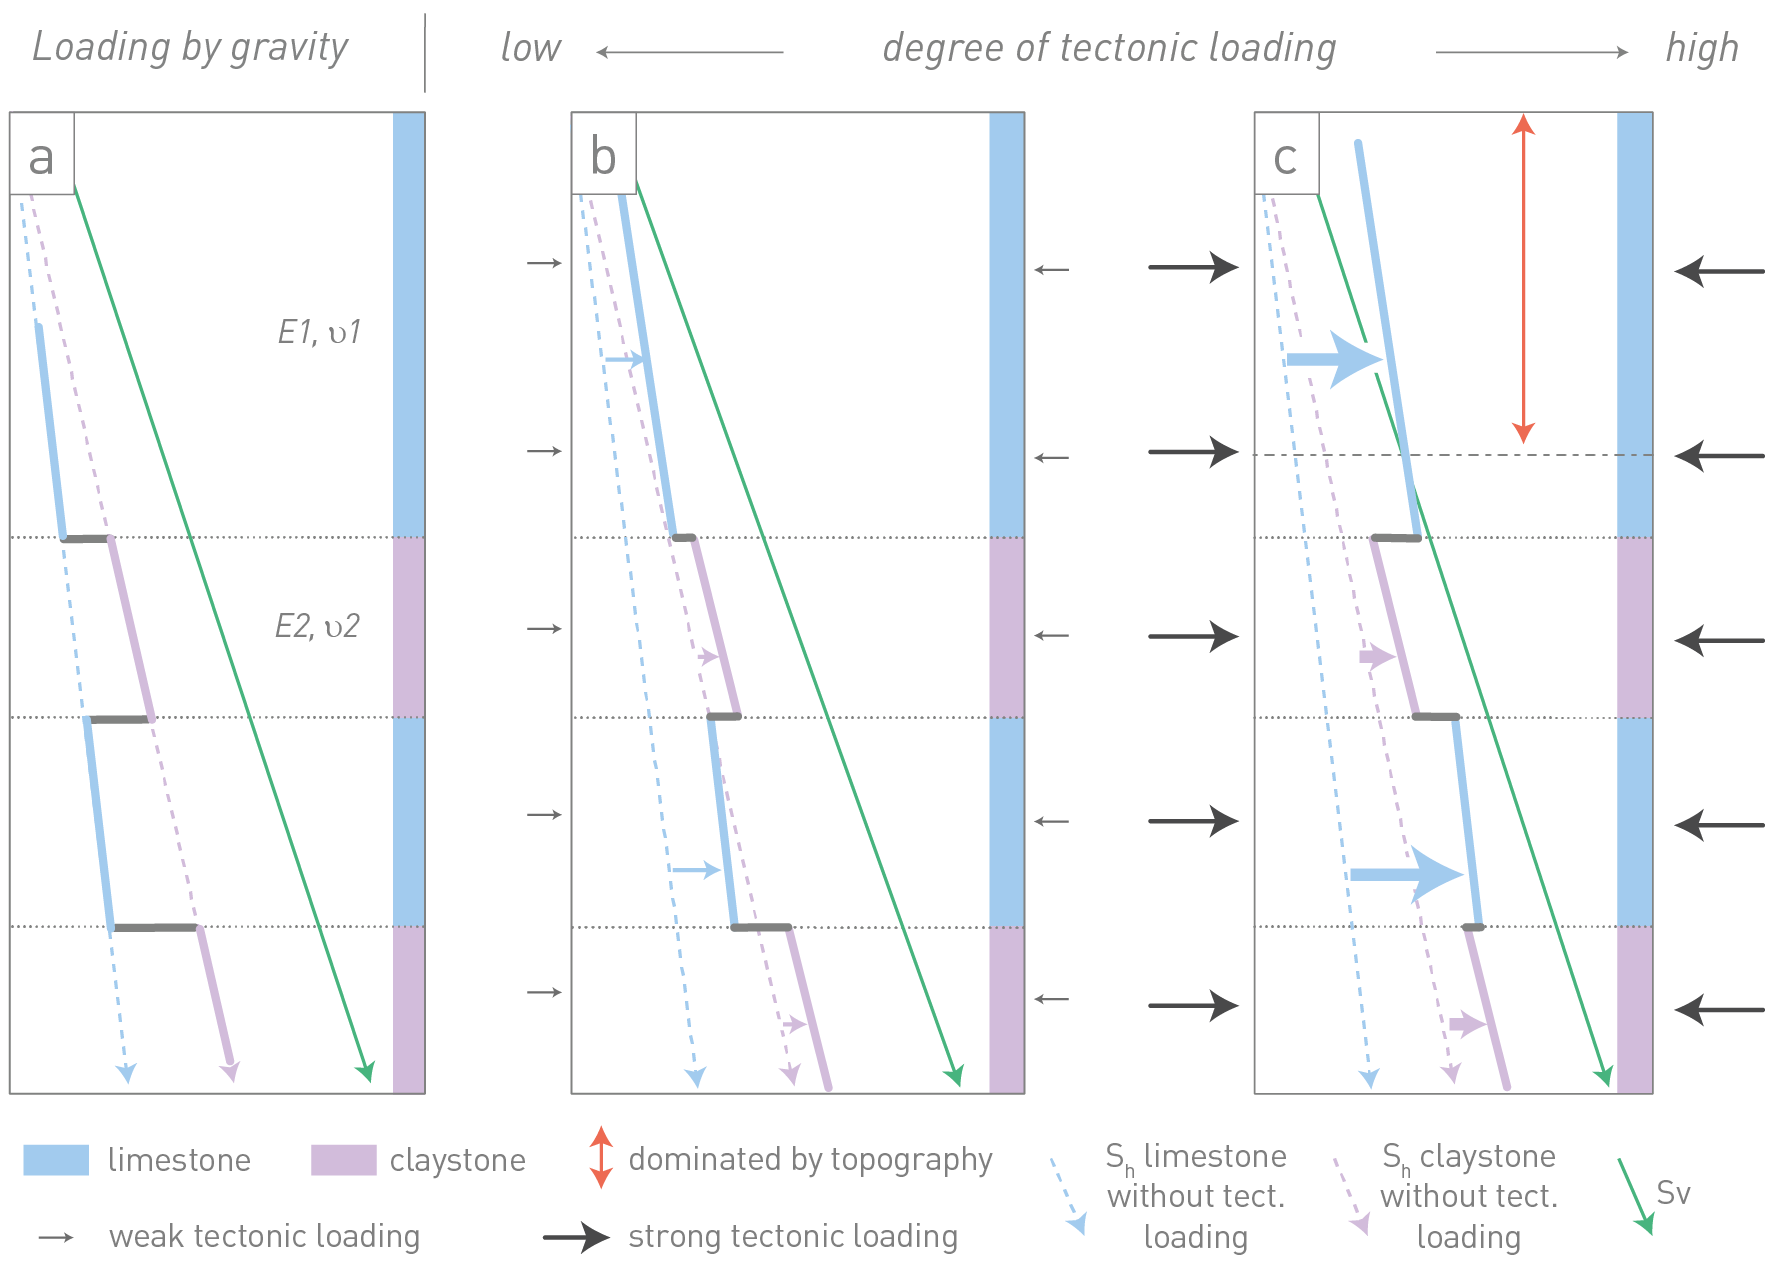
Fig. 4‑79:Conceptual sketch of the evolution of the horizontal stress magnitude Sh in a mechanically layered limestone – claystone sequence
(a) Overburden stress (Sv) is translated laterally through Poisson’s ratio, which is higher in claystones than in limestones (ν2 > ν1), leading to a steeper gradient (higher Sh values) in claystones in comparison to limestones. (b) Uniform horizontal tectonic loading leads to larger Sh increments in limestones because of larger stiffness (E1 > E2), and eventually to homogenisation of Sh values across the layers. (c) Further tectonic loading can lead to higher Sh values in limestones than claystones, and to Sh > Sv in the shallow subsurface.
In the Opalinus Clay, the stress measurements show a consistent linear trend with increasing depth, irrespective of the siting region (Fig. 4‑80). In other words, the gradient of SHmin is similar for all sites. The magnitude of SHmin in the Opalinus Clay is clearly lower than Sv, and the ratios of SHmin/Sv range between approximately 0.6 and 0.9. Measurements close to or outside the bounds depicted in Fig. 4‑80 can be explained as local outliers and are discussed in Nagra (2024o). Note that MHF and SR tests sample on a metre scale and thus Sv is generally the largest of the principal stress magnitudes in the Opalinus Clay, followed by SHmax and SHmin. Given the larger bandwidth of SHmax, it cannot be ruled out that in some cases SHmax reaches a value similar to Sv or, in rare cases, even larger than Sv. Overall, this translates into a stress regime that is dominated by normal faulting to strike-slip faulting in the Opalinus Clay.
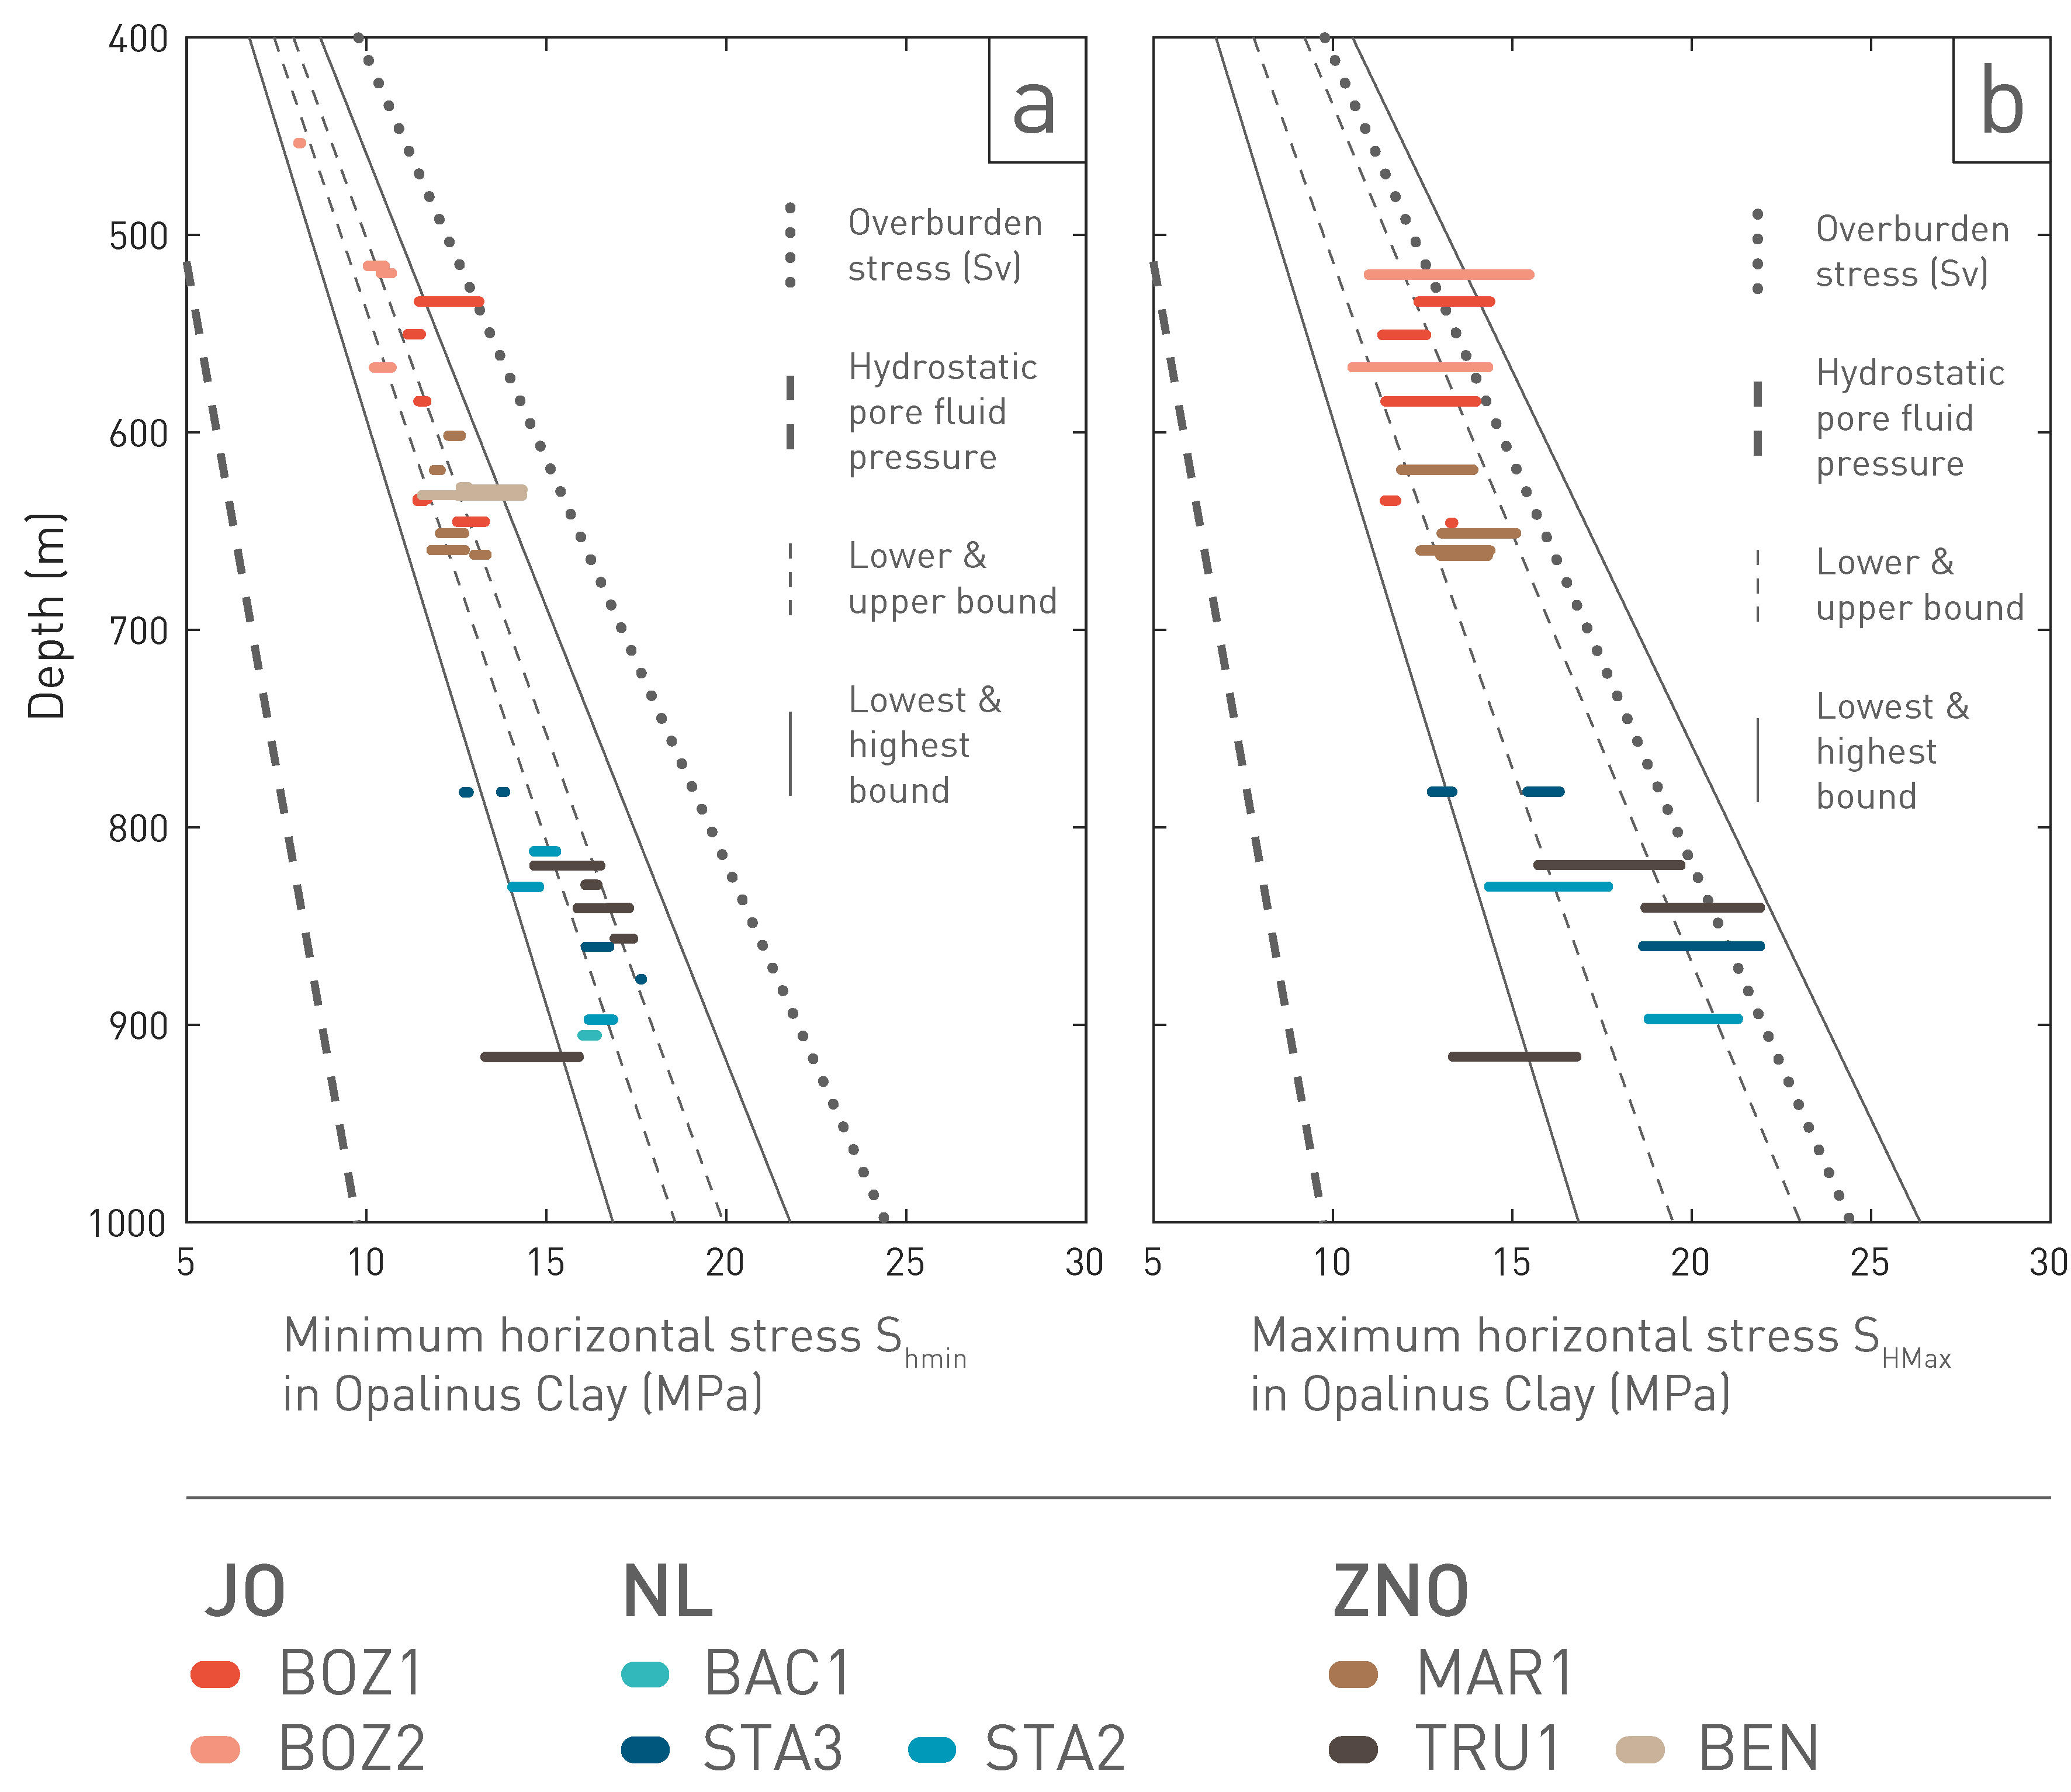
Fig. 4‑80:Compilation of stress magnitude data in the Opalinus Clay across siting regions
Bars denote values of SHmin (a) and SHmax (b) for the various stations including the value range from test interpretation. Lower and upper bounds refer to the median of the lower and upper values of the estimated range, and lowest and highest bounds to the P10 and P90 percentile range of all measurements. Pore fluid pressure and vertical stress Sv are approximated with constant densities (1'000 kg/m3 and 2'450 kg/m3, respectively).
To provide a continuous description of the 3D stress state in the siting regions, geomechanical-numerical models are set up that use point-wise stress magnitude measurements for the model calibration. These models, hereafter "stress models", integrate all geomechanically relevant rock properties of the drilled formations and structural elements. The lateral extent of these stress models is depicted in Fig. 4‑76 and further technical details can be found in Nagra (2024o).
Given that the stiffness distribution, i.e. Young’s Modulus E, exerts a key control on the stress field, the stress models account for stiffness variability. An example of modelling input and results is shown in Fig. 4‑81, with the range of stiffness values on 95% probability (i.e. stiffness value within this range) on the right. The result is a bandwidth of the horizontal stress magnitudes rather than a single line indicating the best fit to the stress magnitude data used as model calibration points. Using this stiffness variation for sensitivity analyses in stress model runs, Fig. 4‑81 shows the resulting 95% probability of stresses that should be expected. This 95% probability band should contain the stress measurements of Shmin and the derived SHmax values, as they also reflect the stiffness variability within the formations. Indeed, except for a few outliers that sampled the formation outside the 95% probability range, most data points are covered by the derived stress band.
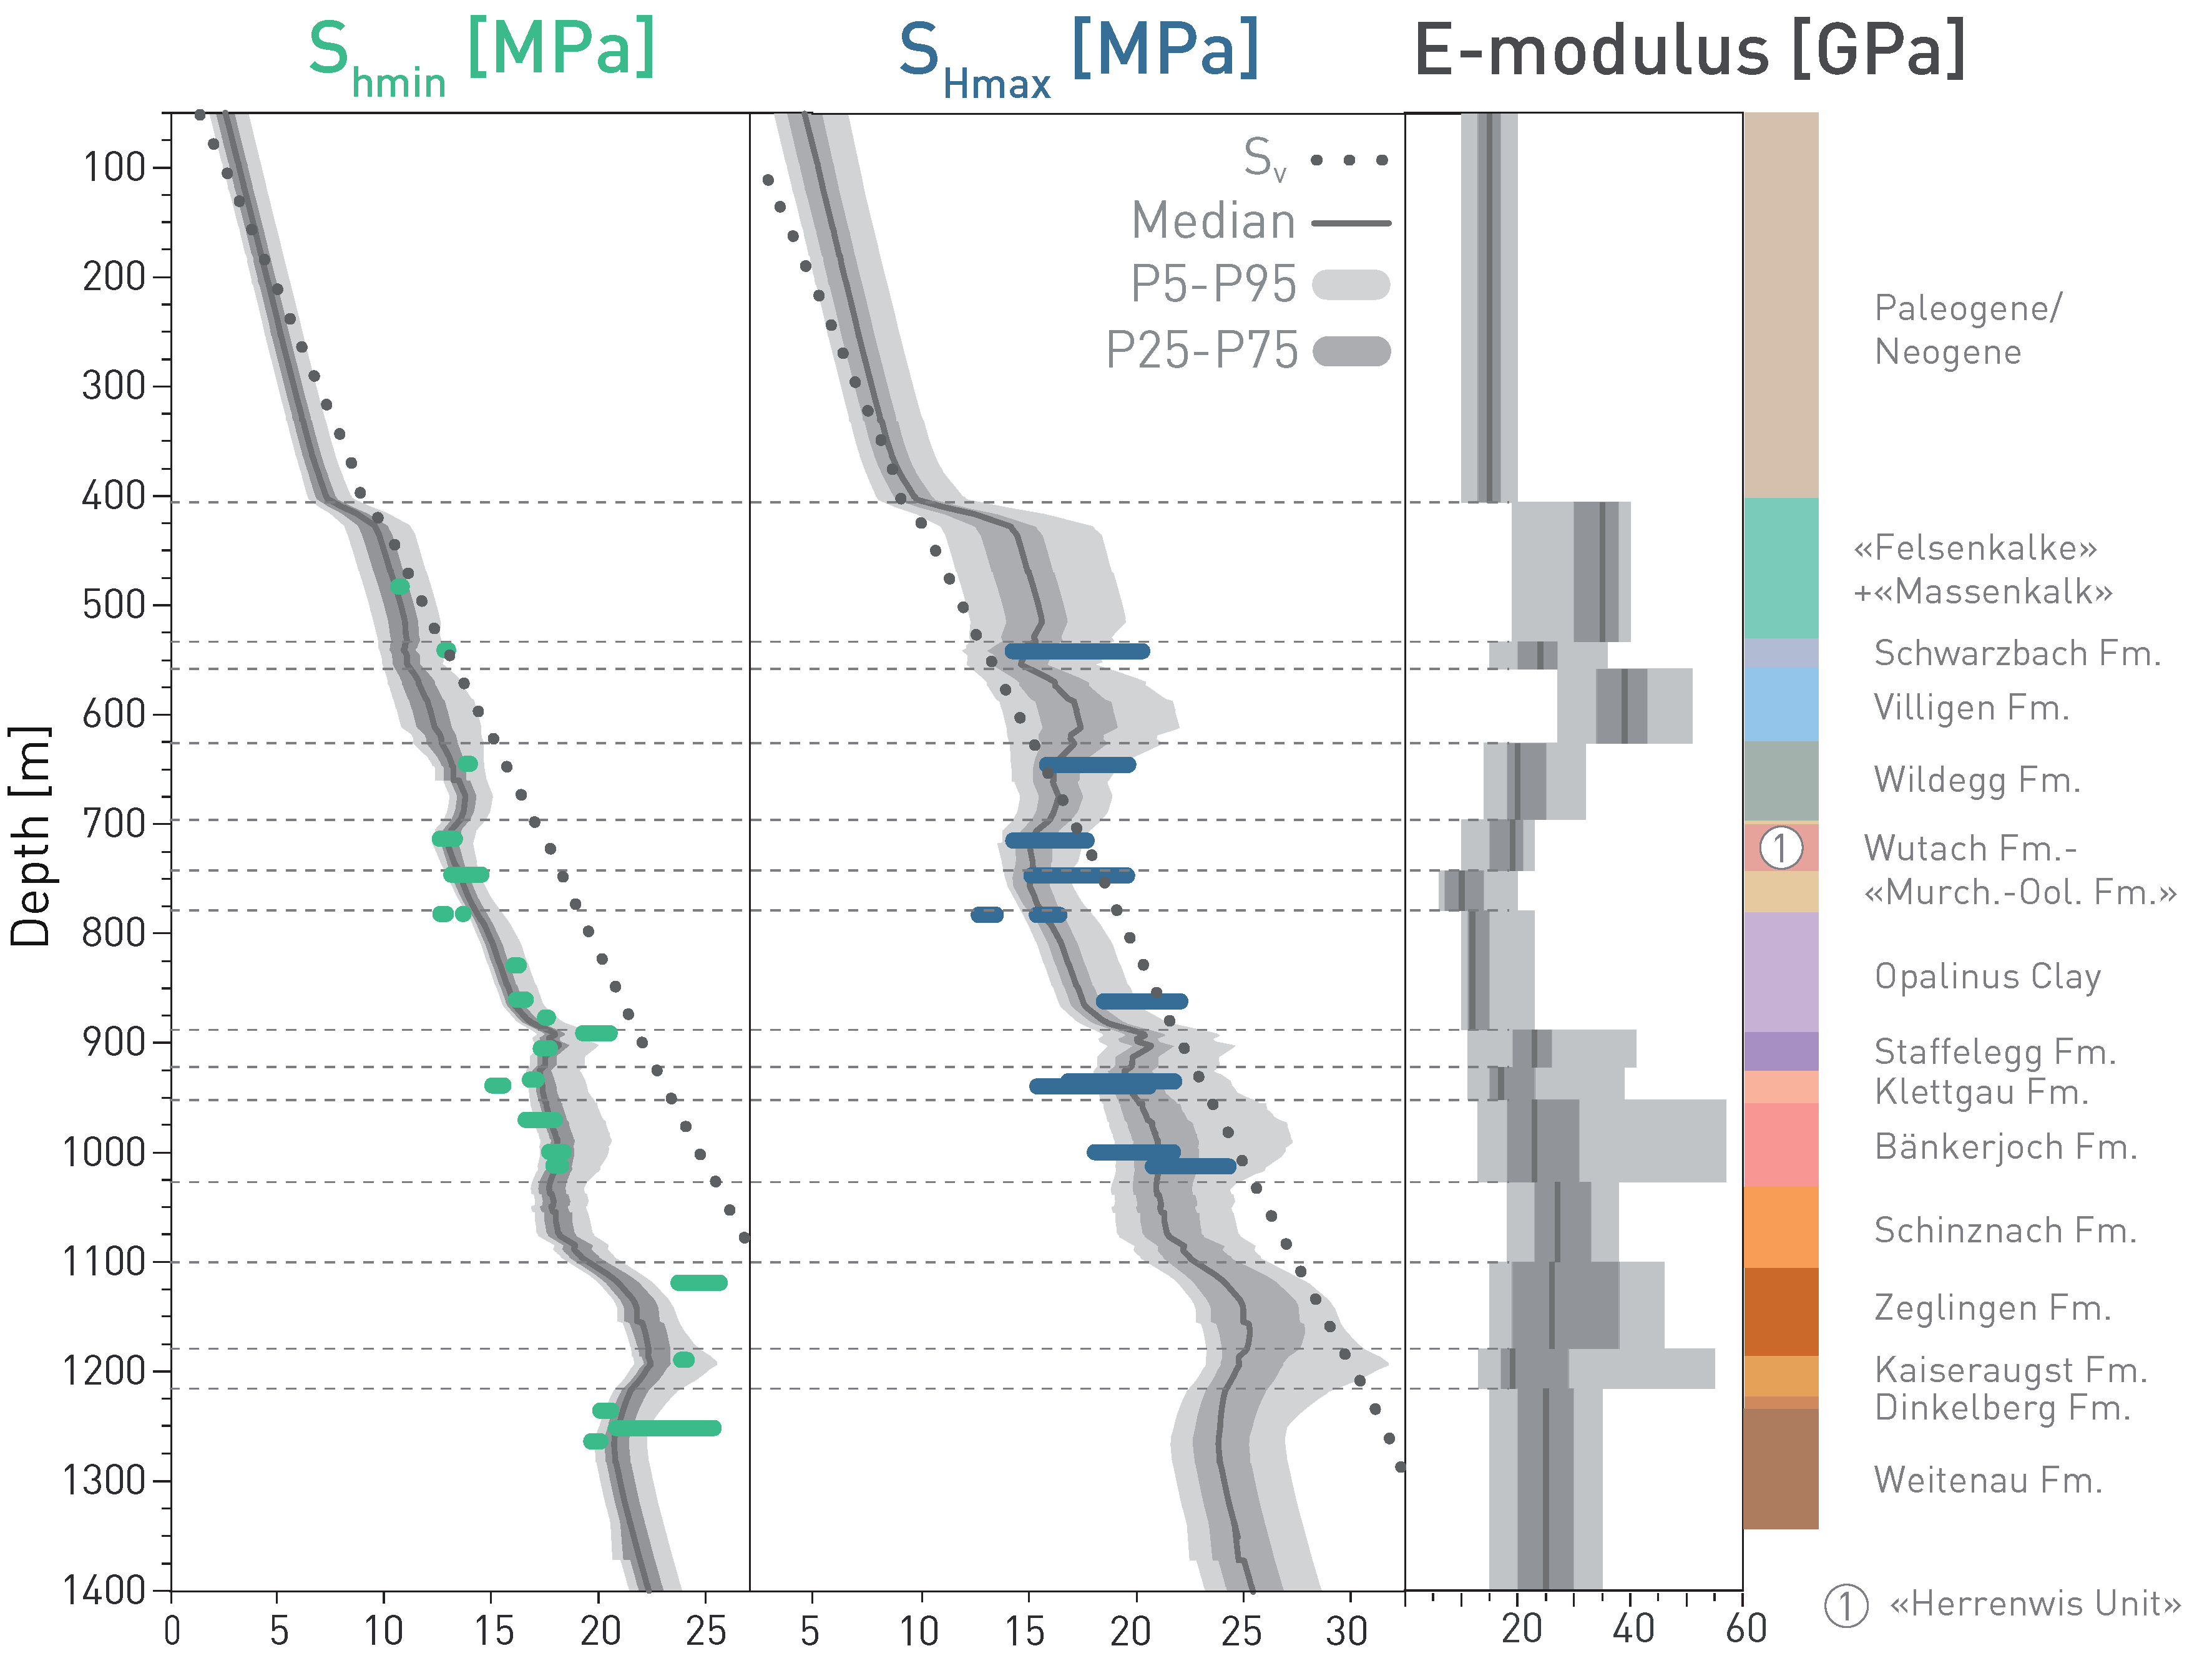
Fig. 4‑81:Stress magnitude data from MHF/SR tests and modelled stress bandwidth
Green and blue bars represent bandwidths of Shmin and SHmax magnitudes from MHF and SR test results from the STA3 borehole. The dotted line depicts Sv. Dark and light grey bands represent the P25 to P75 and P5 to P95 percentile, respectively, and the dark line in the centre represents the P50 value for both, Young’s Modulus E on the right, and the track of the Shmin and SHmax from the stress models.
Stress models were also used to explore the effect of faults on the stress field. It can be shown that this effect is relatively small and is not present a short distance away from the faults (Nagra 2024o, Reiter et al. 2024).
The model results also provide the bandwidth of the stress regime in all formations grouped by site as displayed in Fig. 4‑82. For site comparison, stress values were extracted from the site-specific stress models along a vertical trajectory into the approximate location of the current repository project. The stress regime is expressed using the continuous regime stress ratio (RSR) value (Simpson 1997). As discussed above for the MHF field data only, the stress model runs suggest a normal faulting stress regime for the Opalinus Clay, especially for the NL siting region. For ZNO and especially JO, the dominant stress regime transitions from normal faulting to strike- slip faulting because of the progressively shallower position of the Opalinus Clay. This trend to a higher lateral stress relative to the vertical stress is particularly manifested in the formations above the Opalinus Clay and can reach thrust faulting stress regime conditions (SHmax > Shmin > Sv) in the Malm.
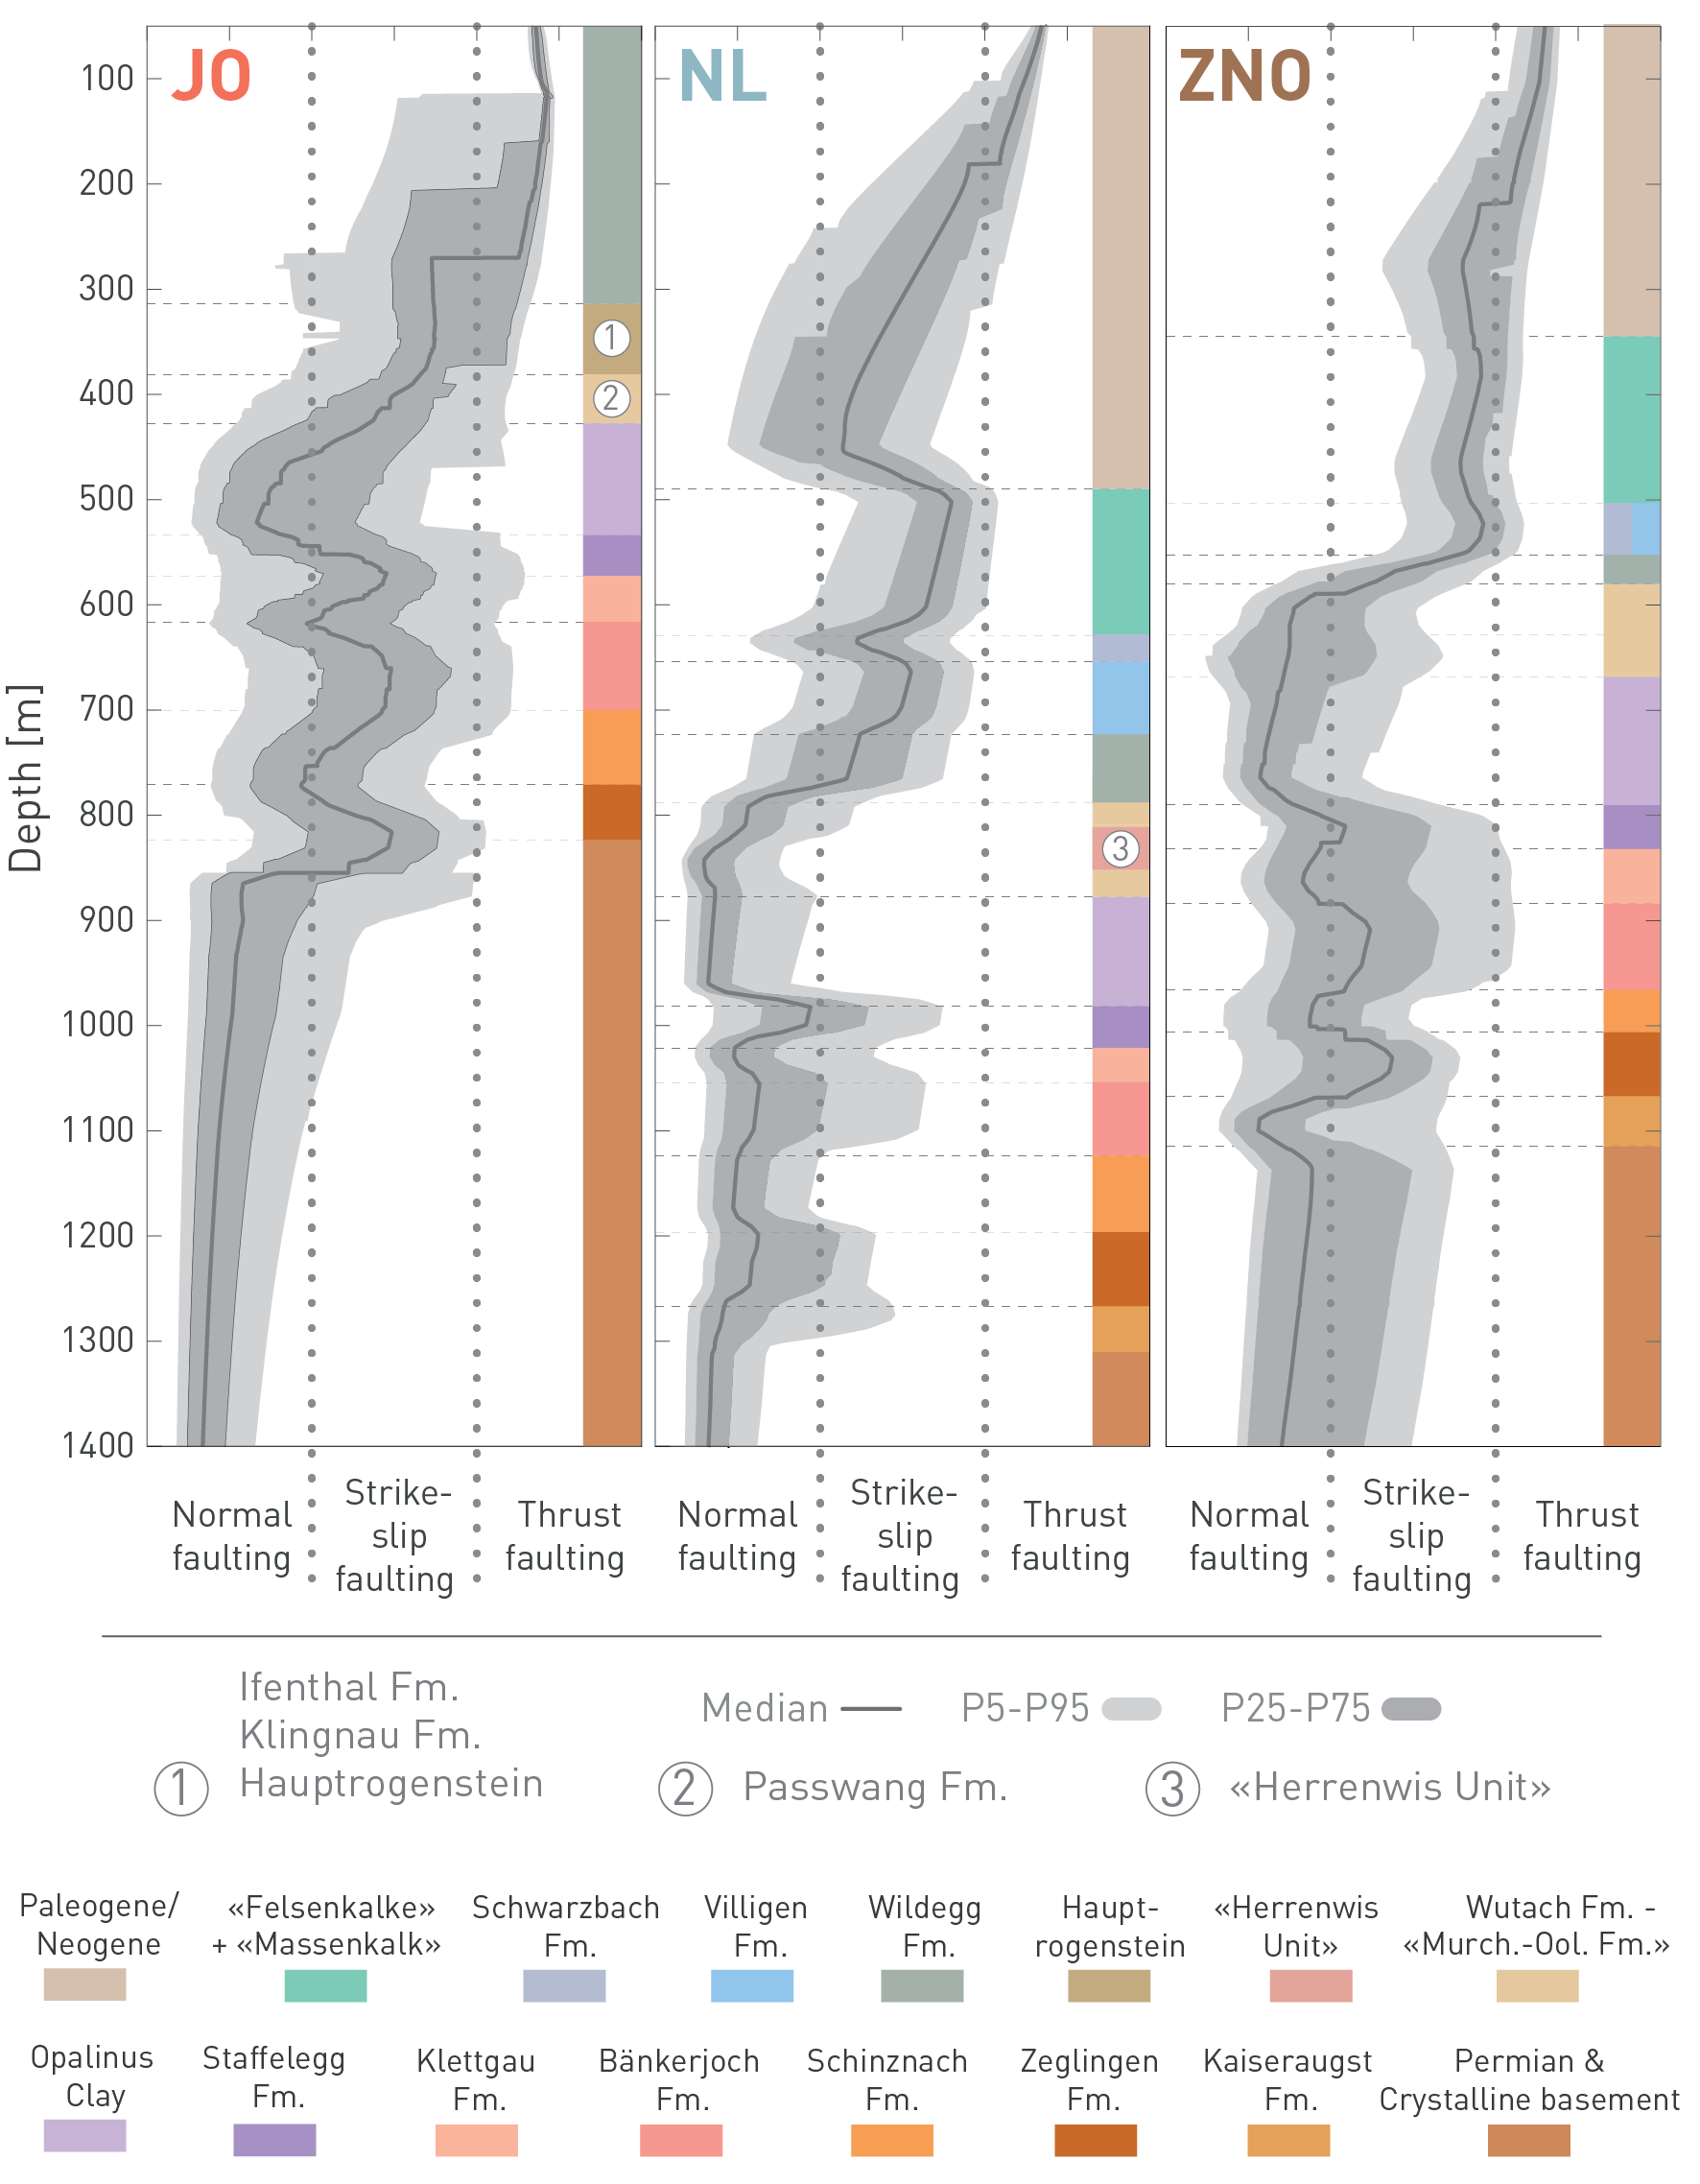
Fig. 4‑82:Comparison of stress regimes within the rock formations across the different siting regions
Values are extracted from stress model runs at a vertical trajectory into the approximate location of the high-level waste section of the current repository project in each site. To assign continuous values of stress regime (x-axis) the classification according to the regime stress ratio is used (details can be found in Nagra 2024o).
-
The stress field in all three siting regions is well defined. This conclusion is based not only on the high density of in-situ borehole tests (MHF, SR), but also on the consistency of observed trends and bandwidths from the stress models.
-
The prevailing SHmax orientation is NNW-SSE, approximately perpendicular to the Jura Fold-and-Thrust Belt, with a small counterclockwise rotation by approximately 10° from the ZNO region to the JO region. Broad consistency of current SHmax orientation with Miocene deformation features indicates relative stability of the dominant horizontal stress orientation over the past few million years.
-
Continuity of the orientation of SHmax across Mesozoic sediments (vertically and laterally) derived from boreholes is an indicator of good stress coupling. Significant discrete stress rotations are generally not observed in boreholes in the siting regions.
-
The stress field is similar in all three siting regions, primarily related to depth and secondarily to mechanical layering, which is coupled to tectonic loading.
-
The higher stress magnitudes from tectonic loading in more competent layers explains why the stronger formations often exhibit stronger tectonic overprint than the clay-mineral-rich layers (Section 4.3.4). This is amplified closer to the surface (especially in Malm limestones).
-
The Opalinus Clay exhibits consistent gradients of stress magnitudes, irrespective of the site provenance. Given the differences in tectonic history at the three sites, this finding indicates that the stress field in the Opalinus Clay is relatively insensitive to tectonic loading.
-
The level of predictability of the stress field beyond the boreholes using 3D geomechanical-numerical models is similar in all three siting regions. Furthermore, the models show that faults do not have any relevant impact on the stress field in the far-field.
-
The stress regime in all three siting regions can be considered similar. It changes with depth from a thrust faulting stress regime closer to the surface, to a strike-slip and normal faulting stress regimes at greater depth. Where the Opalinus Clay is located at greater depth (in the NL siting region), a stress regime causing normal faulting is dominant, whereas it is normal to strike-slip faulting where at more shallow position (ZNO and especially in JO siting regions).
Key points:
- The low-permeability sequence around the Opalinus Clay is delimited at the top by the regional Malm (NL, ZNO) and Hauptrogenstein (JO) aquifers. The lower limit is formed by the complex Keuper aquifer or, where it is absent, by the regional Muschelkalk aquifer.
- The Na-Cl type Malm groundwaters in NL are remnants of seawater from the Upper Marine Molasse Group (OMM) and are characterised by particularly high residence times
> 500 kyr. The quasi-stagnant conditions can be explained by slow groundwater recharge through seepage from the Molasse. In ZNO, the seawater component of the Malm groundwater is increasingly displaced by freshwater recharging further to the north. - The limestones of the Hauptrogenstein constitute the aquifer above the host rock in JO. Because of a lithological facies transition and a thickness change the hydrogeological importance decreases from west to east.
- The local Keuper aquifer is characterised by a large variation in hydraulic conductivity that results from the lithological complexity of these sediments deposited in a mainly continental setting. While it probably represents a continuous aquifer in JO and ZNO, water flow is constricted to locally occurring fluviatile sandstone channels in NL.
- In the ZNO and NL siting regions, the Muschelkalk aquifer hosts a continuous dynamic flow system with 81Kr model ages of the individual groundwater samples ranging from 23 – 115 kyr. In JO, there is a more local flow system related to the local topographic and structural situation.
This section addresses the characterisation of the hydrogeological system within which the repository will be constructed. The complete aquifer – aquitard system is described with a particular focus on the deep aquifers situated above and below the Opalinus Clay host rock and the surrounding confining units. These aquifers define the boundary conditions for transport in the low-permeability units between them and represent a potential connection to shallow aquifers and, ultimately, to the biosphere. A more detailed characterisation of transport phenomena and properties of the host rock and the confining units is given in Chapter 5. This section focuses on the present-day state and partly on the past evolution. Scenarios for future evolution of the aquifer – aquitard system are included in Section 6.5.
Structure of this section
Section 4.5.2 provides an overview of the relevant elements of the hydrogeological system, namely the topography, the river network, the hydrostratigraphic units and the main tectonic features.
The hydrostratigraphy section (Section 4.5.3) subdivides the sedimentary succession by hydrogeological criteria and presents the transport properties.
The analysis of the flow systems in the aquifers is presented in Section 4.5.4. The steady-state hydrodynamic model allows the consistency of the hydrogeological datasets to be checked, identification of recharge and discharge zones, and calculation of water fluxes and hydraulic gradients.
The hydrogeochemistry section (Section 4.5.5) provides information on the dynamics of the flow systems in the aquifers, notably on residence times. The chemical composition of the groundwater contains information on the units that the water has been in contact with and, therefore, may evidence interaction with other aquifers along faults (cross-formation flow). In addition, deep groundwater geochemistry provides the boundary conditions for the interpretation of natural tracer profiles in porewater (Section 4.7) and is used to check consistency with the flow fields computed with the hydrodynamic model.
The relevant elements of the hydrogeological system comprise the topography, the river network, the sedimentary succession and the properties of each unit within it and the tectonic situation including the fault systems (Fig. 4‑83).
The regional aquifers of interest comprise the Malm aquifer, Hauptrogenstein aquifer (JO and the area to the west) and Muschelkalk aquifer and are described further in the hydrostratigraphy section below (Fig. 4‑84, Section 4.5.3). Potential recharge areas of the aquifers of interest are located in the hilly area to the north of the NL and ZNO siting regions (Fig. 4‑83), notably the large zones of Malm Group outcrop in Canton Schaffhausen and the Wutach Valley area for the Muschelkalk aquifer. For the JO region, the aquifers of interest outcrop along the Internal Jura (Folded Jura) in the south and in the External and Tabular Jura in the north. Additional outcrops of the regional aquifers occur in the Alps and may contribute to the recharge of the southern Molasse Basin (Nagra 2024n).
The potential discharge areas are located where the river valleys cut into the mostly SSE-dipping aquifer units. Regional scale discharge areas are located along the Rhine River and in the lowermost Aare Valley. Additional potential discharge areas exist in smaller valleys. The river valleys are typically filled with highly permeable unconsolidated sediments which host important groundwater resources used for water supply. These aquifers are often characterised by intensive interaction with the rivers.
The Jurassic rocks are covered by increasingly thick Molasse units towards the south-east because of the general dip of the strata. In the southern part of the basin, the Malm aquifer is covered by a several kilometre thickness of Molasse (Fig. 3‑2).
Regional fault systems delimit the geological siting regions, affect the outcrop situation and the continuity of units of interest. The Jura Main Thrust is an important example (Fig. 3‑3, Fig. 4‑54 and Fig. 4‑83). Discharge areas are located where it is cut by the valleys of Limmat, Reuss and Aare. At these locations, the spas of Baden and Bad Schinznach use thermal water ascending in the Muschelkalk aquifer from deep parts of the (southern) Molasse Basin.
The lithological diversity of the sedimentary succession results in important variations in the hydraulic conductivities in the vertical direction. That is, there are different aquifer levels separated by aquitards. The importance of regional fault zones and potential cross-formation flow is evaluated with the hydrodynamic model (Nagra 2024n) and discussed based on hydrogeochemical arguments (Section 4.5.5).
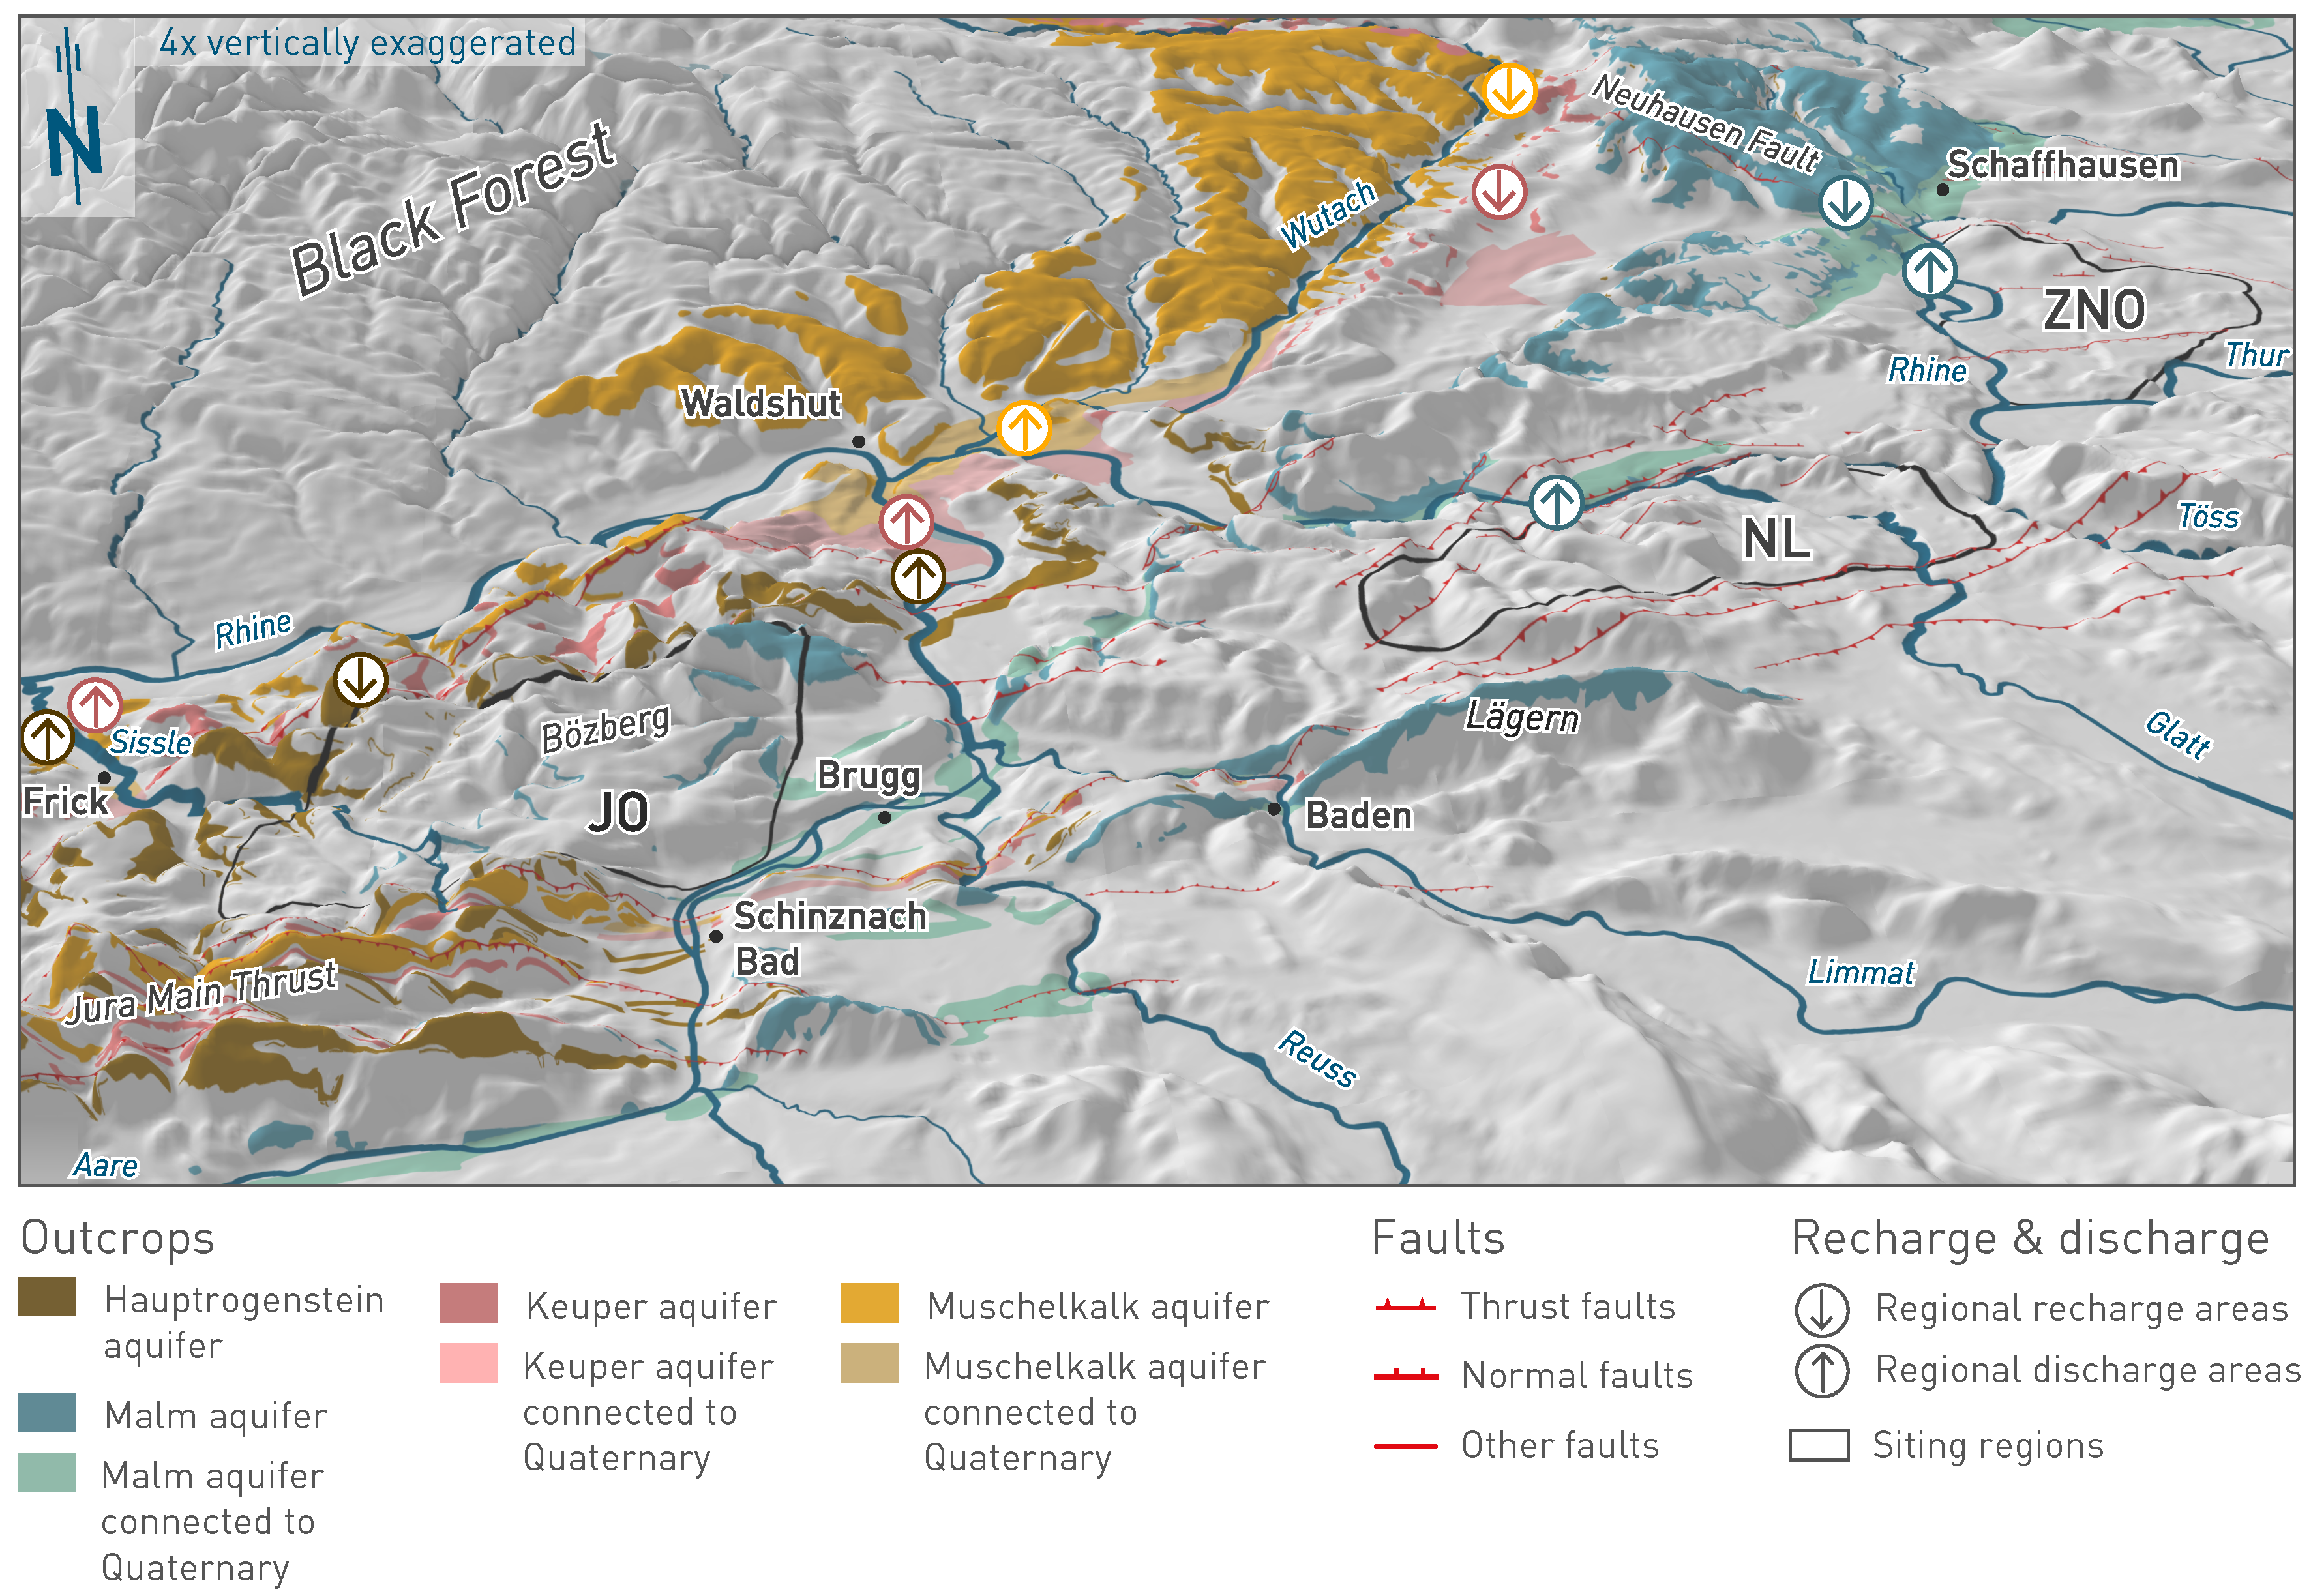
Fig. 4‑83:Aquifer outcrops, river network, regional fault zones and potential recharge and discharge areas relevant for the siting regions
The digital elevation model is vertical exaggerated by a factor 4. Regional recharge areas: Malm aquifer: Südranden and Randen areas; Hauptrogenstein aquifer: Frickberg and adjacent outcrops; Keuper aquifer: Hallauerberg and adjacent areas; Muschelkalk aquifer: Upper Wutach Valley. Regional discharge areas: Malm aquifer: Rheinfall area, Rhine Valley near Kaiserstuhl; Hauptrogenstein aquifer: Lower Aare Valley, Sissle Valley; Keuper aquifer: Lower Aare Valley, Sissle Valley; Muschelkalk aquifer: Confluence of Aare and Rhine River area, Sissle Valley.
-
This section subdivides and describes the sedimentary stack based mainly on hydrogeological criteria. Primarily, it differentiates between aquifers, where hydraulic conductivity is typically sufficiently large to allow for groundwater sampling, and aquitards. In addition to the hydraulic properties, this section gives indications on the nature of water flow.
-
As a result of the earlier investigation programmes by Nagra in Northern Switzerland, the regional hydrostratigraphy was already well established and has now been updated with the new data (Fig. 4‑84). The units are divided into regional and local aquifers separated by aquitards.
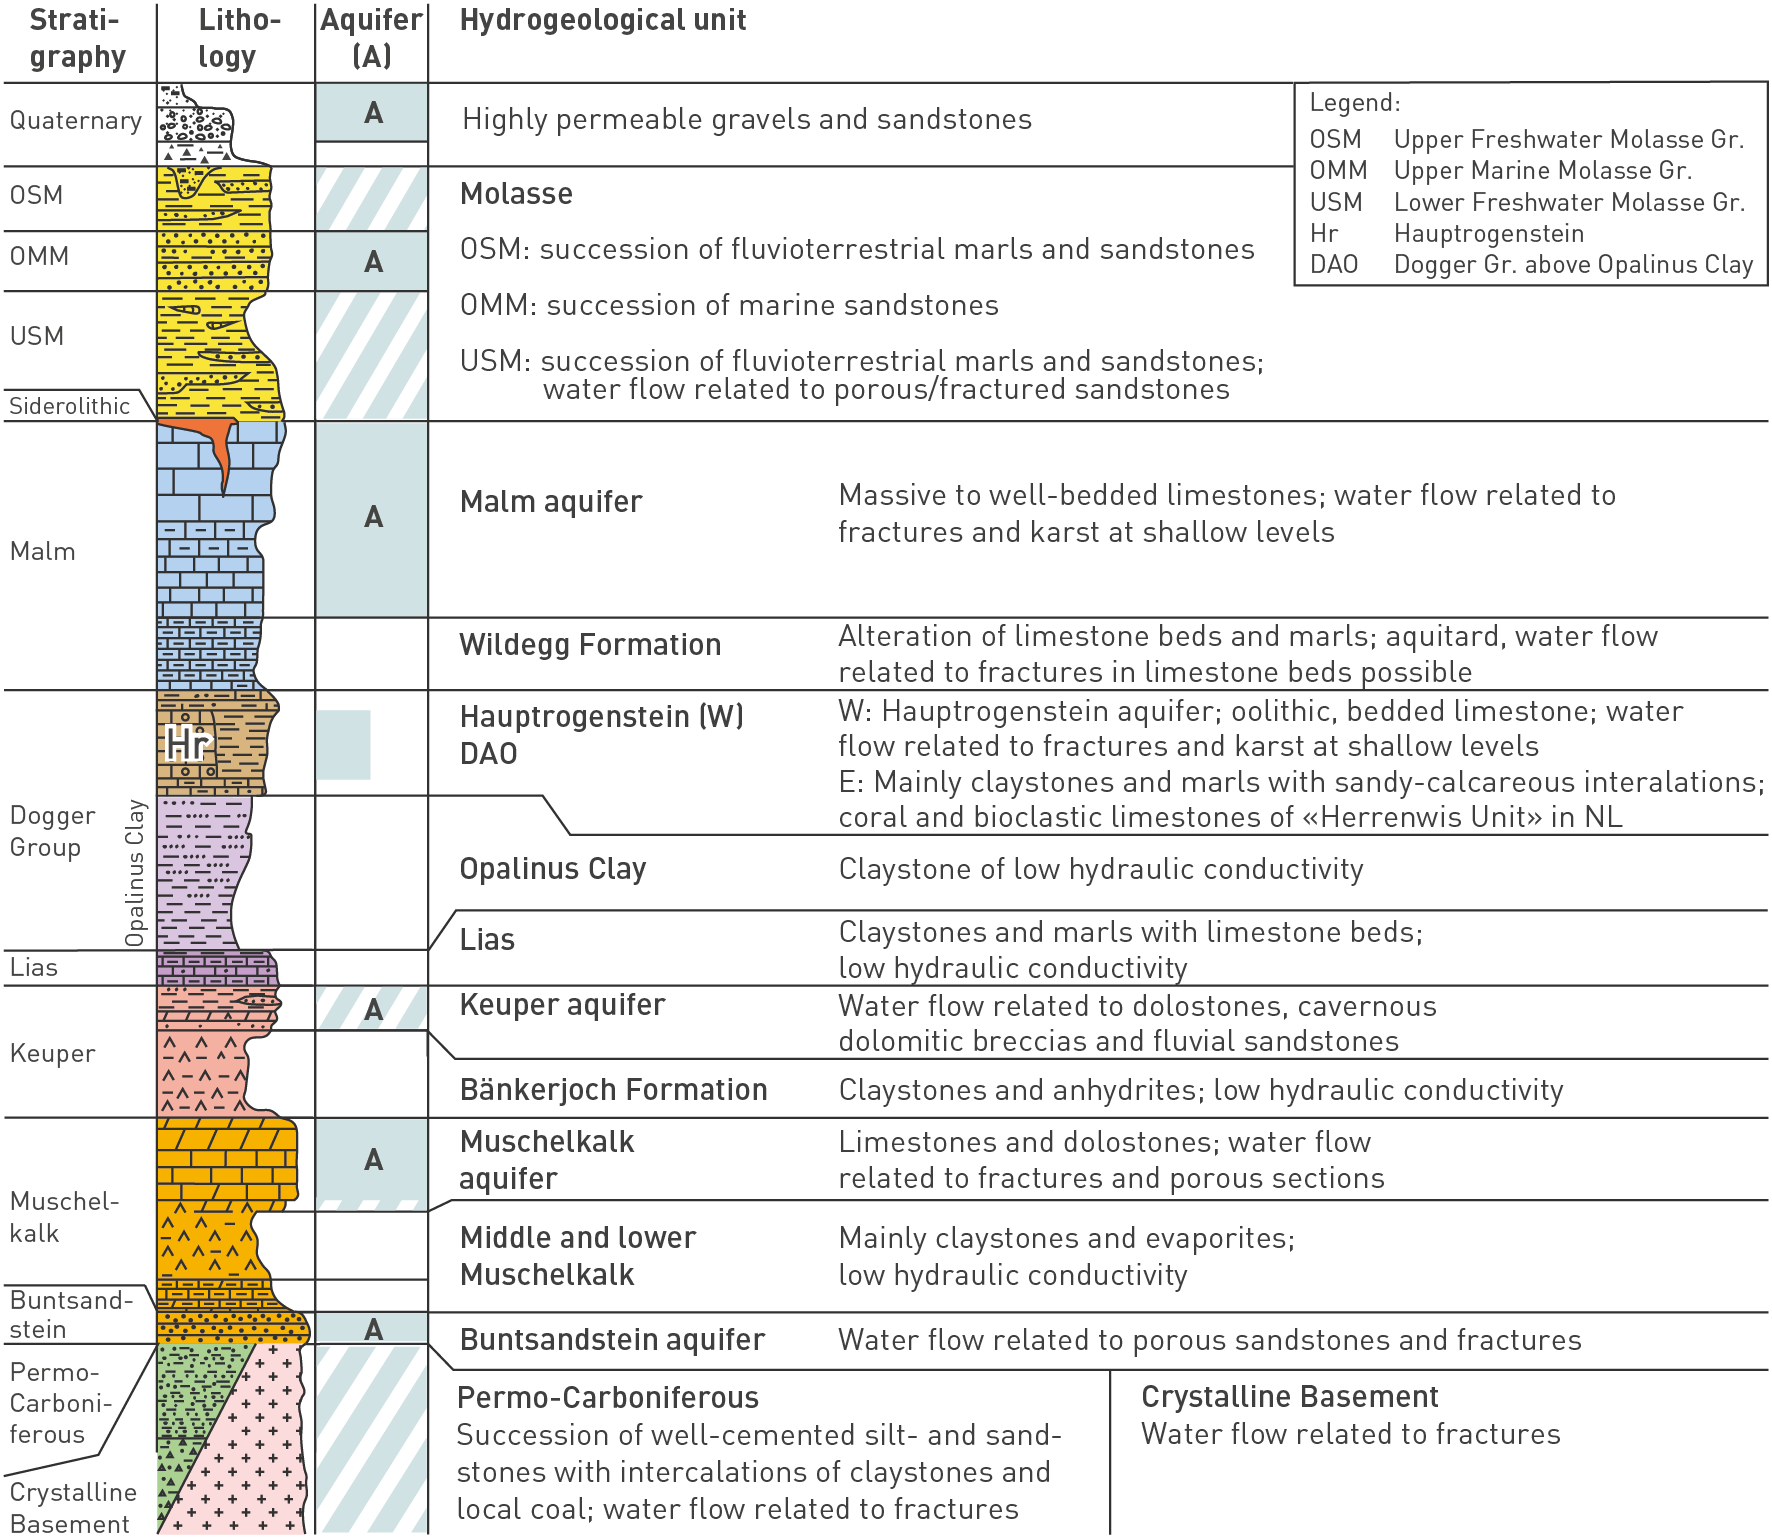
Fig. 4‑84:Hydrostratigraphic units of Northern Switzerland
The figure focuses on the situation relevant in siting regions. For the Dogger Group, it illustrates the facies change from the carbonate-rich Hauptrogenstein in the west to more clay-mineral-rich units further eastwards (Section 4.2.7). Hatched areas indicate local aquifers or units in which the water flow is linked to a specific lithology (e.g. sandstones in the USM). Gr.: Group.
Groundwater flow occurs either in the porous matrix or along discontinuities such as fractures or karst features. The links to lithofacies (Section 4.2) and to the structural overprint (Section 4.3) are important in understanding fluid flow. The clay-mineral content is used as a proxy for the mechanical competence and thus deformation behaviour of the rock (i.e. the more clay minerals the less prone to brittle deformation; see also Sections 4.9, 5.5 and 5.6).
The regional aquifers refer to the thick and brittle carbonate rocks, namely the Malm aquifer, Hauptrogenstein aquifer (JO and the area to the west) and Muschelkalk aquifer. These aquifers are termed regional because of their comparably uniform lithology in Northern Switzerland. The units between these regional aquifers are mostly aquitards rich in clay minerals (Fig. 4‑84), except for the local Keuper aquifer and the «Herrenwis Unit» which are discussed later in more detail.
Specifically, the following characterisation focuses on the section between the Opalinus Clay and the regional aquifers above and below. These aquifers, together with the occurrence of the local Keuper aquifer, define the maximum thickness of the low-permeability units and provide the hydrogeochemical and hydraulic boundary conditions to the aquitards in between.
Additional aquifers occur in shallower units (e.g. Upper Marine Molasse Group (OMM), sandstone channels in the Lower Freshwater Molasse Group (USM)) and in deeper units (e.g. Buntsandstein Group, crystalline basement; Fig. 4‑84). These were detailed in many earlier reports and publications (e.g. Thury et al. 1994, Klemenz et al. 2000, Küpfer 2005, Gander 2004, Plum et al. 2008, Waber & Traber 2022).
The new TBO boreholes allowed the hydrogeological understanding of the siting regions and of the regional flow systems to be complemented and refined (Fig. 4‑85). Elevated hydraulic conductivities were observed as expected in the regional Malm and Muschelkalk aquifers, which in most cases allowed for groundwater sampling. The Hauptrogenstein aquifer is only observed in Jura Ost and is affected by a facies transition (details in Section 4.2.7). Transmissive lithofacies of the local Keuper aquifer were tested in several boreholes and groundwater sampling was partly feasible. The existence of the Keuper aquifer is evident in many natural tracer profiles (Section 4.6).
The transmissivities observed in the different aquifers reflect their lithological variation, structural overprint and indicate their hydrogeological importance (Fig. 4‑86). The transmissivities observed in the Muschelkalk aquifer are comparably uniform in the siting regions and about one order of magnitude higher than in the Malm aquifer. Groundwater residence times also reflect this (Section 4.5.5). In contrast, the observed transmissivities in the Keuper aquifer scatter over eight orders of magnitude.
Between these aquifers, the mostly clay-mineral rich rocks are characterised by low hydraulic conductivities. The units directly above and below the Opalinus Clay include so-called "hard beds" which were controversially discussed in earlier project phases (e.g. Nagra 2014f; see also Section 4.2.7). Intensive testing of the TBO boreholes provides no evidence that these "hard beds" allow for larger-scale groundwater flow.
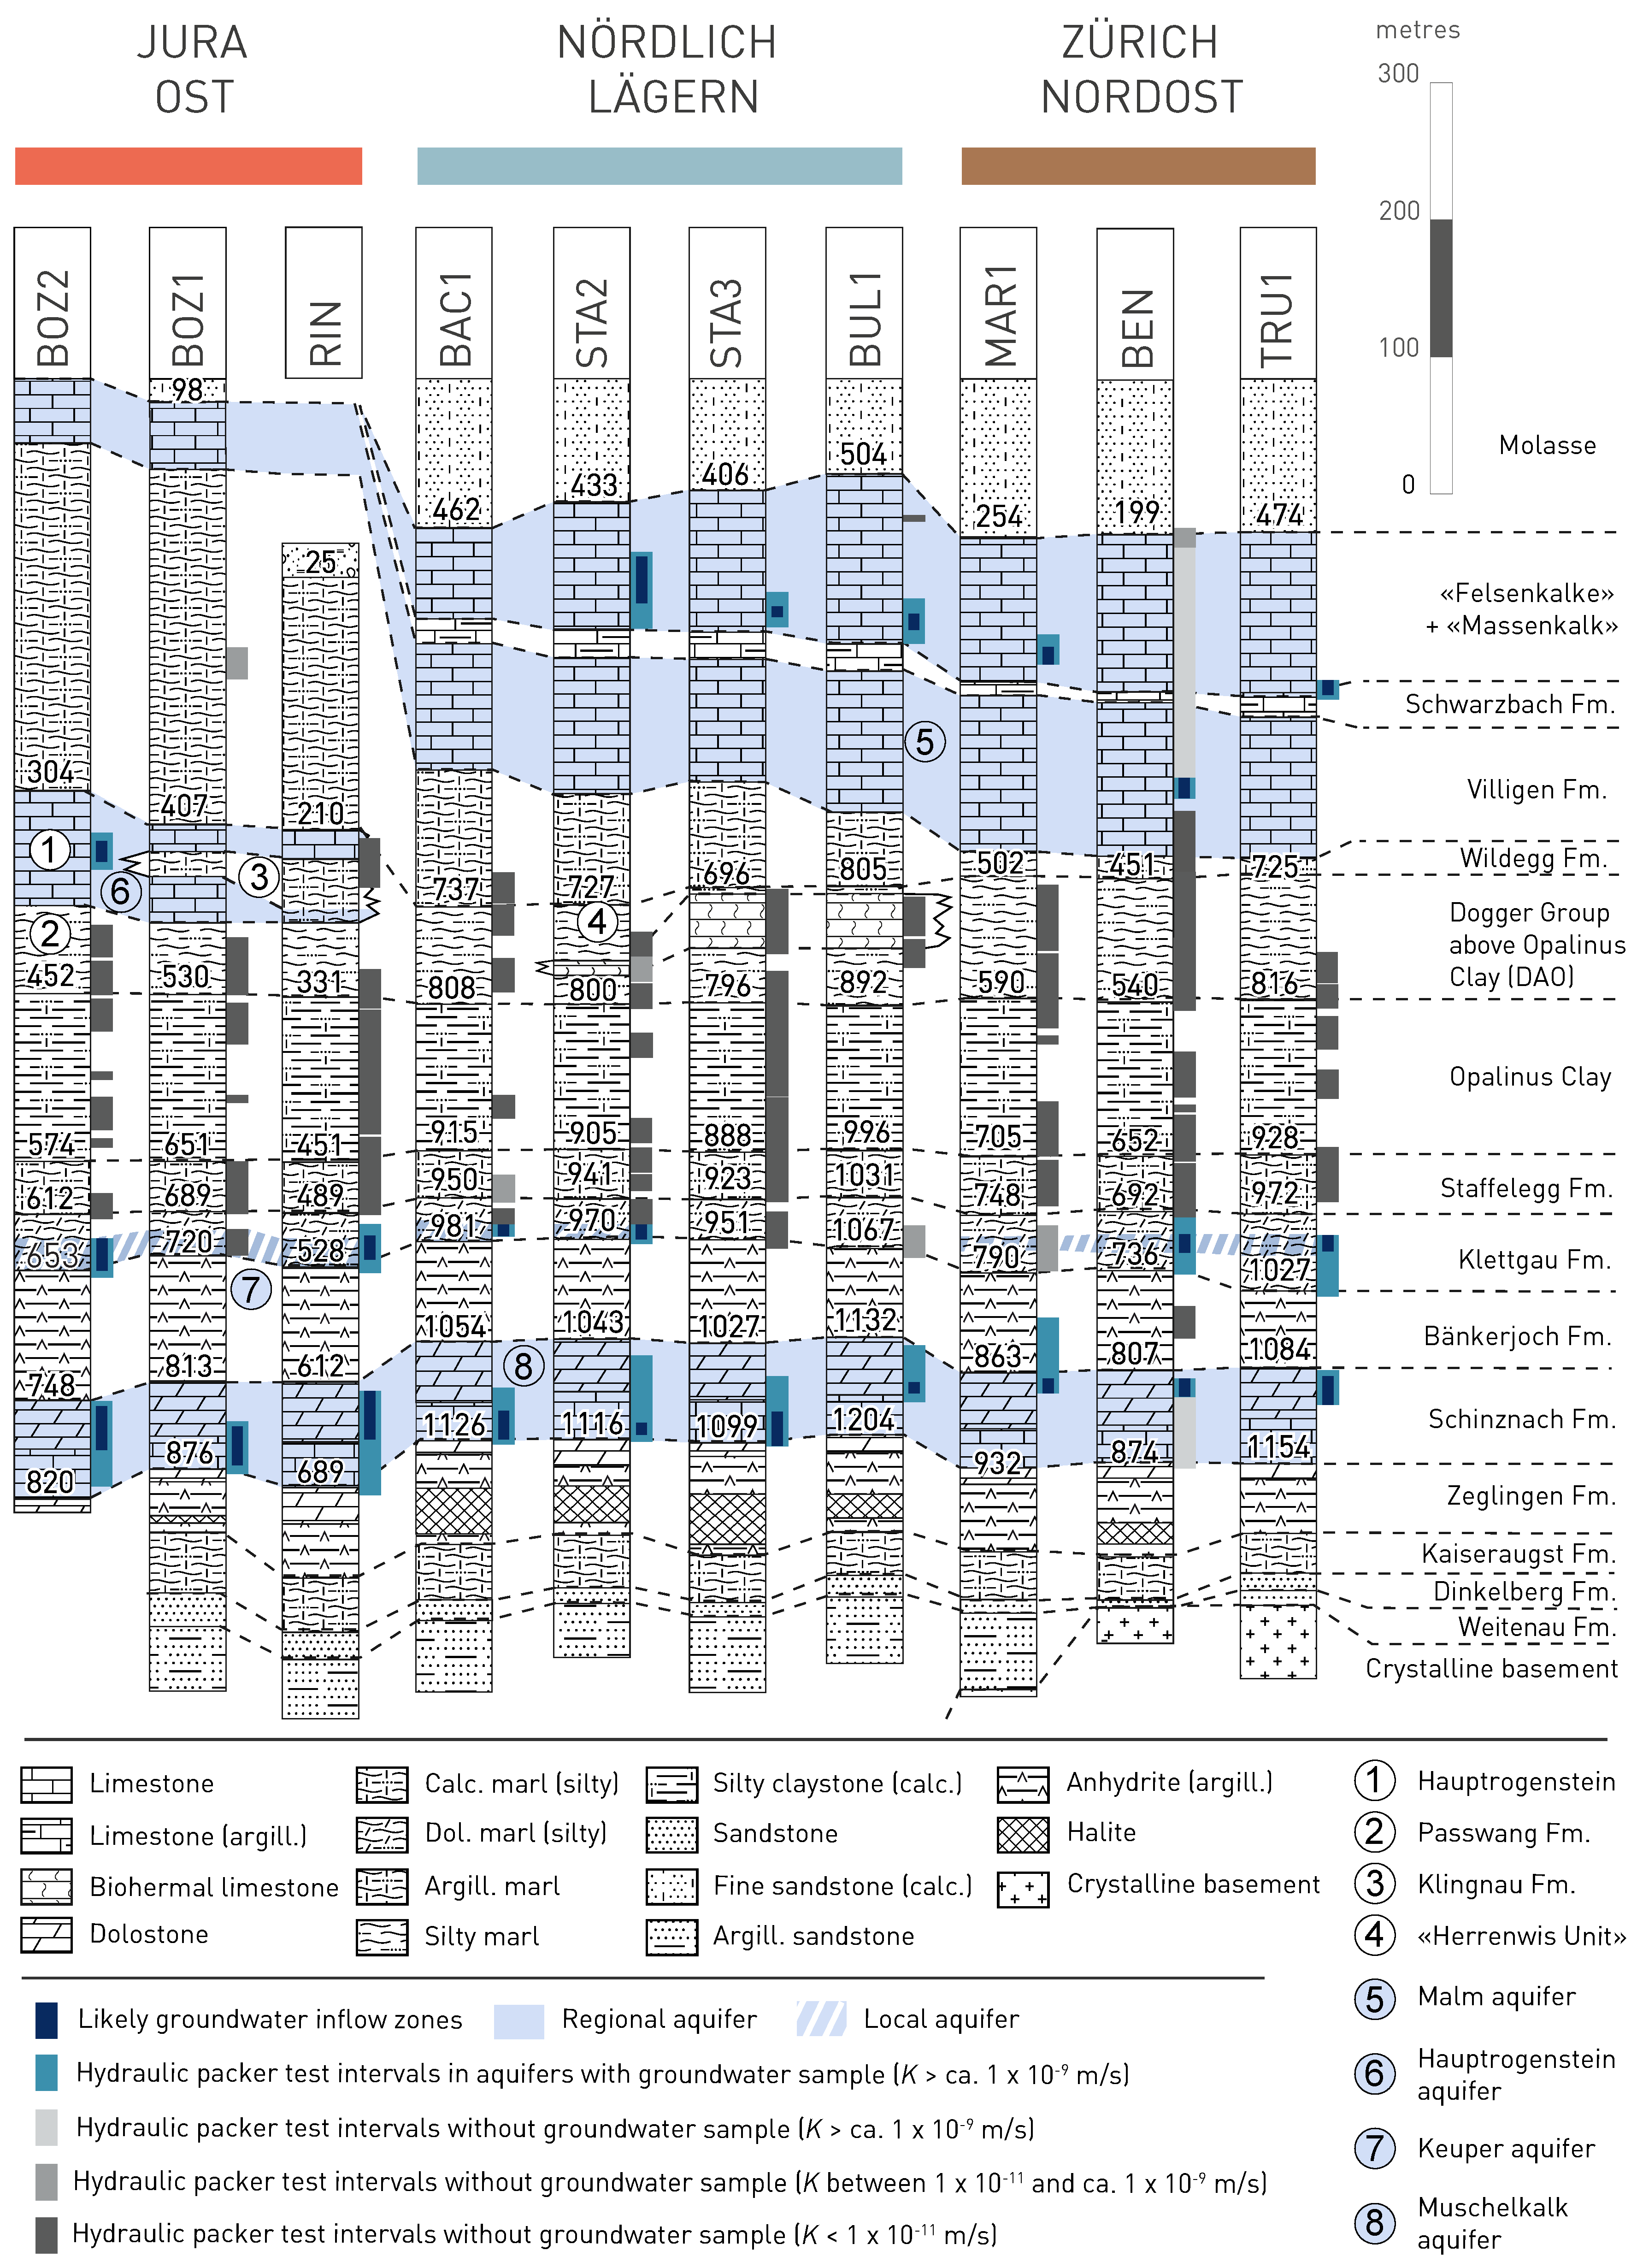
Fig. 4‑85:Hydrogeological correlation of key boreholes with summarised results of hydraulic packer tests and location of regional and local deep aquifers
Correlation of the Keuper aquifer in JO and ZNO additionally takes profiles of natural tracers into account (see Section 4.5.3.10 for details). The likely groundwater inflow zones within the test intervals were identified based on e.g. drilling fluid losses, observations on drill cores and image logs or – where available – on fluid logging.
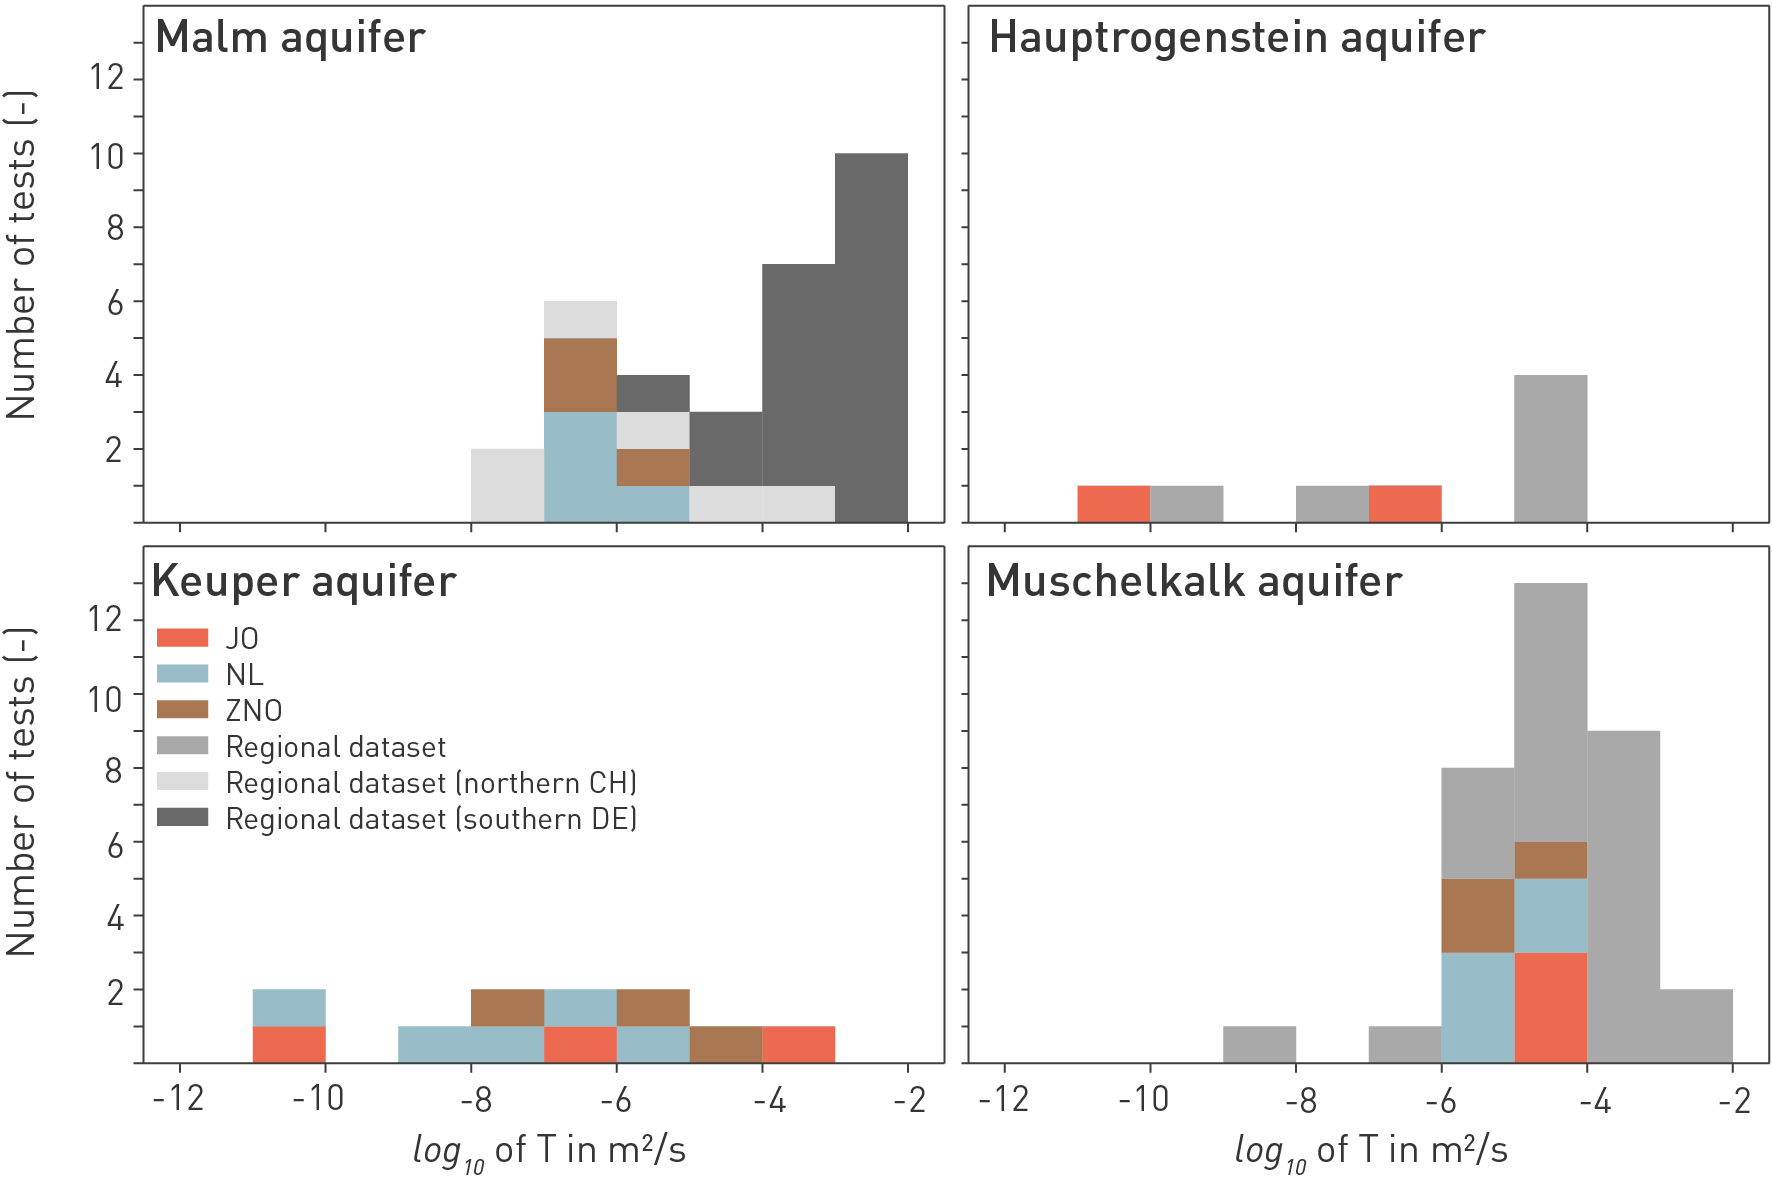
Fig. 4‑86:Histogram of the transmissivities measured in the aquifers
The displayed dataset of the regional aquifers includes results of hydraulic tests carried out inside and outside the siting regions. The latter is referred to as the regional dataset. For the Keuper aquifer, test data from the siting regions are shown. The highest transmissivity is shown for boreholes where more than one test per hydrogeological unit was performed (e.g. to estimate properties of different members of the Klettgau Formation). Note the large variability of the transmissivities for the local Keuper aquifer, particularly compared to the regional Muschelkalk aquifer.
The Malm aquifer relates to the thick limestone units above the Wildegg Formation, that is the «Felsenkalke» and «Massenkalk» and the Villigen Formation. The latter formations are separated by the marly Schwarzbach Formation (Fig. 4‑85, see also Section 4.2.9). The upper limit of this hydrogeological unit is defined by the Eocene Siderolithic Group and the Lower Freshwater Molasse Group (USM).
The hydrogeological definition of the vertical extent of the Malm aquifer unit comes mainly from outcrop observations in the Internal Jura, in Canton Schaffhausen and in the Swabian Alb area of Southern Germany. Here, the aquifer can have a high hydraulic conductivity and a large vertical extent because of the structural overprint and karstification. The extent of karstification depends on many aspects and is known to decrease with depth and with overburden of Molasse (e.g. Plum et al. 2008).
The situation below the thick Molasse cover, notably in the siting regions ZNO and NL, is different. Here, the units were affected by karstification during the Eocene (Chapter 3). Such palaeokarst features are typically filled with clay-mineral-rich sediments and can be observed several decametres into the limestones. This palaeokarst seems hydraulically not relevant today (e.g. BUL1 borehole hydrotest, Fig. 4‑87) but a locally incomplete filling of the palaeokarst by siderolithic clay cannot be excluded. The thick cover of Molasse units currently prevents further karstification. In this zone, water flow is essentially restricted to fractures.
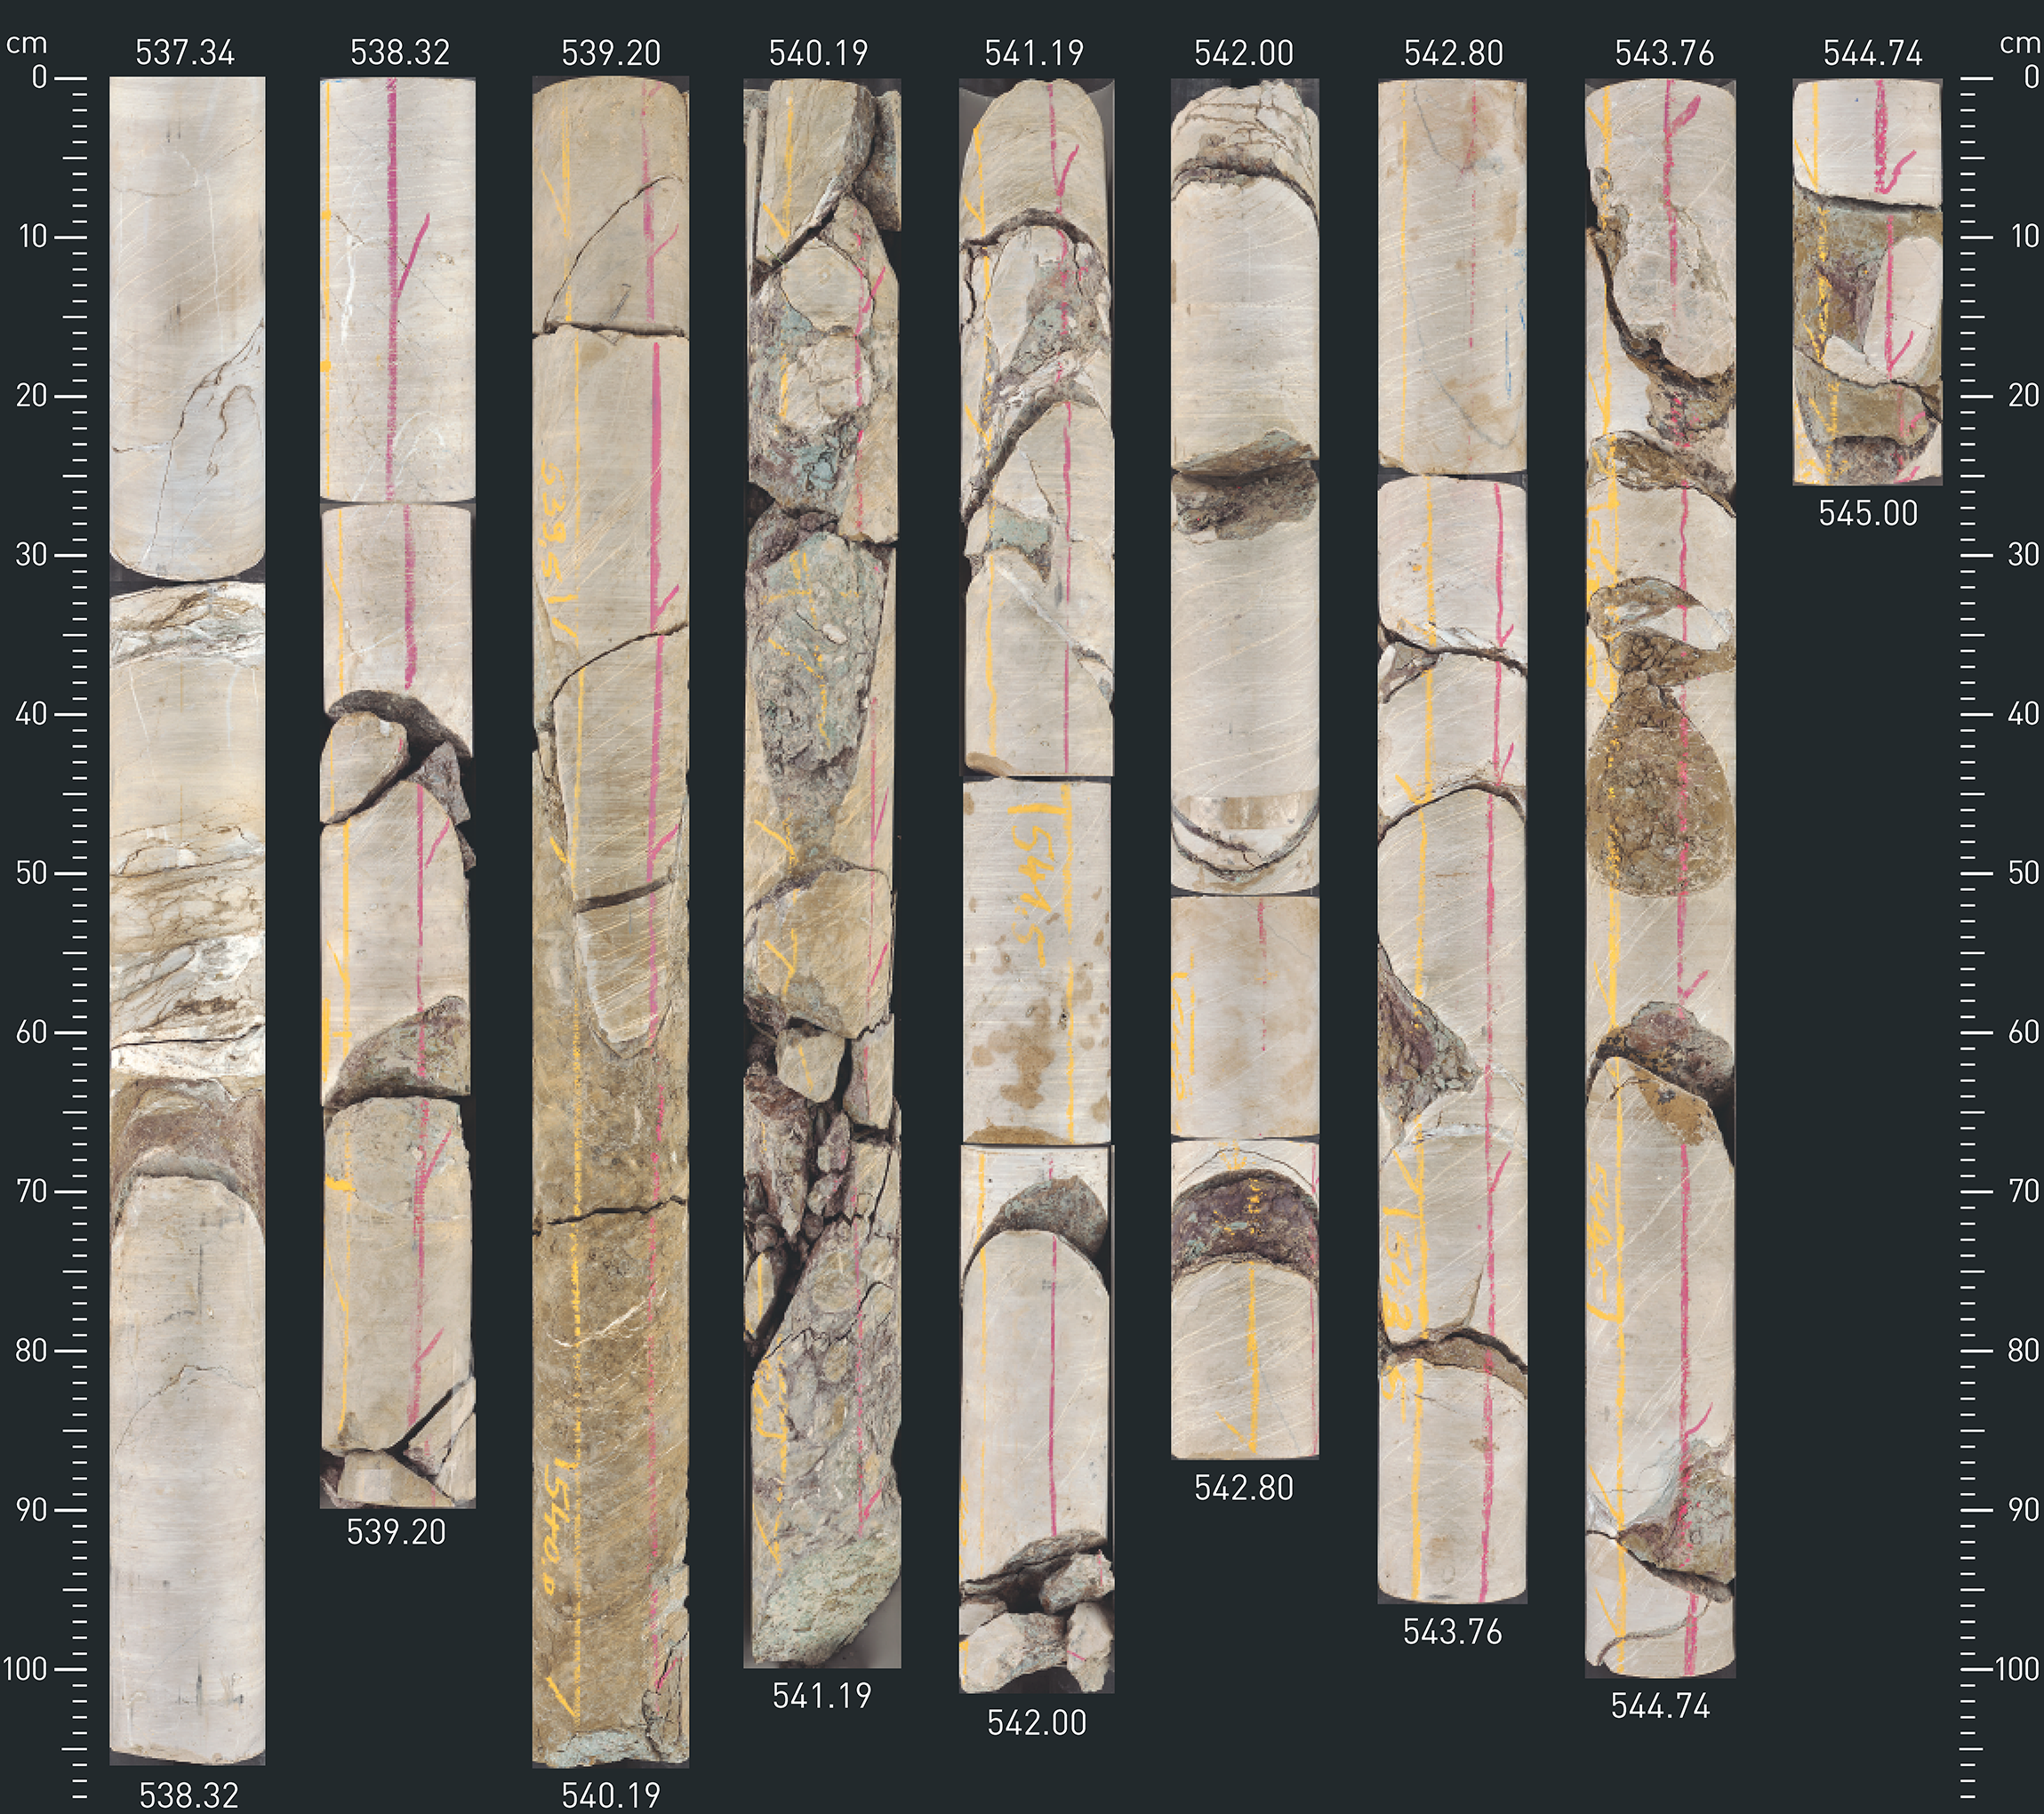
Fig. 4‑87:Drill core pictures from the hydraulic test interval in the «Felsenkalke» and «Massenkalk» of the BUL1 borehole
Hydraulic test BUL1-1-MAL1 (537.2 – 545.0 m) yields low T of 1 × 10-11 m2/s (K = 2 × 10-12 m/s). Test interval includes limestone with silty-clay-filled palaeokarst voids with a tectonic overprint (see also Nagra (ed.) 2021a, Dossier V).
Tectonic overprint and recent karstification close to the surface are probably the dominant features affecting the regional distribution of hydraulic conductivity (Fig. 4‑88). In addition, the Malm aquifer is partly composed of sponge algae reefs in which cavernous dedolomite is encountered (e.g. Plum et al. 2008, Stober et al. 2013). On the regional level, the differing relevance of these features results in a scatter of around six orders of magnitude in the hydraulic properties (Fig. 4‑86, Fig. 4‑88).
In the siting regions in Northern Switzerland, these rocks consist in many cases of almost pure calcite. The dolomite/ankerite component is typically below a few wt.-% and is more commonly detected in the Villigen Formation. Pyrite contents are low, with a trend to somewhat higher values in the marly sections (rarely exceeding 1 wt.-%).
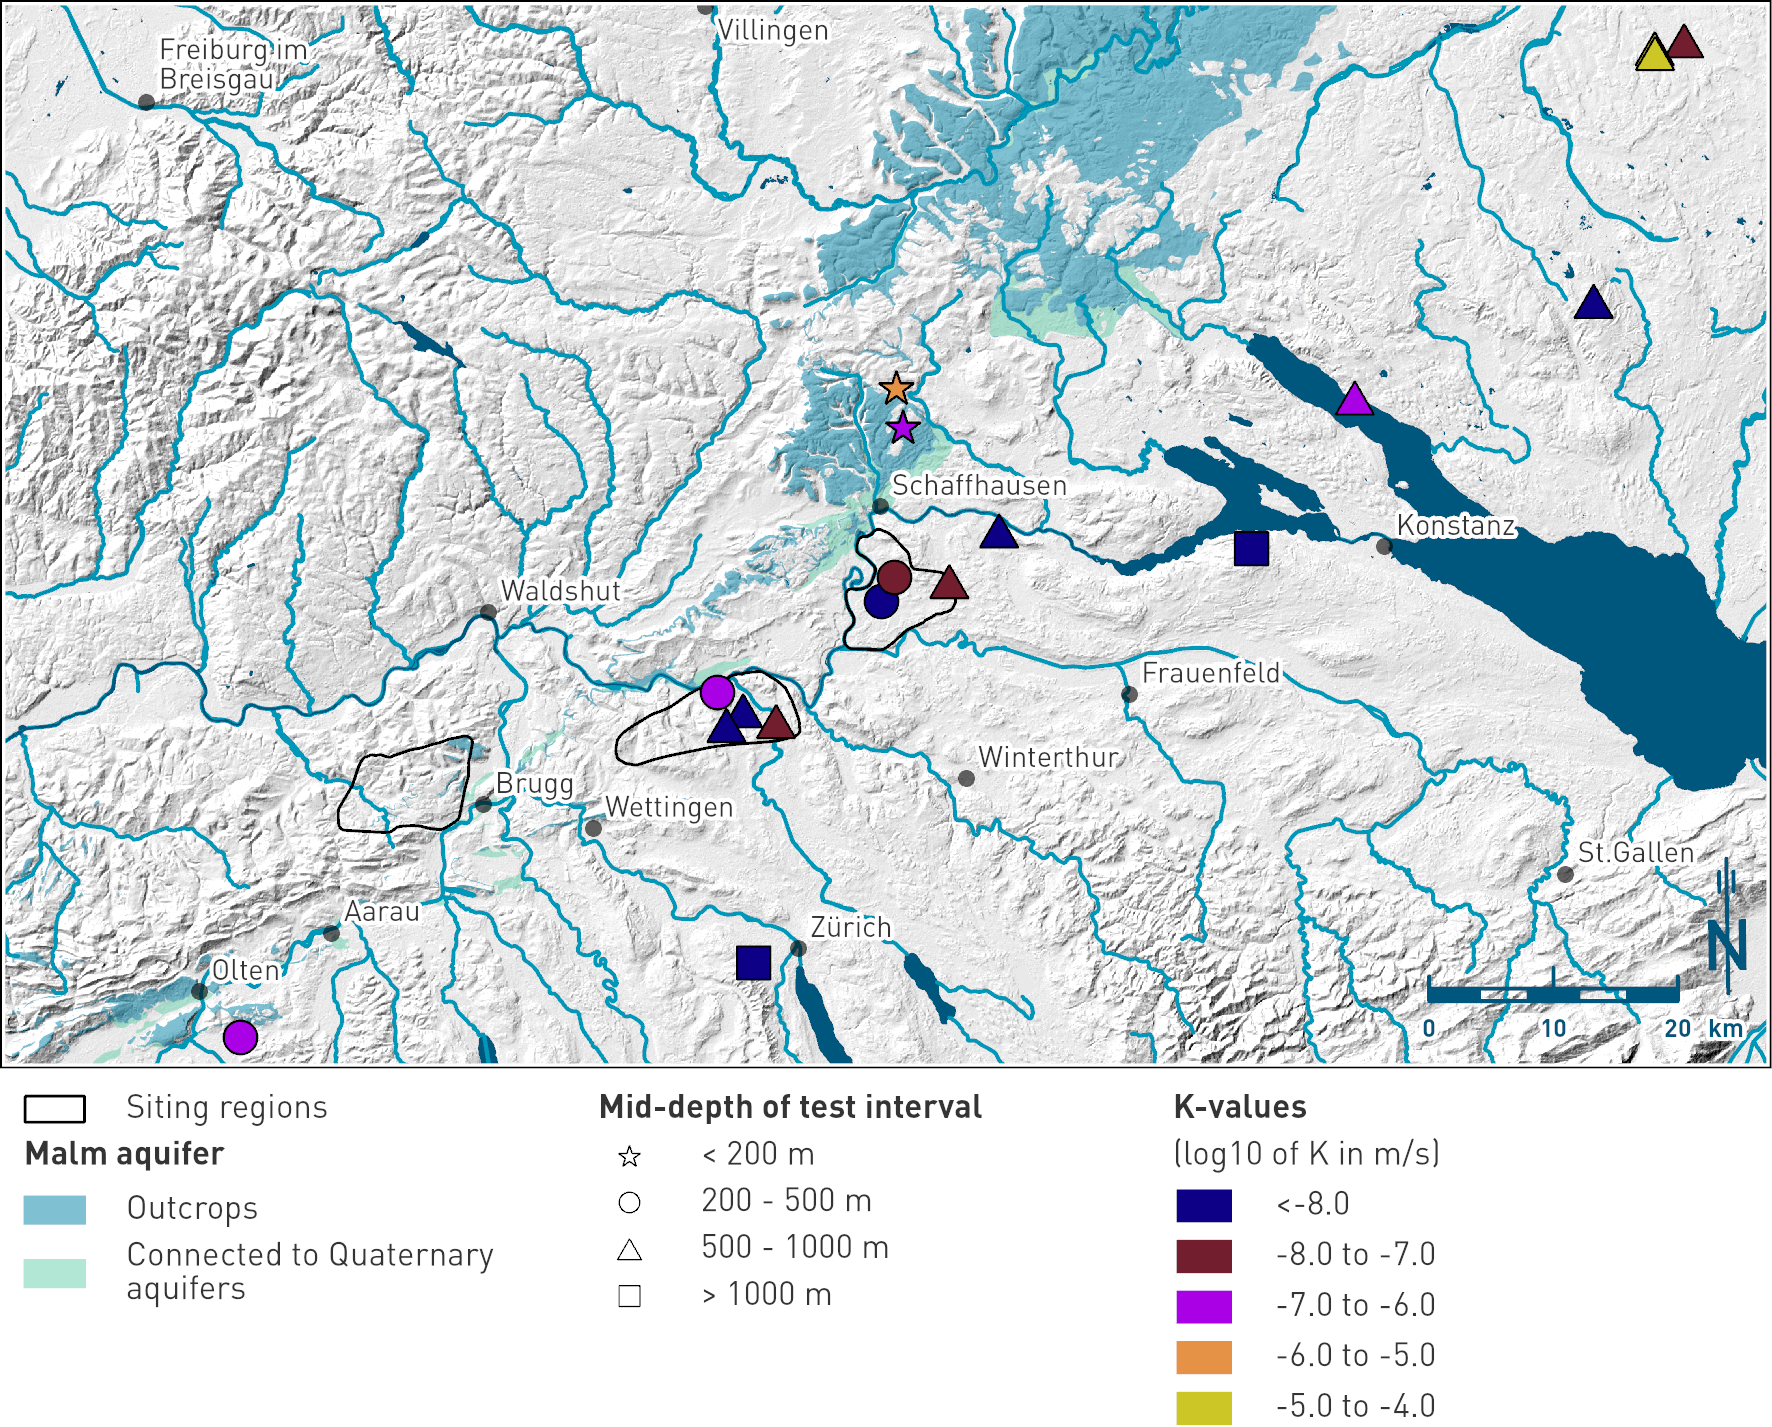
Fig. 4‑88:Hydraulic conductivities from in-situ hydraulic tests in the Malm aquifer in Northern Switzerland and Southern Germany
The length of the test intervals varies between < 10 and > 100 m. The displayed dataset includes results of hydraulic tests performed in closed intervals as well as in open boreholes.
In the majority of the TBO boreholes in NL and in ZNO, fluid logging was carried out over the major parts of the Malm aquifer. These allow the transmissive sections to be localised and quantified as well as a comparison with the structural inventory from the drill cores and from the image logs. The investigations show highly localised groundwater flow related to fractures. The results of the fluid logging also served to position the packers for the hydraulic tests (that included the aim of sampling groundwater). The majority of the most transmissive sections were identified in the «Felsenkalke» and «Massenkalk», that is above the marly Schwarzbach Formation (Fig. 4‑85). This suggests that the water flow may be related to solution-enhanced fracture networks that developed above the Schwarzbach Formation, most likely at the time of palaeokarst formation. However, the hydraulic packer tests in the NL and ZNO siting regions indicate, compared to the regional dataset and to the Muschelkalk aquifer (Section 4.5.3.12), relatively low hydraulic conductivities with typical values around 10-8 m/s. This is consistent with the much higher residence times of the Malm groundwaters in comparison to the Muschelkalk groundwater (Section 4.5.5). In contrast to the fractured zones, the matrix is characterised by low porosity (Fig. 5‑10) and low hydraulic conductivity.
The Malm aquifer exists in part of the JO siting region at shallow level. It is not discussed in this report because the focus in JO is on the Hauptrogenstein aquifer which is closer to the host rock.
The Wildegg Formation is subdivided into the Birmenstorf Member and the much thicker Effingen Member (Section 4.2.8). The latter is considered an aquitard of regional extent with strongly decreasing thickness from the west (more than 200 m in JO) to the east (below 10 m in ZNO) (Fig. 4‑85). It was studied in detail during SGT Stage 2 as a potential host rock for low- and intermediate-level waste disposal in the former Jura-Südfuss siting region (Nagra 2014f, Dossier VI). To the east of the occurrence of the Hauptrogenstein aquifer, in the NL and ZNO siting regions, it is part of the upper confining units of the Opalinus Clay.
The Effingen Member consists of sandy calcareous marls and argillaceous limestone interbeds. The regional packer test dataset of SGT Stage 2 shows hydraulic conductivities < 10-11 m/s at an overburden thickness larger than ca. 300 m (Nagra 2014f, Dossier VI). At shallower depths, higher hydraulic conductivities are measured and indicated by water inflows into tunnels or by groundwater samples. In SGT Stage 2, notably the thicker limestone beds were assessed critically regarding the potentially increased permeability related to tectonic overprint (lack of self-sealing properties).
In SGT Stage 3, the hydrogeological database for the Effingen Member was complemented in view of its contribution as a confining unit by packer tests (Fig. 4‑85), fluid logging partly covering this unit and by the profiles of natural tracers (Section 4.6). The investigations confirmed the generally low hydraulic conductivities, e.g. expressed by the absence of relevant excursions in the profiles of the natural tracers. A transmissive zone was detected related to the tectonic overprint of the most prominent limestone bed (Gerstenhübel Bed; Section 4.2.8) at around 310 m depth in BOZ1; the transmissivity of 3 × 10⁻⁸ m2/s is well within the values expected in SGT Stage 2. Note that the thickness of this limestone bed strongly decreases towards the east (BOZ1 ~ 37 m, BAC1 ~ 6 m).
The Birmenstorf Member is a thin carbonate-rich horizon located at the base of the Wildegg Formation. In Northern Switzerland, its thickness decreases from west to the east (e.g. OFT ca. 15 m, BOZ2 ca. 4 m, BAC1 0.7 m, TRU1 ca. 2.6 m) and the lithofacies changes. In the NL and ZNO siting regions it occurs at depths greater than 500 m and is dominated by marly lithologies. In this area, there is no indication of water flow in this unit, and it is part of the natural barrier. In contrast, it occurs in the Aarau – Solothurn area as a much thicker limestone (with sponges or sponge bioherms). In the Internal Jura, the Birmenstorf Member is an aquifer at shallow depth (e.g. Herold 1997) and in boreholes in the Aarau and Gösgen area groundwater could be sampled up to ca. 340 m depth.
The Dogger Group above the Opalinus Clay is characterised by contrasting lithologies (Section 4.2.7). There is an important vertical variation along individual boreholes and there are also lateral facies changes between the different boreholes. In this section, the mostly clay-mineral-rich units of the Dogger Group above the Opalinus Clay are discussed. The Hauptrogenstein aquifer and the «Herrenwis Unit» are presented in separate sections.
For the NL and ZNO siting regions, this unit refers to the clay-mineral-rich «Brauner Dogger» studied in detail during SGT Stage 2 (Nagra 2014f). With the new TBO boreholes, the hydrogeological dataset was substantially complemented, notably by hydraulic packer testing (see also Section 5.6) and by investigations of natural tracers in the porewater (Section 4.6). The hydraulic conductivities from the boreholes within the siting regions are very low (< 10-11 m/s; Fig. 4‑85)11 and the profiles of the natural tracers in the porewater show no anomalies. That is, these units are part of the zone with diffusion-controlled transport and thus additionally contribute to the geological barrier. This is particularly robust in the eastern part of the NL siting region where the section below the «Herrenwis Unit» is characterised by high clay-mineral contents ensuring substantial self-sealing behaviour (Fig. 4‑33). In ZNO, the clay-mineral contents in the section above the Opalinus Clay are significantly lower but, at the resolution of the geophysical logs (ca. 0.4 m), are in a range where some self-sealing limits the transmissivities of fractures (Sections 5.2.3 and 5.6.3.2). Here, the Wedelsandstein Formation is characterised by a layered sequence of clay-mineral-rich sediments and thin so-called "hard beds" consisting of silty to sandy limestones (Section 4.2.7). The hydraulic significance of the latter was controversially discussed in SGT Stage 2 (Nagra 2014f) and was of particular interest in the TBO investigations. The new investigations do not provide evidence for hydraulically active fracture networks or a permeable matrix. The low hydraulic conductivities indicated from the in-situ tests and from matrix tests (Section 5.6) can be explained by cementation of these "hard beds" giving rise to particularly low porosity (example shown in Fig. 4‑89). Above the Wedelsandstein Formation in ZNO, the clay-mineral-rich section (Fig. 4‑85) comprising the «Parkinsoni-Württembergica-Schichten» and the Variansmergel Formation constitutes a caprock of significant thickness (Section 4.2.7).
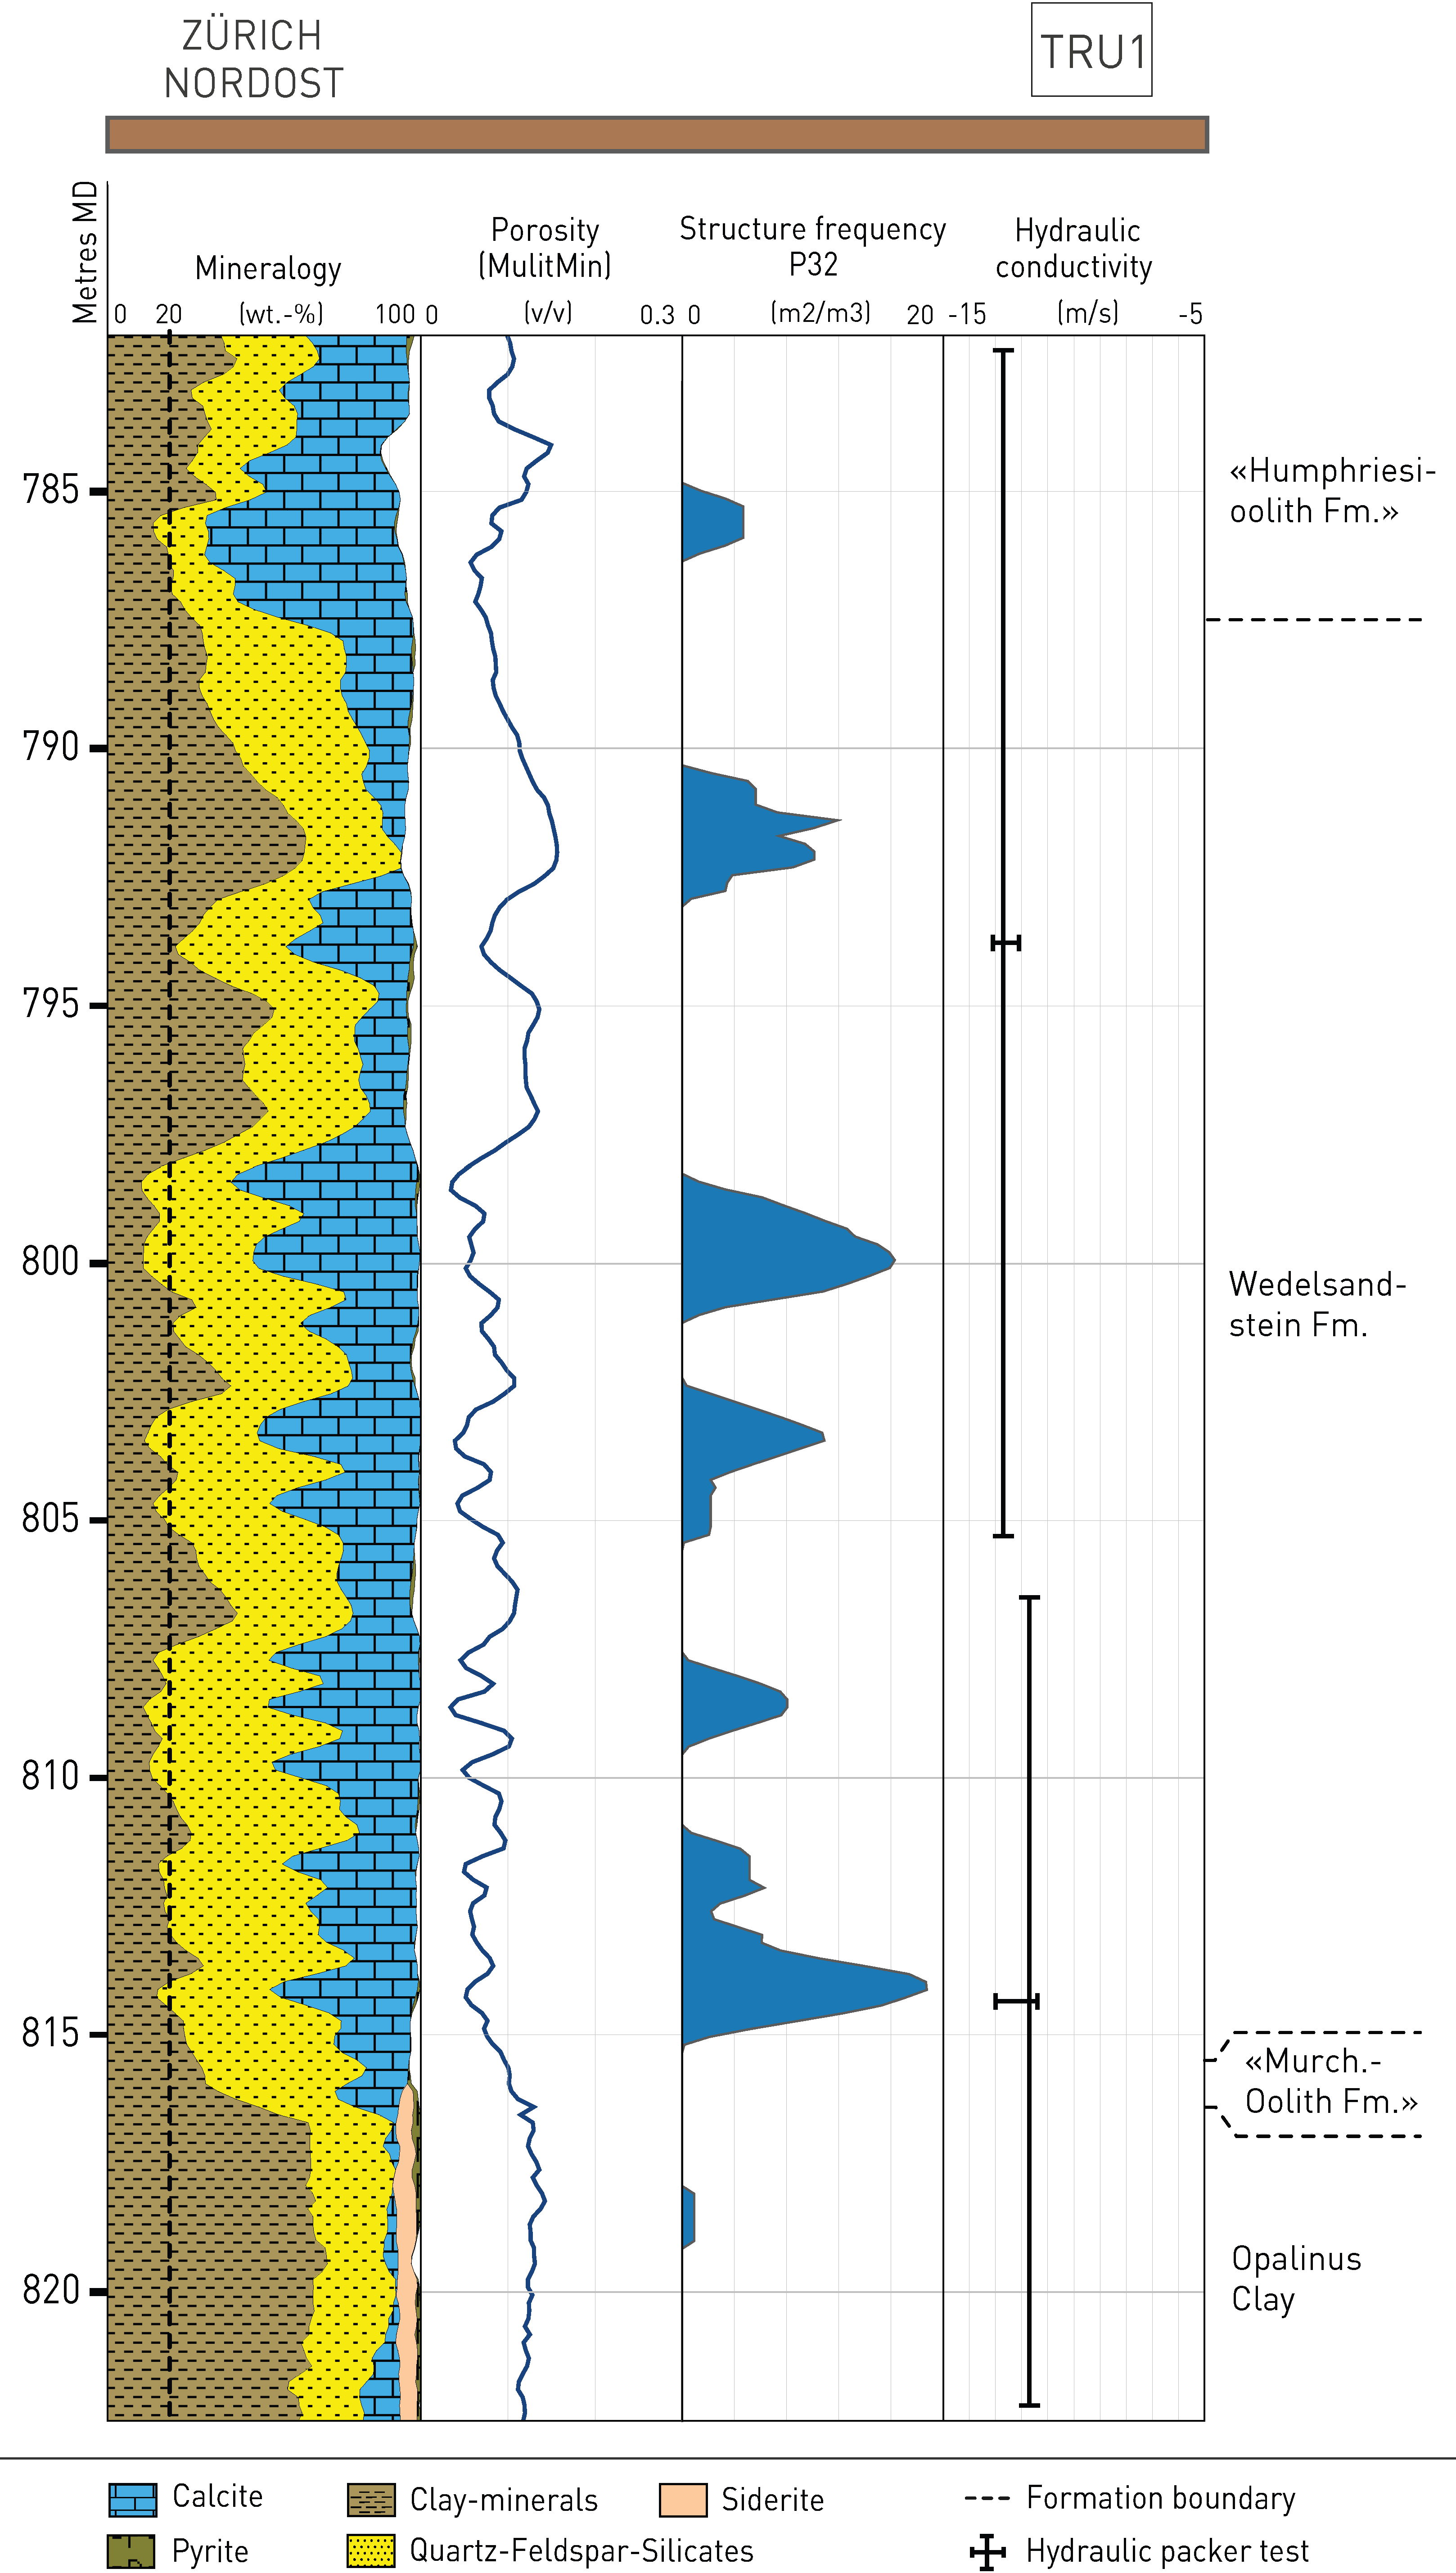
Fig. 4‑89:Profile of the Wedelsandstein Formation in the TRU1 borehole: mineralogical composition, porosity, structural inventory and hydraulic conductivity
The black dashed line (20 wt.-% clay content) is used to highlight the clay-poor intervals. Sections poor in clay minerals ("hard beds") are characterised by low porosity. The hydraulic conductivities are very low despite the partly low clay-mineral contents and the increased structure frequency.
In JO, the Passwang Formation is located between the Opalinus Clay host rock and the Hauptrogenstein aquifer. It has some similarities to the Wedelsandstein Formation in ZNO in terms of a succession of clay-mineral-rich sediments with interlayered "hard beds" (Section 4.2.7). The low hydraulic conductivities (Fig. 4‑85) and the absence of significant excursions in the profiles of the natural tracers (Section 4.6) confirm the aquitard character and that this unit is part of the low-permeability geological barrier. As in the case of the Wedelsandstein Formation in ZNO, the lower clay-mineral contents compared to the equivalent unit in NL below the «Herrenwis Unit» indicate a lower self-sealing potential.
In the BAC1 borehole the section directly above the Opalinus Clay was affected by a drilling-induced fracture. In the SLA1 borehole east of ZNO, a test indicated 1 × 10⁻⁹ m/s. The cause for this increased K value is unclear. ↩
The biodetritic and oolitic limestones of the Hauptrogenstein constitute a fractured and partly karstic aquifer in the Jura Mountains (Jäckli & Kempf 1972). The facies transition towards the clay-mineral-rich Klingnau Formation in the east occurs within the JO siting region (Section 4.2.6), i.e. the Hauptrogenstein is a relevant aquifer only in JO.
A comparatively small dataset is available on the hydrogeological properties (Fig. 4‑86). The highest transmissivities in the range of 10-5 m2/s relate to test depths < 270 m. In the BOZ2 borehole, fluid losses occurred related to a fracture at around 350 m depth (Nagra (ed.) 2022b). The transmissivity of 4 × 10⁻⁷ m2/s allowed groundwater to be sampled (Section 4.5.5.3). This transmissive zone is also nicely expressed in the profiles of the natural tracers in porewater (Section 4.6). In the BOZ1 borehole, only a minor inflow zone was detected by fluid logging (2 × 10⁻⁹ m2/s) which is without expression in the tracer profiles. In the easternmost Riniken (RIN) borehole, the Hauptrogenstein is characterised by a low hydraulic conductivity and a reduced thickness (Fig. 4‑85).
Overall, the hydraulic properties mirror the facies change from west to east. The eastern limit of the Hauptrogenstein aquifer is only vaguely defined.
The «Herrenwis Unit» occurs only in the eastern part of NL, as a ca. 40 m thick isolated carbonate platform that is embedded into clay-mineral-richer units above and below and also laterally (Section 4.2.7, Fig. 4‑41). This unit is characterised by a substantial variability along the boreholes and also within an individual core section (Fig. 4‑36). At the CT-scan scale, carbonate and clay-mineral-rich zones can be identified and isolated macroporosity can be shown (Fig. 4‑90). These observations and the complex internal architecture of this unit show that a substantial variability of matrix permeability must be expected.
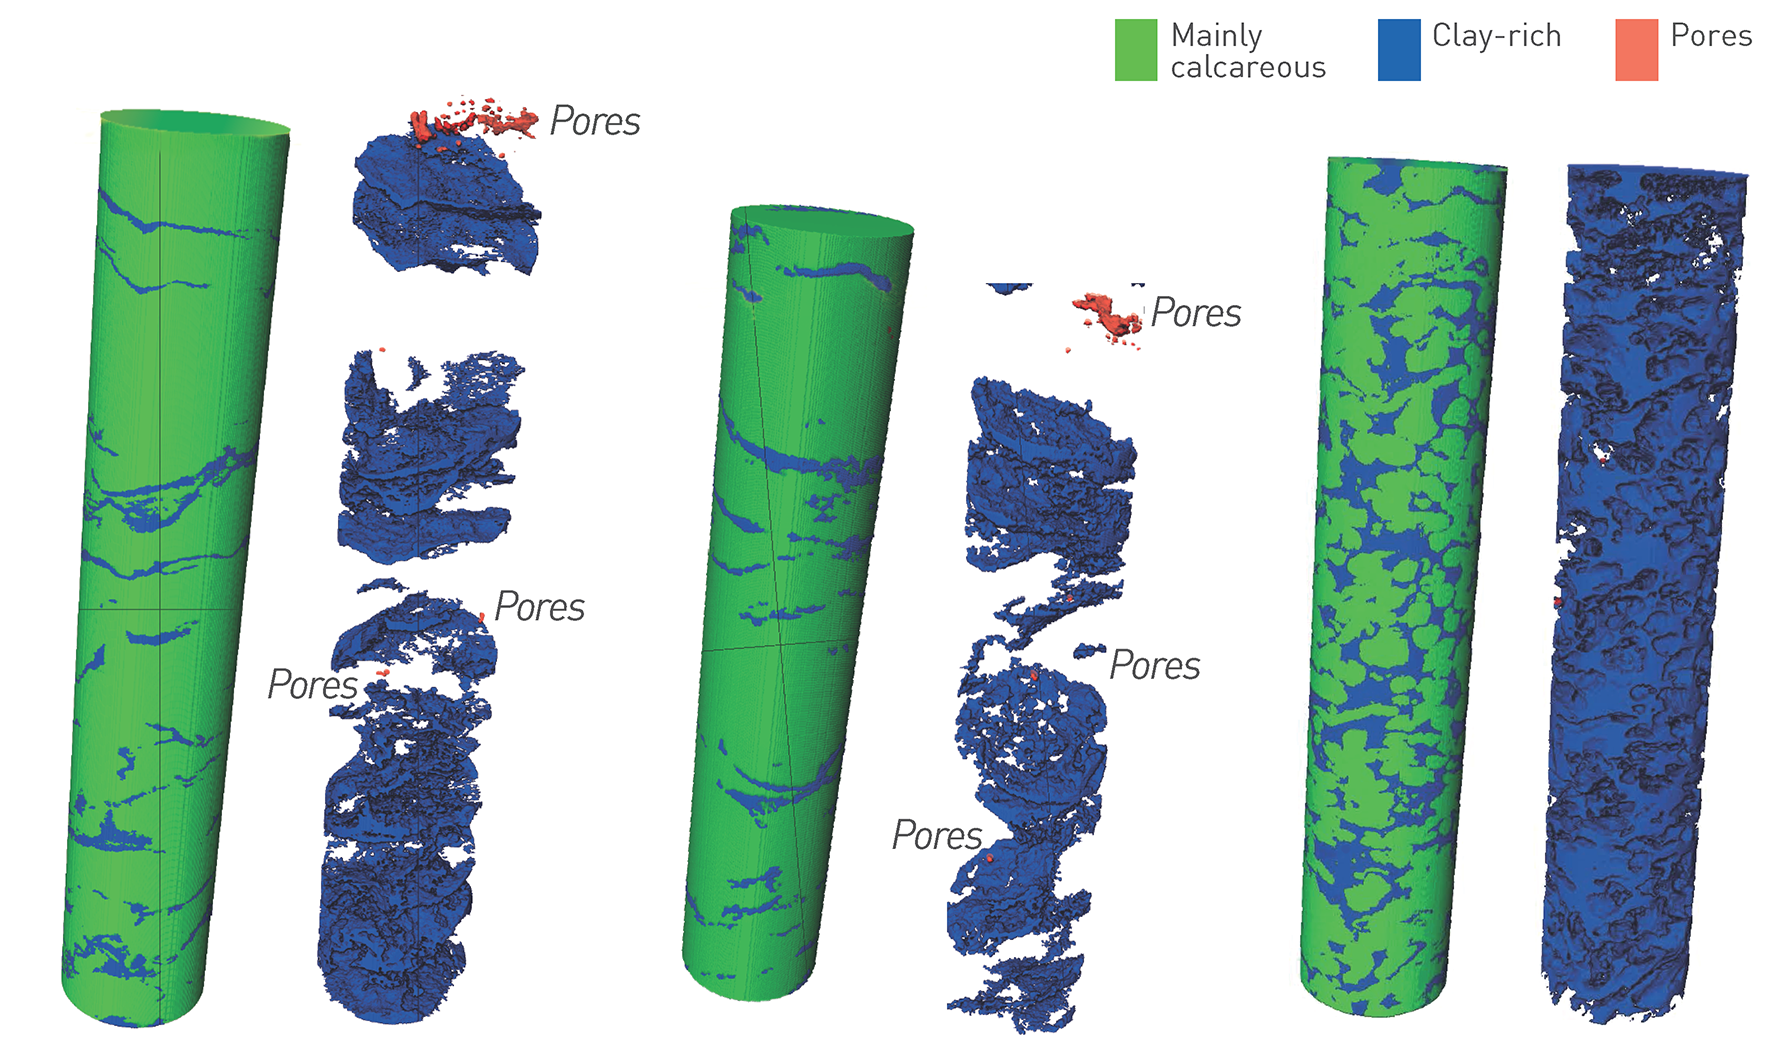
Fig. 4‑90:«Herrenwis Unit» of the BUL1 borehole: CT-scan-based visualisation of mainly calcareous and clay-mineral-rich zones and macropores
Drill core diameter is 95 mm. Displayed are core samples BUL1-1 816.60 GM, BUL1-1 818.55 GM and BUL1-1 842.10 GM (number denotes the depth of the top of the core section).
The hydraulic conductivities from the in-situ testing in the BUL1 and STA3 boreholes are very low (< 10-11 m/s;Fig. 4‑92). This probably relates to the burial history (mechanical and chemical compaction) and the absence of relevant dolomitisation or of dissolution-enhanced hydraulic conductivity. A higher conductivity was observed related to a sub-vertical joint (Fig. 4‑92) in the basinal part (periplatform wedge, Section 4.2.7) drilled by the STA2 borehole (3 × 10⁻¹⁰ m/s). Hydraulic heads lower than the potential discharge area (Fig. 4‑91) are a strong argument in support of the hydraulically isolated nature of the «Herrenwis Unit» (for a detailed discussion see Section 5.6.5). The profiles of the natural tracers in porewater, in particular Cl and Br, are affected by increased scatter in this heterogeneous low-porosity unit. The profiles of the stable isotopes, the Br/Cl ratio and 4He that are considered most robust in this unit do not show significant excursions (Section 4.6).
To conclude: The «Herrenwis Unit» is an isolated carbonate platform embedded in clay-rich rocks. There are no indications of an active aquifer, e.g. it has no direct recharge or discharge areas. Hydraulic conductivities are low for the tested lithofacies but may be debatable given the heterogeneity of this unit. However, the hydraulic properties of the unit may locally be influenced by tectonic overprint as indicated by the test in the STA2 borehole.
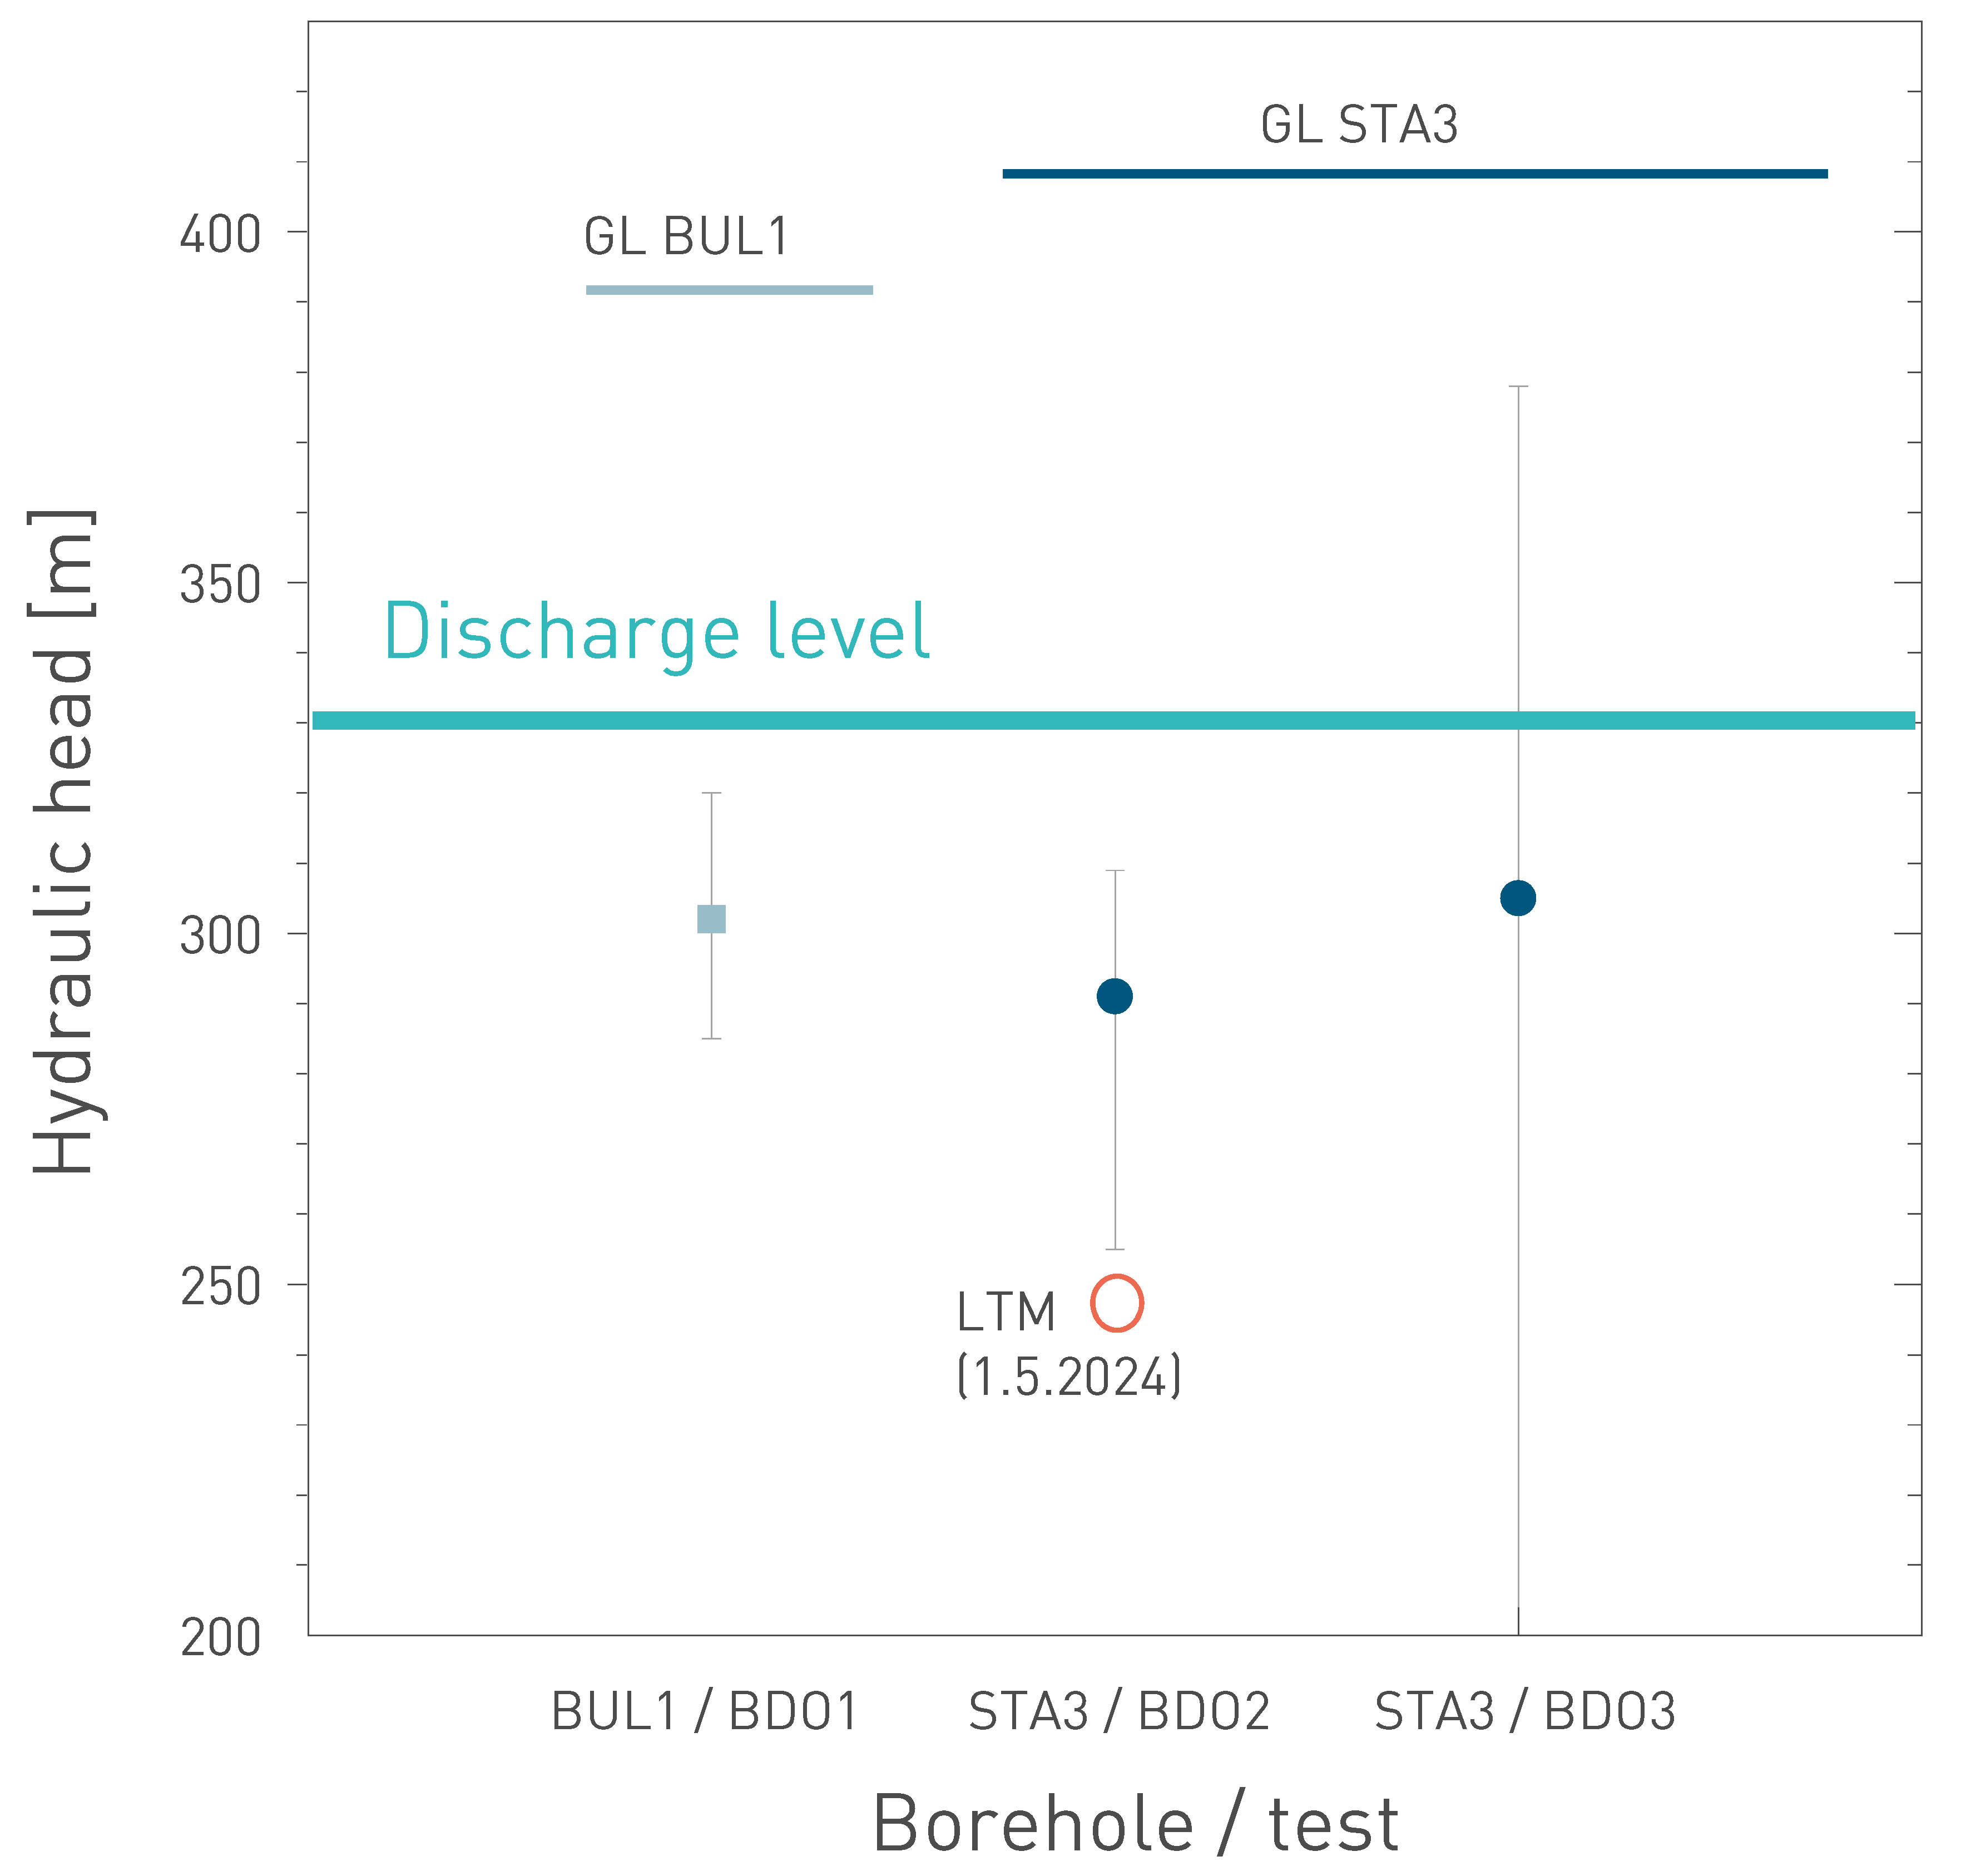
Fig. 4‑91:Hydraulic heads in the «Herrenwis Unit» observed by packer testing and comparison with data from the long-term monitoring system (LTM) in STA3
The data are compared to the ground level (GL) of the drillsites and to the altitude of the potential discharge area along the Rhine River (Section 4.5.3.3, Malm aquifer). The figure shows the results from packer test intervals (almost) completely located within the «Herrenwis Unit». Tests are not shown if the intervals include important parts of other formations (STA2-BDO2, BUL1-BDO2). See also Fig. 4‑85.
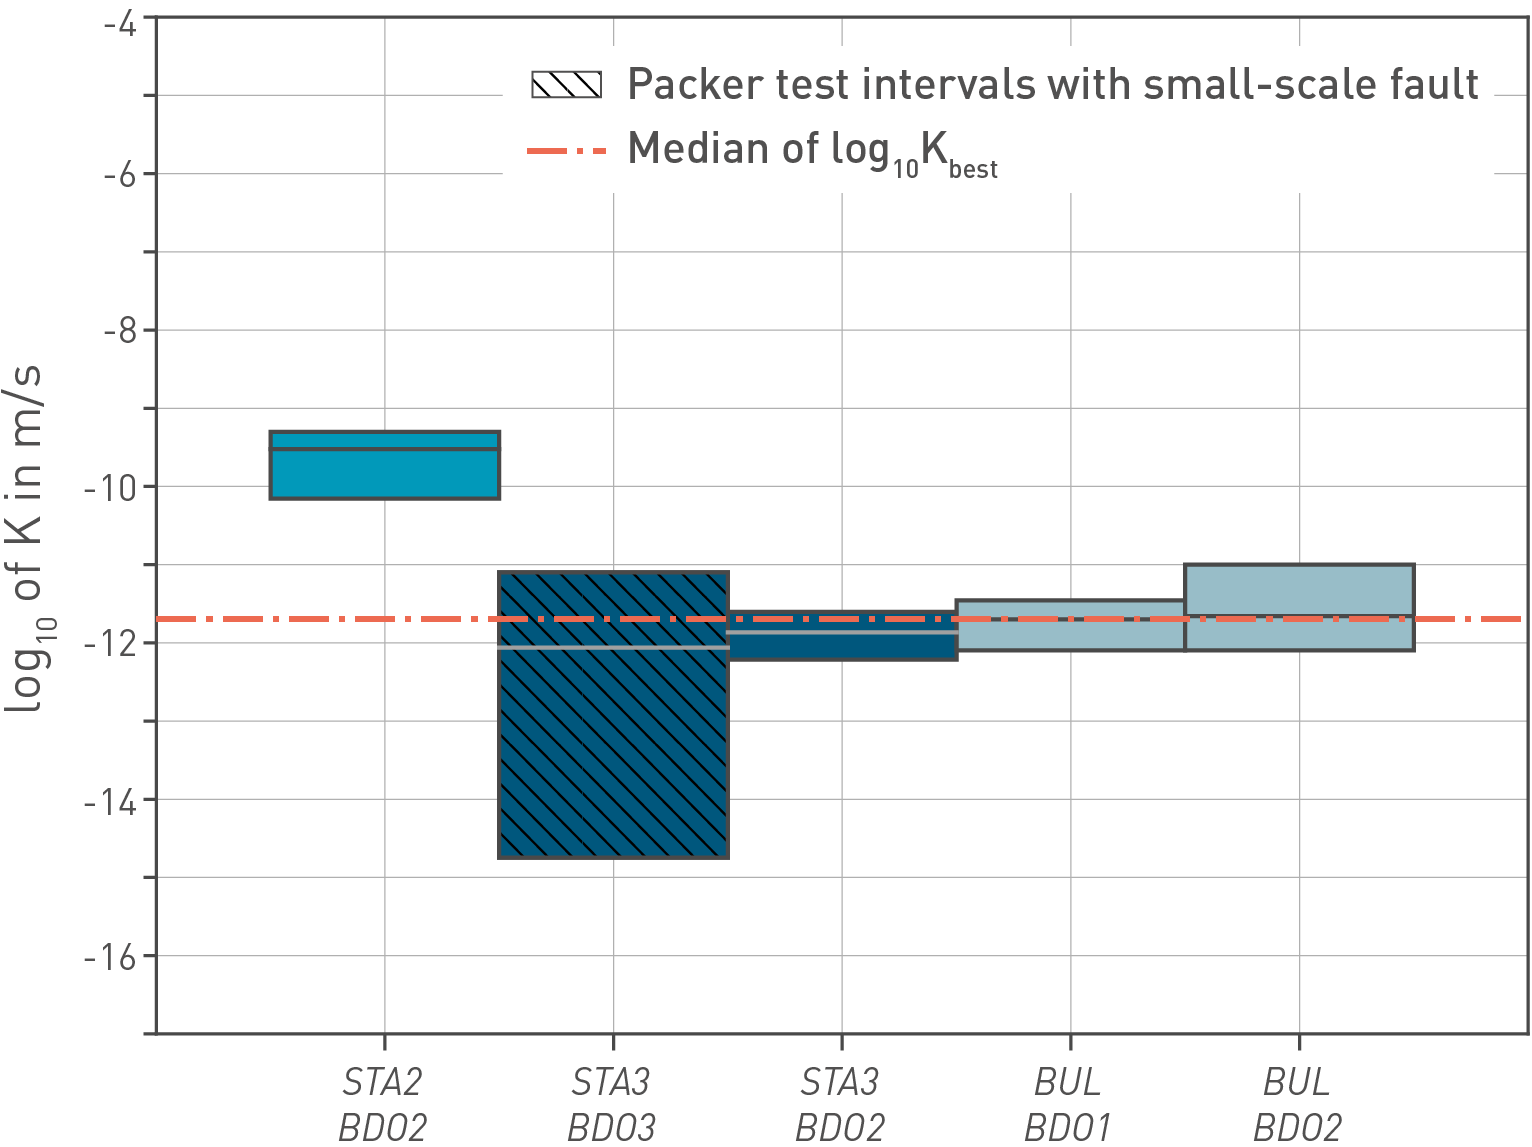
Fig. 4‑92:Hydraulic conductivity from in-situ hydraulic packer tests in the «Herrenwis Unit»
The test interval STA2/BDO2 includes a sub-vertical joint.
The Opalinus Clay constitutes a major aquitard of regional extent in Northern Switzerland that stands out from its confining units for the remarkable uniformity of its mineralogical, petrophysical and hydraulic properties (Section 4.2.6, Chapter 5). Along with adjacent units, the Opalinus Clay is an efficient barrier to flow between the regional aquifers, as supported by hydrogeochemical evidence (Sections 4.5.5, 4.6).
Hydraulic conductivities measured in situ (i.e. from hydraulic packer tests) and in laboratory tests are low (mainly < 10-12 m/s) and vary in a narrow range if the overburden thickness is larger than about 200 m (10-14 to 10-12 m/s for the hydraulic packer tests; Section 5.6). Observations from the boreholes in Northern Switzerland are well supported by hydrogeological investigations carried out in the Mont Terri rock laboratory (e.g. Marschall et al. 2004).
The Opalinus Clay is characterised by its high and uniform clay-mineral content, which is typically well above 40 wt.-% (Fig. 4‑28, Section 5.2). The clay-mineral-rich matrix is fundamental for many properties, notably self-sealing. The in-depth characterisation of the Opalinus Clay is presented in Chapter 5.
This section characterises the hydrogeological unit between the Opalinus Clay and the Keuper aquifer, i.e. the Staffelegg Formation and the uppermost part of the Klettgau Formation (in SGT Stage 2 termed ‘clay-rich Keuper’). The unit includes important lithological variation in the vertical direction but shows good lateral correlation on the regional scale (Section 4.2.5 and partly 4.2.4). The lithologies mainly comprise dolomitic marls, limestone beds with individual thicknesses of less than 5 m and clay-mineral-rich intervals with good self-sealing properties (Fig. 5‑3).
A focus of the in-situ hydraulic testing was on the Staffelegg Formation because of its position directly below the Opalinus Clay (Fig. 4‑85). The observed hydraulic conductivities are generally ≤ 10-11 m/s, with the majority of the best estimate values being < 10-12 m/s (Fig. 4‑93). The comparison with matrix hydraulic conductivities suggests that some tests were affected by fractures. The highest value relates to an interval that includes fractures in the Beggingen Member (BAC1/LIA1 T = 2 × 10⁻¹⁰ m2/s). The low hydraulic conductivities are supported by the absence of relevant anomalies in the profiles of the natural tracers (Section 4.6). These observations show that this unit is part of a low-permeability sequence in which diffusion dominates mass transport.
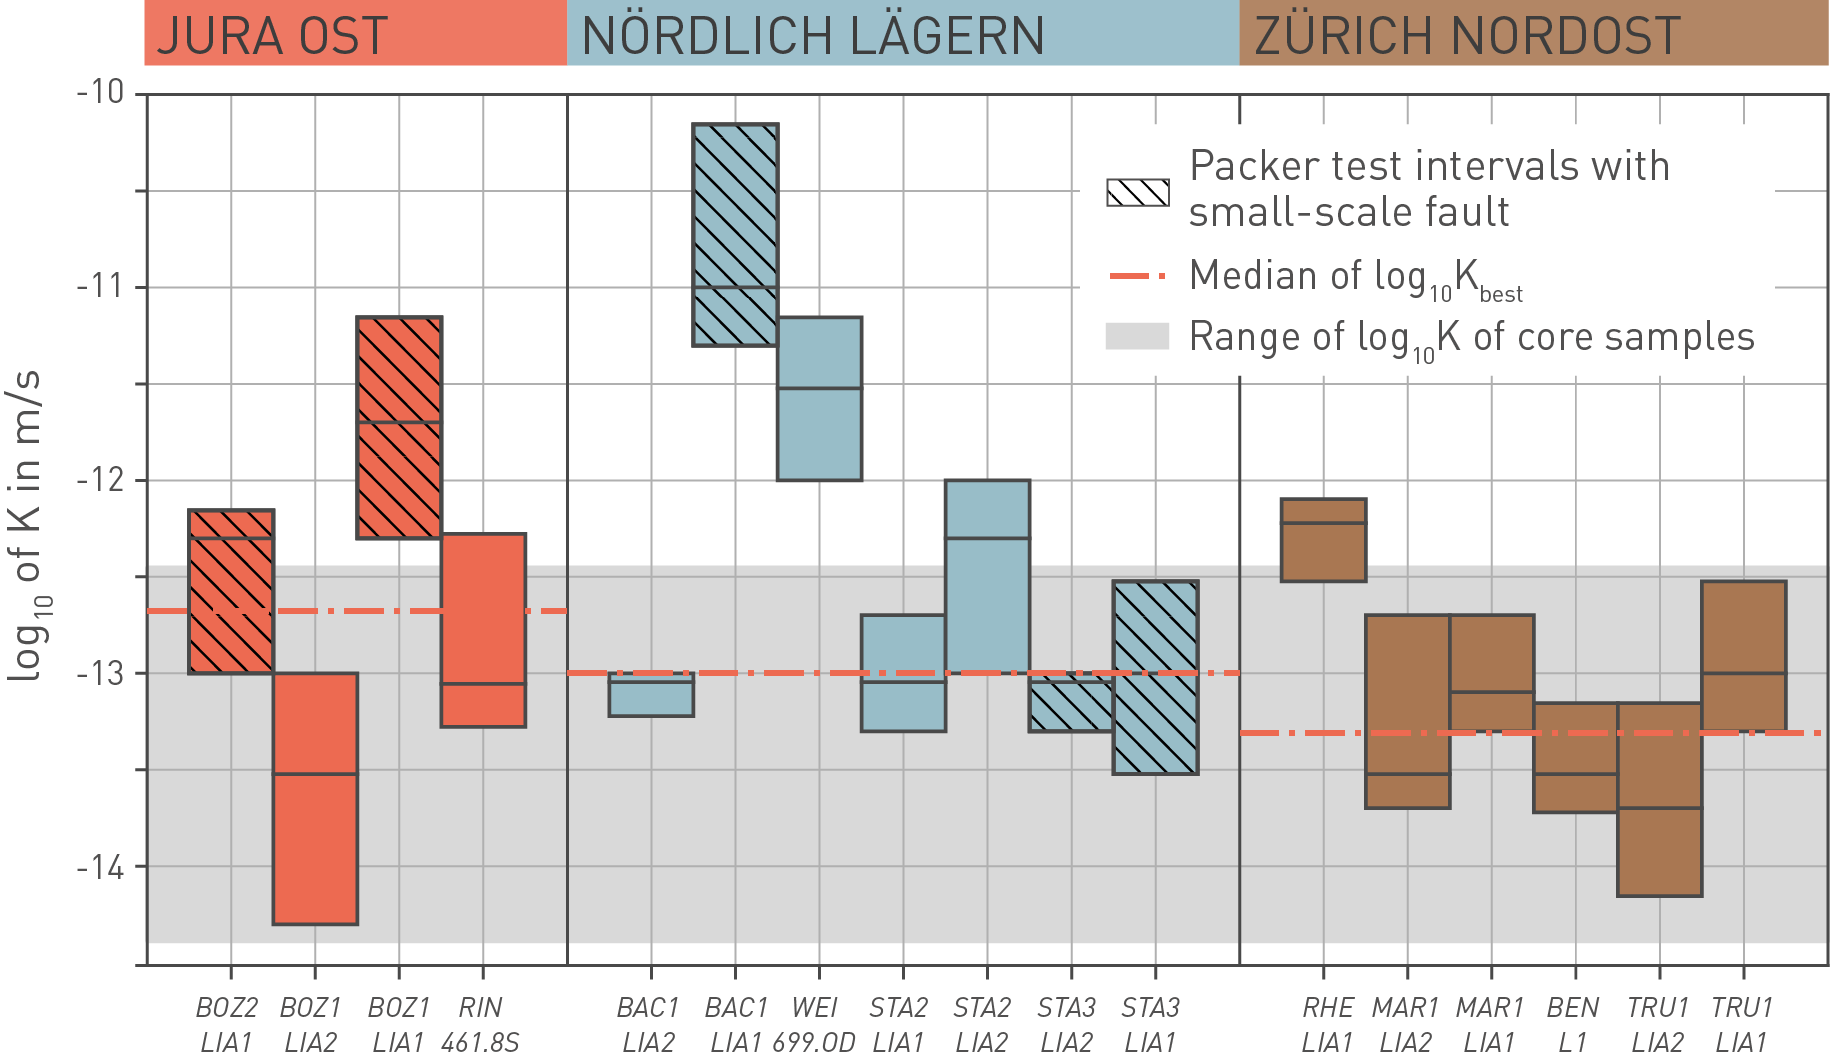
Fig. 4‑93:Results of in-situ hydraulic packer tests in the Staffelegg Formation and comparison to values from laboratory tests on drill cores
The best estimate of the hydraulic conductivity is displayed with a thick black line. The associated uncertainty is shown with the vertical extent of the bars. The range of matrix hydraulic conductivity is shown in light grey (11 measurements).
For the recent TBO boreholes, the figure indicates test intervals that include small-scale faults. Note that no such detailed structural inventory is available for the historical boreholes Riniken (RIN) and Weiach (WEI).
The Keuper Group consists mainly of low-permeability clay-rich rocks and evaporites. Only the Klettgau Formation in its upper part includes some transmissive lithologies. At the time of deposition, the study area was dominated by variable mostly terrestrial depositional environments, resulting in high variability of the deposited sediments and of their thickness (Section 4.2.4, Fig. 4‑15). This variability affects the hydrogeological properties of the potential aquifer units, with a variation of hydraulic test transmissivities over eight orders of magnitude (Fig. 4‑86). To address this variability and to make a distinction from the regional Malm and Muschelkalk aquifers, the term local aquifer is used (Nagra 1988, 2002).
The following section focuses on the potential aquifer units in the Klettgau Formation that are of particular interest for the siting regions in Northern Switzerland, i.e. the Seebi Member, the Gansingen Member and the Ergolz Member (Fig. 4‑94). In Southern Germany, additional units may be of interest (Plum et al. 2008). The Keuper aquifer is of particular relevance because it is the aquifer closest to a potential repository in the Opalinus Clay (JO: similar distance to the Hauptrogenstein).
In the JO siting region, the Keuper aquifer was sufficiently transmissive to sample groundwater (Section 4.5.5.4) in the RIN and BOZ2 boreholes (and also in the nearby Beznau borehole, BEZ), with a particularly high transmissivity in the range of 10-4 m2/s in BOZ2 (Fig. 4‑86). In BOZ1, low transmissivity was observed but the characteristic shape of the profiles of the natural tracers (notably stable isotopes of water and chloride) shows a clear excursion (Section 4.6). This means that there is evidence for an active Keuper aquifer in all of the boreholes of this siting region. Based on the hydrogeological dataset and taking into account lithology (Fig. 4‑15) and tectonic overprint, the permeability is most probably associated with the Gansingen Member which is particularly thick in JO. Groundwater flow probably occurs in fractures and may be facilitated by the partly well-developed macroporosity (Fig. 4‑16).
In the NL siting region, the test transmissivities of 2 × 10⁻⁷ and 1 × 10⁻⁶ m2/s in the BAC1 and STA2 boreholes allowed sampling of groundwater. In the other three boreholes, transmissivities were too low (range of 2 × 10⁻⁸ to 1 × 10⁻¹⁰ m2/s; Fig. 4‑86). In the case of the BUL1 and STA3 boreholes, the lower values are in line with an absence of significant excursions in the profiles of the natural tracers. From the packer test position and supported by other evidence, it is shown that the conductive zones relate to fluvial sandstone sections in the Ergolz Member. A particularly thick (ca. 7 m) quartz-rich channel was observed in the STA2 borehole (Fig. 4‑94). In NL, the other members of the Klettgau Formation have not been observed to significantly contribute to transmissivity, probably because of local lithofacies and thickness (Section 4.2.4 and Fig. 4‑95). In the Ergolz Member, the positive trend of transmissivity with quartz and feldspar content and intervals devoid of carbonate cement suggest that the matrix significantly contributes to overall transmissivity. The connectivity of the individual sandstone channels is probably limited as indicated by the differences in the hydrogeochemistry of the groundwater samples (Section 4.5.5.4) and by different extents of aquifer-aquitard interaction indicated by the profiles of the natural tracers in the BAC1 and STA2 boreholes (Section 4.6). Overall, the observations indicate that groundwater flow in NL is restricted to such channel systems and not as extensive as, for example, in the case of the Seebi Member in ZNO. The mostly low hydraulic test transmissivities in NL (Fig. 4‑86) are in line with the outcome of the calibration of the simplified representation of the Keuper aquifer in the hydrogeological model (Section 4.5.4.4).
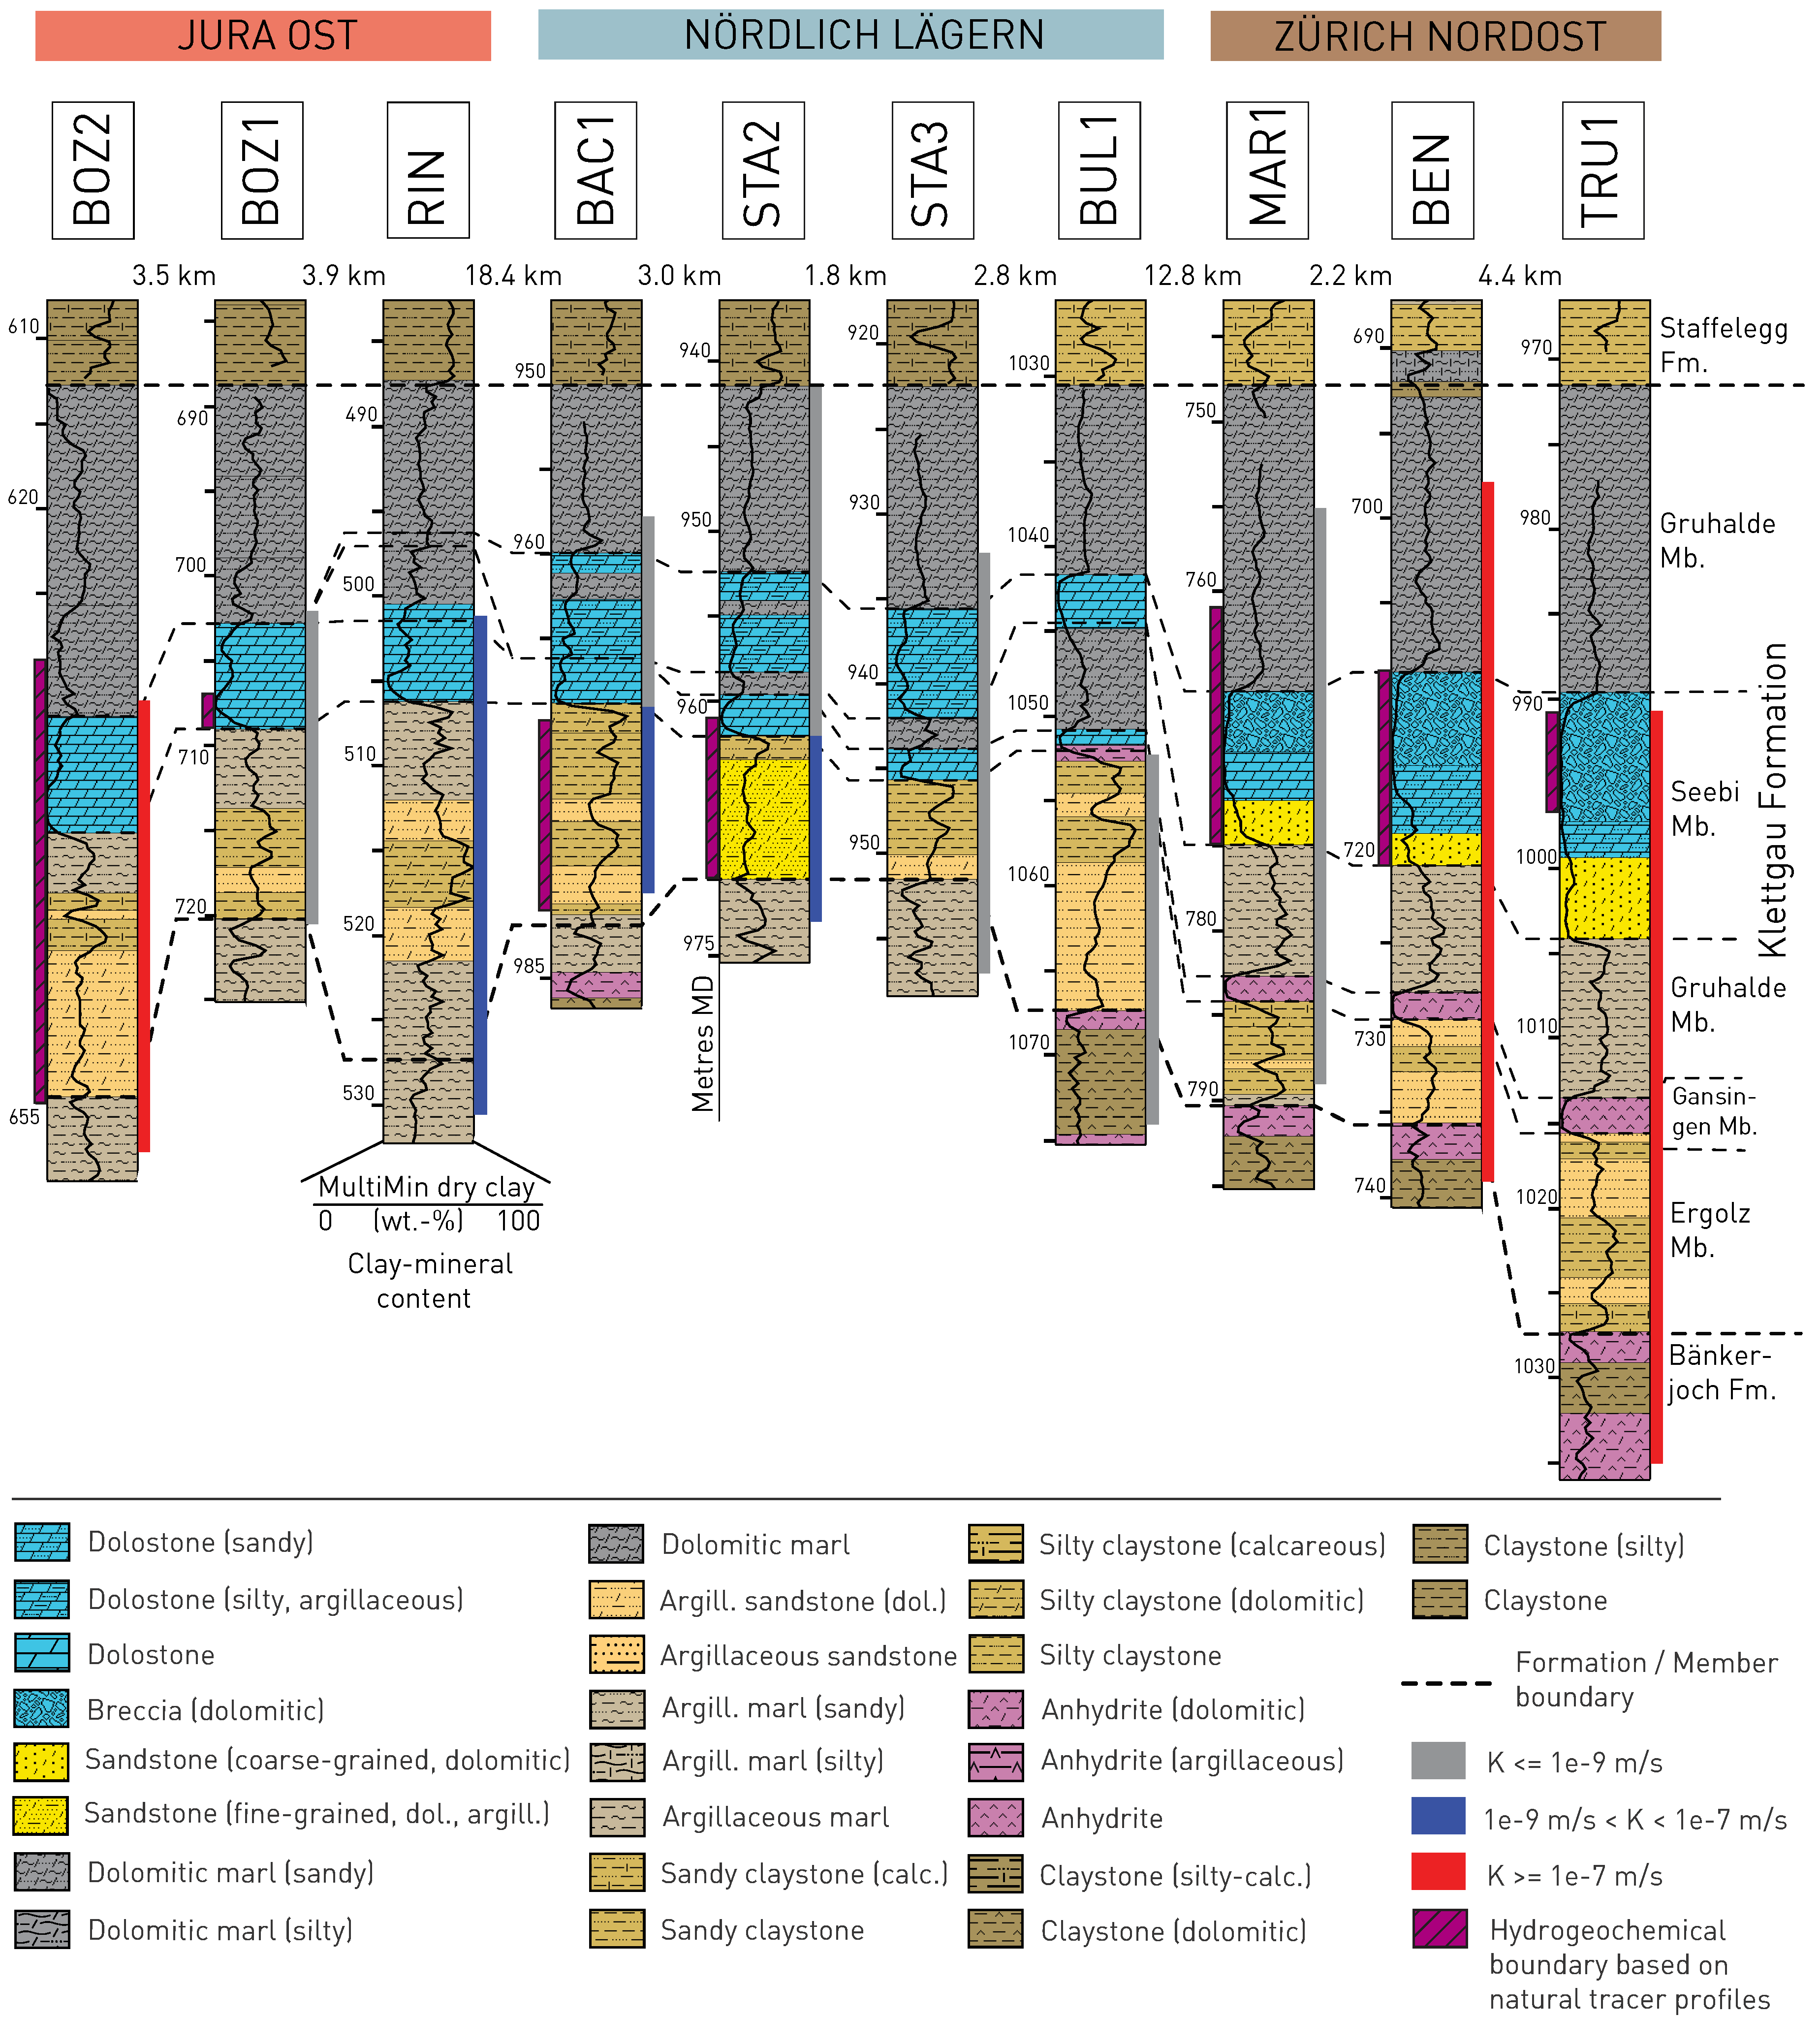
Fig. 4‑94:Results of the hydraulic packer testing and hydrogeochemical investigations in the Klettgau Formation
The vertical extents of the hydraulic packer tests are shown on the right of the stratigraphic profiles. The colour code refers to the magnitude of the hydraulic conductivity (see legend) calculated from the transmissivity and the length of the test intervals. The vertical extents of the hydrogeochemical boundaries as estimated based on observations on natural tracer profiles (and complemented by drill core observations) are displayed on the left of the stratigraphic profiles (purple hatched intervals). The latter represent the hydrogeochemical boundaries at the Keuper aquifer used for the modelling of the natural tracer profiles in the aquitards (Sections 4.6.2 and 4.6.3).
In the ZNO siting region, the new TBO boreholes confirmed the earlier investigations related to the Keuper aquifer as the major hydrogeochemical boundary for the Opalinus Clay. High test transmissivities (4 × 10⁻⁶ and 6 × 10⁻⁵ m2/s) allowed sampling of groundwater of similar composition from the Benken (BEN) and TRU1 boreholes (Section 4.5.5.4). In MAR1 the transmissivity was lower (1 × 10⁻⁸ m2/s; Fig. 4‑86), but the profiles of the natural tracers show a clear excursion with a characteristic change to a low-chloride meteoric composition (Section 4.6). The same systematic pattern was observed in the RHE1 borehole and also in the nearby Schlattingen-1 geothermal borehole (Wersin et al. 2016). Overall, the available hydrogeological dataset indicates there is an active Keuper aquifer across the entire ZNO siting region. The transmissive zone relates to the Seebi Member (former 'Stubensandstein') which exclusively includes in ZNO and the nearby areas a partly macroporous dolomitic breccia (Section 4.2.4).
At the regional level, permeable sandstone channels of the Ergolz Member must be expected in all the siting regions (Fig. 4‑95). They are of limited extent and occur only locally, but their position is difficult to predict. In contrast, the permeable, cavernous dolomitic breccia of the Seebi Member is a particular feature of ZNO, and the thick Gansingen Member exists in JO.
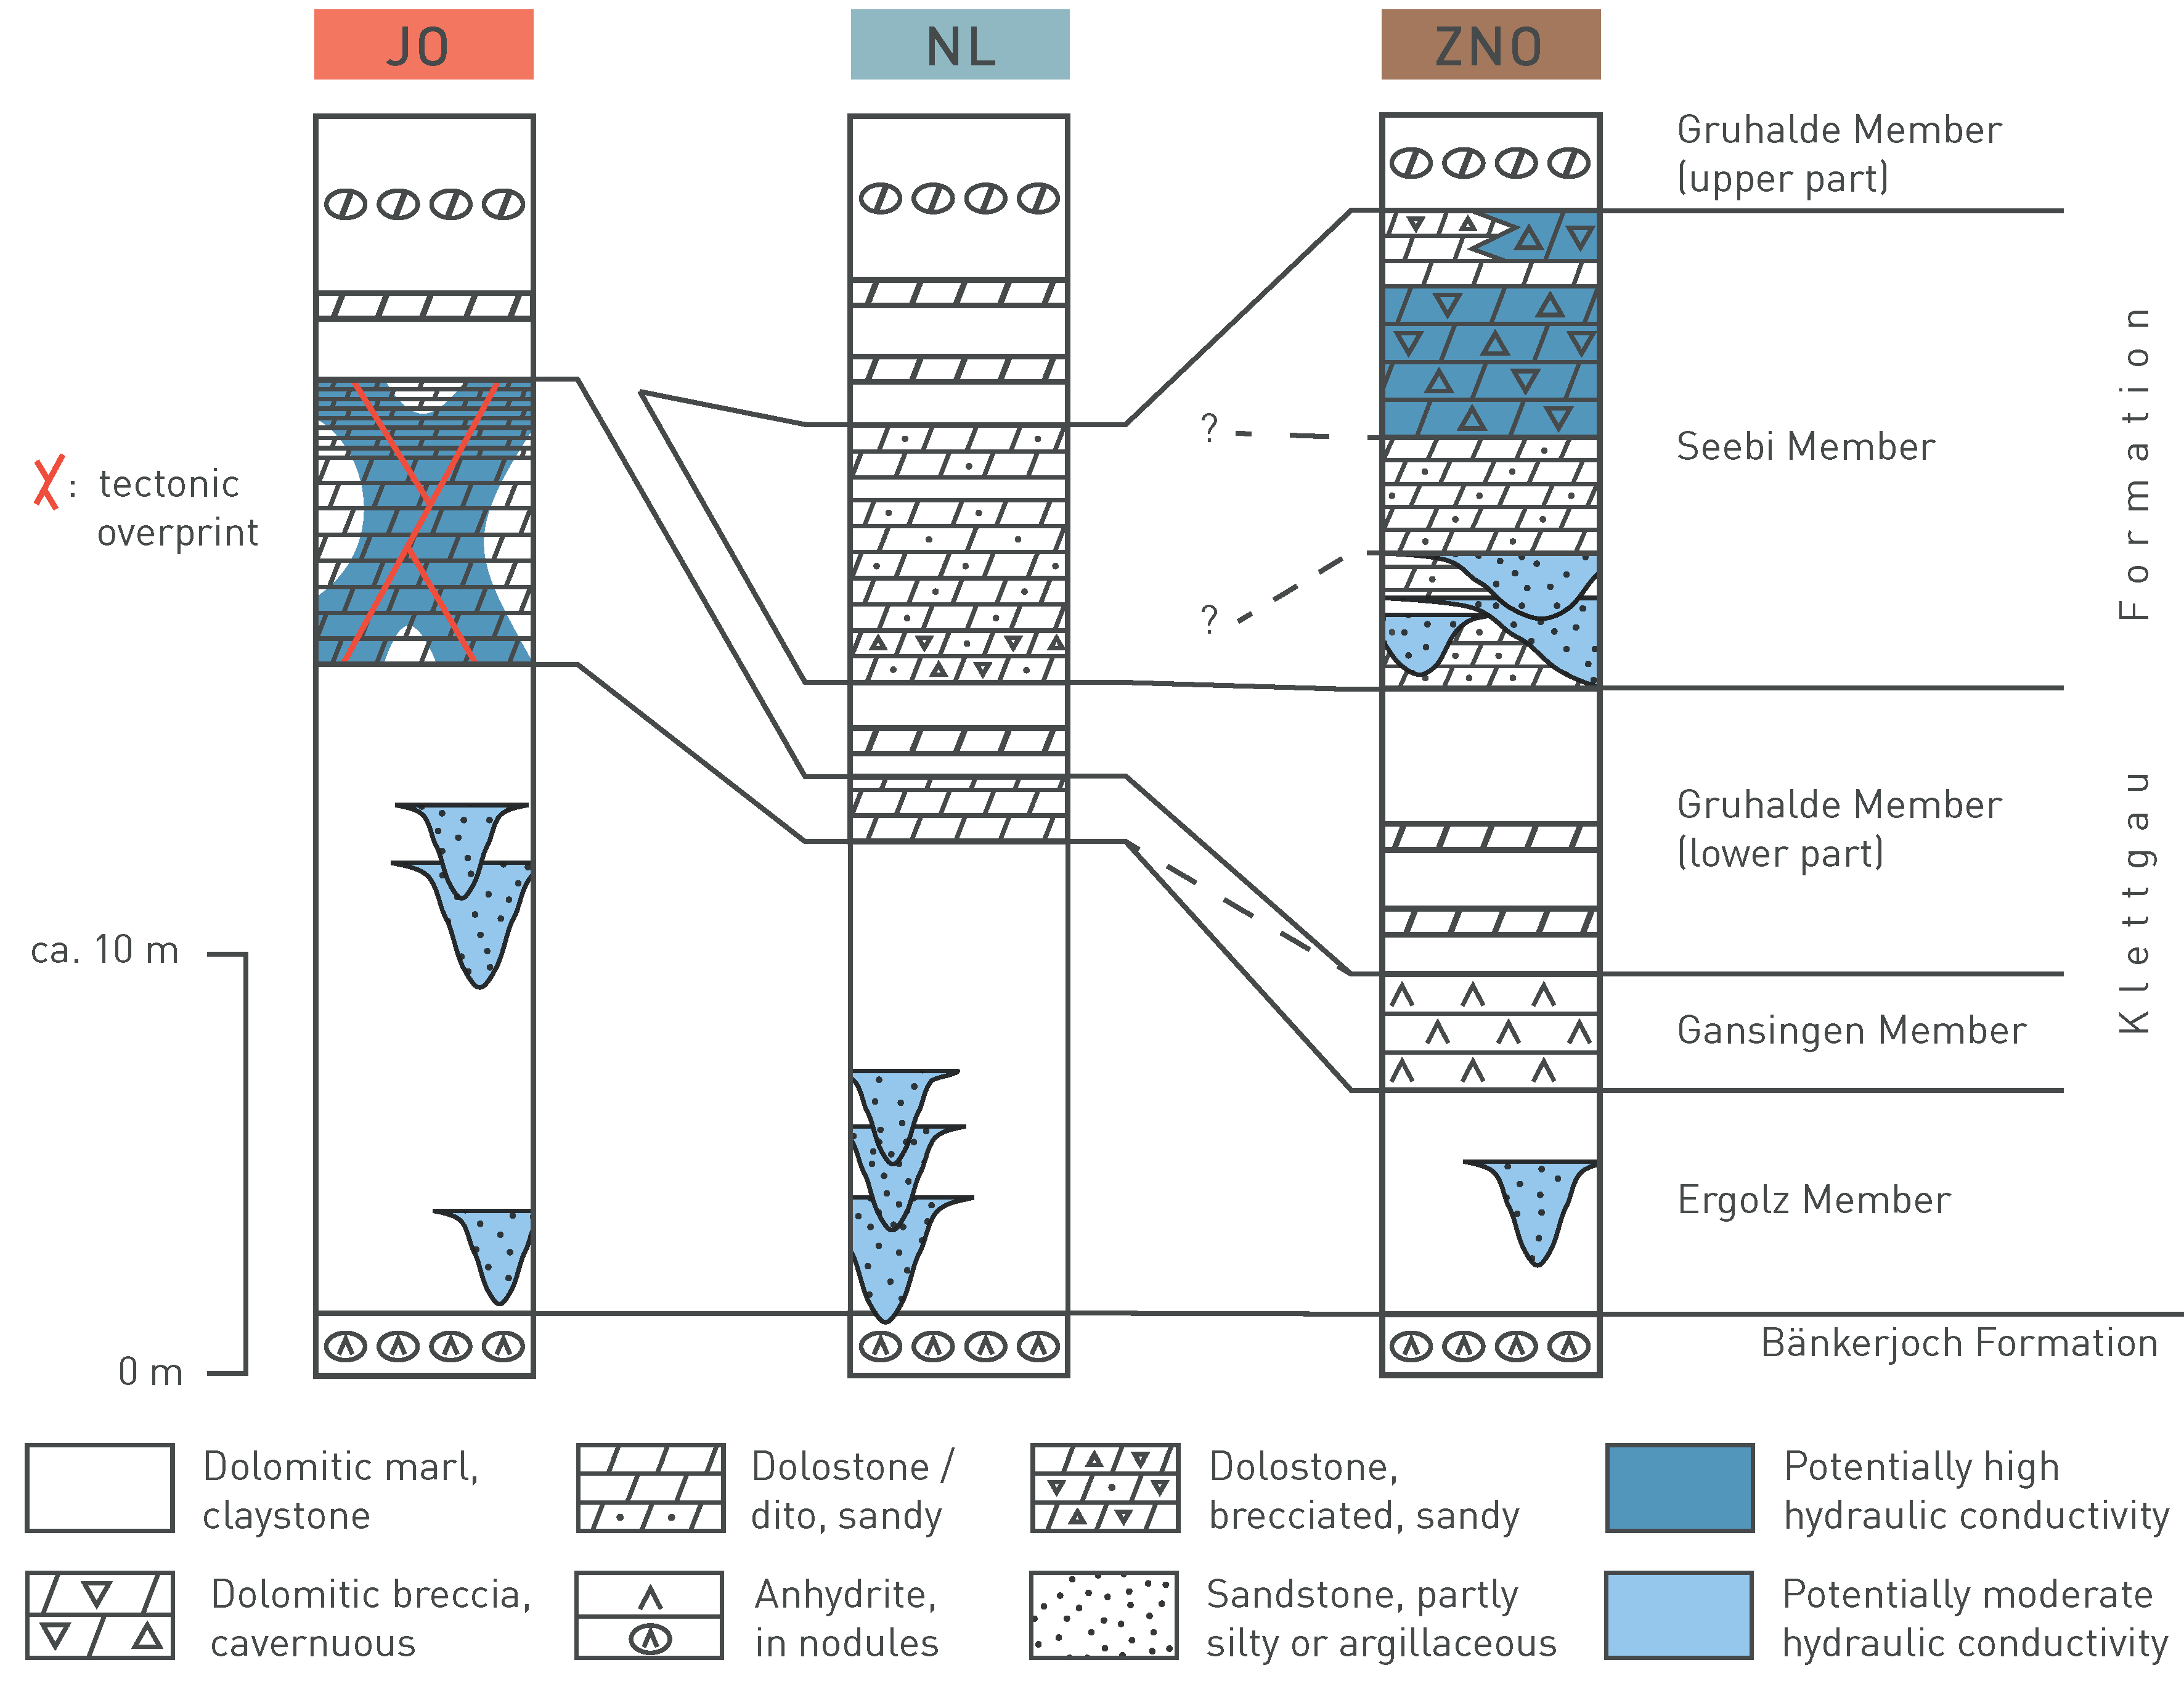
Fig. 4‑95:Hydrogeological synopsis of the Keuper aquifer indicating the permeable lithofacies of the Klettgau Formation in the different siting regions
The Bänkerjoch Formation («Gipskeuper») is a thick aquitard of regional extent (Fig. 4‑10) between the Keuper aquifer and the regional Muschelkalk aquifer (Fig. 4‑84). It consists mainly of anhydrite (which at shallow levels may be hydrated to gypsum), clay minerals and dolomite (Section 4.2.3). Where the Keuper aquifer is not active, it is part of the low-permeability confining units below the Opalinus Clay.
At the relevant depths, the hydraulic conductivities are very low: tests on drill cores showed values of < 10-11 m/s and a packer test in the BEN borehole indicated 1.1 × 10⁻¹³ m/s (Klemenz et al. 2000). The anhydrite-rich sections have good self-sealing properties because of the volume expansion caused by reaction with groundwater resulting in the hydration to gypsum (T < ca. 42 °C). The profiles of the natural tracers indicate diffusion as the dominant transport mechanism between the Keuper and the Muschelkalk aquifer (Section 4.6). Particularly steep concentration gradients are mostly observed in the lowermost Bänkerjoch Formation related to the occurrence of massive anhydrite units which are an efficient transport barrier. In this subunit, porosity trends to zero if the anhydrite content exceeds ca. 60 to 80 wt.-% (Fig. 5‑8; Mazurek et al. 2023a).
The interpretation of 3D seismic data provides indications for dissolution processes in the Bänkerjoch and / or the Schinznach Formation probably related to subaerial exposure (Nagra 2024a, 2024b, 2024c). Under current conditions, the development of gypsum karst is restricted to the outcrop zone (Plum et al. 2008, Ufrecht 2017).
The Muschelkalk aquifer consists of the carbonate rocks of the Schinznach Formation. As a result of the large-scale uniform lithology (Fig. 4‑7), it is a regional aquifer in Northern Switzerland (e.g. Nagra 2014e, Dossier V) and Southern Germany (e.g. Stober & Villinger 1997, Ufrecht 2018) with a typical thickness around 70 to 80 m in the siting regions. The aquifer is bounded at the top by the Bänkerjoch Formation and at the bottom by the Zeglingen Formation (Fig. 4‑8, Section 4.2.2). Note that the uppermost dolomite of the Zeglingen Formation can be part of the aquifer (former 'Dolomit der Anhydritgruppe').
In the boreholes in Northern Switzerland, the unit mainly consists of dolomite and calcite in varying proportions. In addition, sulphate minerals (anhydrite, celestite) are locally observed.
As a result of the comparably high hydraulic conductivities, the Muschelkalk aquifer is exploited in many wells, including for the spas of Baden and Bad Schinznach (e.g. Burger 2011, Waber & Traber 2022 and further references therein).
Water flow in the deep Muschelkalk aquifer is mainly related to fractures in combination with a partly porous and permeable rock matrix (Fig. 4‑9). Of the four different members of the Schinznach Formation (Section 4.2.2), the dolomitic Stamberg Member is most relevant for water conductivity via the rock matrix. This is mainly because of 1) the early diagenetic dolomitisation (classical ‘Trigonodus-Dolomit'; Adams et al. 2019, Aschwanden et al. 2019a) and 2) the presence of macropores formed by local dissolution of anhydrite nodules by upwelling of groundwater from the Buntsandstein and/or the crystalline basement during the different geodynamic situations in the Oligocene and the Miocene (Aschwanden et al. 2019b; see also Section 4.5.5.5). At present, the porosity of the Stamberg Member in the TBO boreholes can locally exceed 20 vol.-% based on geophysical logging (Fig. 5‑10). Fractures increase the hydraulic conductivity by 1 – 3.5 orders of magnitude compared to the rock matrix (Aschwanden et al. 2017). Depending on where brittle deformation has occurred, the most transmissive intervals can also be located in the Liedertswil Member or the Leutschenberg and Kienberg Members where limestones dominate (see Section 4.2.2). With increasing overburden, mechanical and chemical compaction cause a substantial decrease in the hydraulic conductivity (Fig. 4‑96).
Epigenic karst is observed in shallow situations, where the overlying units were eroded or where the cover is only thin or patchy (e.g. Hoehn 1979, Plum et al. 2008). Hypogenic karstification under thick overburden has only been observed where carbon dioxide of magmatic or volcanic origin is upwelling along fractures extending to a greater depth, leading to carbonate dissolution; such conditions have only been reported north of the investigation area in Baden-Württemberg (Plum et al. 2008, Ufrecht 2006). In the siting regions in Northern Switzerland, no expressions of, or drivers for, such hypogenic karst development have been observed. The interpretation of 3D seismic data provides indications for dissolution processes in the Bänkerjoch and / or the Schinznach Formation probably related to subaerial exposure (Nagra 2024a, 2024b, 2024c).
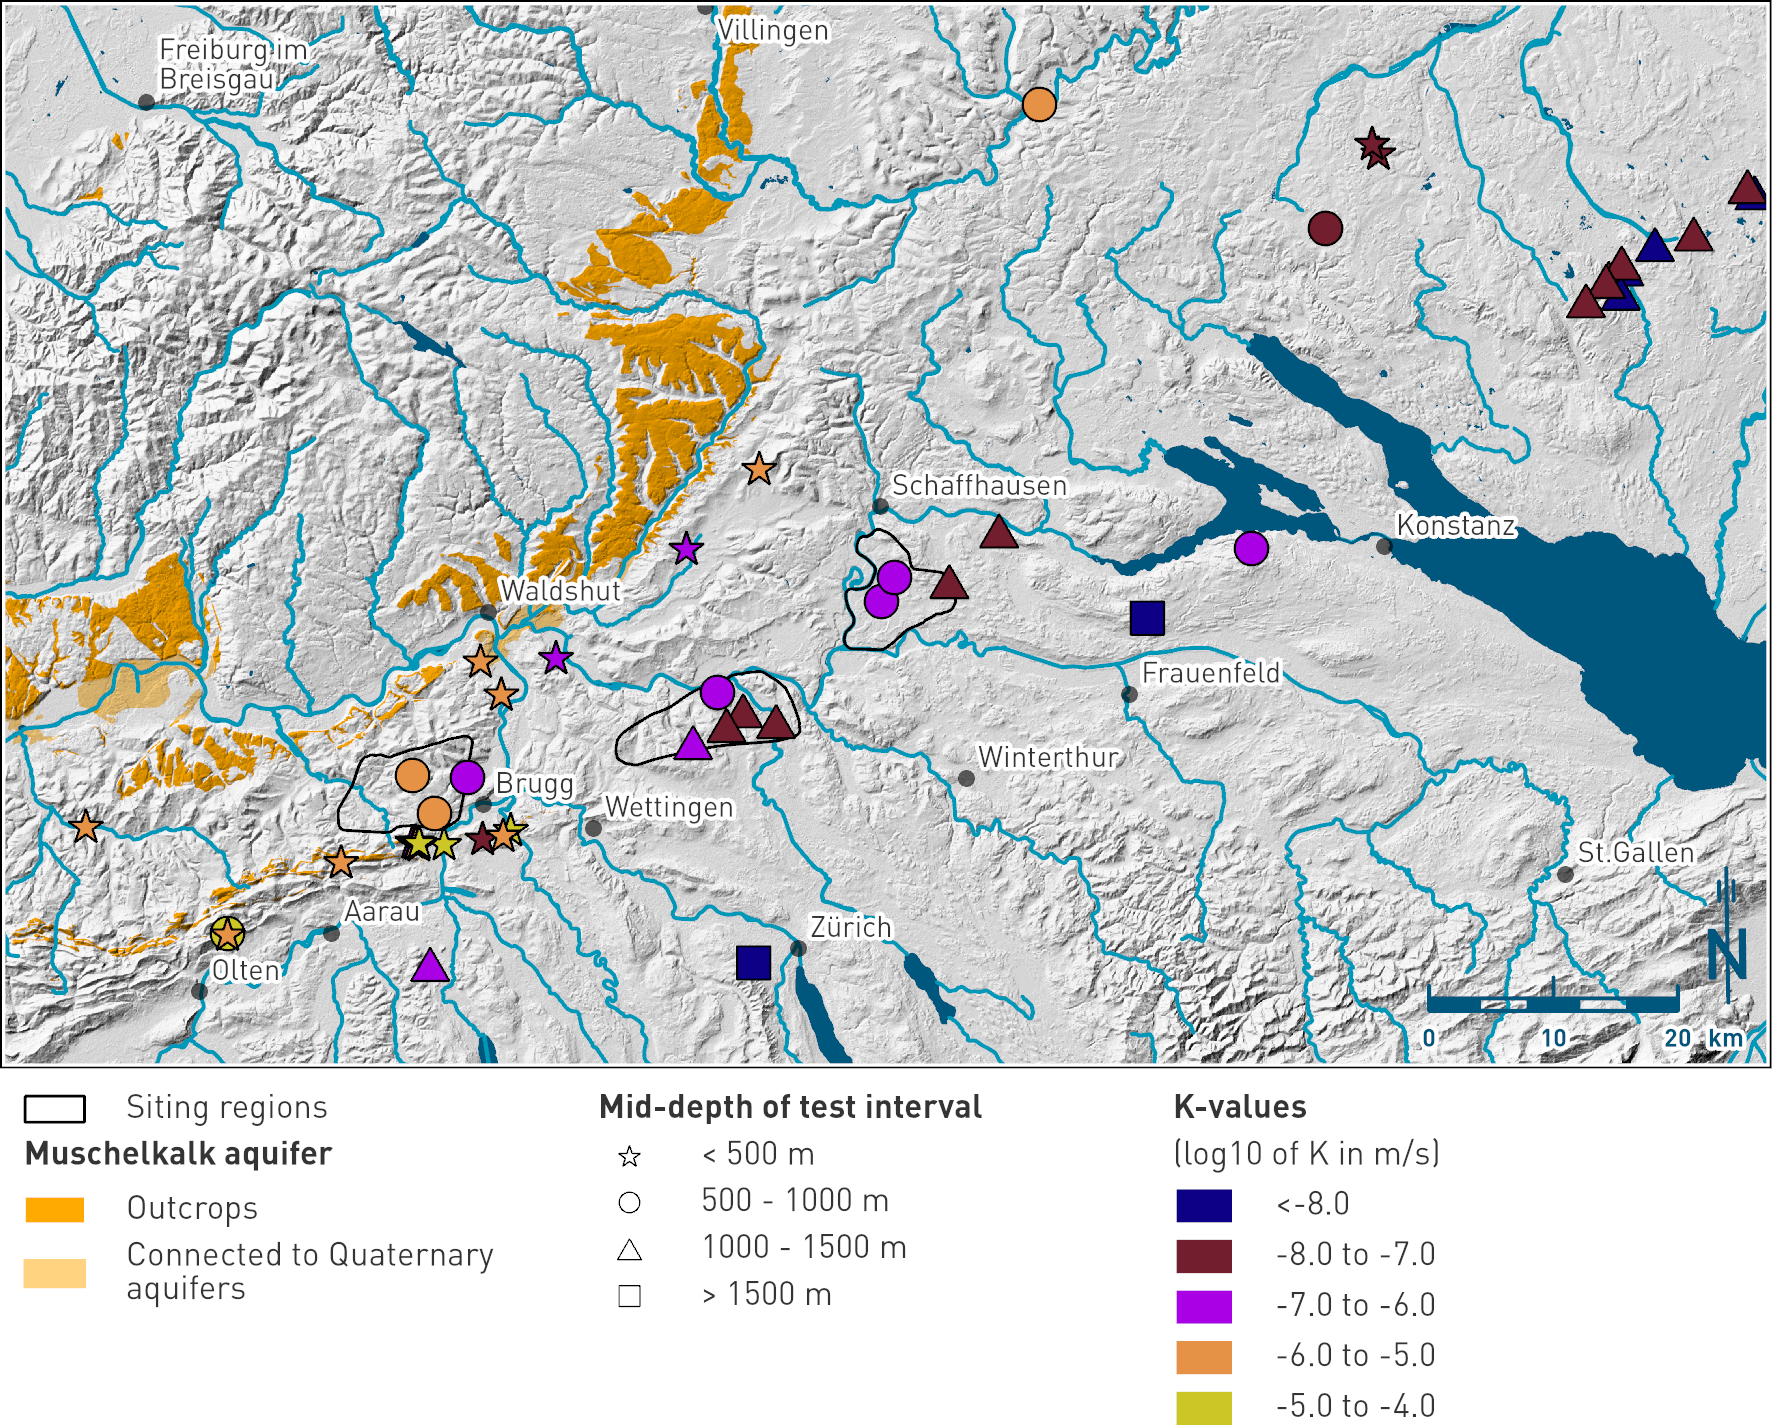
Fig. 4‑96:Hydraulic conductivities from in-situ hydraulic tests in the Muschelkalk aquifer in Northern Switzerland and Southern Germany
The length of the test intervals varies between approximately 10 and > 100 m. The figure shows the regional distribution of hydraulic conductivity and its dependence on depth (see text for further details).
The test transmissivities show a comparably uniform distribution of the values, i.e. no large regional differences are evident (Fig. 4‑86). The overburden thickness seems to exert a major control on the properties (Fig. 4‑96).
In the siting regions, the Muschelkalk aquifer was tested in all boreholes and the hydraulic conductivity was sufficiently high in all cases to sample groundwater. The location and lengths of the test intervals were chosen based on indications such as losses of drilling fluid and observations on drill cores (fractures, porous zones). From the resulting distribution of the packer test positions, no particular subunit with elevated hydraulic conductivity is evident (Fig. 4‑85). In comparison to the Malm aquifer, the conductive sections seem to be more distributed throughout the entire unit and are probably linked to subvertical fractures and joints. The hydraulic properties in the siting regions agree with the regional dataset, particularly if the depth-dependence is taken into account (Fig. 4‑96). The typical test transmissivity in the siting regions is around 10-5 m2/s and the values scatter within the narrow range of ± 1 order of magnitude. Despite the larger overburden resulting from the stratigraphic position, the transmissivity is approximately one order of magnitude larger than in the Malm aquifer (Fig. 4‑86). This enables a large-scale connected deep flow system (Section 4.5.5.5).
This section develops an understanding of the hydrogeological system based on the regional hydrodynamic steady state model (Nagra 2024n) and the hydraulic heads in the aquifers measured in the deep boreholes. Piezometric maps of the main aquifers are presented, and recharge and discharge areas are identified. Finally, large-scale hydraulic head differences between aquifers are discussed.
The three-dimensional steady state numerical groundwater flow model (extract of the 3D model shown on Fig. 4‑97) aims to test the consistency of the hydrogeological dataset and provide insights into the groundwater flow systems. It is also a tool to investigate the impact of different conceptualisations, for example with respect to the properties of the hydrogeological units and of the regional faults.
The focus of Sections 4.5.4.2 to 4.5.4.5 is on the identification of the recharge and discharge areas of the main aquifers. These will also feed into the interpretation of the hydrogeochemical data of the groundwater samples to develop a consistent understanding (Section 4.5.6). Note that the hydrogeochemical dataset may also include information on transient processes (e.g. old seawater components) – in contrast to the steady state groundwater flow model.
Technical details on the model are provided by Nagra (2024n). The model extent and the boundary conditions were defined based on available data and earlier modelling results (e.g. Gmünder et al. 2014). The modelling procedure included a sensitivity analysis of the boundary conditions to investigate their impact on the groundwater flow field. The outcome of this analysis led to the selection of a base-case model for further calibration. The calibration was carried out using the PEST algorithm (Doherty 2004) focusing on the hydraulic parameters of the Malm, Hauptrogenstein, Keuper, and Muschelkalk aquifers (Nagra 2024n). The hydraulic properties of the faults were related to the hydraulic properties of the hosting units using multiplicative factors. The latter were adjusted during the final phase of the calibration to further enhance the quality of the fit.
The base-case model includes a no flow boundary condition at the southern limit of the model reflecting the low hydraulic conductivities of the aquifers expected at several kilometres depth. The importance of this choice needs to be put into perspective. Indeed, the sensitivity analysis showed that the hydraulic conditions assigned to the southern boundary have no significant impact on the northern part of the model where the siting regions are located.
The recharge and discharge areas of the aquifers are visualised using backward and forward particle tracking (Fig. 4‑98, Fig. 4‑100, Fig. 4‑101, Fig. 4‑102). These were calculated by post-processing the model results using the simulated groundwater velocity field and generic porosities. The calculation of the particle paths was stopped after an arbitrarily selected time frame of 5 million years. Note that this is not intended to serve as a long-term prediction (steady state model).
Particles were released in the middle of the aquifer horizons above and below the Opalinus Clay in the perimeter of the siting regions. While the released particles usually travel within the bounds of the thick aquifers during the considered time frame, particles released in thin aquifer layers may be trapped in the adjacent aquitards (Nagra 2024n).
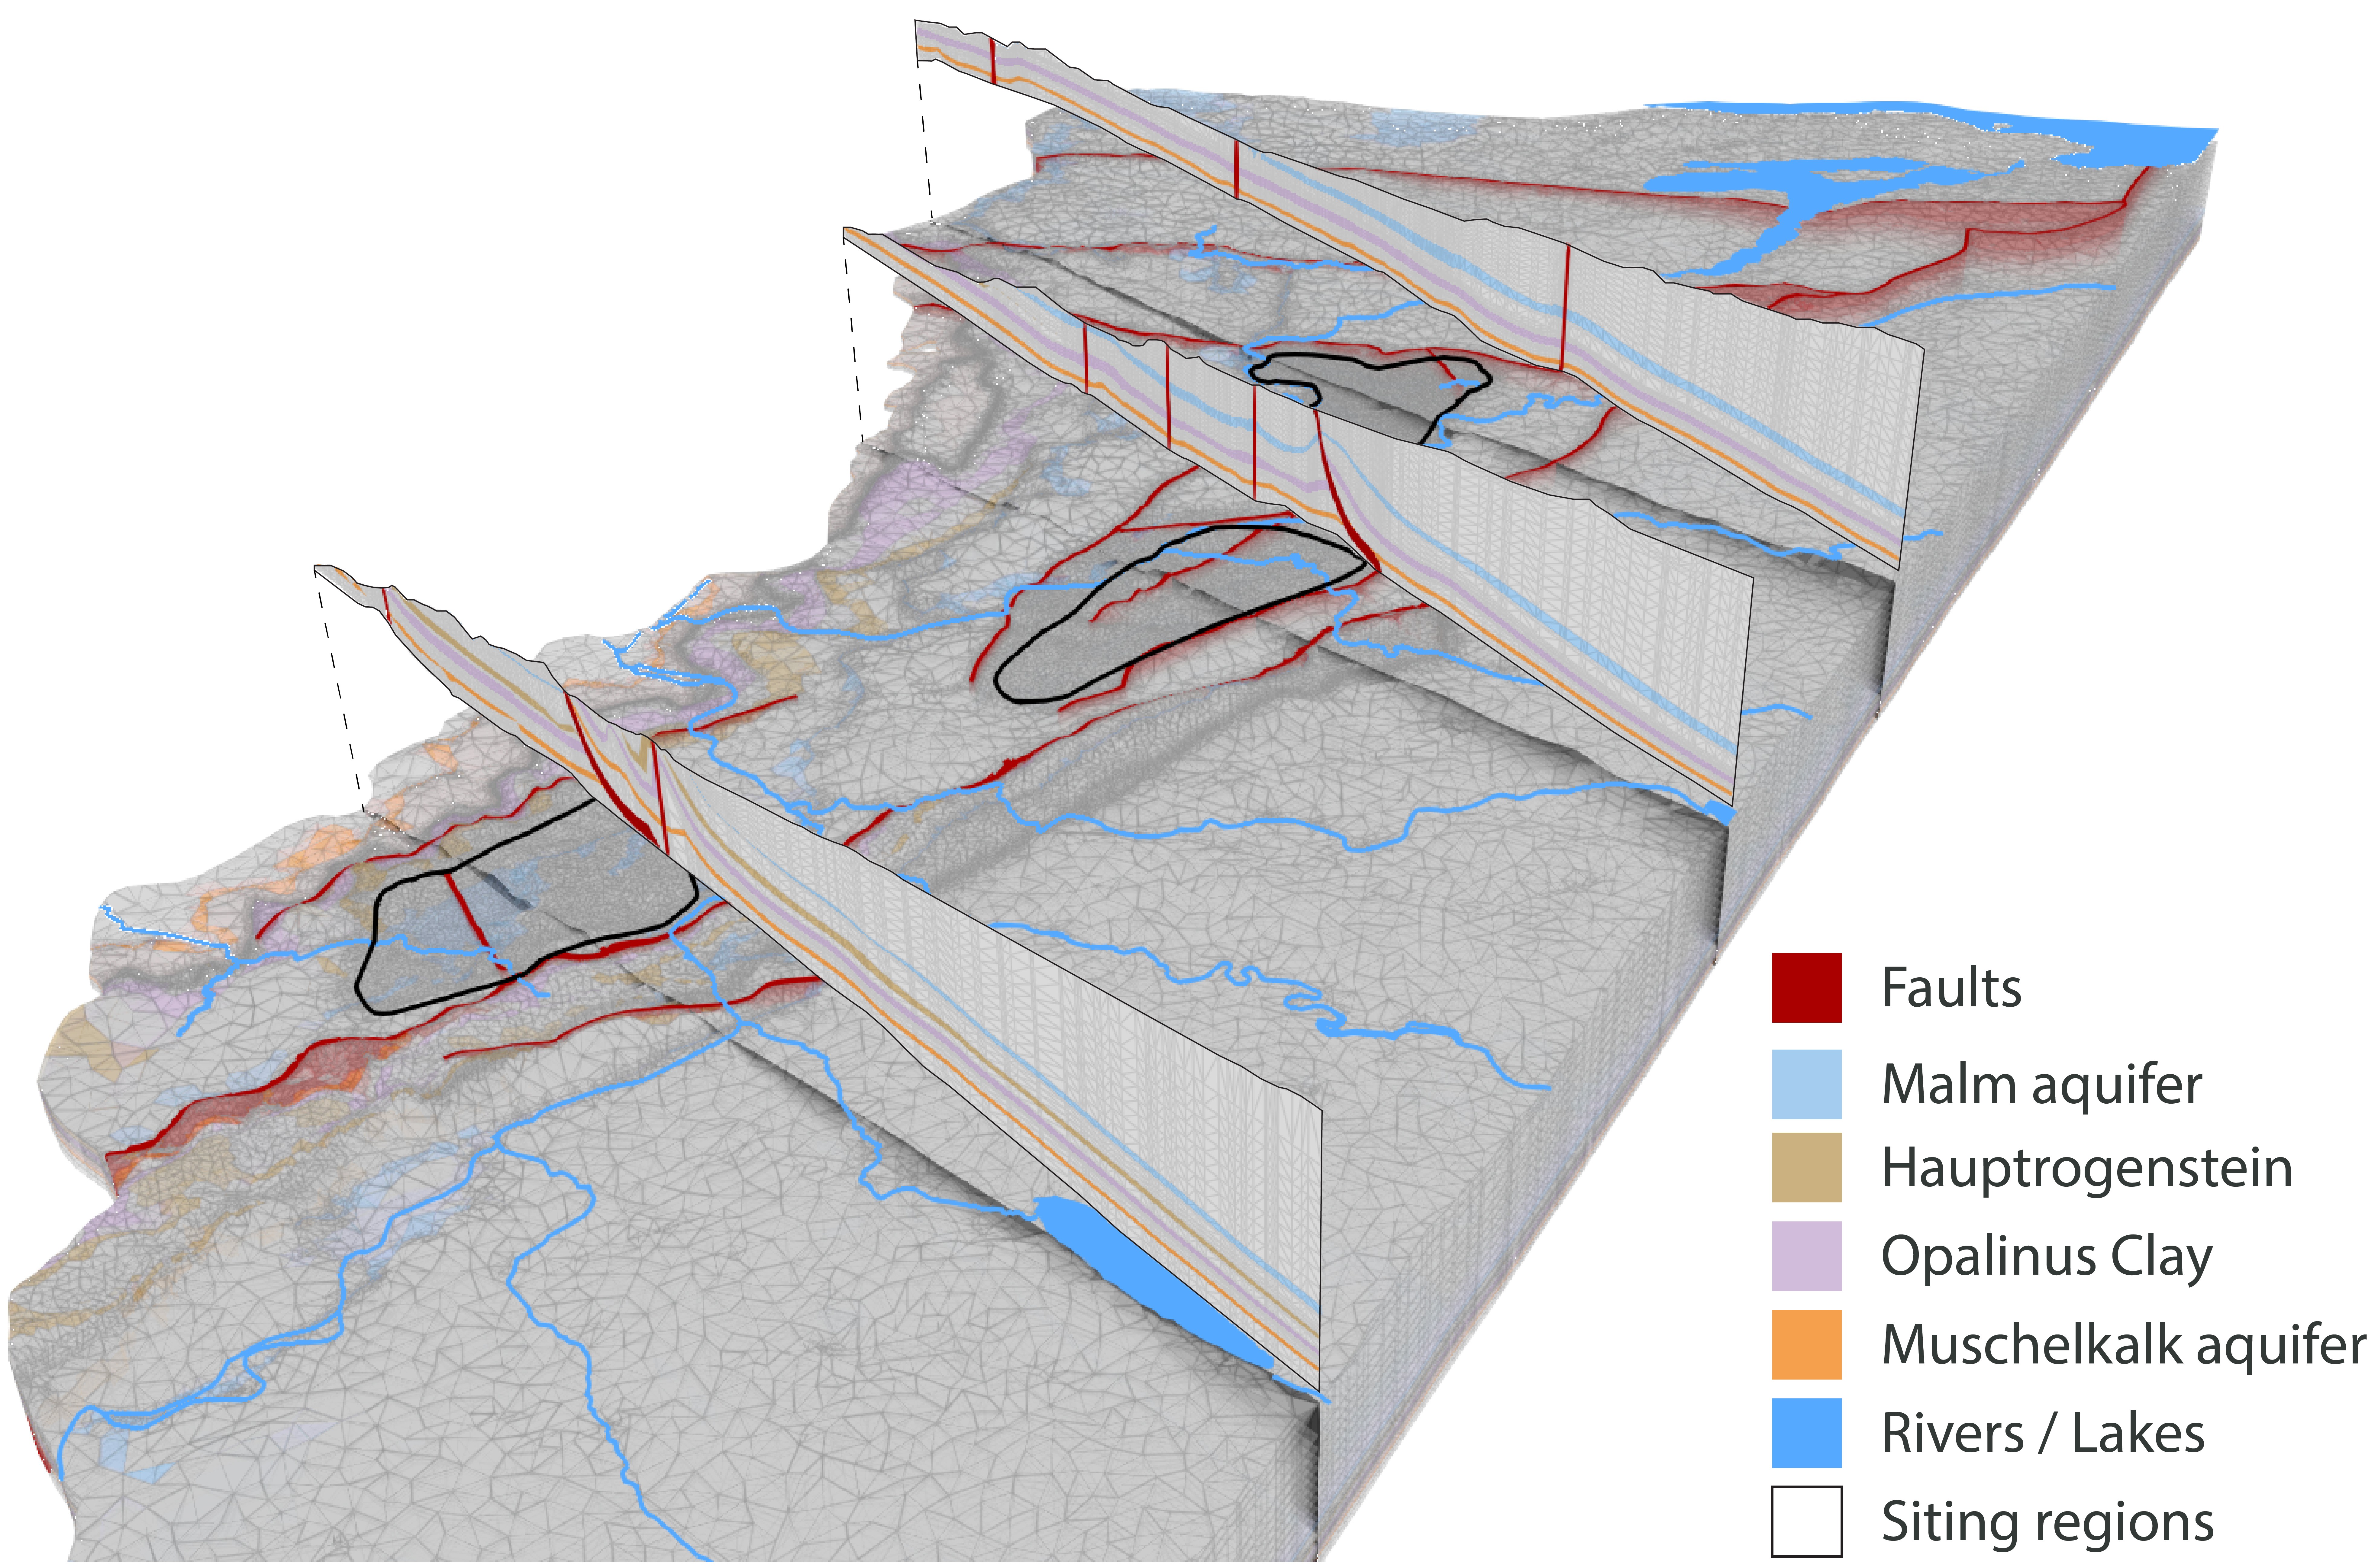
Fig. 4‑97:3D view of the northeastern part of the hydrogeological model, with respective cross-sections showing the main regional aquifers, together with the Opalinus Clay
Model is vertically exaggerated 2×, cross-sections are exaggerated 3×. The Malm aquifer (top of the «Felsenkalke» + «Massenkalk» to the base of the Villigen Formation), Hauptrogenstein aquifer, Opalinus Clay and Muschelkalk aquifer (Schinznach Formation), as well as a simplified regional fault pattern are displayed.
The Malm aquifer is the nearest aquifer above the Opalinus Clay in the NL and ZNO siting regions. The model was implemented based on the hydraulic conductivities observed in the boreholes and a depth dependence. In addition, tectonic overprint was taken into account (Nagra 2024n).
The piezometric map (Fig. 4‑98) shows that the zone north of the Jura Main Thrust and the Baden – Irchel – Herdern Lineament is mainly affected by the local topography and the outcrop situation. The flow system in this zone is well supported with borehole data, notably within the siting regions. The area further to the south is less constrained by borehole data, but the sensitivity analyses show that the detailed situation in the southern part of the model is of little importance for conditions in the siting regions (Nagra 2024n).
The regional situation of the Malm aquifer is characterised by a piezometric dome in the northeasternmost corner of the model perimeter (Fig. 4‑98). The groundwater then flows towards the southeast driven by a steep hydraulic gradient. High hydraulic heads also exist in the Bodensee area, reflecting groundwater inflow from the east. Recharge also occurs locally along the Internal Jura where the Malm is outcropping.
The main discharge areas are located along the Rhine River where the Malm aquifer is in contact with the river and/or associated Quaternary aquifers (e.g. Rhine Falls and Rheinau area northwest of the ZNO siting region, the area of Kaiserstuhl – Hohentengen in the Rhine Valley north of the NL siting region, and at the confluence of the Aare, Reuss and Limmat Rivers near the town of Brugg). South of the Jura Main Thrust, Malm groundwater discharges in the Reuss and Aare Valleys where the associated rivers cut the Internal Jura (Fig. 4‑98).
The topography and outcrop position of the Malm aquifer in the northern part of the model leads to site-specific hydrogeological situations. Backward particle tracking from the ZNO siting region shows that the recharge of the Malm aquifer mainly takes place along Malm outcrops in the north. The model results indicate that the Randen fault acts as a drain, channelling the groundwater further to the southeast. Recharge also occurs locally along the Malm outcrops of the Südranden area. These groundwater flow systems then discharge in the Rhine Falls and Rheinau areas.
In the NL siting region, the recharge of the Malm aquifer mainly takes place through the thick Molasse units north of the Jura Main Thrust (i.e. northern part of the Lägern Anticline; Fig. 4‑98). This is indicated by the hydraulic head differences at the interface between the Malm aquifer and the USM (Fig. 4‑99). Note that the differences are more pronounced in the western part of the siting region than in the eastern part due to the topographical effect. The Jura Main Thrust and the Baden – Irchel – Herdern Lineament do not act as preferential pathways.
The groundwater discharge zone is located near Kaiserstuhl – Hohentengen north of the siting region where the Malm is in contact with the Rhine River (Fig. 4‑98).
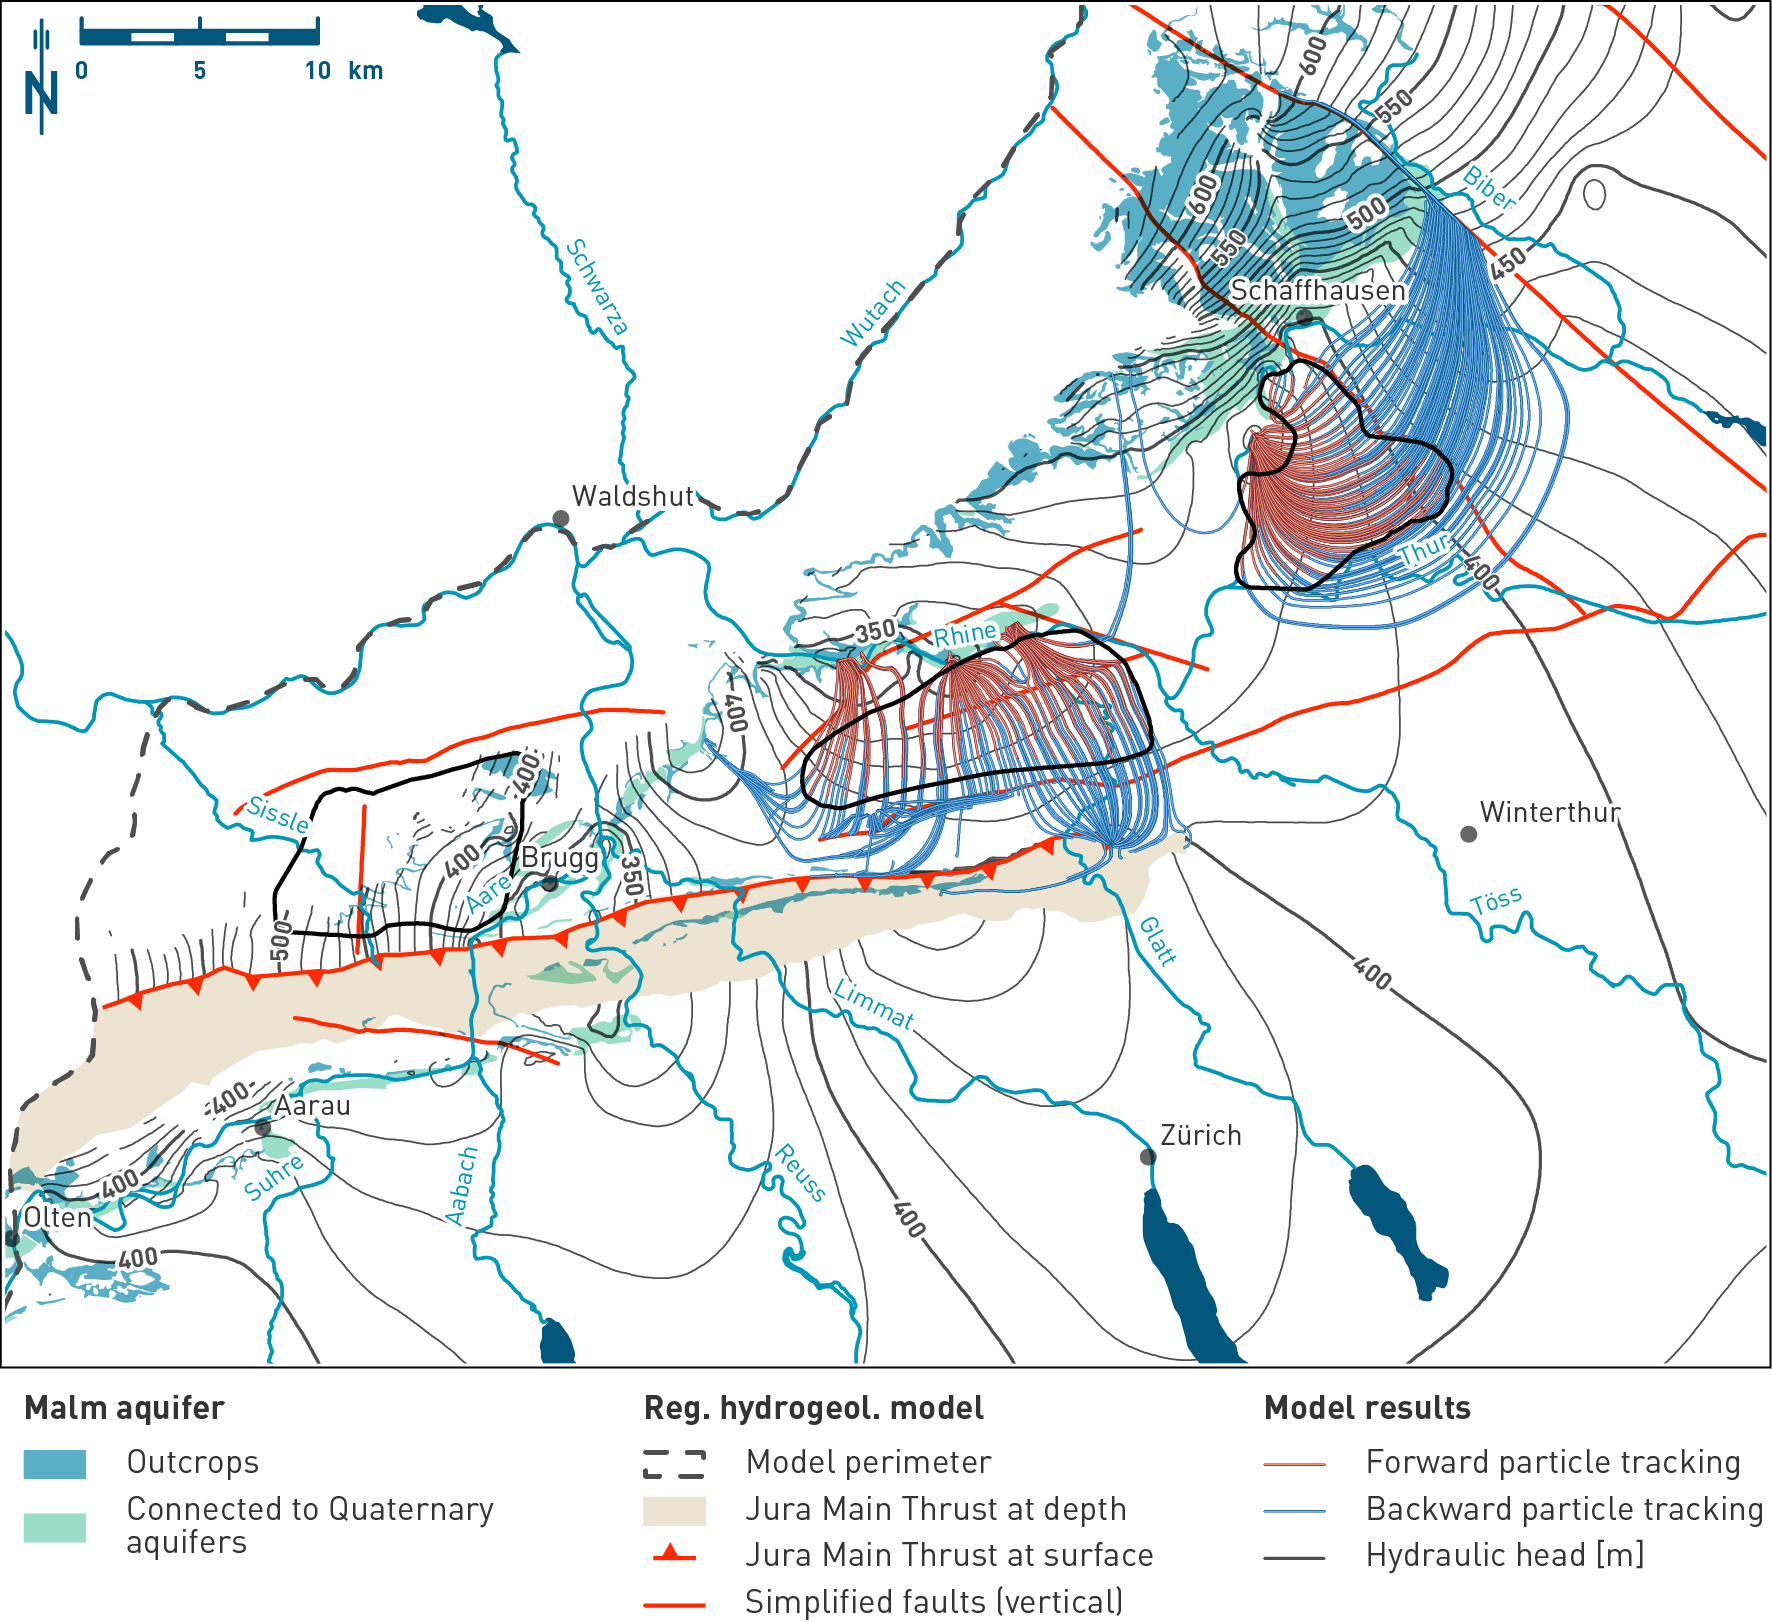
Fig. 4‑98:Simulated hydraulic heads and the particle paths identifying recharge and discharge areas in the Malm aquifer
Hydraulic head situation at the top of the Villigen Formation horizon of the hydrogeological model. The map also shows the outcrops and the simplified regional fault pattern used in the model. The displayed particle paths are a 2D projection of the 3D particle traces. Note the site-specific groundwater flow systems.

Fig. 4‑99:Head difference map between the Malm aquifer and the Lower Freshwater Molasse Group (USM)
Positive and negative head differences indicate upward and downward hydraulic gradients respectively. Hydraulic head difference were calculated using the results of the base case (Nagra 2024n). The top of the Villigen Formation and the top of the lowermost USM horizons of the model were considered. The map also shows the outcrops and the simplified regional fault pattern used in the model. Note the negative hydraulic head difference in the NL siting region indicating vertical recharge of the Malm aquifer through the Molasse deposits.
The Hauptrogengestein is the nearest aquifer above the Opalinus Clay in the JO siting region. The flow system is affected by the local topographic situation and by the facies transition towards units with higher clay-mineral contents towards the east (Sections 4.2.7 and 4.5.3.6).
Potential recharge areas are the outcrops located north and west of the siting region (Fig. 4‑100). The location of the discharge areas depends on the assumptions regarding the continuity and properties of the aquifer. Assuming that the permeable facies reach the lower Aare Valley to the east, discharge mainly occurs along the Aare River and, to a lesser extent, in the Quaternary aquifer of the Sissle Valley to the west.
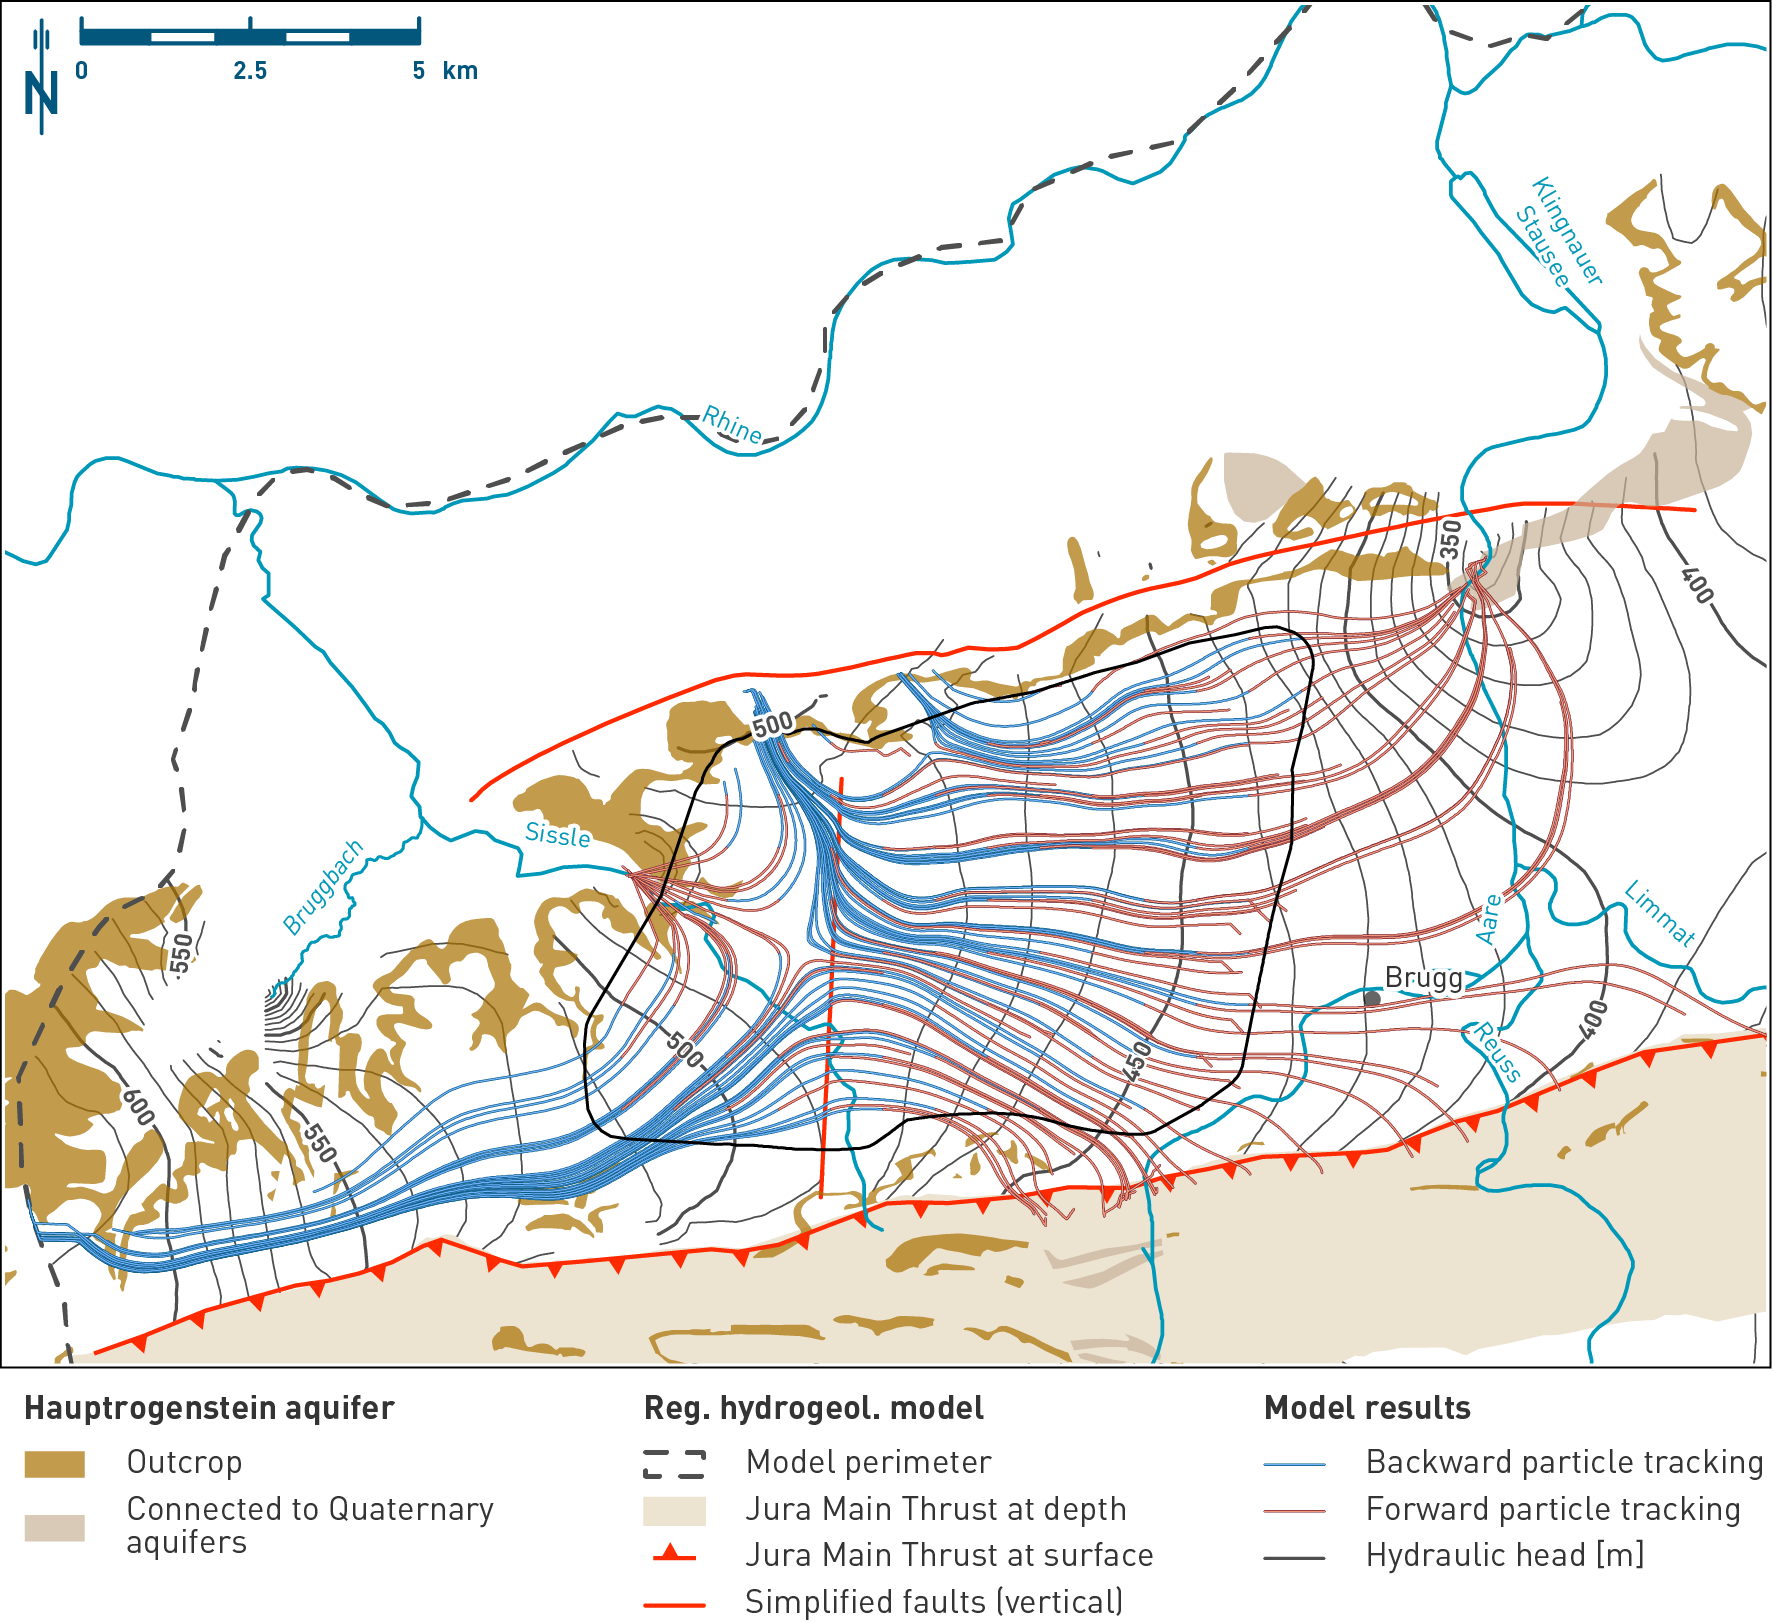
Fig. 4‑100:Simulated hydraulic heads and particle paths identifying recharge and discharge areas in the Hauptrogenstein aquifer
Hydraulic head situation at the top of the Hauptrogenstein aquifer of the hydrogeological model. The map shows the outcrops and the simplified regional fault pattern used in the model. The displayed particle paths are a 2D projection of the 3D particle traces. Note the west to east orientation of the groundwater flow. Particles that stop close to the eastern boundary of the site do not display any further displacement as they are trapped in the overlying low permeability formation (see discussion in Nagra 2024n).
Where present, the Keuper aquifer is the nearest aquifer below the Opalinus Clay. It is characterised by important lithological variations (Section 4.2.4) and a large variability of its hydraulic properties (Section 4.5.3.10, Fig. 4‑95). In the regional groundwater flow model, the Keuper aquifer unit is abstracted in one layer. The local complexity of the associated groundwater flow systems was regionally evaluated through the following cases (Nagra 2024n):
-
Base case: It includes an almost site-specific parametrisation of the Keuper aquifer. The area north of the Jura Main Thrust and the Baden – Irchel – Herdern Lineament is subdivided into different zones based on hydrogeological observations, facies maps, and tectonic overprint (Nagra 2024n). The zone surrounding the ZNO siting region is linked to the occurrence of the brecciated, cavernous lithofacies of the Seebi Member (Section 4.5.3.10). Another zone approximates the extent of the comparably thick transmissive facies of the Gansingen Member as observed in the JO siting region (Section 4.5.3.10). Around the NL siting region, another zonation aims to represent an area of the Keuper aquifer dominated by fluviatile channels of the Ergolz Member.
-
Homogeneous isotropic case: To evaluate the impact of a less compartmentalised model on the groundwater flow system (i.e. in comparison to the base case), a homogeneous and isotropic medium was considered as an alternative to the base case (Fig. 4‑101).
The two cases were calibrated leading to a comparable fit between simulated and observed hydraulic heads. However, the base case results in a slightly better agreement between modelled and observed hydraulic heads for the siting regions (Nagra 2024n).
While the two cases show a distinct hydraulic head distribution (Nagra 2024n), both provide a consistent image of the main hydrogeological features of the Keuper aquifer:
-
Two different regional flow domains are recognised on Fig. 4‑101. A first groundwater flow system exists north of the Jura Main Thrust and the Baden – Irchel – Herdern Lineament. It is well constrained by the outcrops to the southeast of the Wutach River, but also in the lower Aare Valley and in the Tabular Jura north of JO (Fig. 4‑101). A second regional flow domain exists south of the Jura Main Thrust and the Baden – Irchel – Herdern Lineament.
-
The potential recharge areas are located between the Wutach and the Klettgau Valleys north of the NL and ZNO siting regions, and locally on Keuper outcrops north of the JO siting region (Fig. 4‑101). Similar to the Muschelkalk aquifer, the Keuper aquifer discharges in the lower Aare Valley as well as in the Quaternary aquifer of the Sissle Valley west of the JO siting region.
-
Calibration of the base case and the alternative homogeneous isotropic case led to low hydraulic conductivities in the area north of the Jura Main Thrust and the Baden – Irchel – Herdern Lineament. Values are between 10-8 and 10-10 m/s for the base case and approximately 10-9 m/s for the alternative case (Nagra 2024n). Particularly low values are found in the NL siting region for the base case (approximately 10-10 m/s), in agreement with the results of the hydraulic packer tests (Fig. 4‑94).
-
The two calibrated models (Fig. 4‑101) show similar groundwater flow patterns in the siting regions despite their difference in the distribution of hydraulic conductivities. Backward particle tracking indicates groundwater flow in the ZNO siting region towards the south-southeast impacted by the presence of the recharge area in the north. This agrees with the flow direction inferred from the hydraulic head data.
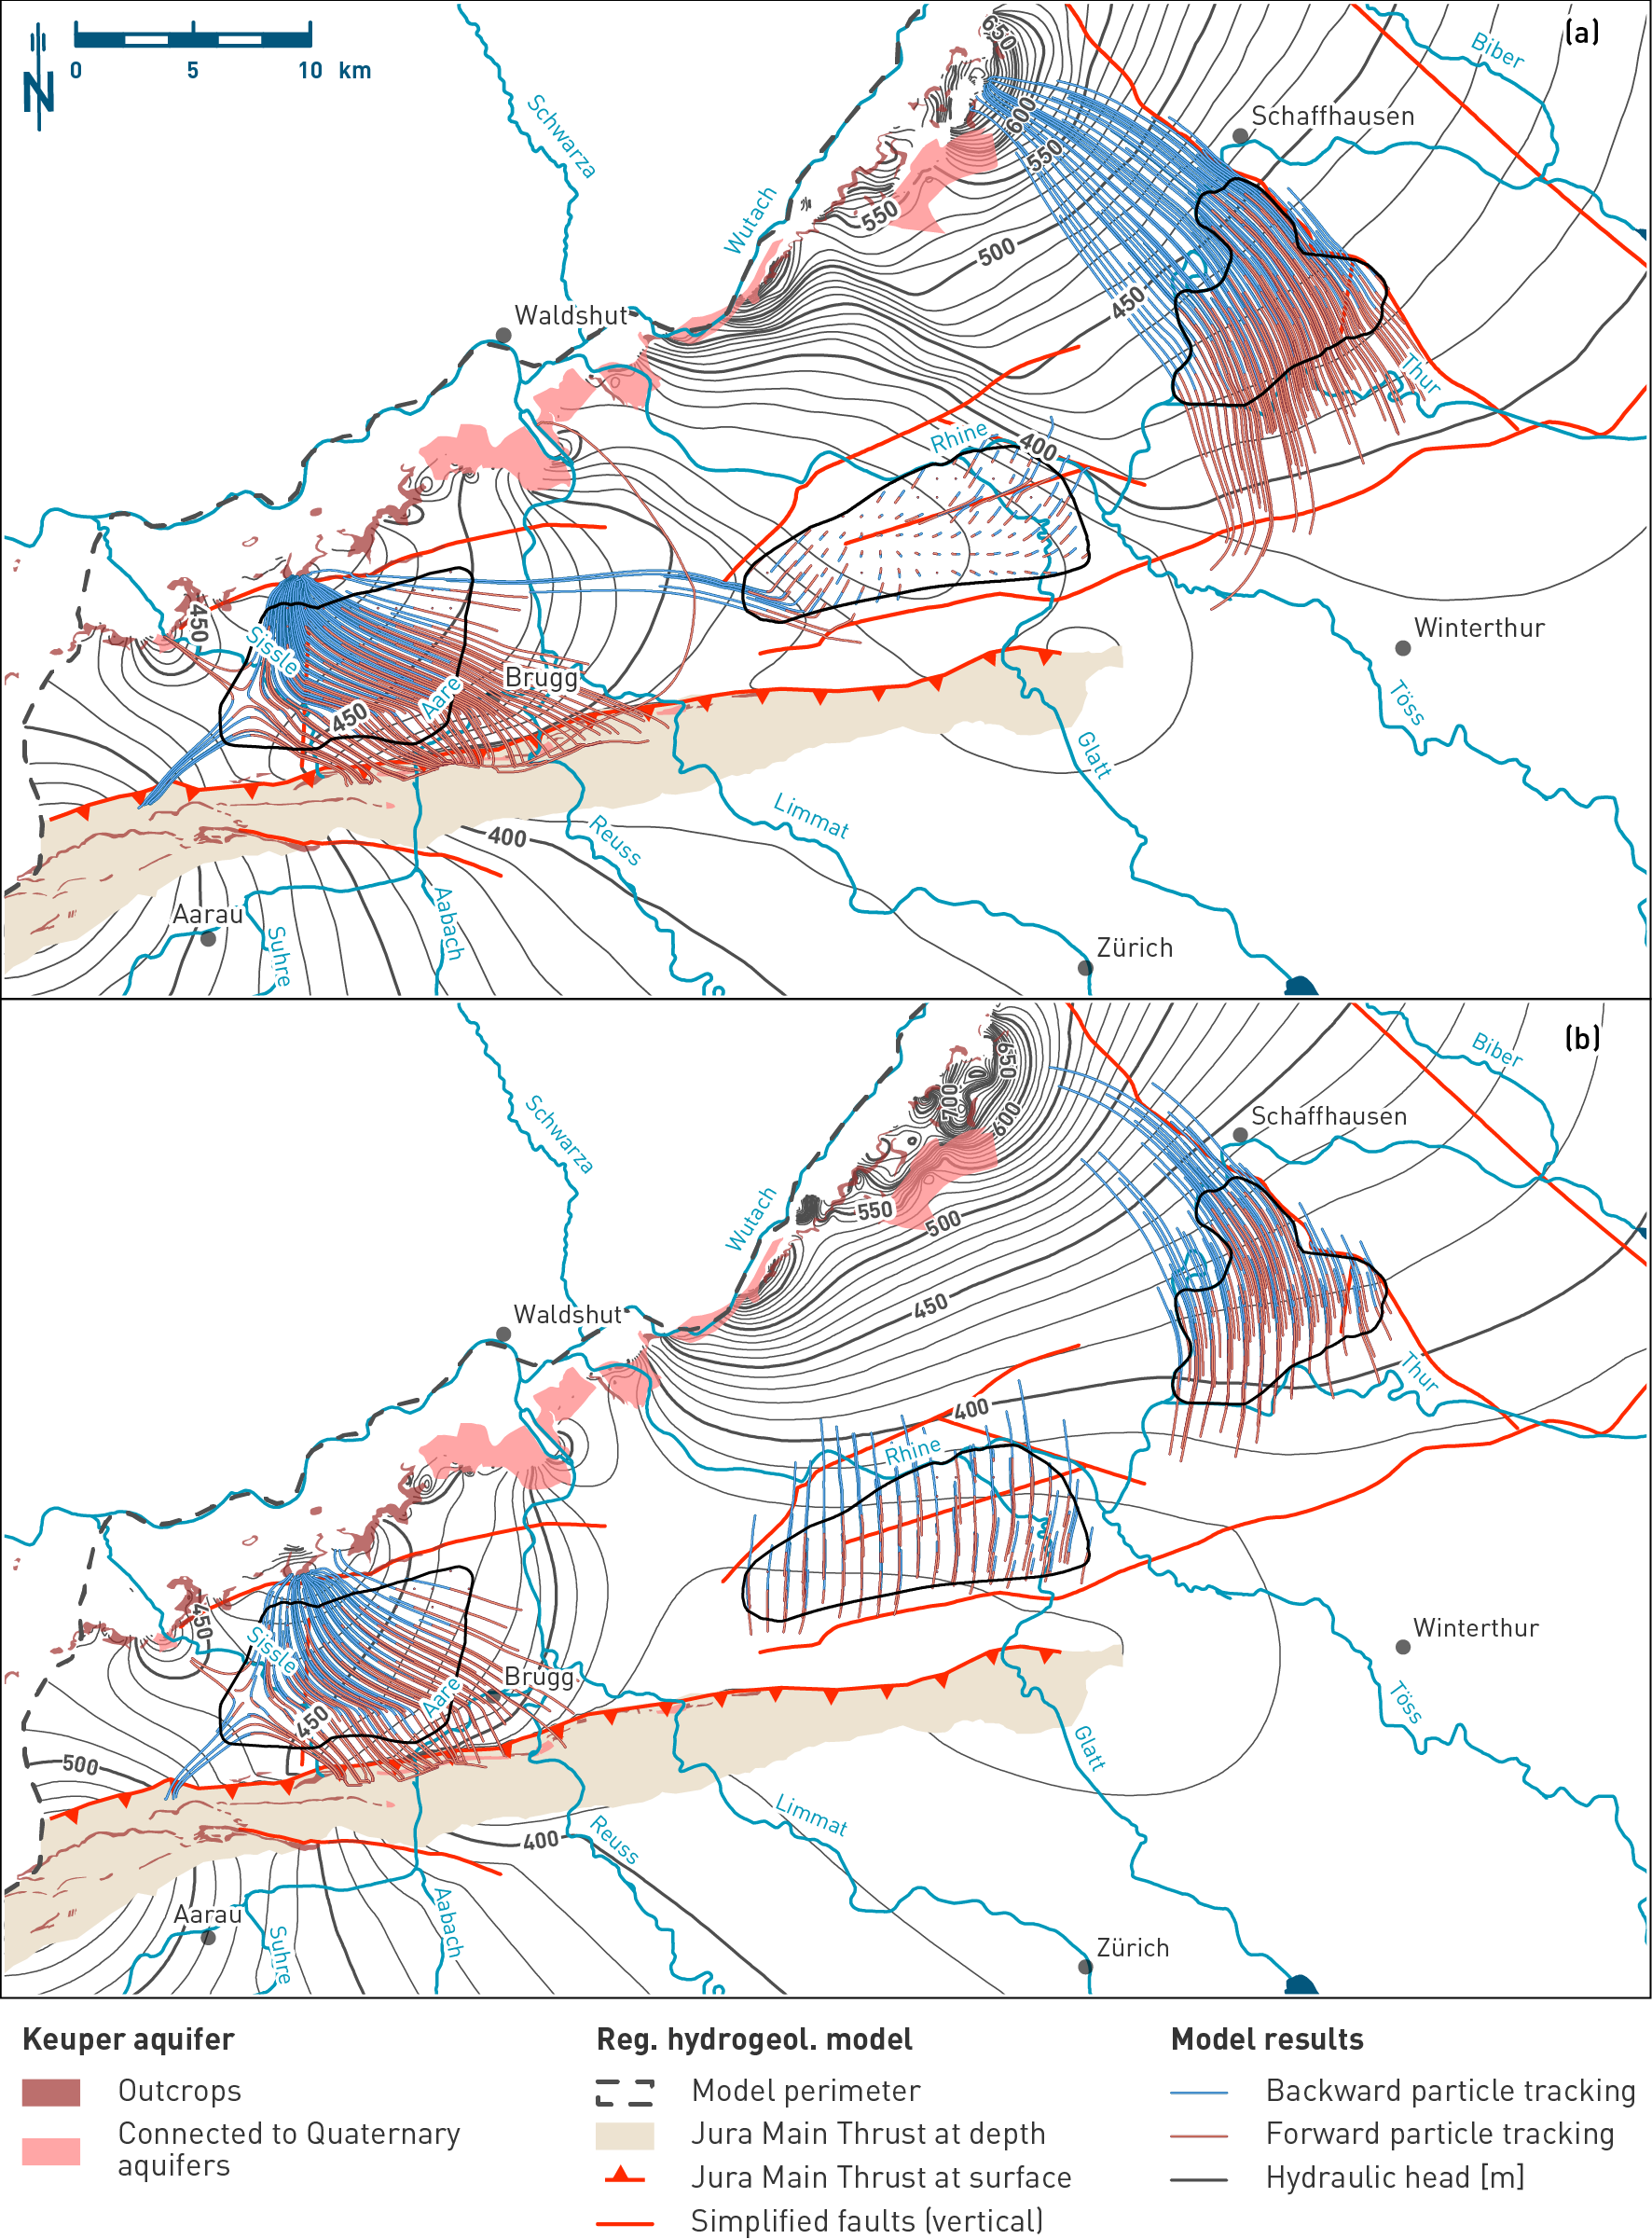
Fig. 4‑101:Simulated hydraulic heads and particle tracking in the Keuper aquifer identifying recharge and discharge areas for the base case (upper figure) and alternative homogeneous isotropic case (lower figure)
Hydraulic head situation at the top of the Keuper aquifer horizon of the hydrogeological model. Base case with different domains of hydraulic properties, alternative homogeneous isotropic case assuming uniform properties north of the Jura Main Thrust and the Baden – Irchel – Herdern Lineament. See text for detailed discussion. The map also shows the outcrops and the simplified regional fault pattern used in the model. The displayed particle paths are a 2D projection of the 3D particle traces. Note the short distances travelled by the particles released in the NL siting region during the considered time frame for the particle tracking indicating very slow flow velocities, particularly in the base case (see discussion in Nagra 2024n).
For the NL siting region, the two model cases indicate only small flow distances during the time frame considered for the particle tracking, highlighting the low hydraulic gradients and the comparably lower hydraulic conductivity in the base case. The major recharge areas are located in the north or northeast in both cases. From the siting region, the particles migrate towards the regional discharge area in the lower Aare Valley or towards the low hydraulic head zone in the Limmat north of the Jura Main Thrust.
Both models also show consistent results in the vicinity of the JO siting region: The hydraulic head distribution is mainly constrained by the presence of the Keuper outcrops to the north, where water is recharging, and the regional and local discharge areas in the lower Aare Valley and in the Sissle Valley respectively.
The Muschelkalk aquifer was implemented based on the hydraulic conductivities observed in the boreholes and a depth-dependence (Fig. 4‑96). In addition, tectonic overprint was taken into account (Nagra 2024n).
As for the Malm aquifer, the groundwater flow system in the zone north of the Jura Main Thrust and the Baden – Irchel – Herdern Lineament is controlled by the topography and the outcrop situation. The flow system in this zone is well supported with borehole data, notably within the siting regions. The area further to the south is less constrained by borehole data, but the sensitivity analyses show that the detailed situation in the southern part of the model is of little importance for conditions in the siting regions (Nagra 2024n).
In the northeastern part of the domain, the recharge of the Muschelkalk aquifer mainly occurs in the Wutach Valley where the Muschelkalk aquifer is outcropping at the valley flanks. The important groundwater inflow from the north leads to a regional groundwater divide roughly oriented northwest-southeast, the impact of which in the model is visible down to the southern model area. Such a divide has already been identified in earlier work (e.g. Nagra 2002). West of the groundwater divide, the flow system is aligned towards the discharge area near the confluence of the Aare and Rhine Rivers. Muschelkalk groundwater south of the Jura Main Thrust discharges in the lower Reuss and Aare Valleys, as well as in the Limmat Valley in the Baden area (i.e. discharge of thermal water), where the associated rivers cut through the Jura Main Thrust (Fig. 4‑102). This is in agreement with earlier work (Gmünder et al. 2014, Nagra 2014e).
Forward and backward particle tracking indicates that the groundwater flow in the NL and ZNO siting regions shares a similar pathway (Fig. 4‑102). It infiltrates in the northern Wutach Valley area, turns towards the southwest, flowing through the siting regions before exfiltrating after several tens of kilometres at the convergence of the Rhine and Aare Rivers.
The flow system in the JO siting region is controlled by the local tectonic situation, topography and the nearby discharge areas (Fig. 4‑102). Particle tracking indicates that the Muschelkalk aquifer is recharging at outcrops to the north of the siting region and by vertical recharge of water along the Jura Main Thrust to the south. Groundwater is discharging in the lower Aare Valley to the east, and the lower Sissle Valley to the west where outcrops meet Quaternary aquifers.
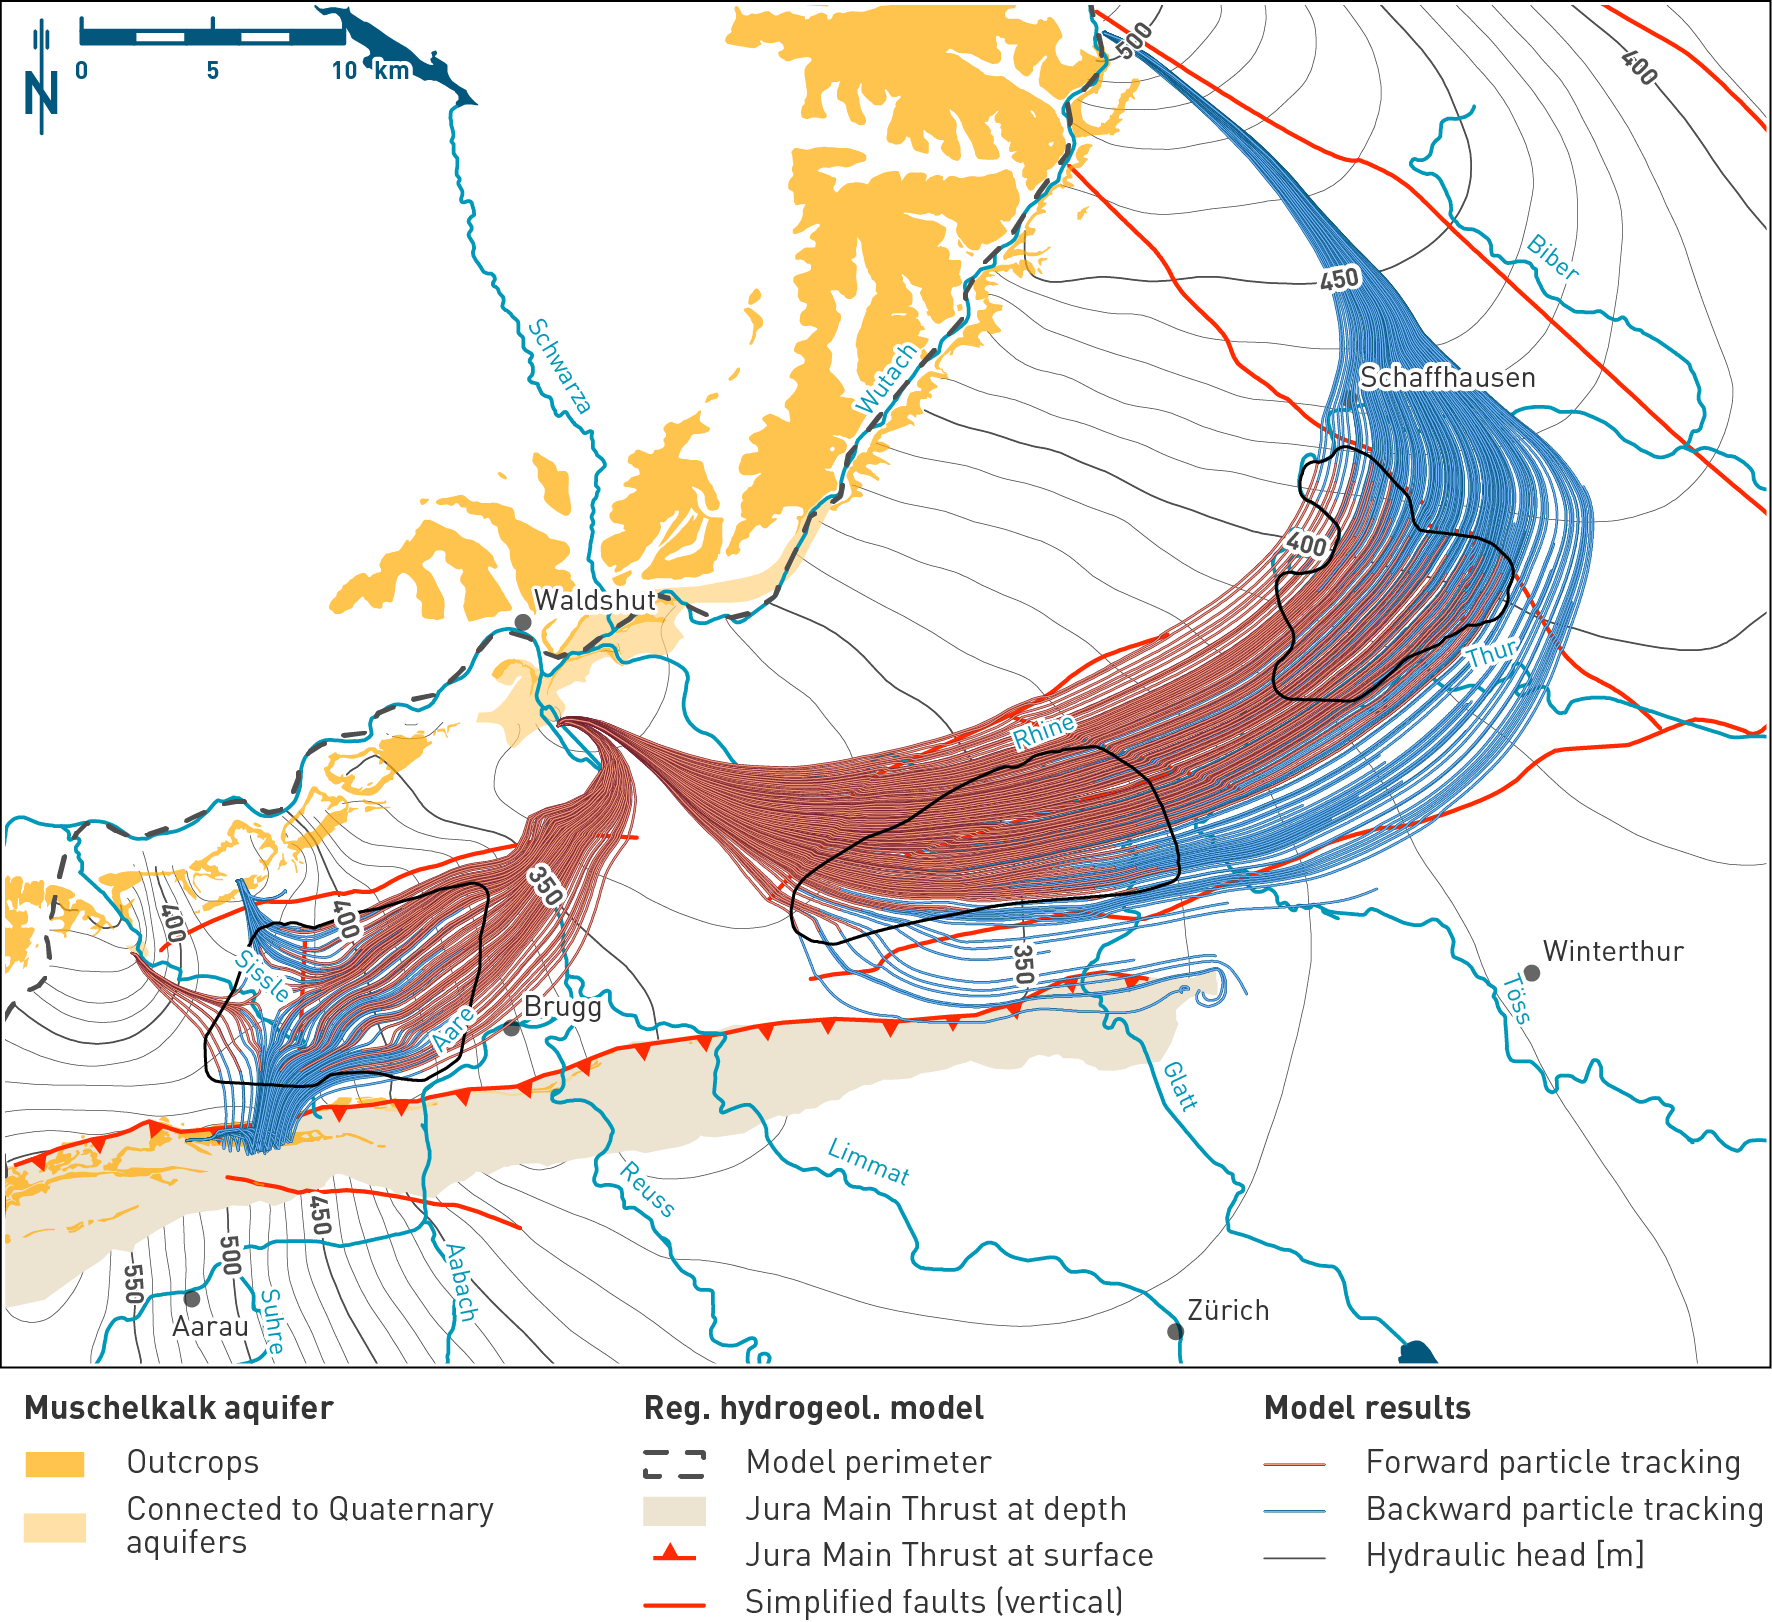
Fig. 4‑102:Simulated hydraulic heads and particle tracking identifying recharge and discharge areas in the Muschelkalk aquifer
Hydraulic head situation at the top of the upper Muschelkalk aquifer of the hydrogeological model. The map shows the outcrops and the simplified regional fault pattern used in the model. The displayed particle paths are a 2D projection of the 3D particle traces. Note the well-defined regional flow paths of the groundwater flowing through the NL and ZNO siting regions, and the more local groundwater flow system around the JO siting region.
The difference in hydraulic heads between aquifers below and above the Opalinus Clay was regionally evaluated based on the result of the hydrogeological model (Fig. 4‑103; Nagra 2024n). This gives valuable information on transport dynamics under steady-state hydraulic conditions in the host rock and the confining units. In combination with the distance between the considered aquifers and the vertical distribution of hydraulic conductivities in the aquitards, it helps to constrain the magnitude and direction of the steady-state vertical hydraulic gradient in the host rock and confining units.
The Hauptrogenstein and Malm aquifers are the nearest aquifers above the Opalinus Clay approximately west and east of the Aare Valley, respectively. The presence or absence of the Keuper aquifer below the Opalinus Clay can potentially shorten or increase the distance that separates the over- and underlying aquifers. The hydraulic difference is thus evaluated considering the possible combinations (i.e. Malm – Keuper, Malm – Muschelkalk, Hauptrogenstein – Keuper and Hauptrogenstein – Muschelkalk) as illustrated in Fig. 4‑103.
The absolute magnitude of the hydraulic head difference is mainly below ca. 100 m (Fig. 4‑103) in the area of the siting regions but can be higher close to the main recharge boundaries of the aquifers. From a site-specific perspective, downward gradients are calculated in the JO siting region. Upward hydraulic gradients are, however, inferred in the northeastern part of the siting region in the case where the Hauptrogenstein and the Keuper aquifers are considered.
In the ZNO siting region, head differences involving the Malm aquifer and the Keuper or Muschelkalk aquifers indicate upward gradients. This agrees with the artesian conditions observed for the Keuper aquifer in the BEN borehole and low hydraulic heads in the Malm. The head difference tends to increase towards the northwest, reaching a value greater than 50 m.
In the NL siting region, hydraulic head differences are comparably small. While the combination Malm and Muschelkalk shows overall downward gradients, the northern part of the siting region indicates weak upward gradients when the Keuper aquifer is considered.
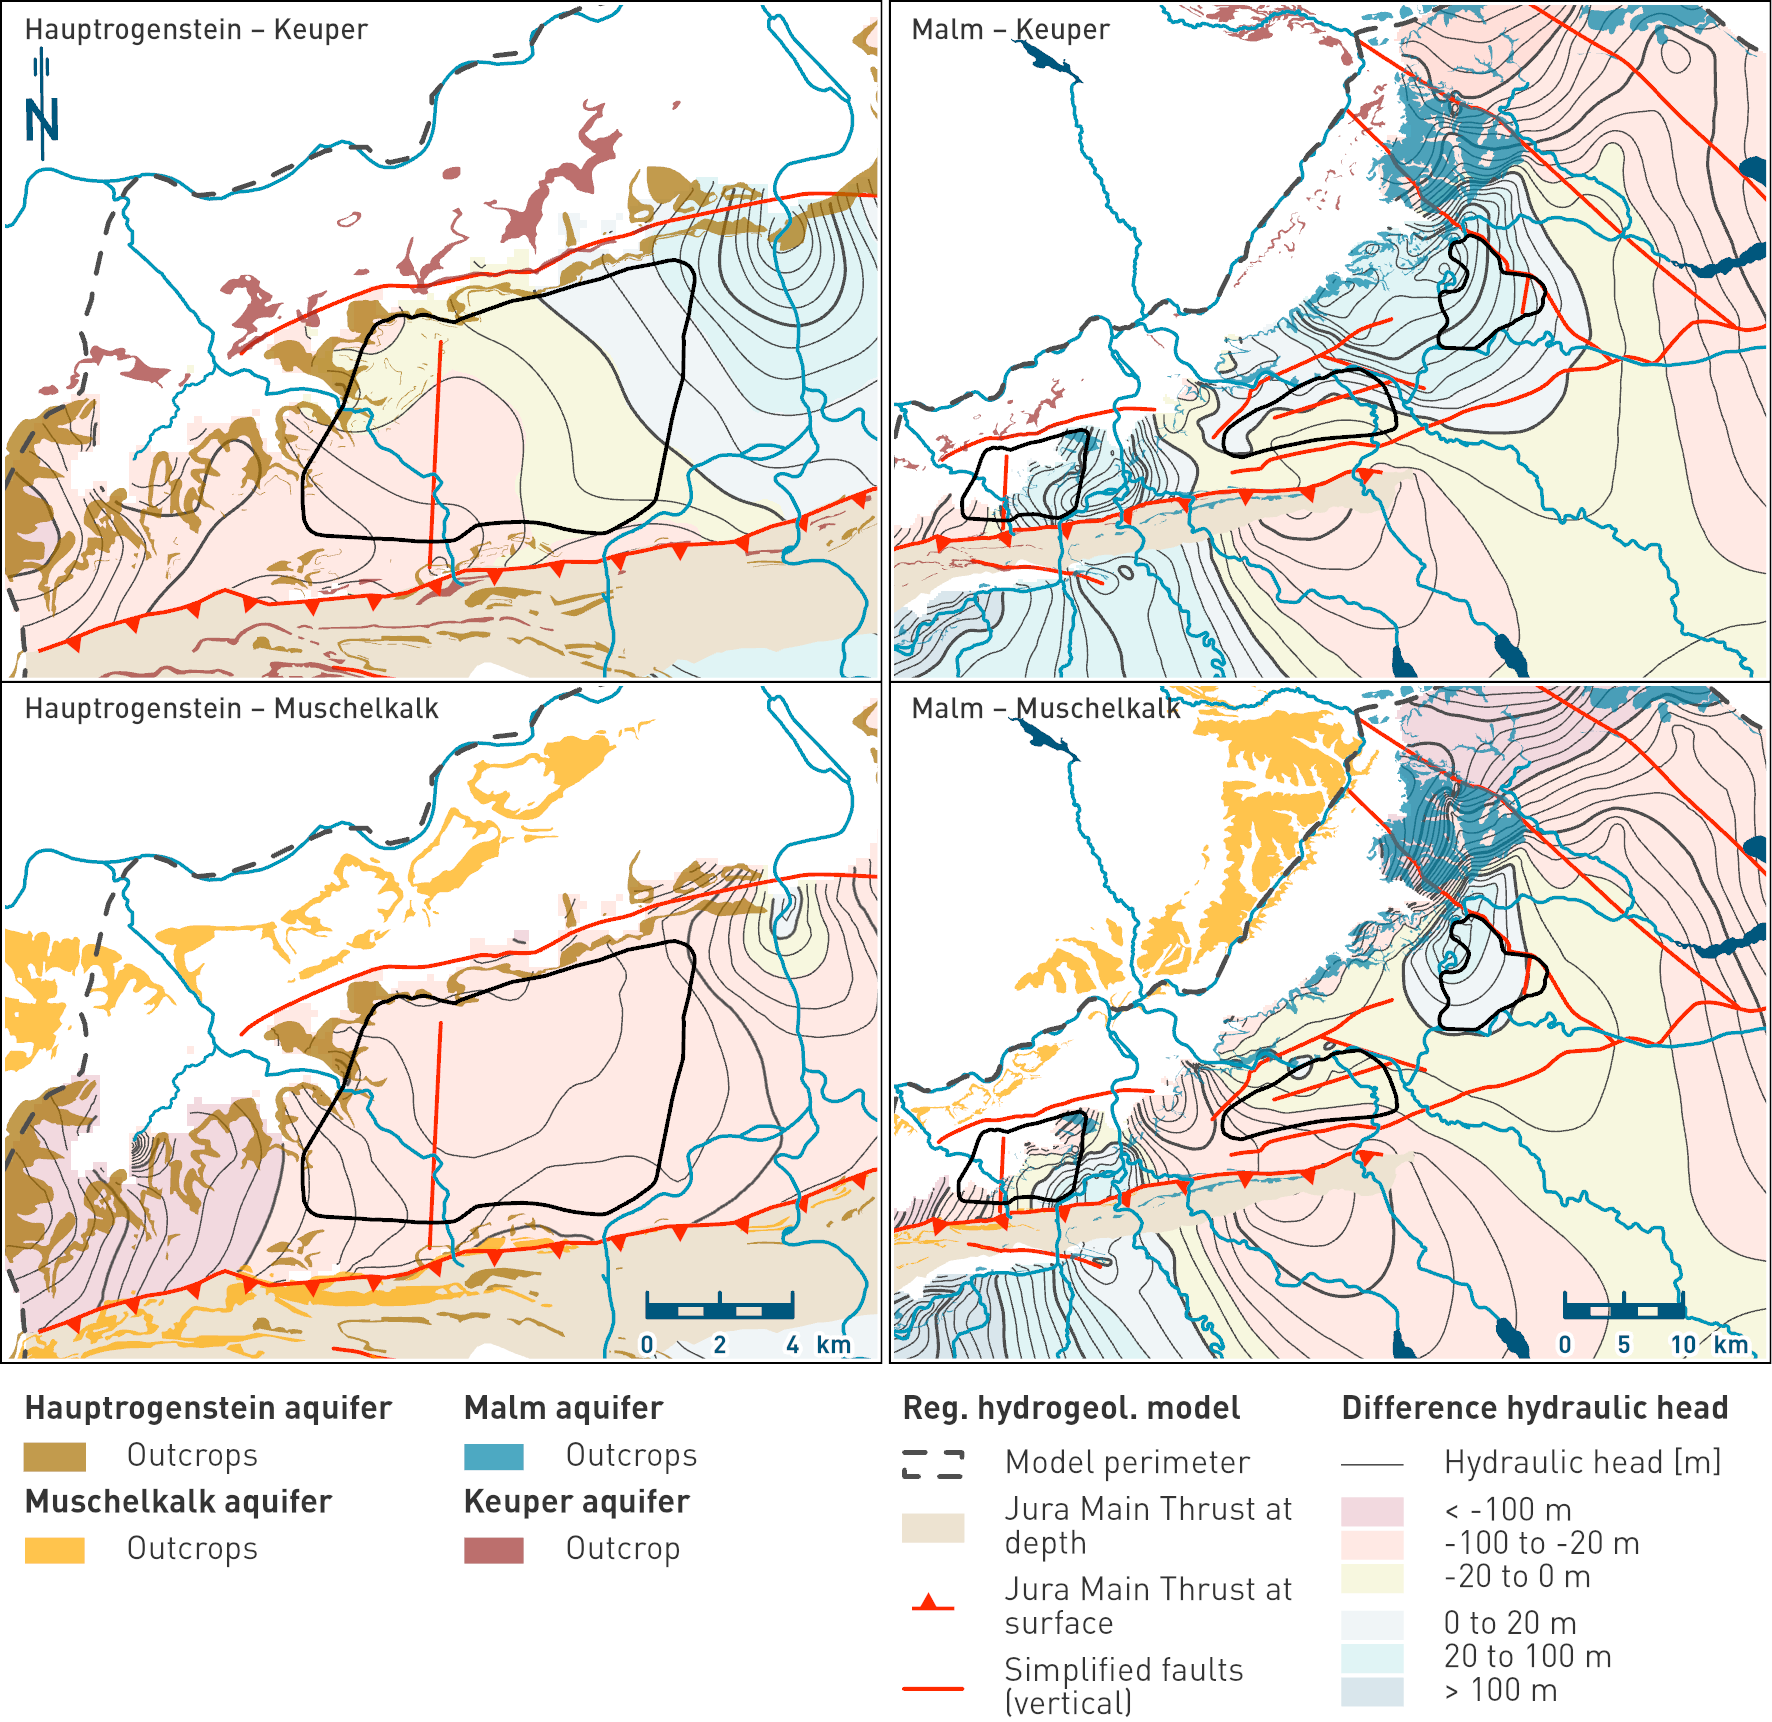
Fig. 4‑103:Difference in hydraulic heads between aquifers above and below the Opalinus Clay
Negative and positive values indicate upward and downward gradients, respectively. The maps show the outcrops and the simplified regional fault pattern used in the model.
This section presents the major hydrogeochemical data of the deep aquifers situated above and below the repository host rock. As detailed in Section 4.5.3, these are the Malm and Hauptrogenstein aquifers above, and the Keuper and Muschelkalk aquifers below the host rock. Using major solute concentrations, stable isotopes, age tracers and dissolved gas concentrations, this section discusses groundwater origin, the governing mineral reactions, regional flow systems including subsurface residence times, and the origin of dissolved gases for the different aquifers. As such, this section provides independent evidence for testing and improving the understanding of the regional flow systems derived from the steady-state hydrodynamic simulations (Section 4.5.4).
The hydrogeochemical data are presented and discussed for each aquifer in the regional context of Northern Switzerland, with particular emphasis on the three siting regions. A comparison of the different aquifers is presented in a concluding section, discussing indications for both the absence and occurrence of cross-formation flow and providing explanations for the different hydrogeochemical conditions in the relevant aquifers.
While this section focuses on the aquifers above and below the repository host rock, it also contains limited hydrogeochemical information on the aquifers of the Molasse units located above the Malm aquifer, as well as the crystalline basement aquifers located below the Muschelkalk aquifer. This information is useful for evaluating potential hydraulic and hydrogeochemical connections between these aquifers. Accordingly, hydrogeochemical information on these additional aquifers is provided in the description of the aquifers with which there is a potential hydraulic communication.
A regional overview of existing hydrogeochemical data for the aquifers above and below the repository host rock as well as other deep aquifers including the Molasse, Buntsandstein, Permo-Carboniferous and crystalline basement aquifers is provided in Waber & Traber (2022) and in the individual TBO borehole reports (Tab. 2‑1).
A) Hydrogeochemical characterisation and groundwater origin
Groundwater samples from the Malm aquifer in Northern Switzerland and adjacent areas display a large range in composition and mineralisation (Fig. 4‑104). Low-salinity groundwaters with concentrations of total dissolved solids (TDS) below 2 g/L show a depth-dependent water composition. Samples taken from shallow boreholes ranging down to about 300 m below surface are of the Ca-HCO3 or Ca-Mg-HCO3 type. At greater depths, Na+ may become the dominant cation and groundwaters also relate to the Na-HCO3 type. In contrast, high salinity groundwaters with TDS concentrations of up to 19 g/L are of the Na-Cl type. In the Malm aquifer of Northern Switzerland, Na-Cl type groundwaters are almost exclusively observed in the ZNO and NL siting region. Moreover, they are closely related to Na-Cl type groundwaters from the Molasse aquifers located above (i.e. USM, OMM). Since Na-HCO3 type waters from the Malm and the Molasse aquifers also show strong similarities, both types of Molasse groundwaters are shown together with the Malm groundwater samples (Fig. 4‑104, open symbols).
The Na-Cl type groundwaters plot on or close to the seawater dilution line in the Br-Cl and Na‑Cl plots (Fig. 4‑104). Accordingly, they represent diluted seawater, which means that Cl and Na are of marine origin. In the stable water isotope plot, all Na-Cl type groundwaters are shifted to the right of the Global Meteoric Water Line (GMWL; Fig. 4‑104), which is consistent with a non-meteoric origin. In contrast, the low-salinity groundwaters (i.e. Ca-HCO3, Ca-Mg-HCO3, Na‑HCO3 type groundwaters) plot on the GMWL although actual values of stable water isotopes show quite large variations with δ18O ranging from -12 to -8 ‰. Values below -11 ‰, indicating meteoric water recharge during cold, glacial periods, are measured for the Na-HCO3 type groundwaters mainly occurring in the Bodensee region (Fig. 4‑105). In contrast, all Ca-HCO3 type groundwaters display δ18O values between -10 and -8 ‰ typical for recharge during climatic conditions similar to today.
The different water types are also reflected in groundwater residence times inferred from 3H and 14C activities. The Ca-HCO3 and Ca-Mg-HCO3 type groundwaters show significant 14C activities (Fig. 4‑104) and are often 3H-bearing, indicating that meteoric water recharge occurred in the recent past. In contrast, all Na-Cl type groundwaters and some of the Na-HCO3 type groundwaters are 14C-free, suggesting a residence time of more than ca. 40 kyr.
Na-Cl type groundwaters show elevated 4He concentrations up to 6 × 10⁻² ccSTP/g (Fig. 4‑104). Based on the low 4He production rates of the Malm carbonates (Waber & Traber 2022), such 4He concentrations cannot result from in-situ 4He underground production over reasonable geological timescales. It follows that the 4He in the Na-Cl type groundwaters is of allochthonous origin. The most likely source is the diffusive 4He exchange between the Malm aquifer and the porewater of the adjacent aquitards. However, the observations that the 4He concentrations in the Malm aquifer at TRU1 and MAR1 are above those in the adjacent porewater (Rufer et al. 2024) demonstrate that other 4He sources are relevant as well (Ballentine & Burnard 2002). The most likely candidate is radiogenically produced 4He infiltrating into the Malm aquifer along deep-reaching faults.
B) Regional groundwater systems
The different hydrochemical signatures of the Malm groundwaters in Northern Switzerland reflect different stages in their hydrogeochemical evolution. This is discussed below for the three major water types.
Ca-HCO3 and Ca-Mg-HCO3 type waters: Shallow groundwaters close to outcrops
The chemical composition of the Ca-HCO3 and Ca-Mg-HCO3 type groundwaters is almost exclusively controlled by the chemical equilibrium between water, calcite (CaCO3), CO2 and, if present, dolomite (CaMg(CO3)2). Thus, they fully reflect the carbonate-dominated mineralogical composition of the Malm aquifer (Section 4.5.3.3). In Northern Switzerland, Ca-HCO3 type groundwaters occur at shallow depths (< 300 m) where the Malm units outcrop at the surface or where the Malm outcrops are in contact with unconsolidated rock aquifers such as at the southern margin of the Black Forest (Fig. 4‑105). Accordingly, they represent the first stage of the hydrogeochemical evolution when meteoric water infiltrates into the Malm aquifer. This is consistent with short residence times inferred from the detection of 3H, their high 14C activities and δ18O signatures overlapping with recent recharge signatures (Fig. 4‑104).
The Ca-Mg-HCO3 type waters are closely related to the Ca-HCO3 type. As a result of the comparatively slow reaction kinetics of dolomite (Lüttge et al. 2003), significant Mg concentrations are only observed if the residence time is sufficiently high to reach equilibrium with respect to dolomite. Accordingly, Ca-Mg-HCO3 type groundwaters reflect a slightly more evolved state than Ca-HCO3 type groundwaters, which is consistent with their lower 14C activity, less negative 13C values indicating more carbon isotopic exchange with Malm carbonates, and occurrence at greater depth (Fig. 4‑104).
Na-HCO3 type waters: Ca-exchanged groundwaters in the Bodensee region
In addition to the dissolution of carbonates and CO2, the chemical composition of Na-HCO3 type groundwaters is controlled by Ca-exchange reactions with Na-exchanged clays (Waber & Traber 2022), resulting in excess Na and the deviation of these groundwaters from the seawater dilution line in the Na – Cl plot (Fig. 4‑104). Based on the low abundance of clay minerals in the Malm aquifers, the chemical signature of Na-HCO3 type groundwaters is a clear indication for a hydraulic communication with the above-lying clay-mineral-rich Molasse units. This is well supported by the strong hydrogeochemical similarities between Na-HCO3 type groundwaters from the Malm and those from the Molasse aquifers (Fig. 4‑104). δ18O values below -11 ‰ indicate cold-time climatic recharge conditions (Fig. 4‑104). Together with their low or absent 14C activities (Fig. 4‑104), this suggests that in the Bodensee region vertical recharge of most Na‑HCO3 groundwaters occurred during the last glaciation between 12 and 115 kyr ago (Section 6.3; Schlüchter et al. 2021).
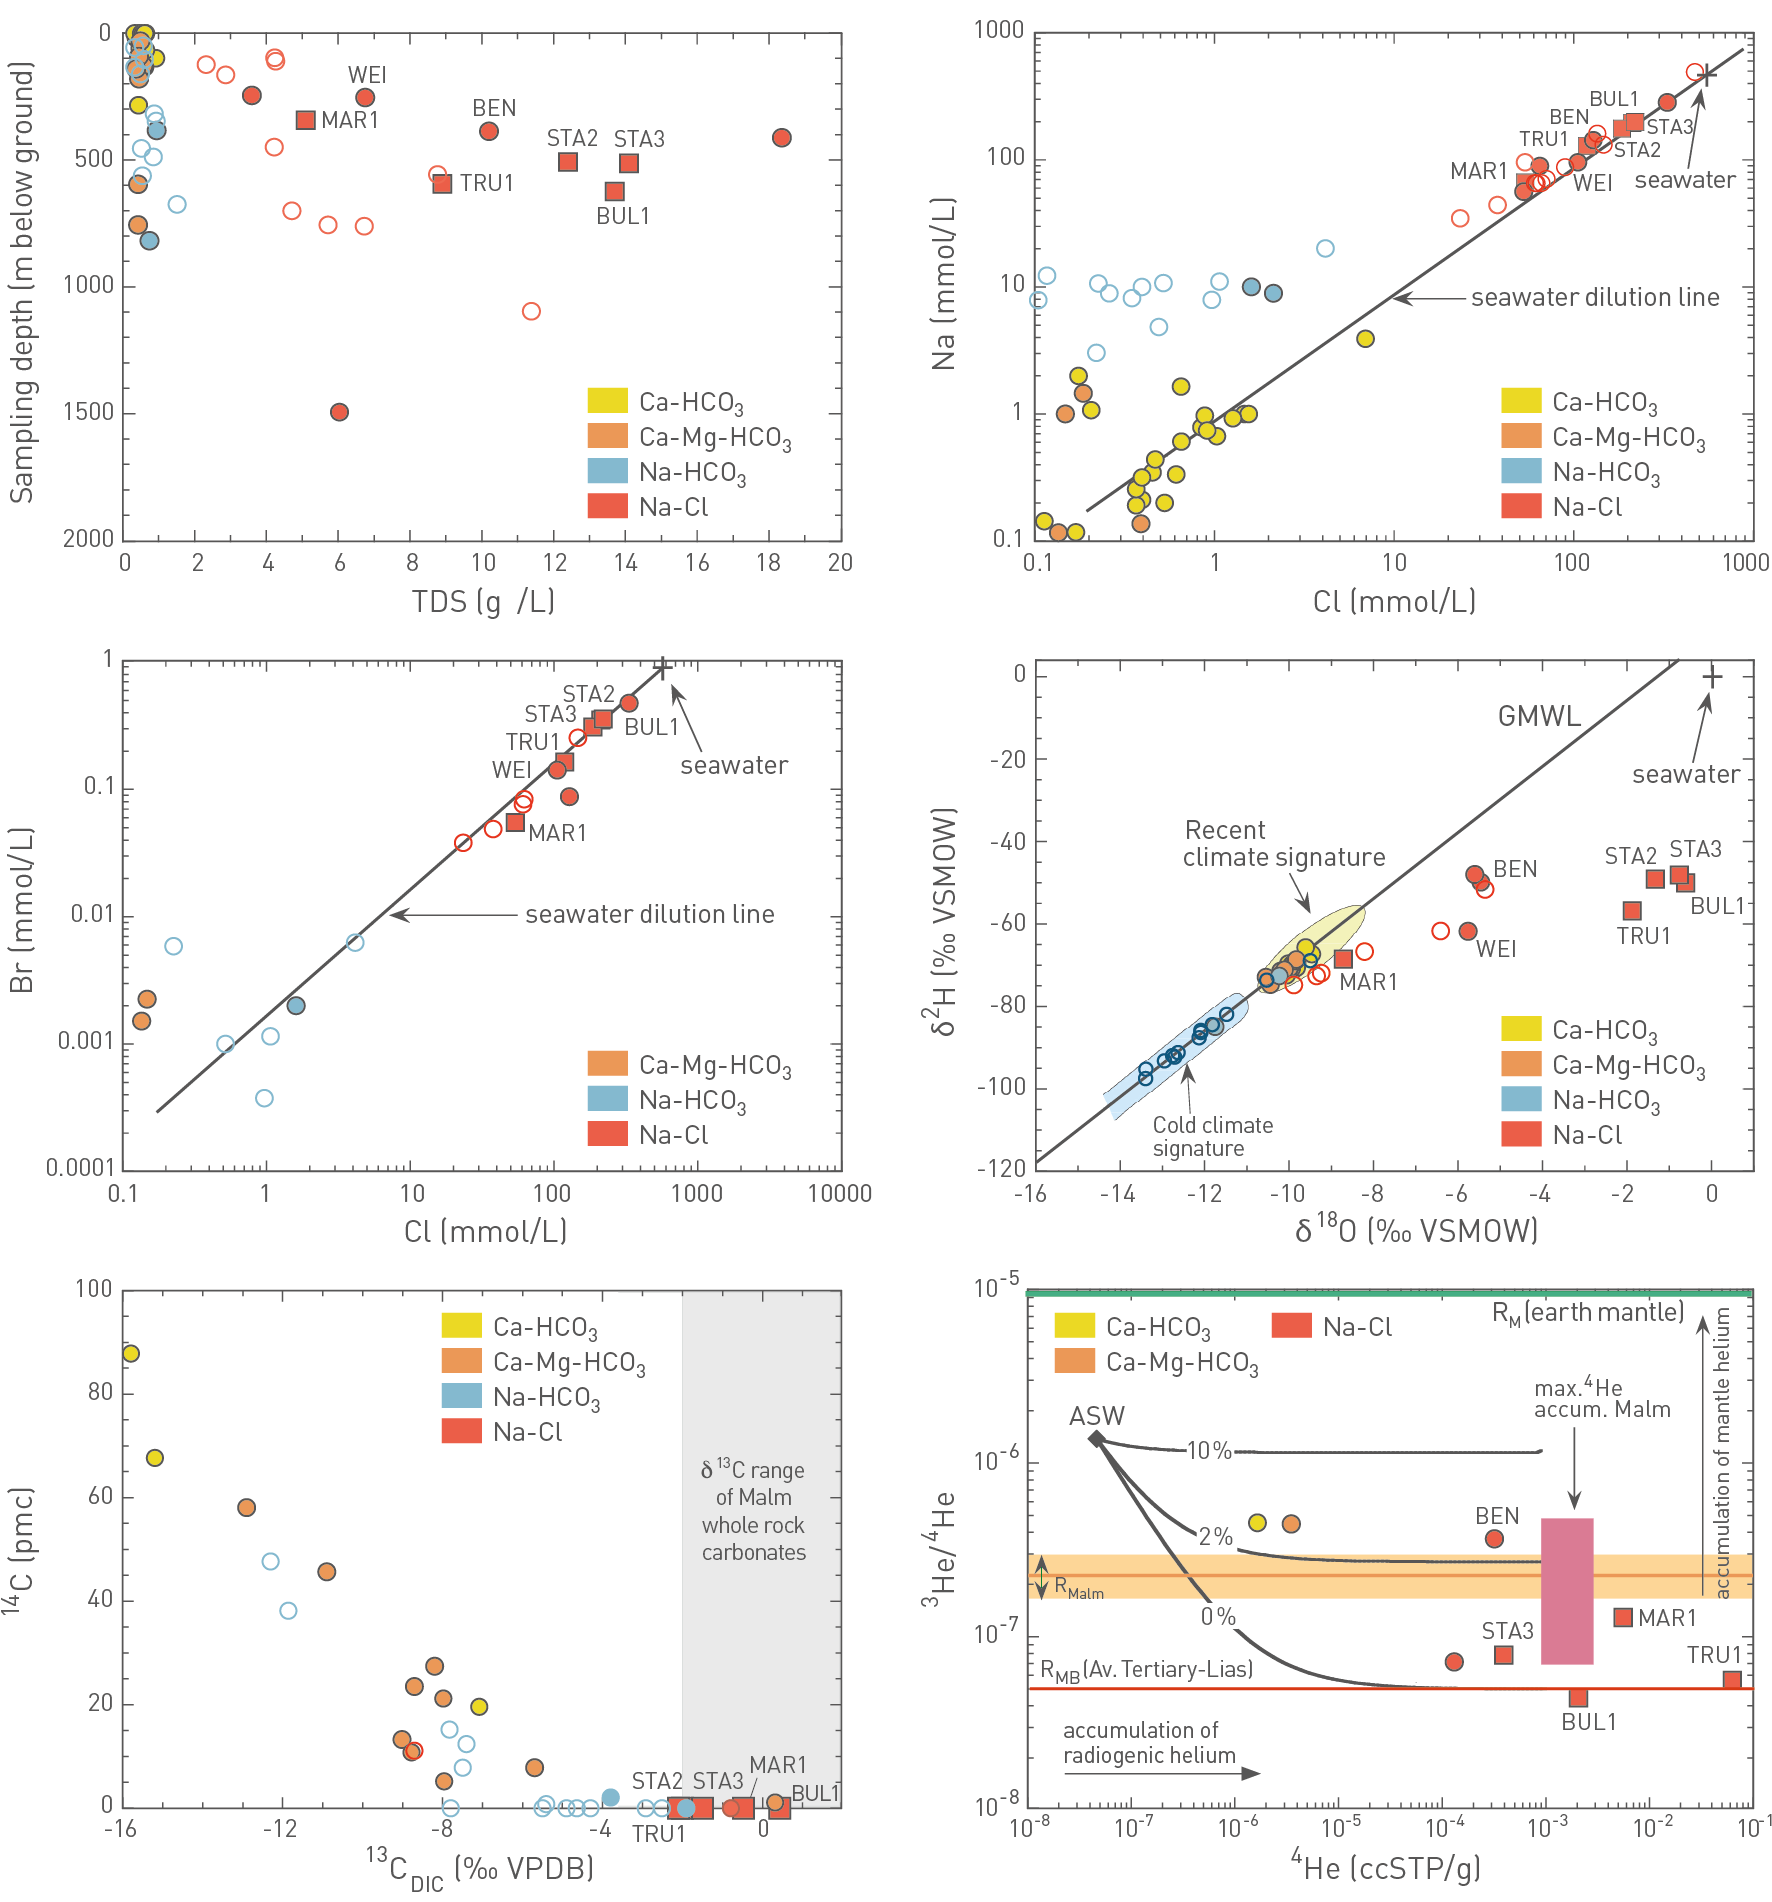
Fig. 4‑104:Cross-plots illustrating the behaviour of key hydrogeochemical parameters in groundwaters collected from the Malm (closed symbols) and Molasse aquifers (open symbols) in Northern Switzerland and Southern Germany
Filled circle and square symbols represent samples reported in Waber & Traber (2022) and collected during the TBO campaign, respectively. Open circle symbols refer to samples collected from Molasse aquifers to illustrate the similarity of Na-Cl and Na-HCO3 groundwaters collected from the Malm and Molasse aquifers. Sampling locations are only provided for the samples collected in the three siting regions.14C activities are corrected for drilling mud contamination and other sampling artefacts. RMB: average 3He/4He production ratio of Molasse to Lias Group sedimentary rocks in the Swiss Molasse Basin. RMalm: 3He/4He ratio (average and range) in Malm limestone of the BEN, OFT and SLA1 boreholes. Max. 4He accum. Malm: range of maximum accumulation of underground produced 4He in porewater under closed system conditions. ASW: air-saturated water (Kipfer et al. 2002). Black lines in the He-plot indicate the behaviour of hypothetical mixtures between ASW and RMB as well as different proportions of mantle helium (RM).
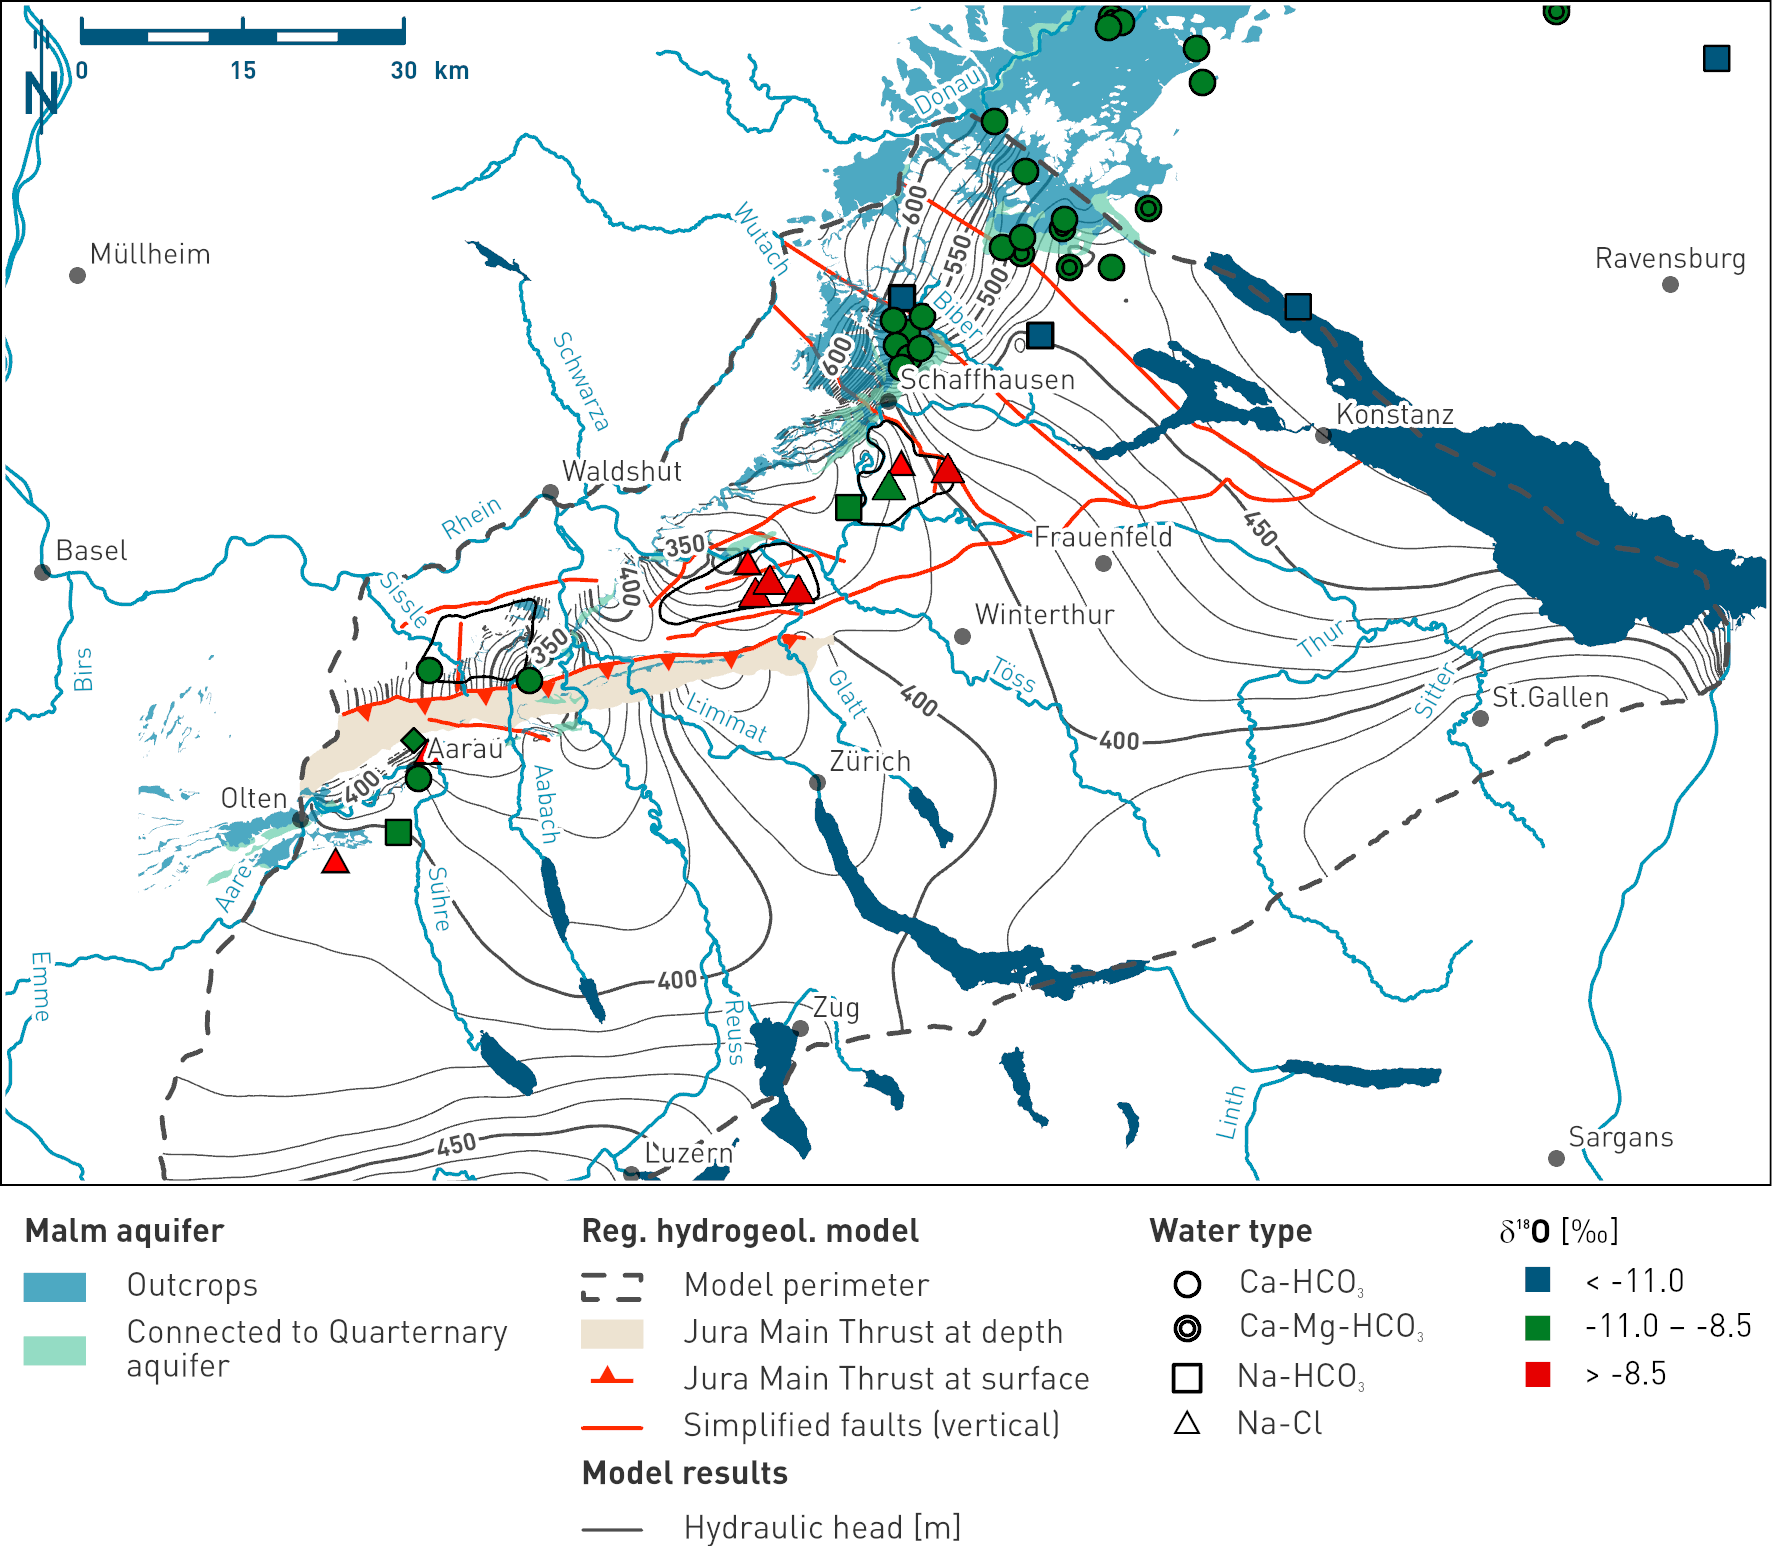
Fig. 4‑105:Map showing the spatial distribution of δ18O values in groundwaters collected from the Malm aquifer as an indication for the origin of the different water types
The symbols represent the water types while the colour of the fillings indicate the δ18O value range of the samples. The data range of δ18O of -11.0 to -8.5 ‰ VSMOW is representative for recent groundwaters of the region. Green colour denotes groundwater formed during climatic conditions similar as today in the study area. Groundwater samples marked in blue formed under colder climatic conditions. Groundwater samples marked in red (δ18O > -8.5 ‰ VSMOW) contain a significant amount of a modified seawater component (see text for details). The map also shows the Malm outcrops, the simplified regional fault pattern and the hydraulic heads according to the regional hydrogeological model (Section 4.5.4.2).
Na-Cl type waters: ZNO and NL siting regions
In contrast to the Ca-HCO3, Ca-Mg-HCO3, and Na-HCO3 type groundwaters, the chemical composition of the Na-Cl type groundwaters is dominated by an ancient seawater component overprinted by rock – water interaction processes. Hence, they represent the most evolved groundwaters of the Malm aquifer. In the ZNO and NL siting regions, all Malm groundwaters are of the Na-Cl type (Fig. 4‑104). Accordingly, understanding its hydrogeochemical evolution is of major interest. In general, the literature agrees that Na-Cl type groundwaters in the Malm aquifers originate from marine or brackish conditions prevailing during the sedimentation of the Upper Marine Molasse Group (OMM; Waber & Traber 2022 and references therein). Based on the hydrogeochemical similarity of Na-Cl and Na-HCO3 groundwaters from the Molasse (OMM, USM) and Malm aquifers (Fig. 4‑104), the OMM seawater penetrated downwards into the USM and eventually into the Malm aquifer. This is consistent with the hydrodynamic model indicating a vertical hydraulic gradient from the Molasse (USM) down to the Malm aquifer (Section 4.5.4.2).
In the plot of the stable isotopes of water (Fig. 4‑104), the Malm groundwaters from the ZNO and NL siting regions plot on a straight line to the right of the GMWL that is unable to match the composition of stable isotopes of current seawater. This suggests that they represent a mixture between an isotopically modified seawater and meteoric water. Based on the intersection of this correlation with the GMWL at a δ18O value of around -10.5 ‰, the meteoric water endmember probably infiltrated during an interglacial period similar to today. The proposed mixture is confirmed by excellent linear correlations between δ18O and Cl as well as δ2H and Cl (Fig. 4‑106). While the δ2H vs. Cl correlation falls on the seawater dilution line, the δ18O vs. Cl correlation is far off. This demonstrates that a process in addition to the dilution of seawater has modified δ18O values. The correlations between stable isotopes of water and Cl, as well as their relation to seawater, can be explained by a three-step hydrogeochemical evolution (Fig. 4‑106):
-
Dilution of seawater originating from OMM times with meteoric water during its downward migration into the Malm aquifer caused a shift of δ18O and δ2H values from seawater towards the GMWL. The amount of dilution and hence the resulting stable isotope values and Cl concentrations are unknown. The concentration of Cl, however, was higher than the maximum value measured in the two siting regions (ca. 200 mmol/L; Fig. 4‑104).
-
After emplacement of the groundwater in the Malm aquifer, the diluted and δ18O- and δ2H-modified seawater chemically and isotopically interacted with the Malm carbonates. Harrison et al. (2022) showed in laboratory experiments that the rate of oxygen isotope exchange between calcite and aqueous solutions is quite high, even under ambient conditions and chemical equilibrium, causing a measurable O isotope exchange over timescales of as little as weeks to months. Given that, after emplacement in the Malm aquifer, the groundwater interacted for at least several million years with the corresponding mineral phases, the groundwater δ18O values probably approached the O isotopic equilibrium with respect to calcite. Large temperature variations in the geological past (Mazurek et al. 2006), the unknown timing of the re-equilibration process, the strong temperature dependence of the oxygen isotope fractionation factor (Füger et al. 2018) and the variation of δ18O values of Malm carbonates (de Haller et al. 2011, Mazurek et al. 2018) means that the δ18O values after equilibration are not precisely constrained. Considering all uncertainties yields a re-equilibrated δ18O value in the range from 0 to 7 ‰. In contrast to δ18O, δ2H values are unaffected by the long-term interaction with calcite.
-
The infiltration of meteoric water during an interglacial period similar to today caused the dilution of the δ18O modified and diluted seawater. This eventually resulted in the observed correlations between δ2H and δ18O, δ2H and Cl, and δ18O and Cl (Fig. 4‑106).
The three-step model discussed above is fully consistent with the regional hydrogeological model proposed for the Malm aquifer (Section 4.5.4.2). For the northern parts of the ZNO and NL regions, the hydrogeological model implies that recharge occurs through the Malm outcrops north of the Rhine River (Fig. 4‑107). Accordingly, δ18O values are lower, the closer the sampling locations are to these outcrops. Based on the linear correlation between δ18O and Cl (Fig. 4‑106), the same applies for the Cl concentrations. It follows that the contribution of meteoric water in the groundwater mixture of the Malm aquifer increases with decreasing distance from the current recharge locations. Thus, the mixing ratio between the modified seawater and the meteoric water component is controlled by the current regional hydrogeological flow system.
Based on the lack of 14C in the in-situ groundwater samples from the ZNO and NL siting regions (Fig. 4‑104) and the signatures of stable water isotopes suggesting an interglacial composition similar to today, the meteoric component of the Malm groundwaters in the ZNO and NL siting regions has infiltrated in a previous interglacial period. This means that the corresponding residence time corresponds at least to the Eemian interglacial period 115 – 130 kyr ago (Preusser et al. 2011). This minimum results from the fact that the climatic signatures of cold climate recharge older than the last glaciation are likely to be masked by long-term mixing with multiple meteoric water components infiltrating under different climatic conditions, which could well be the case for the meteoric water component of the Malm groundwater in the ZNO and NL siting regions. Moreover, it should be noted that the minimum residence time estimate (115 – 130 kyr) also applies for the groundwater sample from MAR1, showing the highest contribution of the second, more recent meteoric water component of all Malm samples in the ZNO and NL siting regions.
The 81Kr model ages of groundwaters collected from the two siting regions range from 143 to 608 kyr and show a linear correlation with δ2H and hence with δ18O and Cl (Fig. 4‑106). Because the residence time of the modified seawater component from OMM times is of the order of several million years and the low solubility of Kr in seawater, the modified seawater component is probably 81Kr-free. Gerber et al. (2017) have shown that, for such mixing scenarios with an 81Kr-free endmember, 81Kr model ages are close to the model age of the younger 81Kr-bearing endmember. Accordingly, the residence time of the meteoric water component in the Malm aquifer of the ZNO and NL siting regions refers to the derived 81Kr model ages. In analogy to δ18O and Cl, the derived 81Kr model ages are consistent with the regional hydrogeological flow model (Section 4.5.4) A comparably low 81Kr model age of 148 kyr was obtained for MAR1, which is close to the Malm outcrops north of the Rhine River where recharge of meteoric water occurs (Fig. 4‑107). In contrast, the highest 81Kr model ages (> 519 – 608 kyr) are observed at STA2, STA3 and BUL1 where the hydraulic connection with the recharge location north of the Rhine River is poor, which fits well with a higher residence time of the diluting meteoric water component.
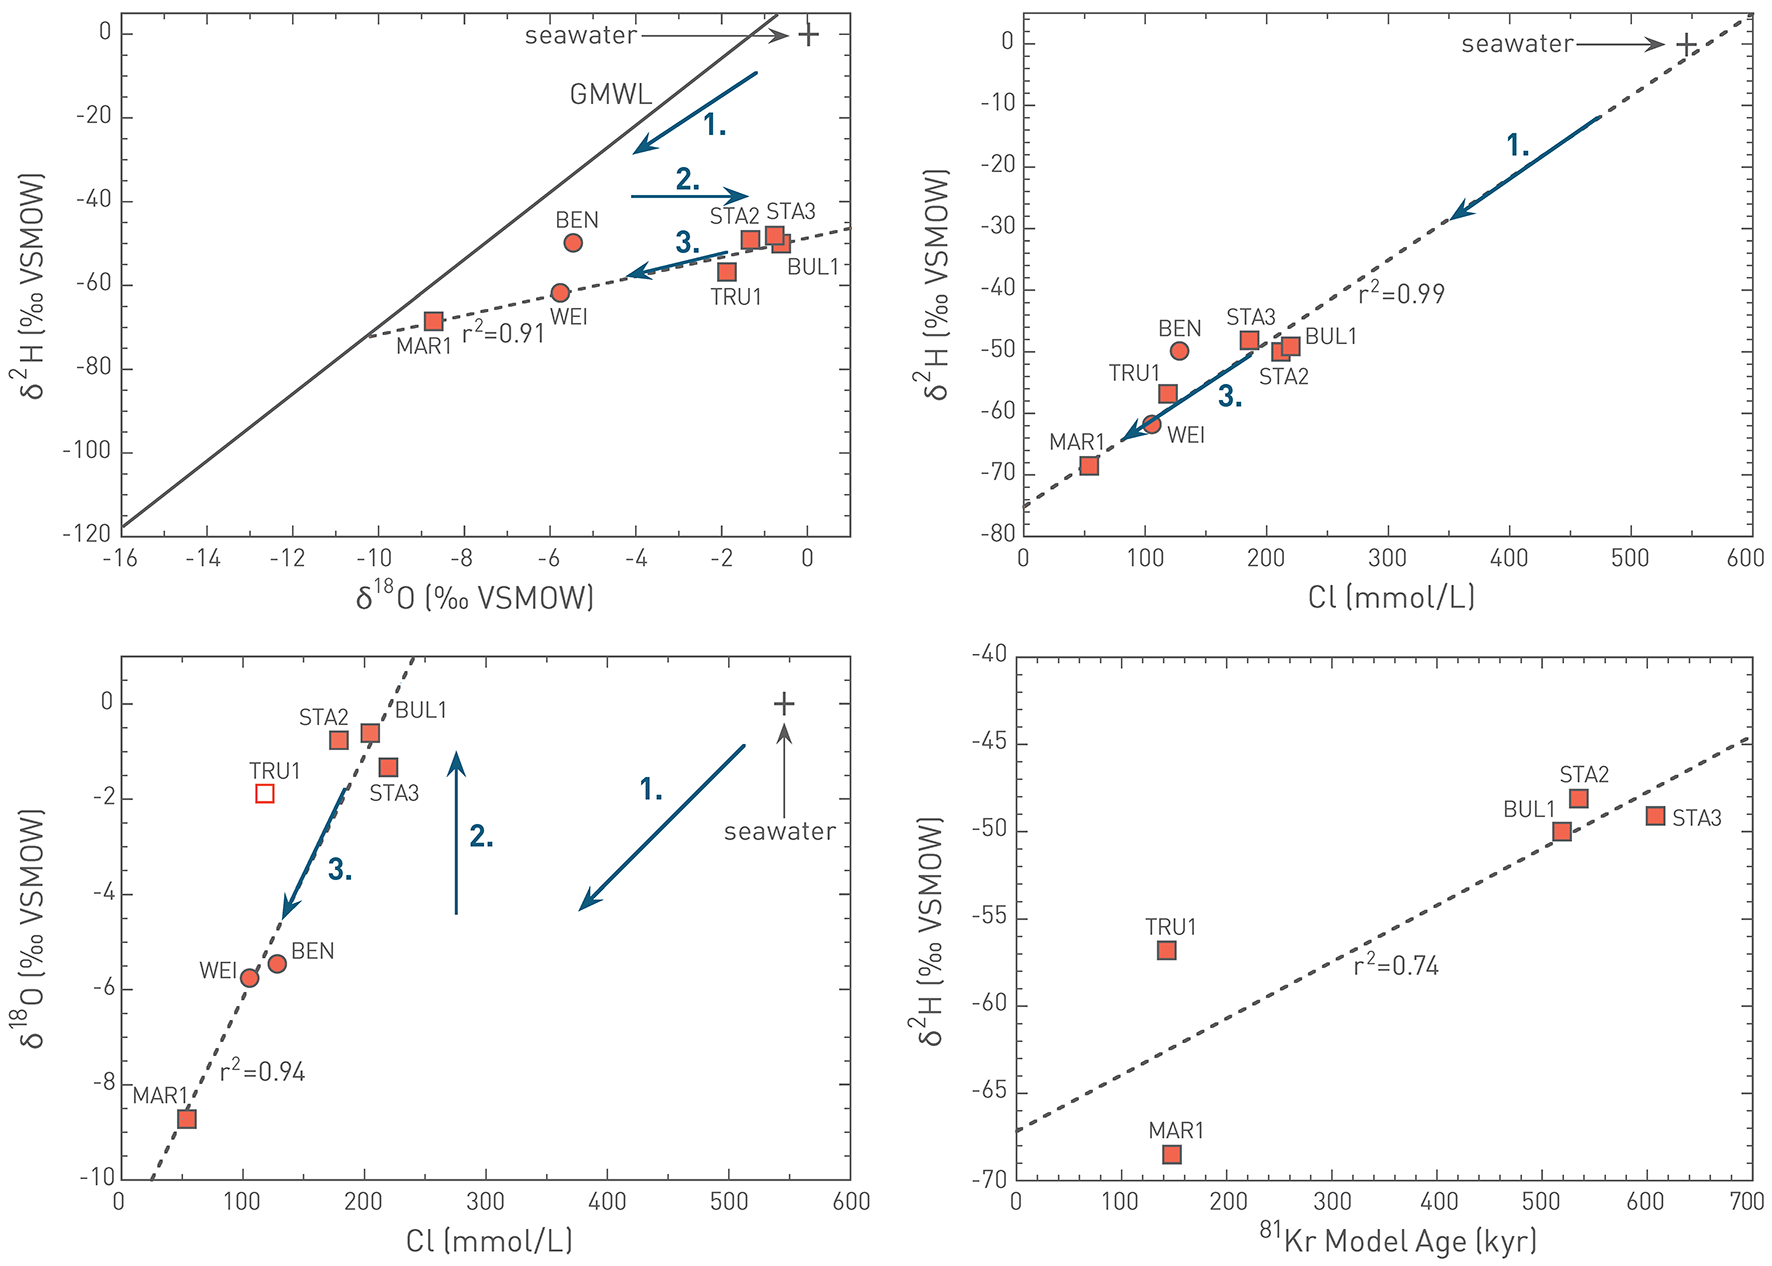
Fig. 4‑106:Correlations between values of stable isotopes of water and Cl concentrations as well as 81Kr model ages of Na-Cl type Malm groundwaters collected in the ZNO and NL siting regions
Circle and square symbols represent samples reported in Waber & Traber (2022) and collected during the TBO campaign, respectively. The linear correlations, plotted as dashed lines, were derived exclusively using the samples collected during the TBO campaign. The sample from TRU1 was not considered for calculating the linear correlation between δ18O and Cl because it probably experienced a slightly more complex hydrogeochemical evolution. The figure illustrates the evolution of the Na-Cl type groundwaters collected in the ZNO and NL siting regions. Numbers 1. – 3. refer to the steps in the hydrogeochemical evolution of these samples as described in the text.
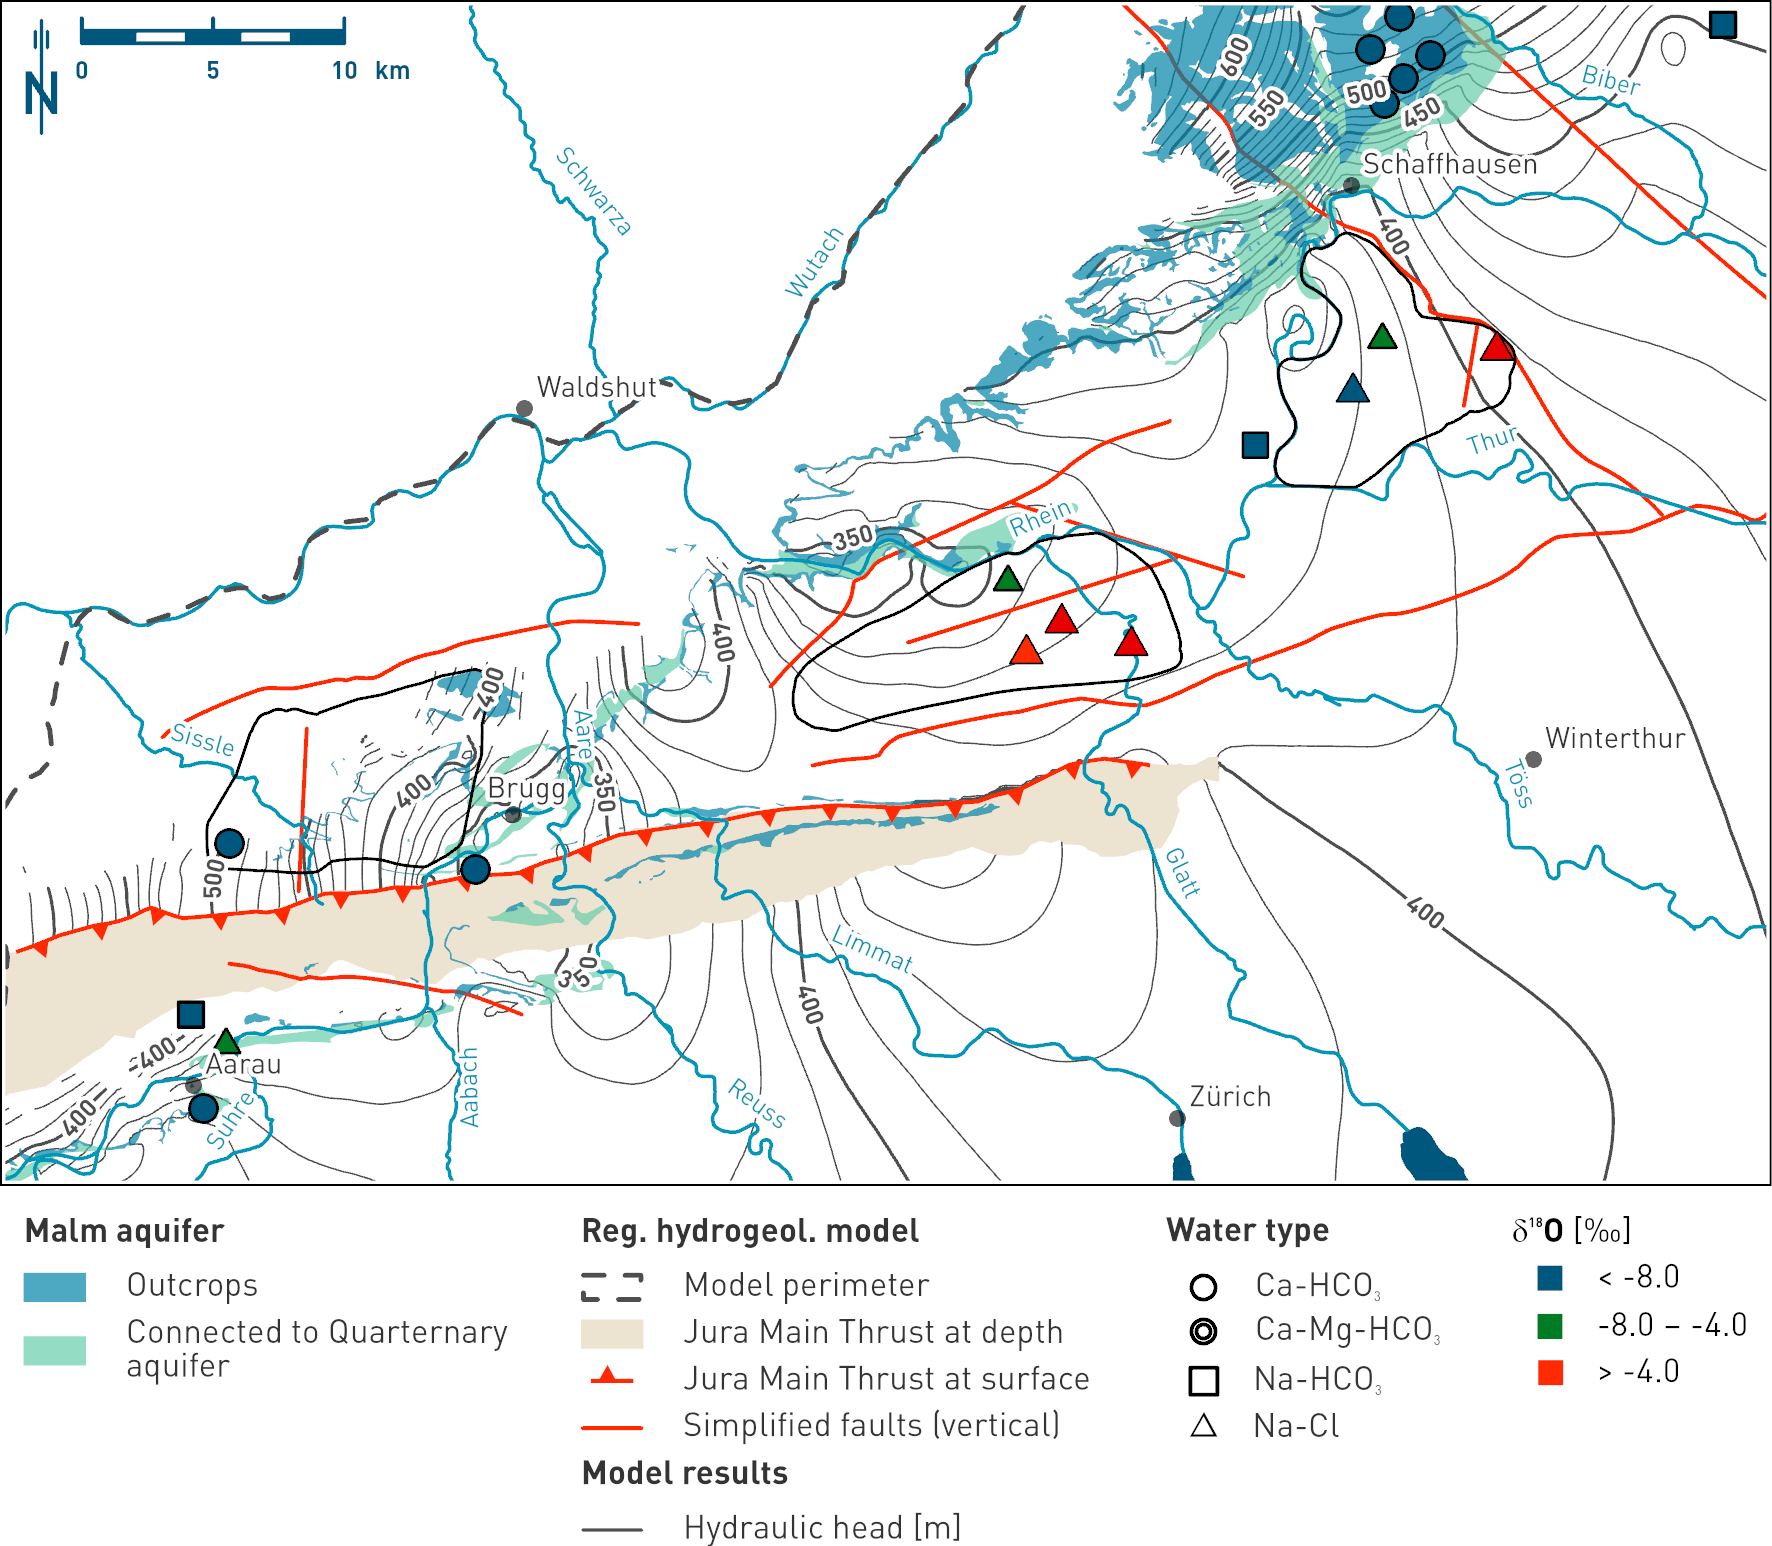
Fig. 4‑107:Map showing the spatial distribution of the δ18O values of the Malm groundwaters as an indication for dilution of the modified seawater component with meteoric water
The symbols represent the water types while the colour of the fillings indicates the δ18O value range of the samples. Groundwater samples with a large proportion of the modified seawater component are marked in red. For Na-Cl type samples, green and blue denote samples increasingly diluted with a meteoric component. Note the different classes compared to Fig. 4‑105. The map also shows the Malm outcrops, a simplified regional fault pattern, and the hydraulic head isolines according to the regional hydrogeological model (Section 4.5.4.2).
Summary for the Malm aquifer in the siting regions
In conclusion, the Malm groundwaters in the ZNO and NL siting regions represent mixtures between i) diluted and isotopically modified seawater residing at least several million years in the aquifer and ii) meteoric water that infiltrated at least 115 kyr ago probably through the Malm outcrops along the Rhine River. Based on the very high groundwater residence times observed in the siting regions, flow rates are very low, and groundwater behaves almost like a stagnant water body. This is in agreement with the small geochemical gradients between pore- and groundwater observed notably in the NL siting region (Section 4.6). In other regions where the hydraulic conductivity of the Malm aquifer is much higher because of, for example, karstification, hydrochemically less evolved groundwaters (Ca-Mg-HCO3) are observed at the same depth as the Na‑Cl water samples in ZNO and NL (Fig. 4‑107). This comparison emphasises the strong control of the hydraulic conductivity on groundwater residence time and composition.
A) Hydrogeochemical characterisation and groundwater origin
As a result of the facies change from the Hauptrogenstein in the west to the clay-mineral-rich Klingnau Formation in the east (Sections 4.2.7 and 4.5.3.6), the Hauptrogenstein aquifer is only relevant for the JO siting region and groundwater samples have only been obtained west of the Aare River (Fig. 4‑108). Their composition is variable, with TDS concentrations ranging from about 1 to about 11 g/L (Fig. 4‑109). Shallow groundwaters in the top 300 m are of the Ca-HCO3, Ca-Mg-HCO3 or Na-HCO3 type and show TDS concentrations below 1 g/L. In the investigated region, there are only two samples collected below 300 m. Both of them show much higher TDS concentrations of 5 and 11 g/L, respectively, and they are characterised as Na-SO4 or Na-Cl type groundwaters.
In the Br – Cl plot, the deep and saline Na-Cl and Na-SO4 type groundwaters plot on or close to the seawater dilution line (Fig. 4‑109). These groundwaters represent diluted seawater, which means that Na and Cl are of marine origin with an additional SO4 source for the Na-SO4 type groundwater collected at BOZ2 (see below). In the stable water isotope plot, Na-Cl and Na-SO4 type groundwaters are shifted slightly to the right of the GMWL (Fig. 4‑109), which is consistent with a non-meteoric origin. In contrast, the low-salinity groundwaters (i.e. Ca-HCO3, Ca-Mg-HCO3 or Na-HCO3 type waters) plot on the GMWL with values ranging between -11 and -9 ‰ typical for the infiltration of meteoric water under similar climatic conditions to today.
In the Na – Cl plot almost all groundwaters deviate from the seawater dilution line (Fig. 4‑109), indicating that Ca-exchange reactions with Na-rich clay minerals are relevant for almost all Hauptrogenstein groundwaters.
Information on the groundwater residence time is only available for the deep Na-SO4 type groundwater from BOZ2. While the sample is 14C-free, the derived 81Kr model age is 273 kyr. Such elevated residence times are consistent with the elevated 4He concentration of 2.33 × 10‑4 ccSTP/g.
B) Regional groundwater evolution
Similarly to the Malm aquifer, the different hydrogeochemical signatures of shallow and deep groundwaters reflect different stages in their hydrogeochemical evolution. While the shallow groundwaters of the Ca-HCO3, Ca-Mg-HCO3 or Na-HCO3 type are mainly controlled by the dissolution of carbonates and ion exchange reactions, the composition of deep Na-Cl and Na-SO4 type groundwaters is additionally affected by an ancient seawater component as well as a SO4 source and hence reflect more evolved groundwaters (Fig. 4‑109). With the limited dataset available for the Hauptrogenstein aquifer it is not possible to conclusively identify the origin of these additional components.
Based on their elevated residence time and the similar stable isotope shift to that observed for Na‑Cl type groundwaters from the Malm aquifer (Fig. 4‑109), the Na-Cl and Na-SO4 type groundwaters may have experienced a similar hydrogeochemical evolution. Thus, deep Hauptrogenstein groundwaters from the JO siting region may contain a diluted and isotopically modified seawater component such as discussed above for the Malm aquifer. Alternatively, high concentrations of Na, Cl and SO4 could be the result of a long-lasting exchange with porewater of the underlying aquitards. These porewaters are of marine origin and show higher concentrations of Na, Cl and SO4 than the Hauptrogenstein groundwaters (Fig. 4‑108, Fig. 4‑109, Section 4.6; Nagra (ed.) 2022b, Dossier VIII, Wersin et al. 2023) causing a diffusive flux towards the Hauptrogenstein aquifer. Since cation exchange reactions occur in clay-mineral-rich aquitards, the shift of almost all groundwaters from the seawater dilution line in the Na – Cl plot may be a manifestation of the importance of such a porewater contribution.
In either case, based on the long groundwater residence times inferred from the high 81Kr model ages (273 kyr) as well as the simulated tracer profiles for BOZ2 (Section 4.6), the Hauptrogenstein aquifer in the JO siting region is probably characterised by slow flow rates and a limited contribution of meteoric water that has infiltrated through the outcrops of the Hauptrogenstein in the Jura Mountains. Based on their signatures of the stable isotopes of water and the high 81Kr model age, recharge occurred under climatic conditions similar to today and hence in a previous interglacial period (i.e. at least 115 kyr ago).
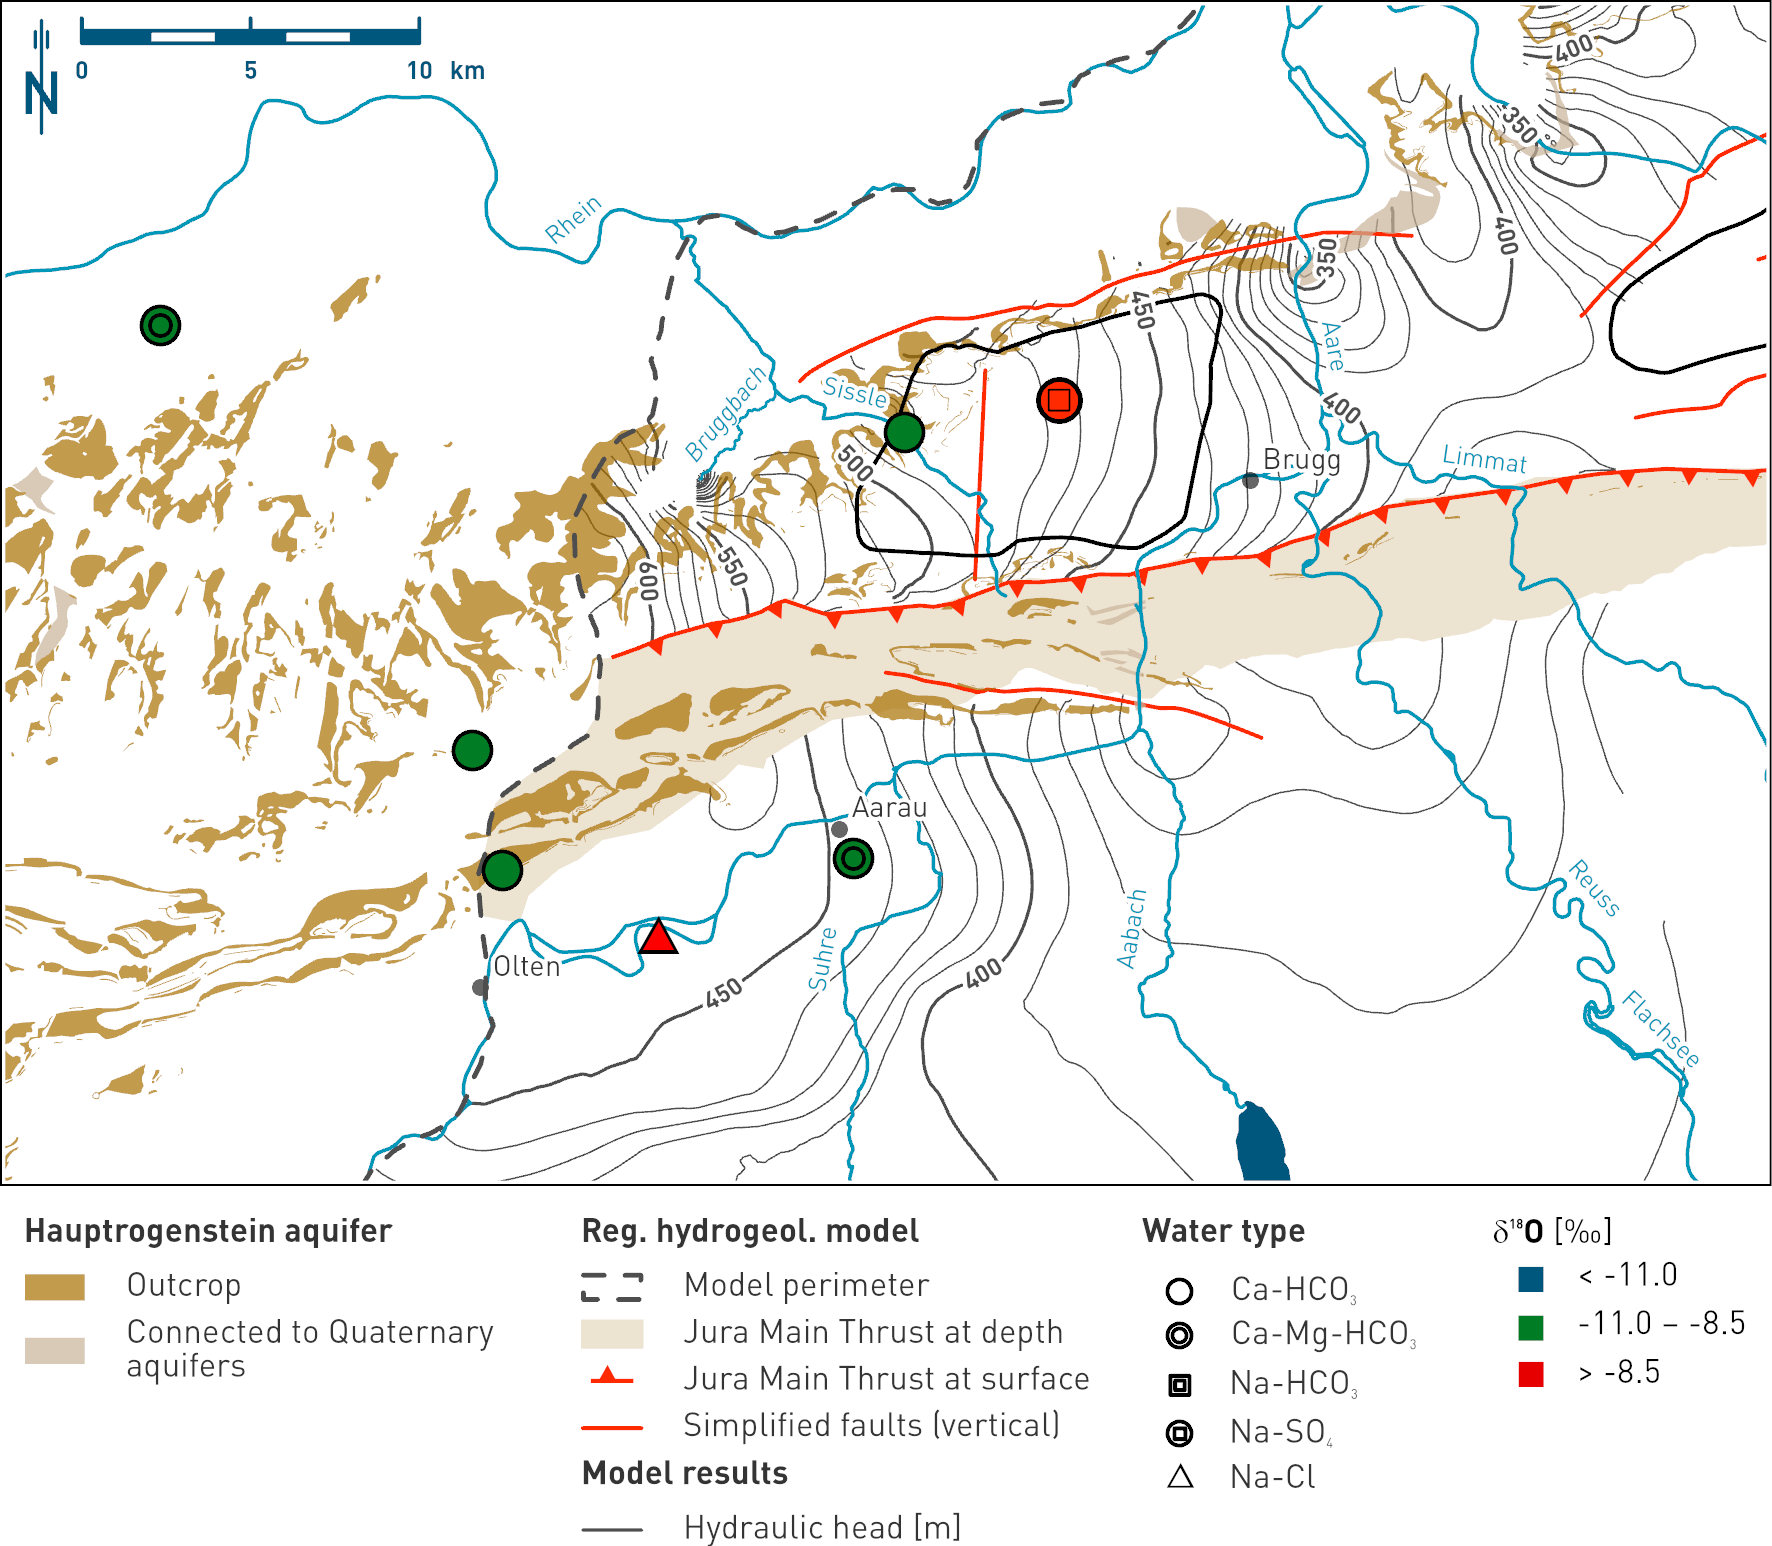
Fig. 4‑108:Map showing the spatial distribution of δ18O values in groundwaters collected from the Hauptrogenstein aquifer and the overlying Birmenstorf Member in Northern Switzerland
The symbols represent the water types while the colour of the fillings indicate the δ18O value range of the samples (see legend). The data range of δ18O of -11.0 to -8.5 ‰ VSMOW is representative for recent groundwaters of the region. Green colour denotes groundwater formed during climatic conditions similar as today in the study area. The map also shows the Hauptrogenstein outcrops, a simplified regional fault pattern, and the hydraulic head isolines according to the regional hydrogeological model (Section 4.5.4.3).
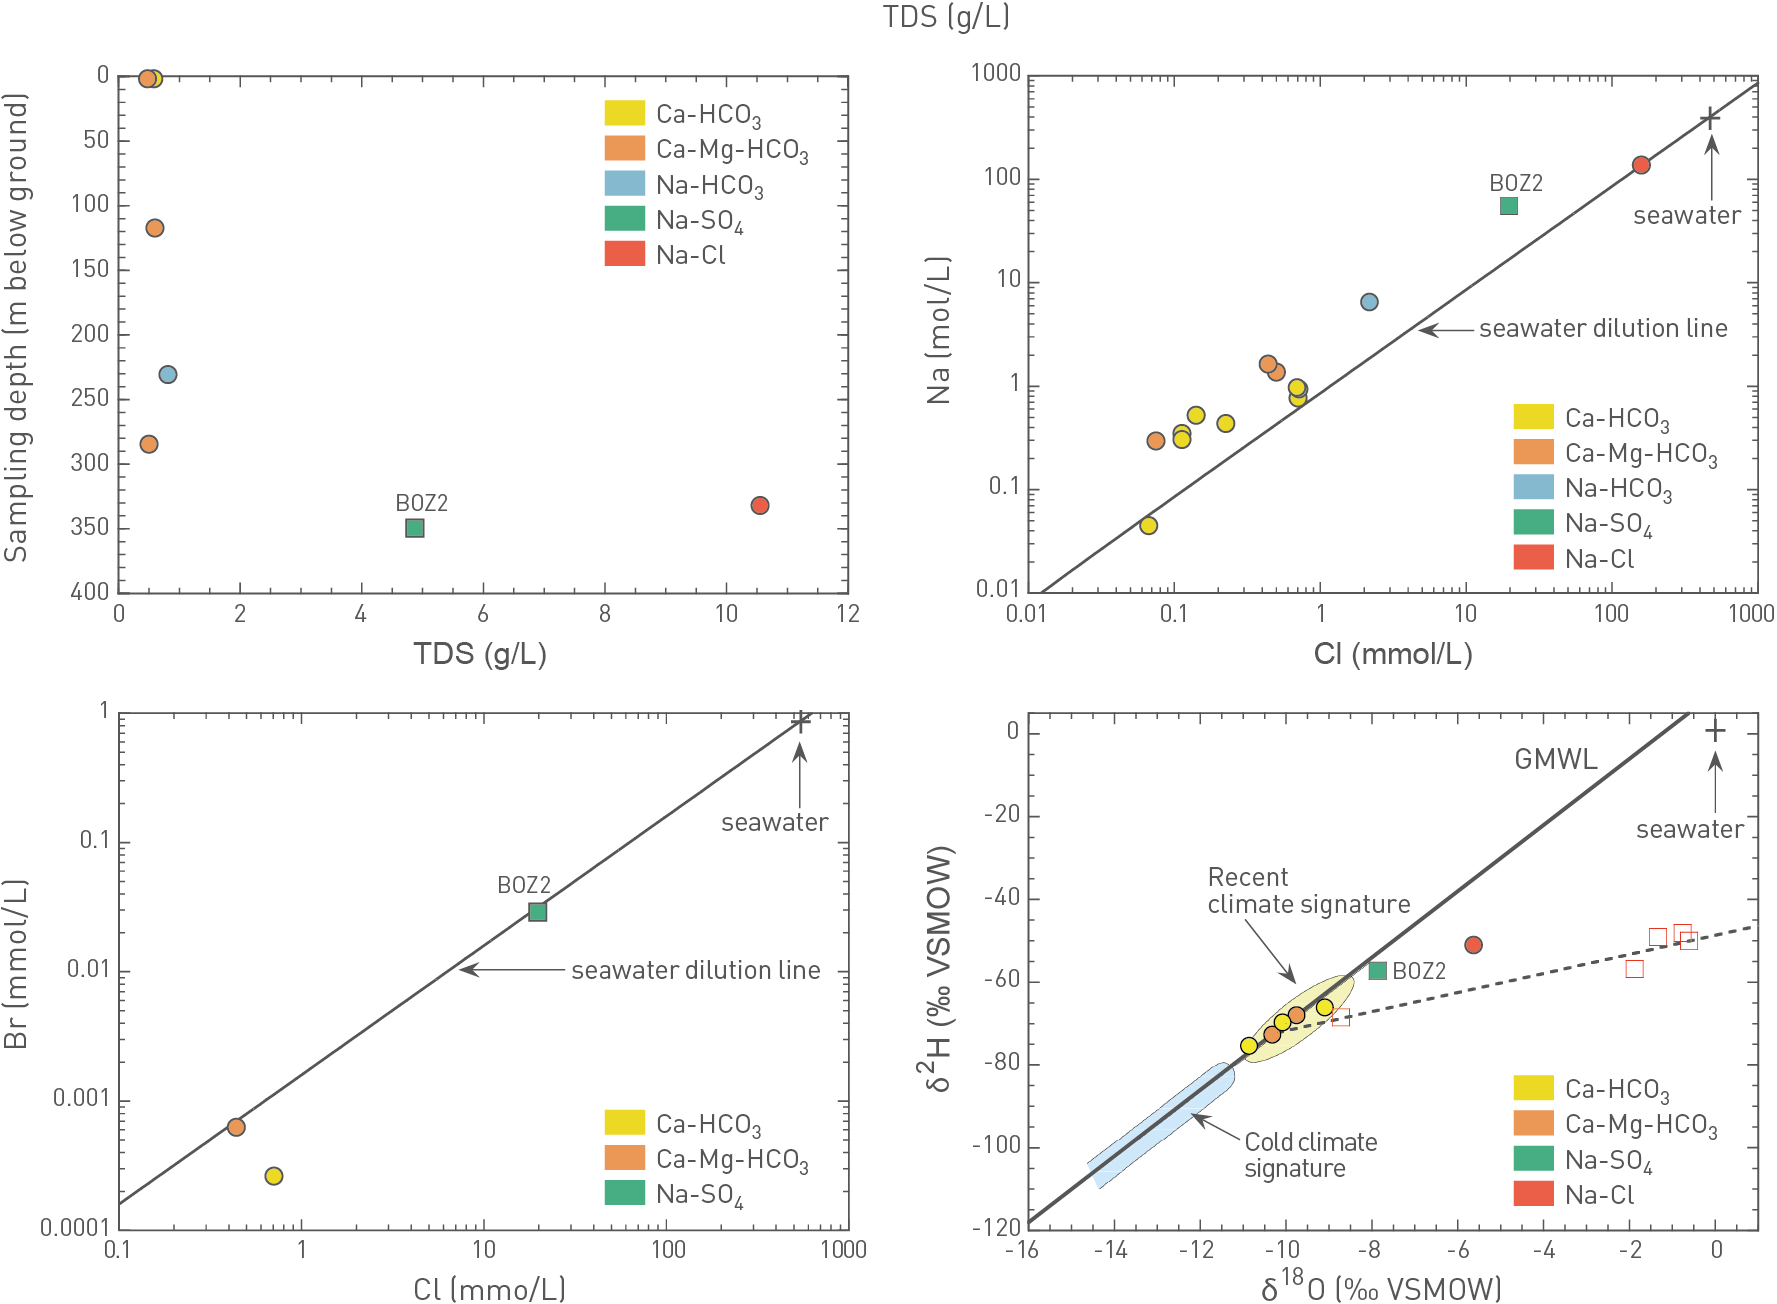
Fig. 4‑109:Cross-plots illustrating the behaviour of key hydrogeochemical parameters in groundwaters collected from the Hauptrogenstein aquifer in Northern Switzerland
Circle and square symbols represent samples reported in Waber & Traber (2022) and collected during the TBO campaign, respectively. Sampling locations are provided for the samples collected in the three siting regions. For stable isotopes (δ18O, δ2H), Na-Cl type groundwaters collected from the Malm aquifer in the ZNO and NL siting regions, and the corresponding linear correlation are plotted as well (open symbols) to illustrate that deep Na-Cl and Na-SO4 type groundwaters from the Hauptrogenstein aquifer may follow a similar trend. Samples from the overlying Birmenstorf Member are plotted as well.
A) Hydrogeochemical characterisation and groundwater origin
Groundwater samples from the Keuper aquifer in Northern Switzerland display a marked variation in their composition, with TDS concentrations ranging from about 2 to more than 20 g/L (Fig. 4‑110). Shallow groundwaters mainly occurring west of the Aare River in the Jura Mountains (Fig. 4‑111) are of the Ca-SO4 type and show TDS values below 3 g/L. Groundwaters from depths below 100 m mostly refer to the Na-SO4 type and display TDS concentrations up to 16 g/L. The only exception is the Keuper groundwater retrieved from the BAC1 borehole, which refers to the Na-Cl type with a TDS concentration of 21 g/L.
The Ca-SO4 type groundwaters as well as the Na-Cl groundwater from BAC1 plot close to or on the 1:1 correlation between the concentrations of Ca2+ and SO42- (Fig. 4‑110). This demonstrates that Ca and SO4 in these groundwaters are mainly inherited from the dissolution of gypsum or anhydrite. In addition, these waters may show significant Mg concentrations indicating a dedolomitisation reaction where gypsum/anhydrite and dolomite dissolve and calcite precipitates. Consequently, depending on the residence time the groundwaters are at or close to saturation with calcite, dolomite and gypsum or anhydrite.
In contrast, the Na-SO4 type groundwaters strongly deviate from the 1:1 correlation between Ca2+ and SO42-. These groundwaters are controlled by processes in addition to the dissolution of anhydrite. The most likely candidate is the diffusive exchange with porewater of the above-lying aquitards coupled with cation exchange reactions in these clay-mineral-rich units. The porewaters show higher concentrations of Na and Cl than the Keuper groundwaters, causing a diffusive flux towards the aquifer (Wersin et al. 2023).
The ratios of stable isotopes of water of shallow Ca-SO4 type groundwaters fall within the range of meteoric water infiltrating under similar climatic conditions to today. Together with significant 3H activities of selected samples and the occurrence of Keuper outcrops in the Jura Mountains (Fig. 4‑111), this indicates short residence times of a few years to a few decades. In contrast, about half of the deeper Na-SO4 groundwaters as well as the Na-Cl type groundwater from BAC1 display signatures of stable isotopes inconsistent with recharge under current climatic conditions. The sample from RIN plots on the GMWL at higher δ18O and δ2H values than currently observed, indicating that recharge occurred during warmer climatic conditions. The samples from STA2 and BAC1 plot slightly below the GMWL (Fig. 4‑110), which is probably caused by the diffusive exchange with porewater in the above-lying aquitards as described above. Based on the Br/Cl ratio, this porewater is likely of marine origin (Section 4.6.3).
With the exception of the Keuper sample from BOZ2, Na-SO4 and Na-Cl type groundwaters show 81Kr model ages ranging from 400 to 929 kyr. Inferred residence times in the order of several 100 kyr for these groundwaters compare well with their elevated 4He concentrations and 3He/4He ratios (Fig. 4‑110). Interestingly, the sample from BOZ2 shows a much lower 81Kr model age of < 22 kyr, which is consistent with the 14C model age of 10 – 14 kyr.
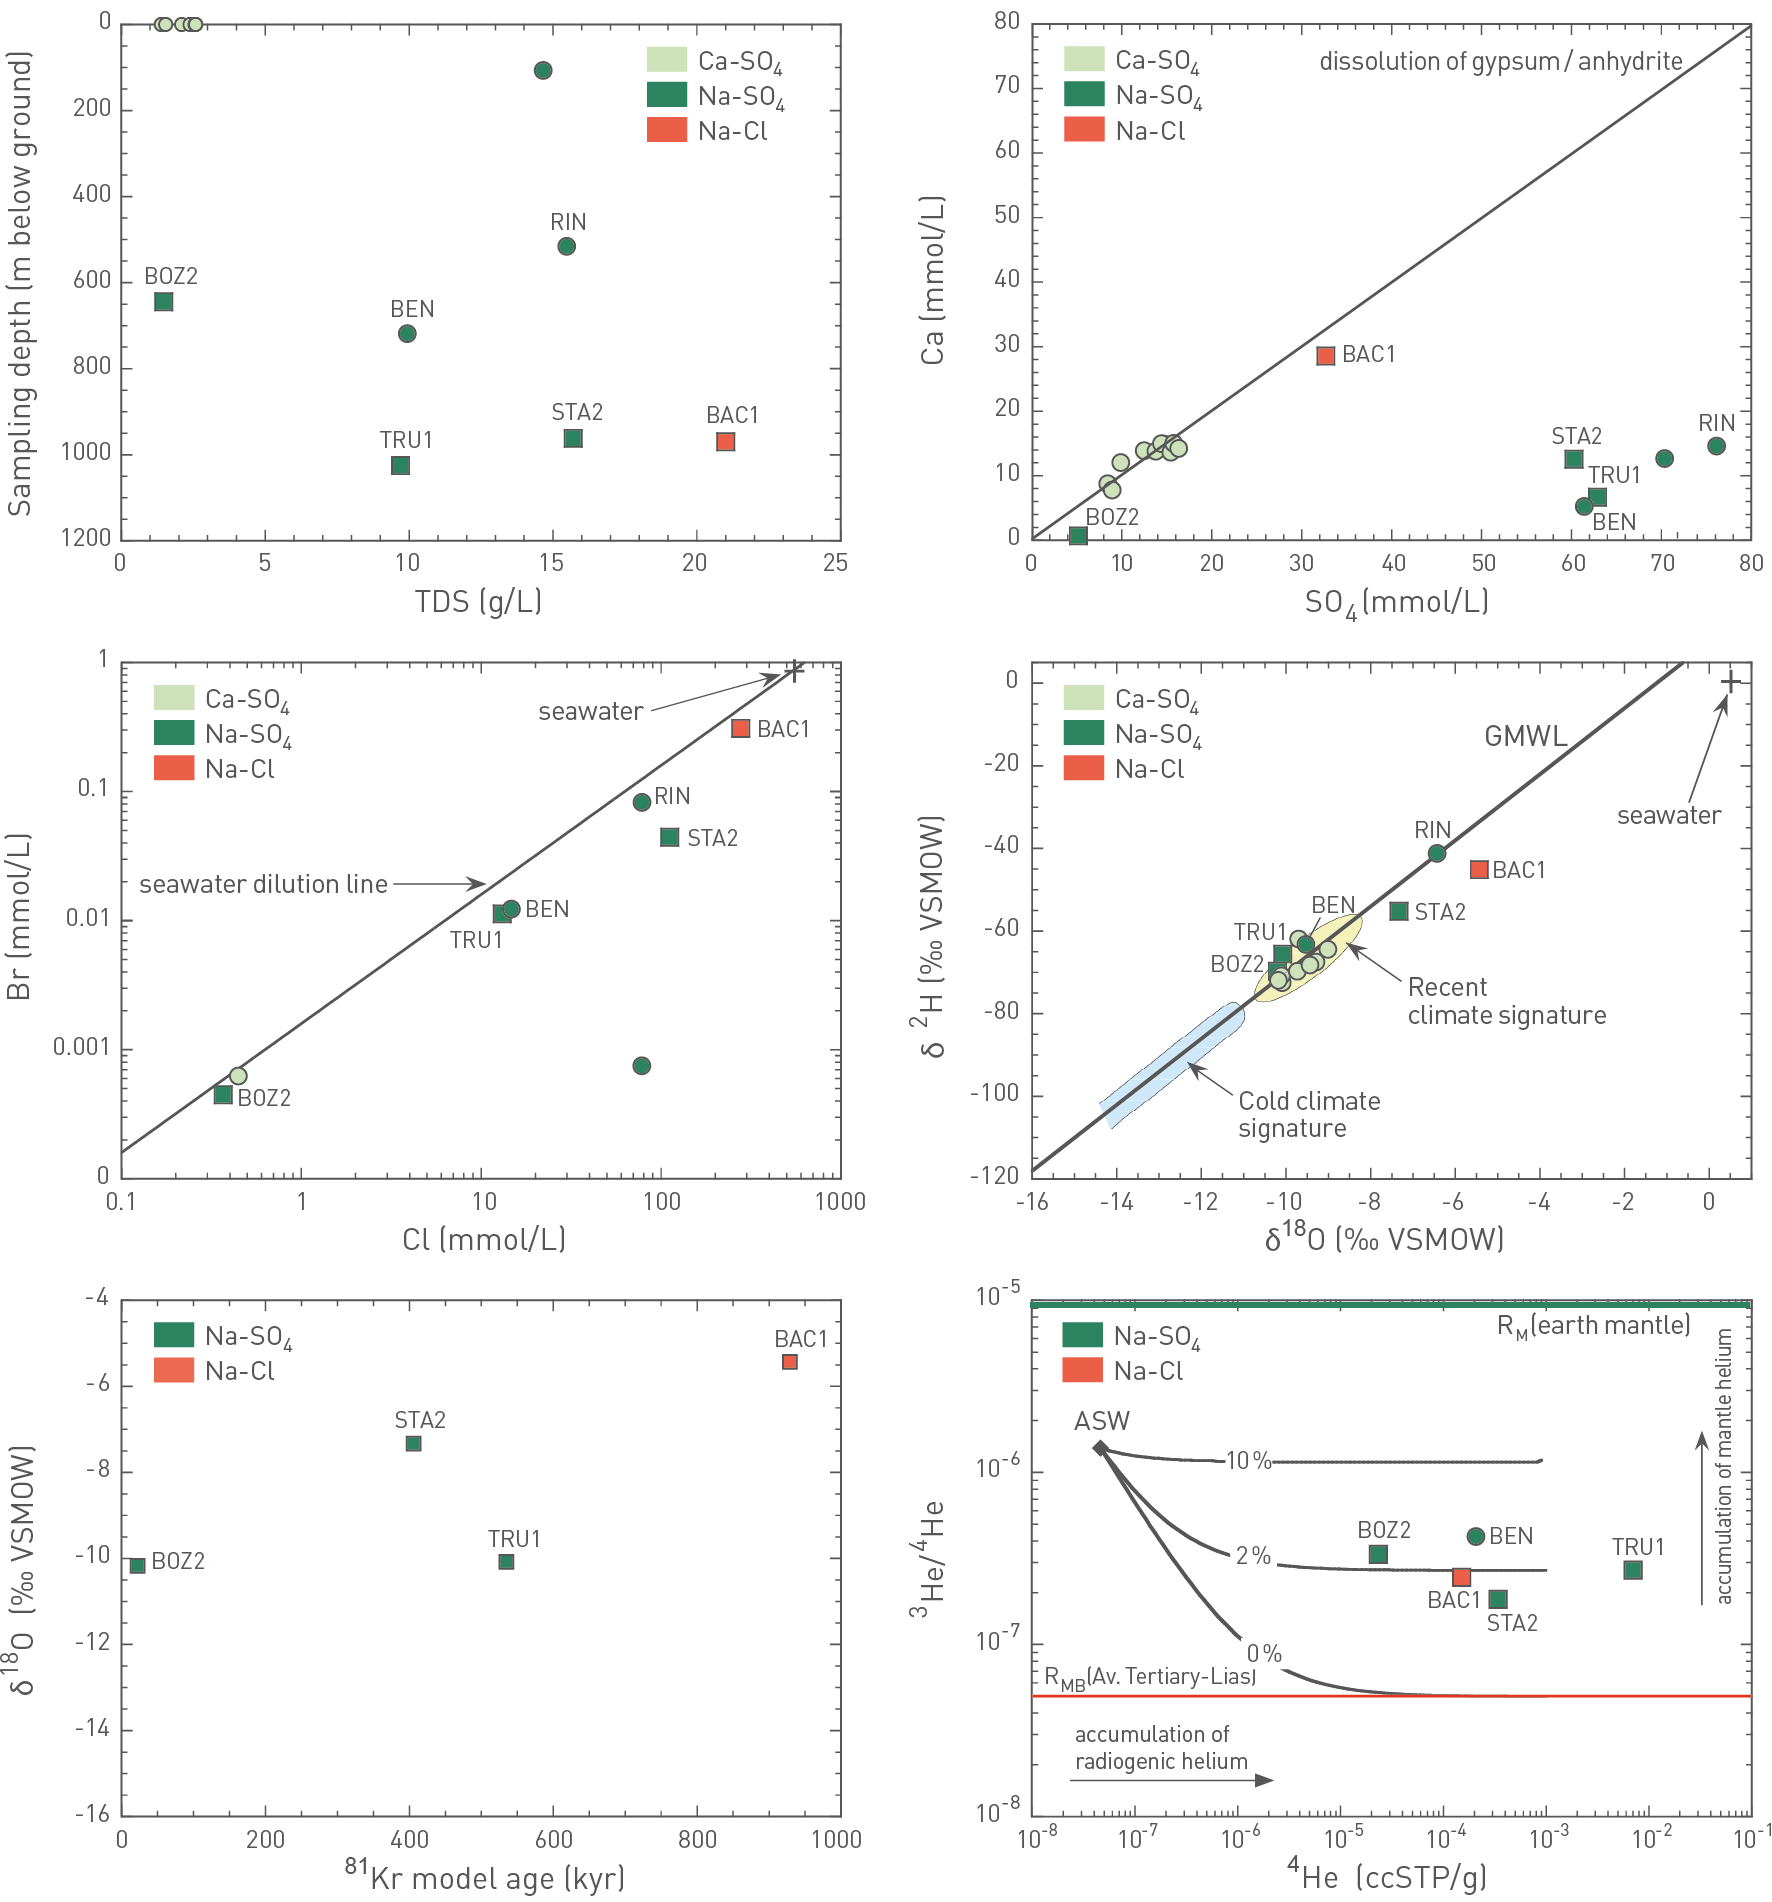
Fig. 4‑110:Cross-plots illustrating the behaviour of key hydrogeochemical parameters in groundwaters collected from the Keuper aquifer in Northern Switzerland
Circle and square symbols represent samples reported in Waber & Traber (2022) and collected during the TBO campaign, respectively. Sampling locations are only provided for the samples collected in the three siting regions. Samples from hydrocarbon exploration wells in the central Molasse Basin have limited datasets and are not shown. RMB: average 3He/4He production ratio of Molasse to Lias Group sediments in the Swiss Molasse Basin. ASW: air-saturated water (Kipfer et al. 2002). Black lines in the He-plot indicate the behaviour of hypothetical mixtures between ASW and RMB as well as different proportions of mantle helium (RM). The Br/Cl ratio of the groundwater from TRU1 is affected by a high uncertainty of the Br analysis.
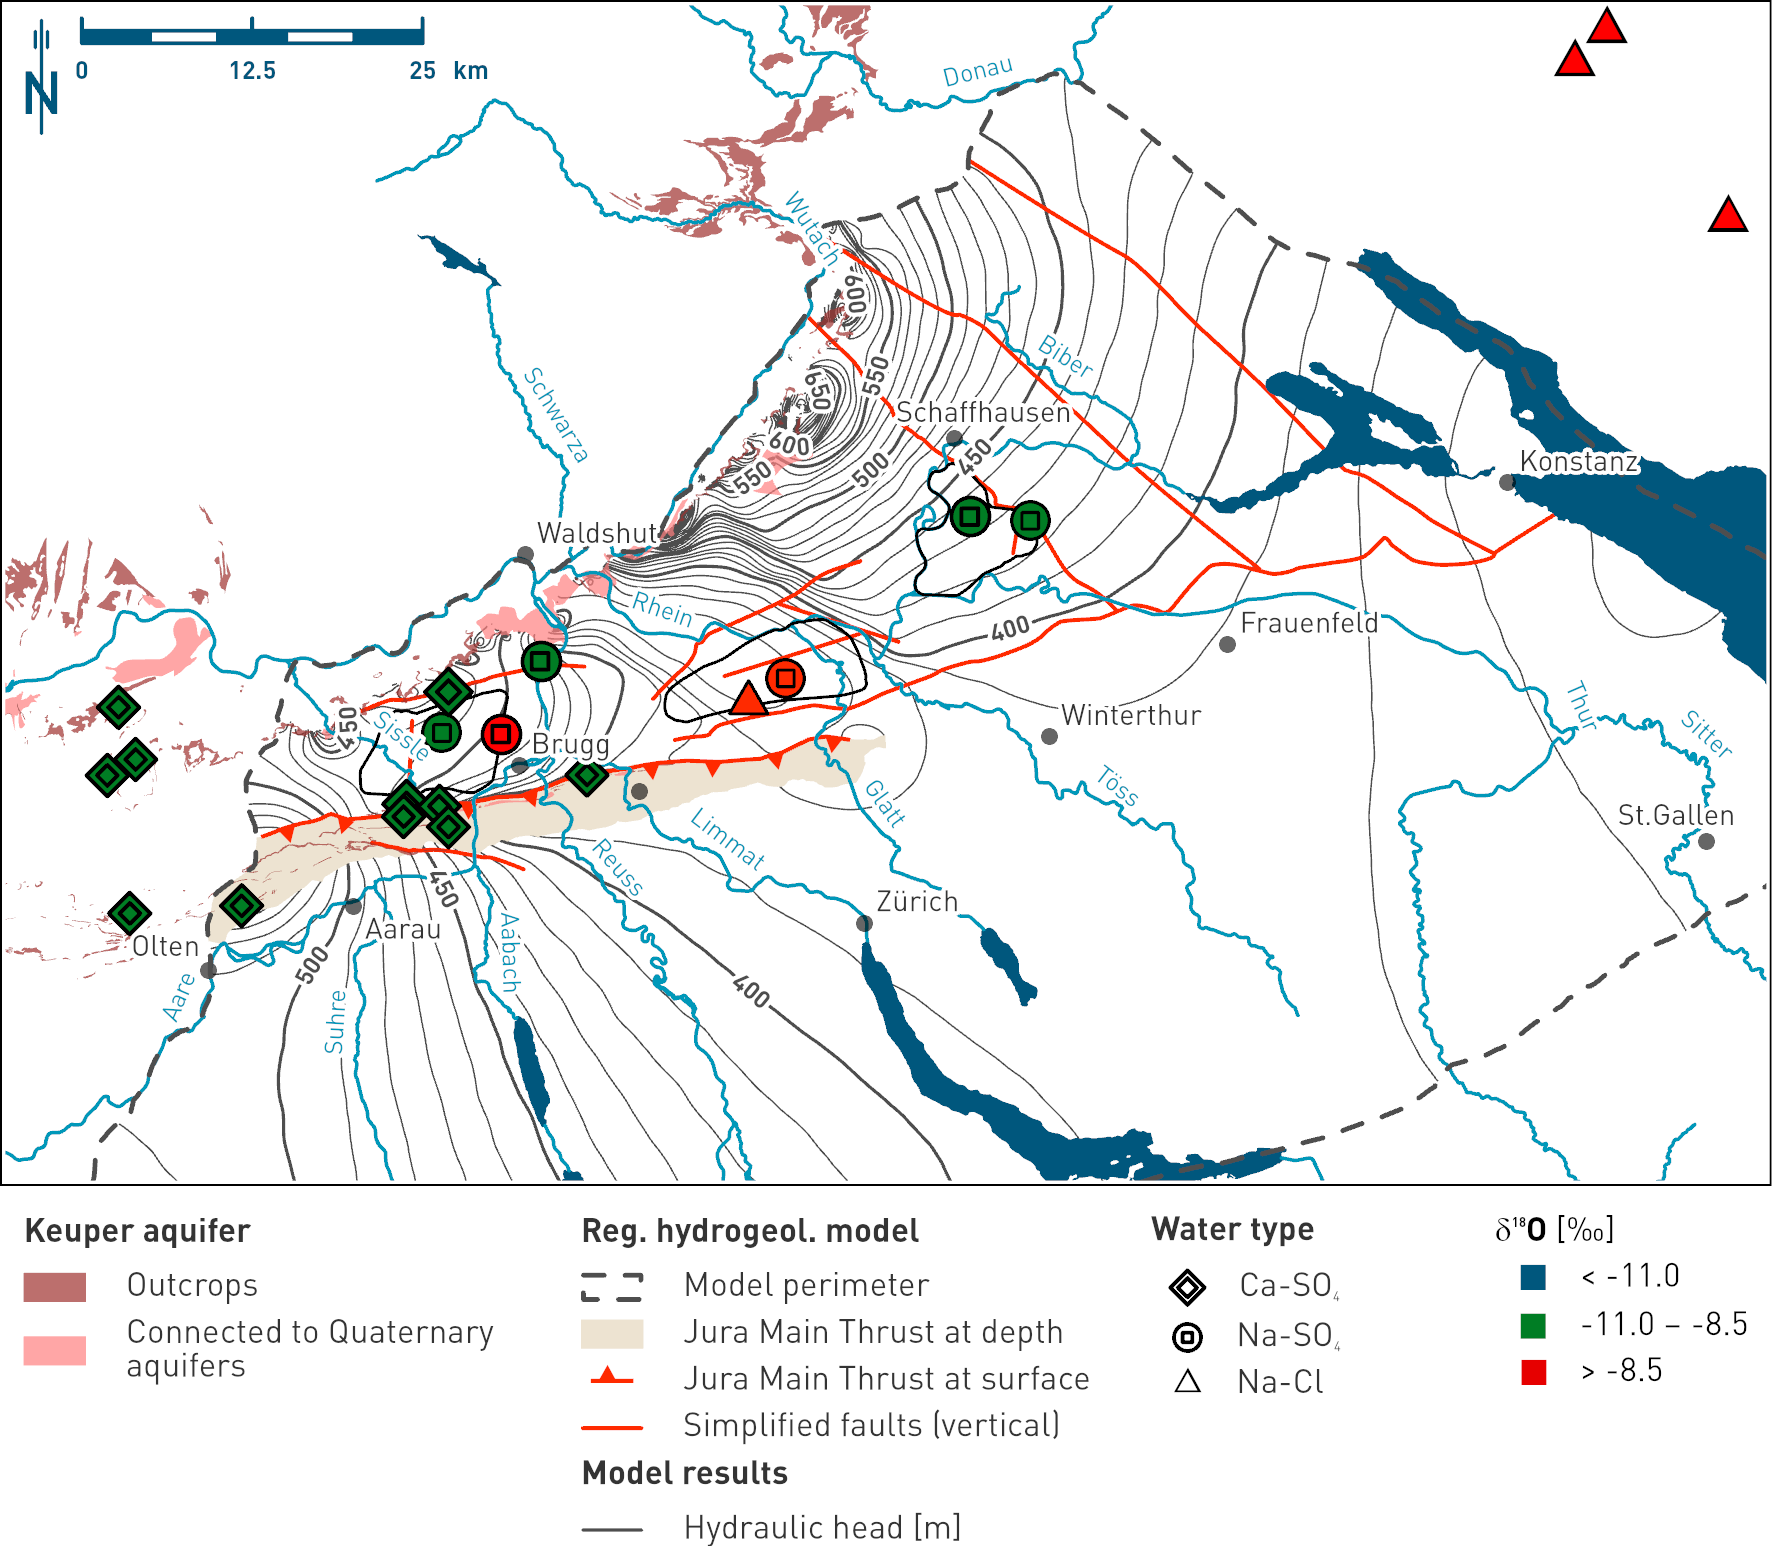
Fig. 4‑111:Map showing the spatial distribution of δ18O values in groundwaters collected from the Keuper aquifer as indication of the recharge conditions of the different water types
The symbols represent the water types while the colour of the fillings indicates the δ18O value range of the samples (see legend). The data range of δ18O of -11.0 to -8.5 ‰ VSMOW is representative for recent groundwaters of the region. Green colour denotes groundwater formed during climatic conditions similar as today in the study area. The map also shows the Keuper aquifer outcrops, a simplified regional fault pattern, and the hydraulic head isolines according to the regional hydrogeological model (base case model, Section 4.5.4.4).
B) Regional groundwater evolution
The different hydrogeochemical signatures of the Keuper groundwaters in Northern Switzerland reflect different stages in their hydrogeochemical evolution. This is discussed below for four major groups of water types representing shallow groundwater close to outcrops as well as deep groundwater in the three siting regions.
Ca-SO4 type groundwaters: Shallow groundwater close to outcrops
These groundwaters are controlled by the dissolution of gypsum and/or anhydrite present in the Bänkerjoch Formation (Section 4.5.3.11) or in the Klettgau Formation. Accordingly, the Ca-SO4 type groundwaters represent the first stage of the hydrogeochemical evolution when meteoric water infiltrates into the Keuper aquifer. This is consistent with short residence times inferred from the detection of 3H and stable isotope signatures overlapping with recharge signatures observed today.
Na-SO4 type groundwaters without stable isotope shift: Deep groundwater in the ZNO siting region
In the ZNO siting region, groundwater samples from the Keuper aquifer were retrieved from the TRU1 and BEN boreholes. Both samples are of Na-SO4 type and show a stable isotope signature consistent with recharge under similar climatic conditions to today (Fig. 4‑110). Moreover, the chemical composition of the two samples is very similar. In addition to the dissolution of anhydrite, these groundwaters are controlled by the diffusive uptake of Na and Cl from the porewater of the above-lying aquitards. The strong hydrogeochemical similarity of the two samples suggests that, in the ZNO siting region, the Keuper operates as a well-connected aquifer. This is consistent with the observation that, in this region, the Seebi Member regionally occurs as dolomitic breccia with frequent macropores, probably causing the high transmissivities observed in the Klettgau Formation of the BEN and TRU1 boreholes (Sections 4.5.3 and 4.2). Additional evidence for a regionally well-connected Keuper aquifer is provided by the tracer profiles along the MAR1, TRU1 and BEN drill cores, all showing strong concentration gradients between the Keuper aquifer and porewater of the above-lying aquitards (Section 4.6), typical for a single hydraulic activation of the aquifer. Despite these observations, the flow velocities appear to be very slow based on the relatively high 81Kr model age of the TRU1 groundwater (535 kyr; Fig. 4‑110), which is consistent with the corresponding porewater tracer simulations suggesting an activation of the aquifer some 650 kyr ago (Section 4.6.2).
Na-SO4 and Na-Cl type groundwater with stable isotope shift: Deep groundwaters in the NL siting region
In the NL siting region, groundwater samples from the Keuper aquifer were retrieved from the boreholes STA2 and BAC1. While the sample from STA2 is of Na-SO4 type, the one from BAC1 relates to Na-Cl type. In contrast to the two samples from the ZNO siting region, their stable isotope composition is shifted to the right of the GMWL, suggesting diffusive uptake of 2H and 18O with a marine signature from the porewater of the above-lying aquitards, in addition to the uptake of Na and Cl. Accordingly, the Keuper groundwaters in the NL region represent a hydrogeochemically more evolved state than those from the ZNO siting region. This is probably caused by the fact that Keuper groundwater samples in NL were retrieved from individual sandstone channels of the Ergolz Member (Sections 4.5.3.10), which probably does not represent a well-connected regional aquifer. Consequently, the tracer profiles of the STA2 and particularly BAC1 boreholes show lower concentration gradients between the Keuper groundwater and porewater of the above-lying aquitards than the corresponding profiles in the ZNO siting region (Section 4.6). Despite the different hydrogeochemical signature, the 81Kr model ages of Keuper groundwaters from the ZNO and NL siting regions are in the same order of magnitude (406 – 929 kyr; Fig. 4‑110). This may result from a younger, 81Kr-bearing water component of similar mean residence time in both siting regions but different mixing proportions with an older, 81Kr-free and more saline component (higher contribution of the more saline component in NL than in ZNO).
Na-SO4 type groundwaters without stable isotope shift but strongly contrasting signature: Deep groundwater in the JO siting region
In the JO siting region, groundwater samples from the Keuper aquifer could be retrieved from the RIN and BOZ2 boreholes. Both samples are of the Na-SO4 type, display similar Ca/SO4 and Br/Cl ratios close to the anhydrite dissolution and seawater dilution trends, respectively, and their stable isotope signatures fall on the Global Meteoric Water Line GMWL (Fig. 4‑110). Besides these similarities, there are notable differences despite the two boreholes being located only about 5 km apart. The most prominent ones include a much higher TDS concentration of the RIN sample and a corresponding stable isotope signature, which is inconsistent with the infiltration of meteoric water under current climatic conditions. Based on the chemical similarity but much lower salinity (RIN: 15 g/L; BOZ2: 1.5 g/L), the groundwater from BOZ2 can be interpreted as a strongly diluted version of the RIN sample. Consequently, the Keuper aquifer at BOZ2 is probably much more active hydraulically than at RIN. This is consistent with 14C and 81Kr model ages of < 14 kyr and < 22 kyr, respectively, as well as the signature of stable isotopes, suggesting that the diluting water component infiltrated in the current Holocene interglacial period. The large presence of a young groundwater component at BOZ2 also agrees well with high tracer concentration gradients between the Keuper groundwater and porewater of the above-lying aquitards in the corresponding tracer profiles (Section 4.6) and may relate to groundwater from the outcrops to the north of BOZ2. It follows that there are almost stagnant conditions at RIN, while at BOZ2 the Keuper aquifer appears to be much more active hydraulically.
Summary of the Keuper aquifer in the siting regions
The Keuper aquifer represents spatially limited and partly isolated local aquifers with often quasi-stagnant conditions, as manifested by the fact that, in the three siting regions, Keuper groundwater could only be retrieved from about half of the deep boreholes. The isolated and local nature is linked to the local lithofacies (Section 4.5.3.10) of the potential transmissive layers.
In the JO siting region, the hydrogeochemical data evidence large differences in flow dynamics between BOZ2 and RIN. The characteristics of the RIN sample point to high residence times. The BOZ2 sample is more dilute and has a 81Kr model age < 22 kyr. Overall, these characteristics agree with the general NW-SE flow direction suggested by the hydrodynamic model (Fig. 4‑111).
In the NL siting region, groundwater could only be sampled in 2 out of 5 boreholes. Both samples are characterised by high 81Kr model ages (STA2 406 and BAC1 929 kyr) but distinct chemical differences. Their stable isotope composition is shifted to the right of the GMWL, suggesting diffusive uptake from the porewater of the above-lying aquitards. This exchange is particularly evolved in the case of BAC1. Overall, these are hydrogeochemically highly evolved groundwaters pointing to quasi-stagnant conditions.
In the ZNO siting region, the groundwater samples from BEN and TRU1 have similar hydrochemical composition and plot on the Global Meteoric Water Line in the range of recent groundwaters. The similarity is in agreement with a well-connected aquifer in this siting region. However, the 81Kr model age of the TRU1 groundwater (535 kyr) point to very low flow velocities.
A) Hydrogeochemical characterisation and groundwater origin
Groundwater samples from the Muschelkalk aquifer in Northern Switzerland and adjacent areas display very large variations in their composition, with TDS concentrations ranging from 0.5 to 156 g/L (Fig. 4‑112). Groundwaters with TDS concentrations above 8 g/L are of Na-Cl type. If the TDS concentration is between 2 and 8 g/L, groundwaters are mainly of Ca-SO4 type. Exceptions are the thermal waters of the Baden/Ennetbaden and Schinznach Bad groups and the groundwater from the Schlattingen-2 borehole (SLA2), which are of [Na/Ca]-[SO4/Cl] type. Groundwaters with TDS concentrations below 2 g/L are of Ca-HCO3 or Ca-[Mg]-[HCO3/SO4] type.
All groundwaters plot on or close to the 1:1 correlation between the concentrations of alkaline earth metal cations (Ca2+ + Mg2+) and SO42- (Fig. 4‑112). This indicates that Ca and SO4 are mainly inherited from the dissolution of gypsum in the recharge areas and anhydrite at greater depth in the aquifer (Section 4.5.3), resulting in a typical dedolomitisation scenario where gypsum/anhydrite and dolomite (CaMg(CO3)2) dissolve while calcite precipitates. Consequently, the Muschelkalk groundwaters are at, or are close to, saturation with respect to calcite, dolomite and gypsum/anhydrite.
Compared to seawater, the Na-Cl type groundwaters display an excess of Cl over Br and hence strongly deviate from the seawater dilution line (Fig. 4‑112). In addition, the groundwater collected in the BUL1 borehole displays a TDS concentration of 145 g/L, strongly exceeding that of seawater (Fig. 4‑112). These observations demonstrate that the Na-Cl signature is because of the dissolution of halite occurring in the Zeglingen Formation, ca. 100 m below the Muschelkalk aquifer (Section 4.2) and not from a seawater-like water component such as described above for the Malm aquifer. This is consistent with the observation that, in terms of stable water isotopes, all Muschelkalk groundwaters plot on or very close to the GMWL, confirming the meteoric origin of these groundwaters (Fig. 4‑112).
The different water types are also reflected in groundwater residence times inferred from 3H and 14C activities. The Ca-HCO3 and Ca-[Mg]-[HCO3/SO4] type groundwaters are 3H-bearing and show 14C activities generally above 15 pmC (Fig. 4‑112), suggesting that meteoric water recharge occurred in the recent past. This is consistent with the signature of stable isotopes in these groundwaters, which fall within the range of meteoric water for today’s climatic conditions (Fig. 4‑112). Most of the Ca-SO4, [Na/Ca]-[SO4/Cl] and Na-Cl type groundwaters show corrected 14C activities below 15 pmC. In the case of the groundwater sample from STA2, it is below detection. This is consistent with δ18O values below -11 ‰ of groundwaters collected in the ZNO and NL siting regions, indicating that meteoric water recharge occurred during a cold glacial period (Fig. 4‑113). It follows that, in these two siting regions, Muschelkalk groundwaters infiltrated during the last glacial cycle (i.e. 12 – 115 kyr ago; Schlüchter et al. 2021).
Helium analyses are available for the Ca-SO4, [Na/Ca]-[SO4/Cl] and Na-Cl type groundwaters. The Ca-SO4 type groundwaters show 4He concentrations ranging from 10-7 to 10-5 ccSTP/g (Fig. 4‑112). In groundwaters of the other two types ([Na/Ca]-[SO4/Cl] and Na-Cl), 4He concentrations are up to two orders of magnitude higher, with the highest concentration being measured at BOZ2. In terms of 3He/4He ratios, all groundwaters from the three siting regions show elevated values above those of the Mesozoic sedimentary rocks, indicating the presence of a few percent of mantle-derived He.
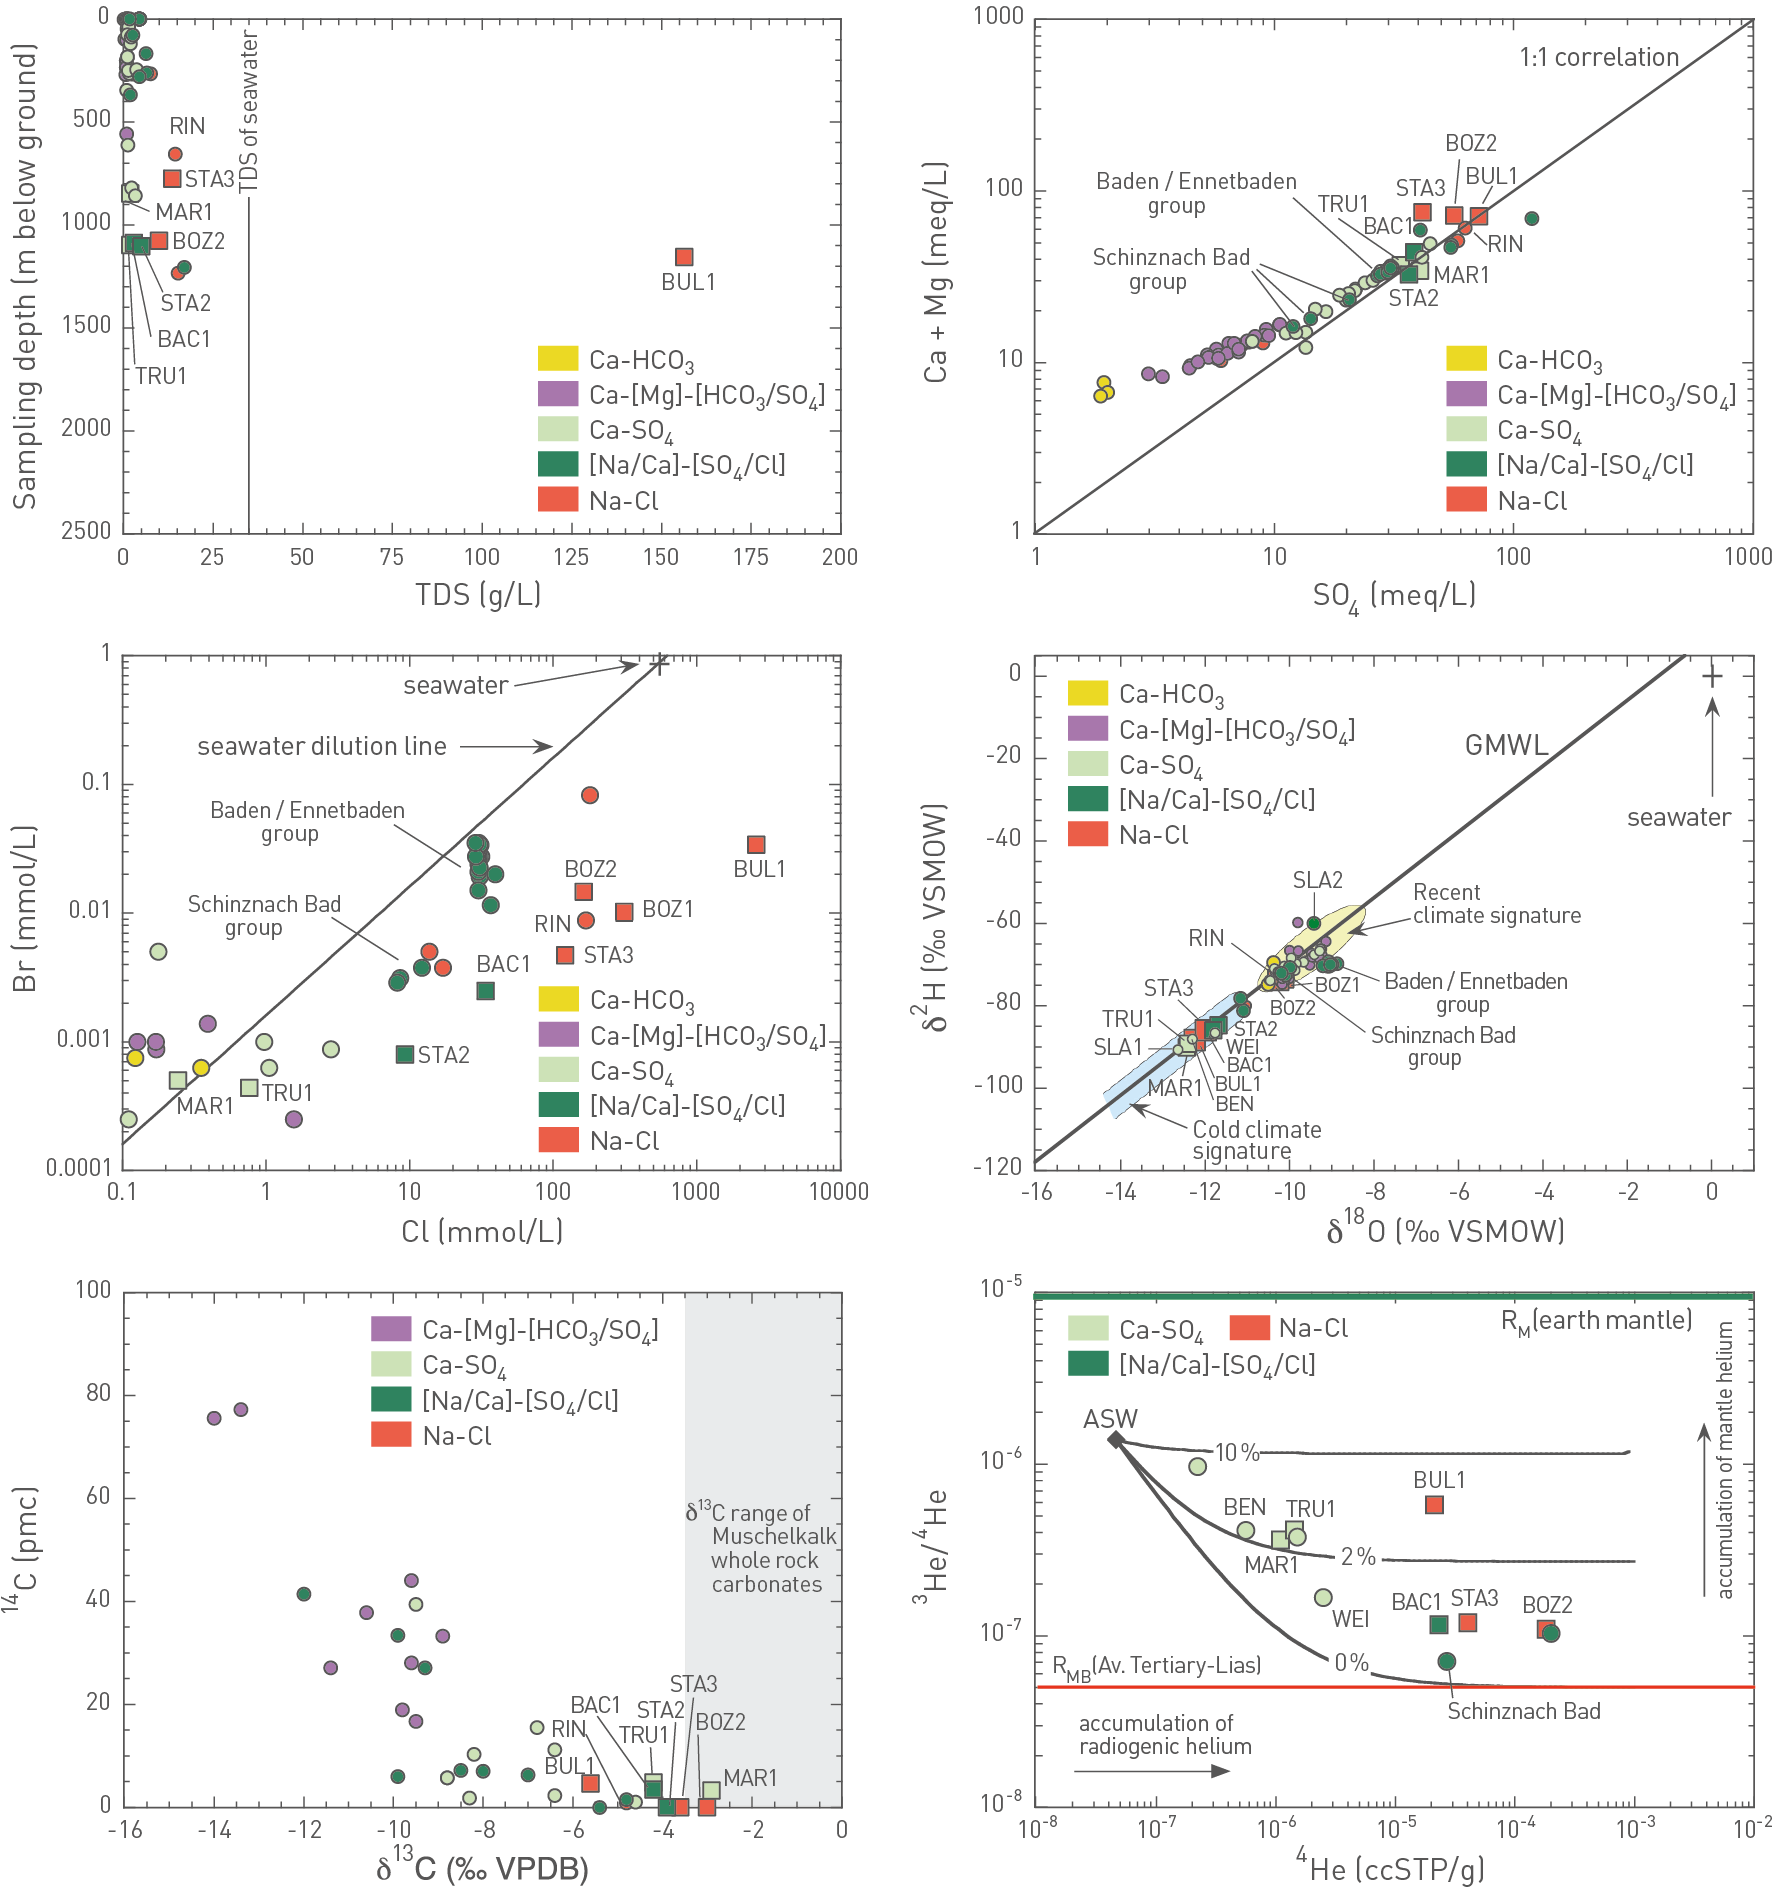
Fig. 4‑112:Cross-plots illustrating the behaviour of key hydrogeochemical parameters in groundwaters collected from the Muschelkalk aquifer in Northern Switzerland and Southern Germany
Filled circle and square symbols represent samples reported in Waber & Traber (2022) and collected during the TBO campaign, respectively. Sampling locations are only provided for the samples collected in the three siting regions as well as those from the Baden and Bad Schinznach geothermal areas to emphasise that these all relate to [Na/Ca]-[SO4/Cl] type groundwaters. Samples from hydrocarbon exploration wells in the central Molasse Basin have limited datasets and are not shown. 14C activities are corrected for drilling mud contamination and other sampling artefacts. RMB: average 3He/4He production ratio of Molasse to Lias Group sedimentary rocks in the Swiss Molasse Basin. ASW: air-saturated water (Kipfer et al. 2002). Black lines in the He-plot indicate the behaviour of hypothetical mixtures between ASW and RMB as well as different proportions of mantle helium (RM).
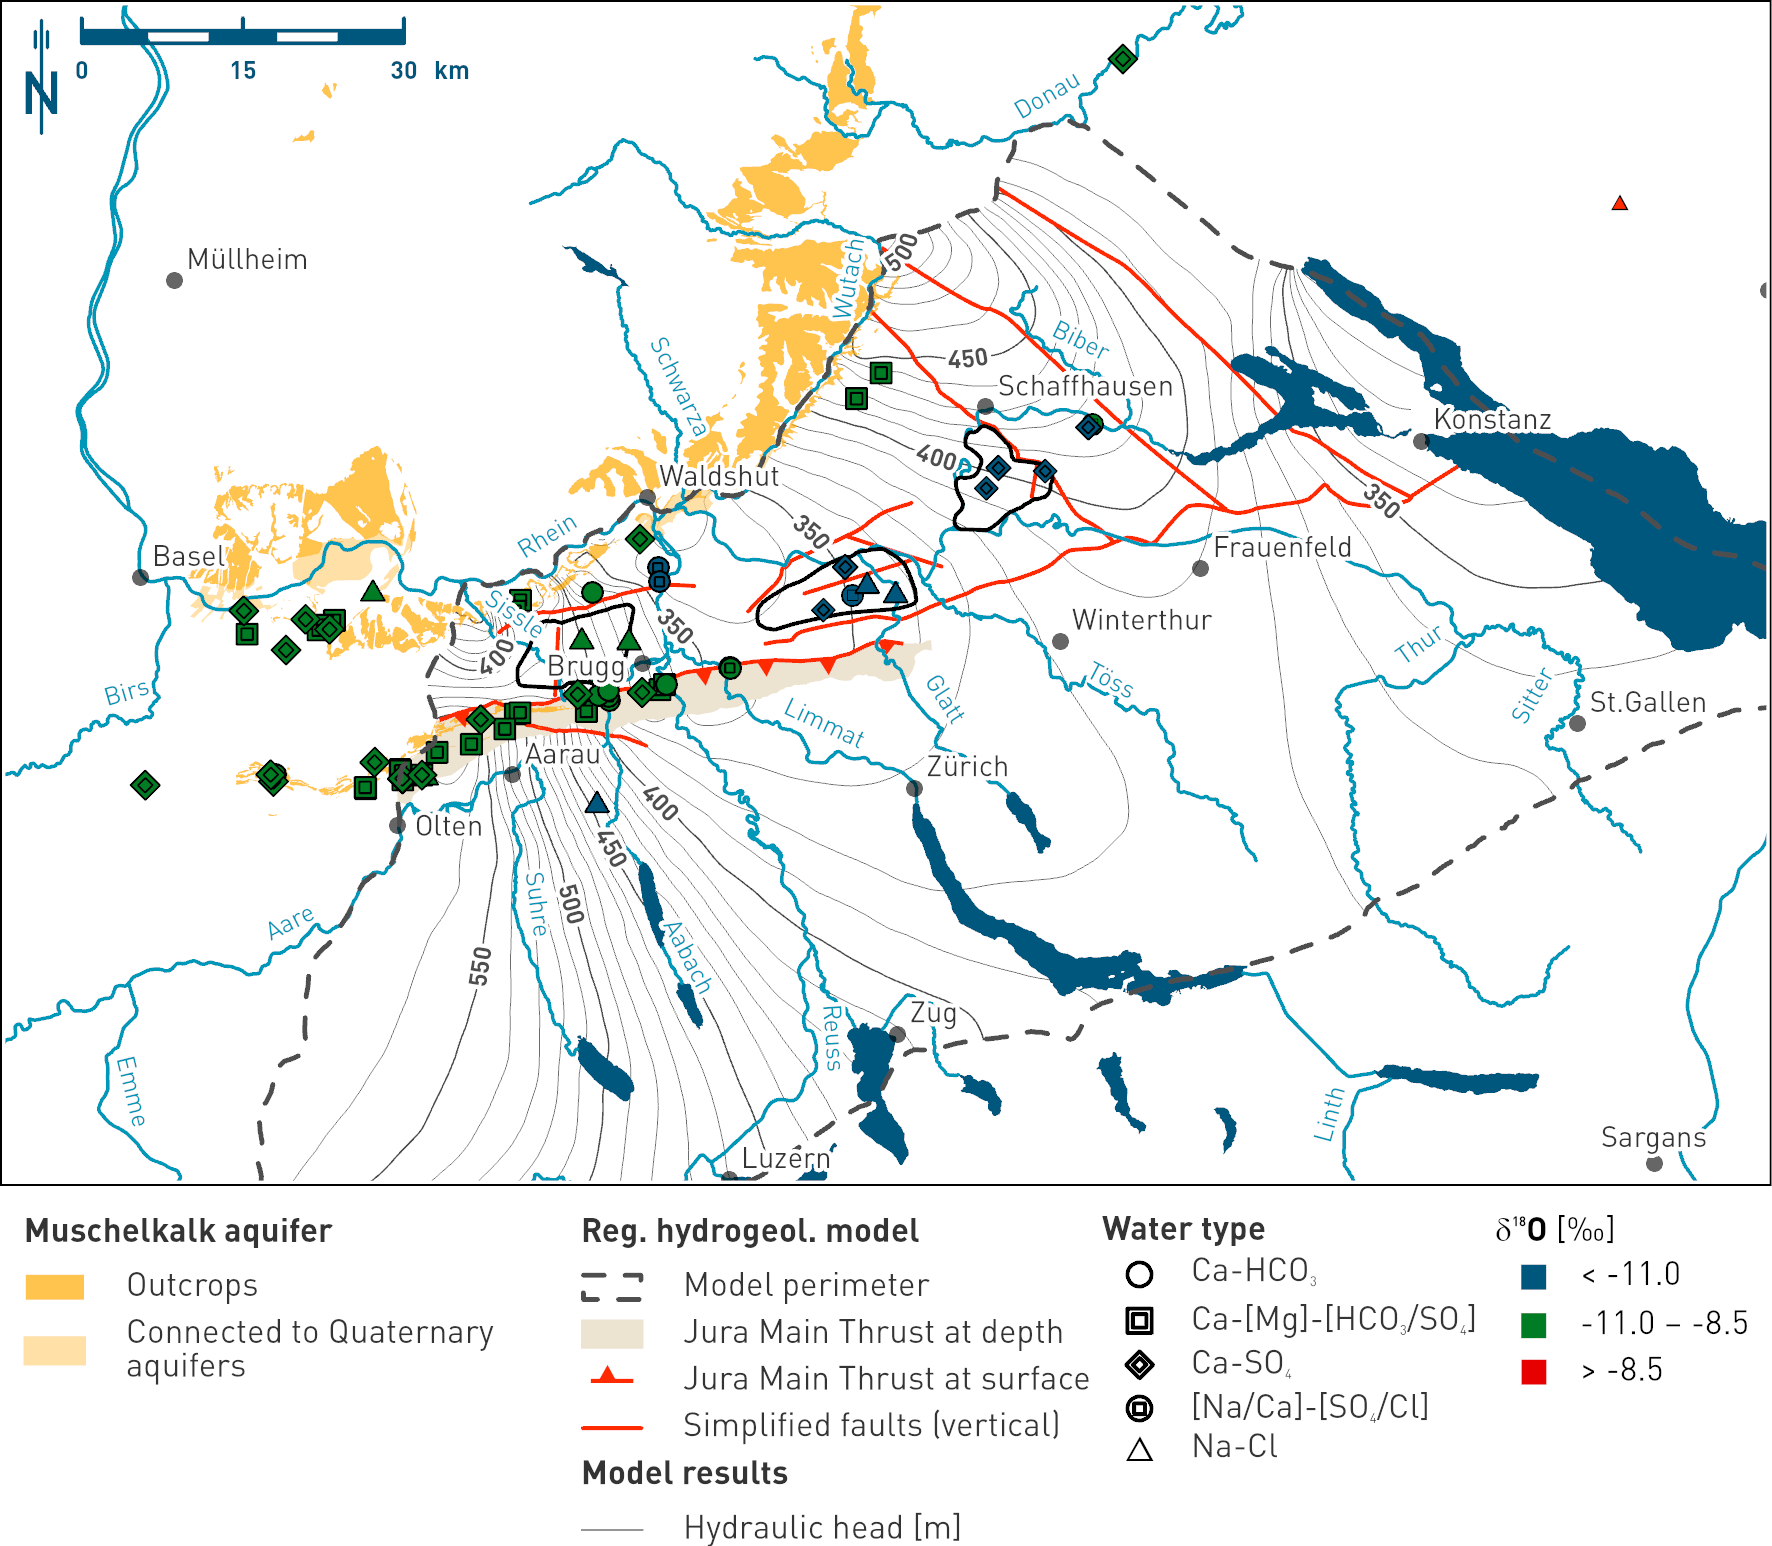
Fig. 4‑113:Map showing the spatial distribution of δ18O values in groundwaters collected from the Muschelkalk aquifer as indication of the recharge conditions of the different water types
The symbols represent the water types while the colour of the fillings indicates the δ18O value range of the samples (see legend). The data range of δ18O of -11.0 to -8.5 ‰ VSMOW is representative for recent groundwaters of the region. Green colour denotes groundwater formed during climatic conditions similar as today in the study area. Groundwater samples marked in blue formed under cold climatic conditions. The map also shows the outcrops of the Muschelkalk aquifer, a simplified regional fault pattern and the hydraulic head isolines according to the regional hydrogeological model (Section 4.5.4.5).
B) Regional groundwater evolution
The different hydrogeochemical signatures of the Muschelkalk groundwaters in Northern Switzerland reflect different stages in their hydrogeochemical evolution. This is discussed below for the three major groups of water types.
Ca-HCO3 and Ca-[Mg]-[HCO3/SO4] type groundwaters: Shallow groundwaters close to outcrops
In Northern Switzerland, Ca-HCO3 and Ca-[Mg]-[HCO3/SO4] type groundwaters occur at relatively shallow depths where the Muschelkalk units outcrop at the surface or where they are in contact with Quaternary gravel aquifers such as at the southern margin of the Black Forest or north of the Aare River in the Jura Mountains (Fig. 4‑113). They represent the first stage of the hydrogeochemical evolution when meteoric water infiltrates into the Muschelkalk aquifer. This is consistent with their short residence times inferred from 3He and 14C activities as well as their δ18O signatures, which fall within the range of meteoric water infiltrating under similar climatic conditions to today (Fig. 4‑112). High recharge rates through the Muschelkalk outcrops and the high solubility of gypsum probably lead to a depletion of gypsum with time. Accordingly, these groundwaters deviate from the 1:1 correlation between alkaline earth metal cations (Ca2+ + Mg2+) and SO42- (Fig. 4‑112), and their chemical composition is mainly controlled by the dissolution of calcite and dolomite with a variable contribution from the dissolution of gypsum or anhydrite.
Ca-SO4 and [Na/Ca]-[SO4/Cl] type groundwaters: ZNO and NL siting regions
Compared to the Ca-HCO3 and Ca-[Mg]-[HCO3/SO4] type groundwaters, the chemical composition of Ca-SO4 groundwaters is more strongly controlled by the dissolution of anhydrite/ gypsum and dolomite as well as the precipitation of calcite as manifested by the 1:1 correlation of alkaline earth metal cations (Ca2+ + Mg2+) and SO42- (Fig. 4‑112). They represent a more evolved state, which is consistent with their lower 14C activity and less negative 13C values, indicating more carbon isotope exchange with Muschelkalk carbonates (Fig. 4‑112). Stable isotope ratios in Ca-SO4 and [Na/Ca]-[SO4/Cl] type groundwaters from the ZNO and NL siting regions show strong linear correlations with a series of other hydrogeochemical parameters including 81Kr model ages, 87Sr/86Sr ratios, as well as Li and Cl concentrations (Fig. 4‑114). Accordingly, they imply that the Muschelkalk groundwaters in the ZNO and NL siting regions represent a mixture of at least two components:
-
A younger meteoric water component of Ca-SO4 type characterised by δ18O values below -12.5 ‰ typical for cold climatic recharge conditions, non-radiogenic 87Sr/86Sr ratios below 0.7083 and Li and Cl concentrations below 0.2 and 5 mmol/L, respectively. This is the major component (> 80%).
-
An older meteoric water component of Na-Cl type characterised by δ18O values above ca. -9 ‰, radiogenic 87Sr/86Sr ratios above 0.7150 and higher Li and Cl concentrations than the meteoric water component described above (i.e. above 0.2 and 5 mmol/L, respectively).
The second component may indicate a contribution from deeper aquifers, e.g. a groundwater similar to the WEI sample from the crystalline basement (Fig. 4‑114). This component may i) still ascend along faults or ii) be present in the matrix porewater with an origin related to earlier cross-formation flow under different geodynamic conditions (Fig. 4‑115). Note that similar observations have previously been used to postulate upwelling of groundwater from the crystalline basement into the Muschelkalk aquifer north of the Bodensee (Stober et al. 2023) and that, in the two Schlattingen (SLA1 and SLA2) boreholes, the sample from close to the Randen Fault
indicates higher δ18O and chloride as well. It is important to note here that the most mineralised groundwater from BUL1 (Na-Cl type) is affected by salt dissolution but is devoid of particular indications of a basement component (see separate discussion below).
The mixing model discussed above is fully consistent with the regional hydrogeological model for the Muschelkalk aquifer in the ZNO and NL siting regions. Fig. 4‑116 shows that δ18O values increase with increasing distance from the Muschelkalk outcrops along the SE margin of the Black Forest in Southern Germany (e.g. Wutach Valley) probably operating as the main recharge location of the younger meteoric water component. Based on their linear correlations with δ18O values (Fig. 4‑114), the same applies to the 81Kr model ages, the 87Sr/86Sr ratios and the concentrations of Li and Cl. The proportion of the younger meteoric water component decreases along the groundwater flow path inferred from the regional hydraulic flow model (Fig. 4‑116). In contrast, the proportion of the older meteoric water component increases, although in most cases it never reaches more than a few percent based on the correlations shown in Fig. 4‑114. The strong spatial control of the proportion of the two water components demonstrates that the Muschelkalk aquifer in the ZNO and NL siting regions represents a large and regionally well-connected aquifer. This is in strong contrast to the other deep aquifers such as the Malm aquifer where the flow rates are much slower and almost stagnant conditions prevail. The differences occur because the transmissivity of the Muschelkalk aquifer is higher (Fig. 4‑86). In addition, the hydraulic head gradient is higher because the Muschelkalk outcrops on the southern margin of the Black Forest occur at a higher altitude than those of the Malm aquifer (Fig. 4‑105 vs. Fig. 4‑113).
While 14C activities, 81Kr model ages and δ18O values are fully consistent with recharge of the younger meteoric water component during the last glaciation period (12 – 115 kyr), the residence time of the older meteoric water component is less constrained. Based on the inferred endmember δ18O value around -8.5 ‰ indicating climatic conditions similar to today and the increase in 81Kr model ages with increasing contribution of this water component, the corresponding minimum residence time relates to the previous Eemian interglacial period some 115 – 130 kyr ago (Preusser et al. 2011). However, the residence time of this water component could be much higher. Unfortunately, there are no 81Kr analyses available for the groundwaters from SLA2 and WEI to better constrain the residence time of this second, upwelling groundwater component. Also, it remains unclear whether the vertical connection between the Muschelkalk aquifer and the underlying crystalline units is still active today. Alternatively, the recharge of the younger meteoric water component during the last glaciation period (12 – 115 kyr ago) could have caused the displacement of the older one, which may have infiltrated into the Muschelkalk aquifer along deep-reaching faults a long time ago. Overall, the strong linear correlation between δ18O values and the 81Kr model ages (Fig. 4‑114) suggests that the older meteoric water component is Kr‑bearing and that the 81Kr model ages reflect the mean residence time of the mixture of the two components.
Na-Cl type groundwaters in NL siting region
The composition of Na-Cl type groundwaters in the NL siting region (particularly BUL1; Fig. 4‑112) is mainly controlled by the dissolution of halite (NaCl) locally occurring in the Zeglingen Formation, around 100 m below the Muschelkalk aquifer (Section 4.2). Such dissolution does not affect hydrogeochemical parameters other than the concentrations of Na and Cl and the Br/Cl ratio, thus these groundwaters have simply experienced an additional chemical process in comparison to the Ca-SO4 and [Na/Ca]-[SO4/Cl] type groundwaters described above. Their hydrogeochemical evolution, however, could be very similar. This is manifested in the ZNO and NL siting regions where the Na-Cl type groundwaters plot on the same correlations between δ18O and other hydrogeochemical parameters (Fig. 4‑114) and thus belong to the same regional flow system.
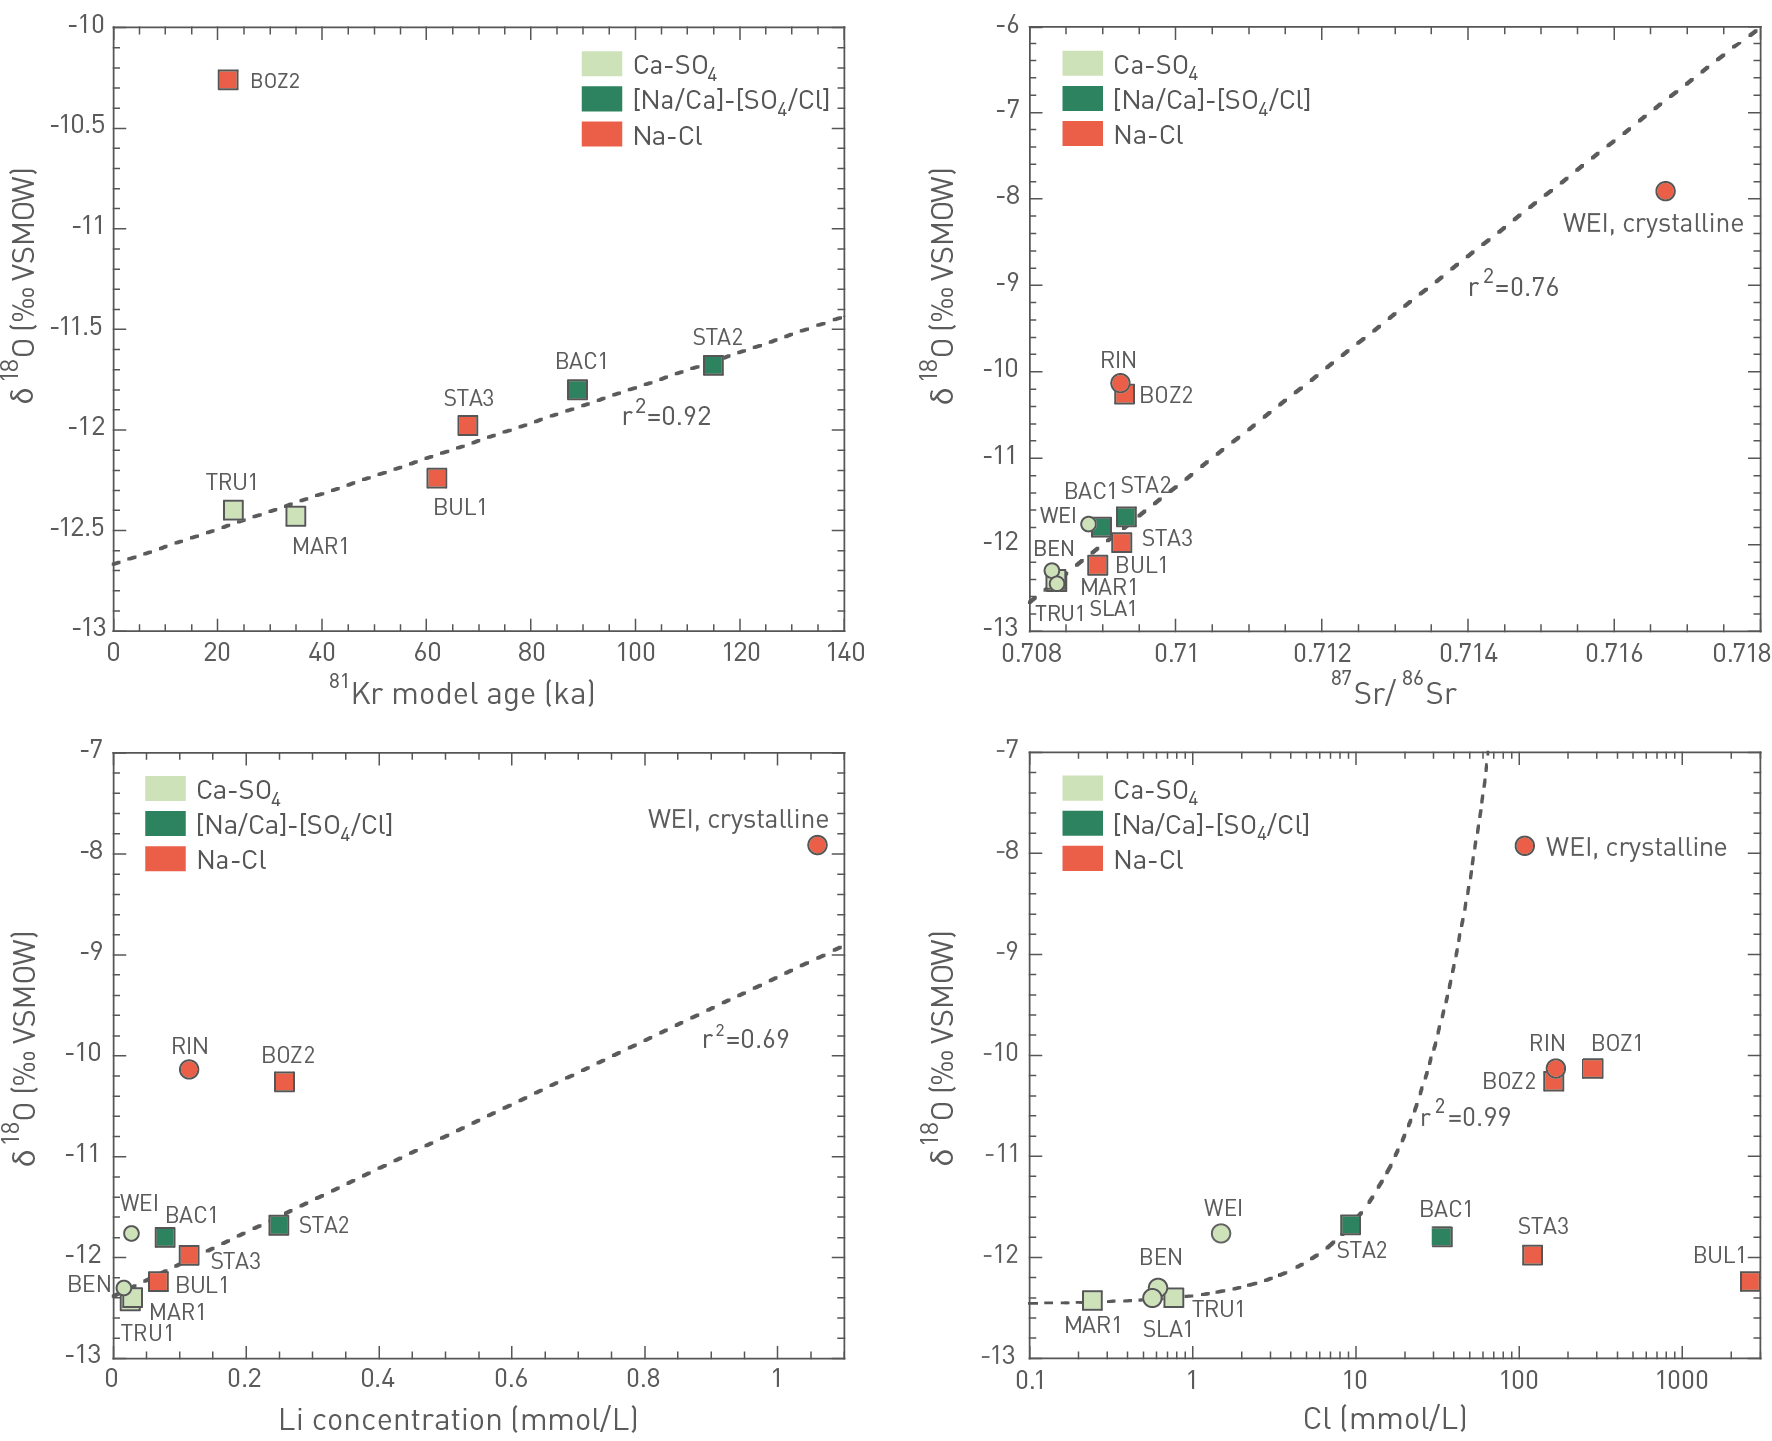
Fig. 4‑114:Correlations between δ18O values and selected other parameters of Muschelkalk groundwaters collected in the siting regions as well as comparison to a potential endmember of the mixing trend (WEI, crystalline)
Circle and square symbols represent samples reported in Waber & Traber (2022) and collected during the TBO campaign, respectively. The linear correlations, plotted as dashed lines, were derived using the samples collected during the TBO campaign in the NL and ZNO siting regions. For the δ18O vs. Cl correlation, the Na-Cl type Muschelkalk groundwaters were not used because they are affected by the local dissolution of halite. Also discarded was the [Na/Ca]-[SO4/Cl] type groundwater collected from the BAC1 borehole because it is also likely affected by local halite dissolution.
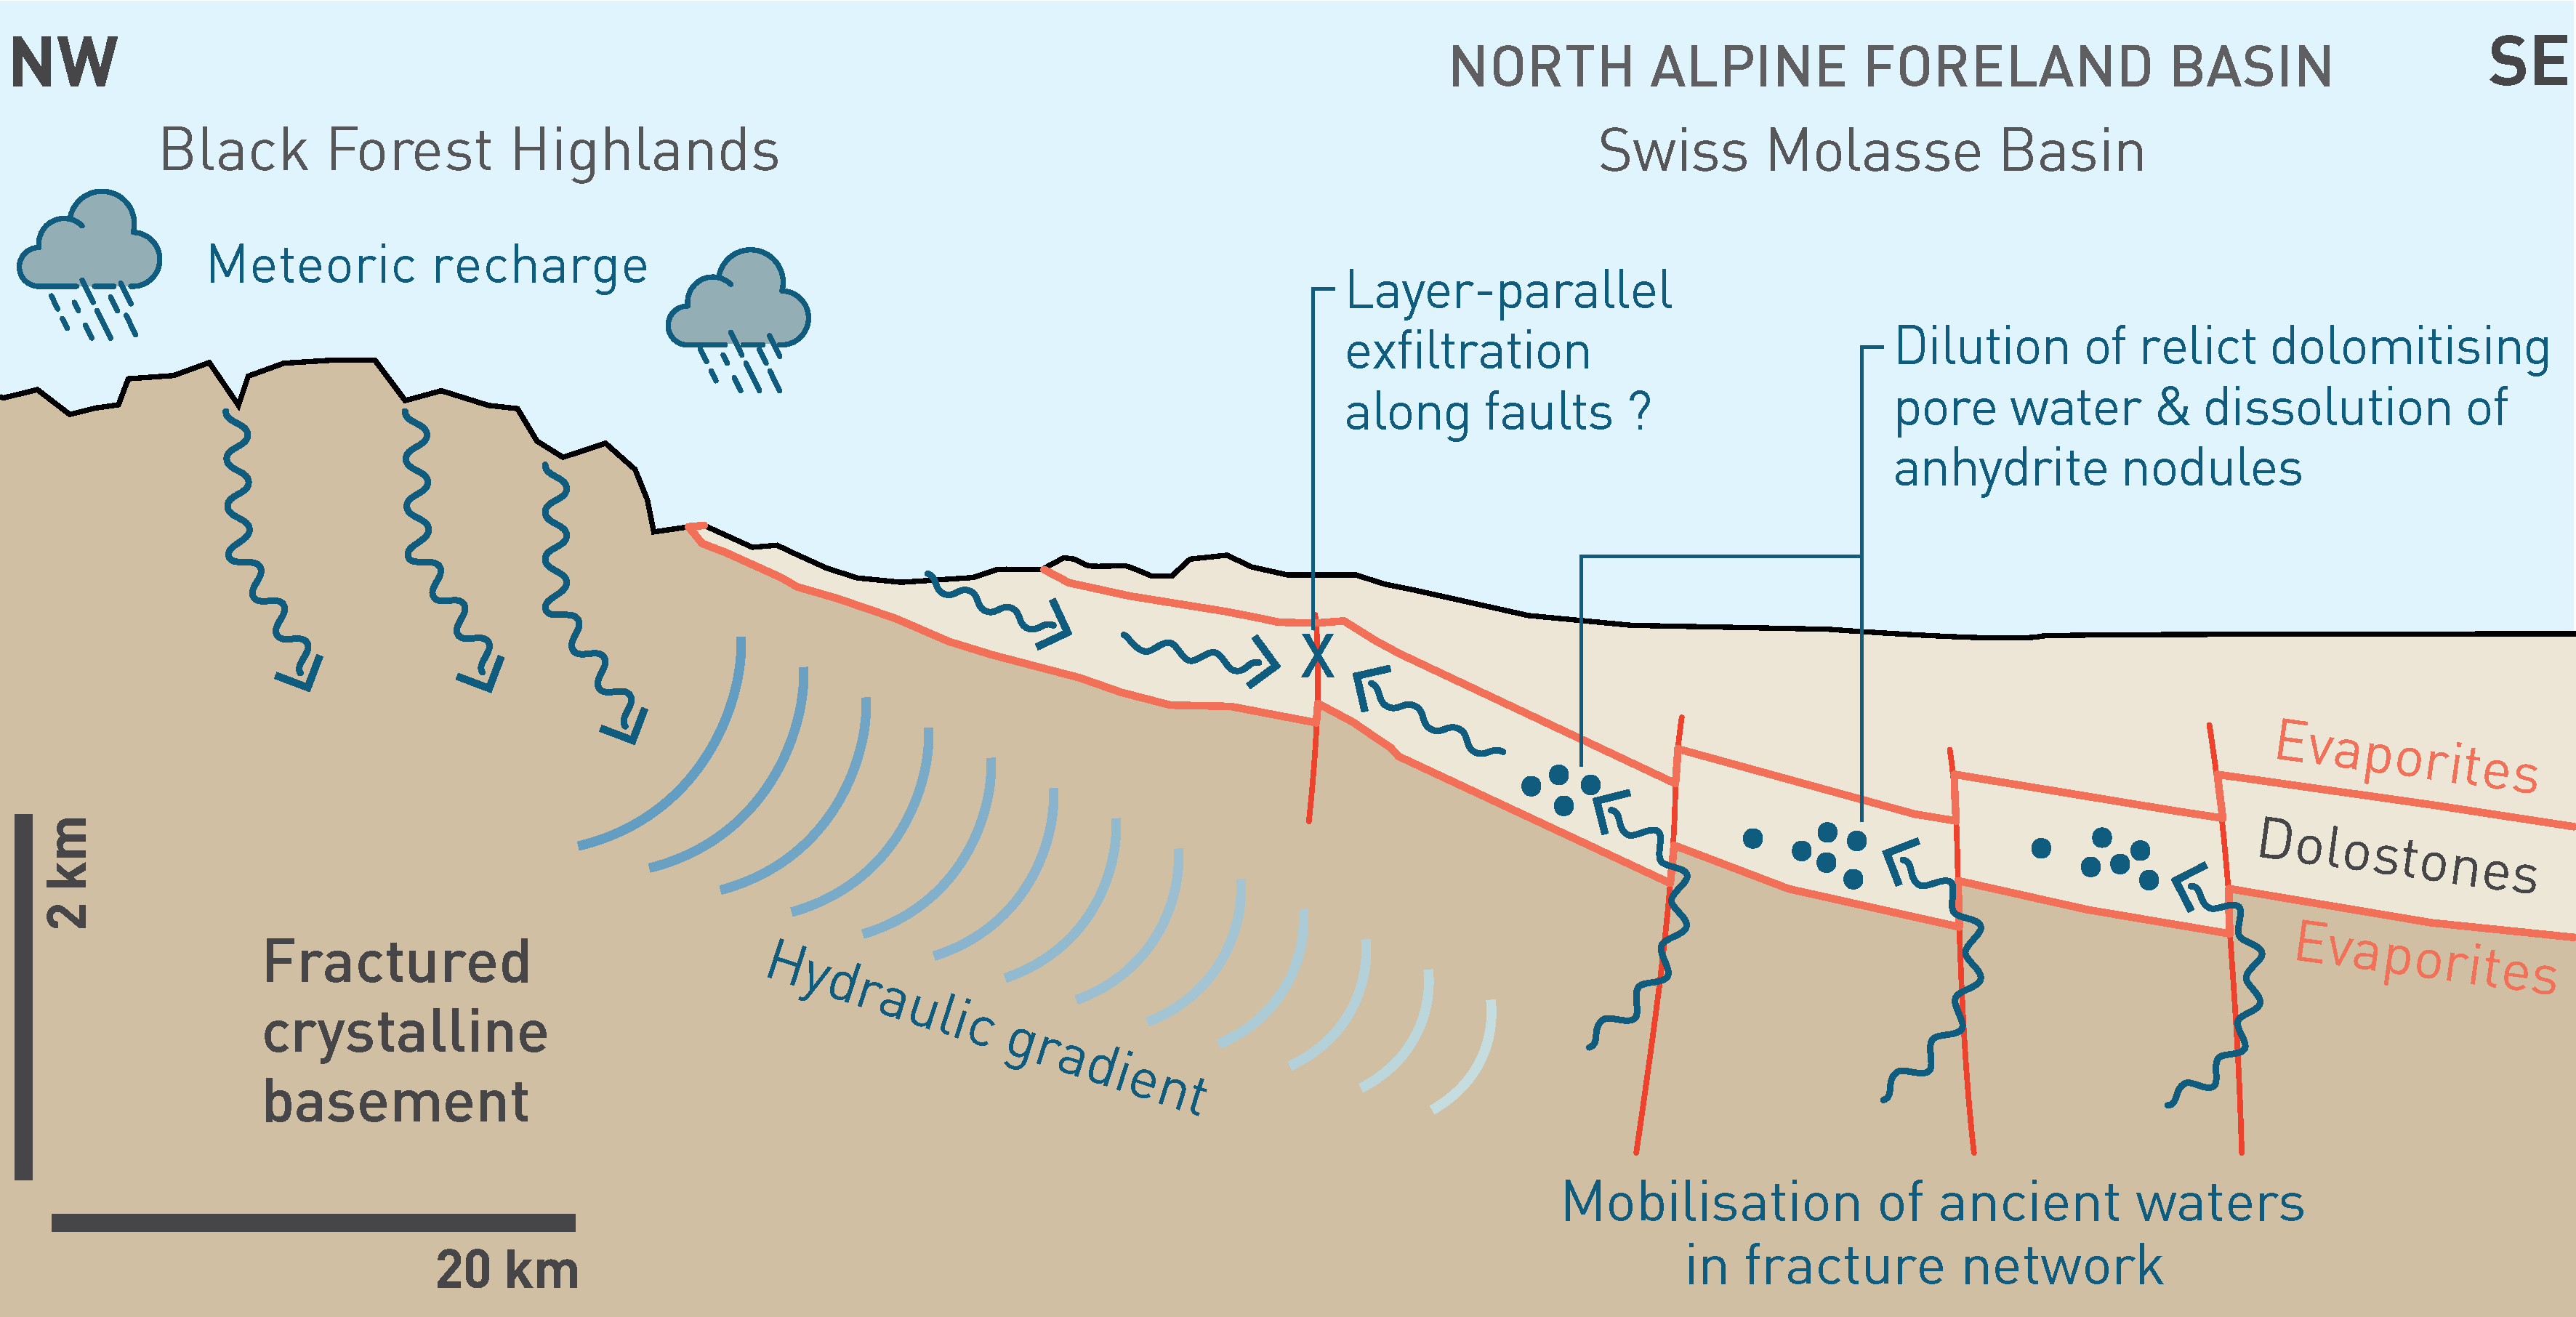
Fig. 4‑115:Sketch illustrating the upwelling of groundwater from the crystalline basement into the Muschelkalk aquifer along regional fault zones some 8 – 13 Myr ago
Modified from Aschwanden et al. (2019b).
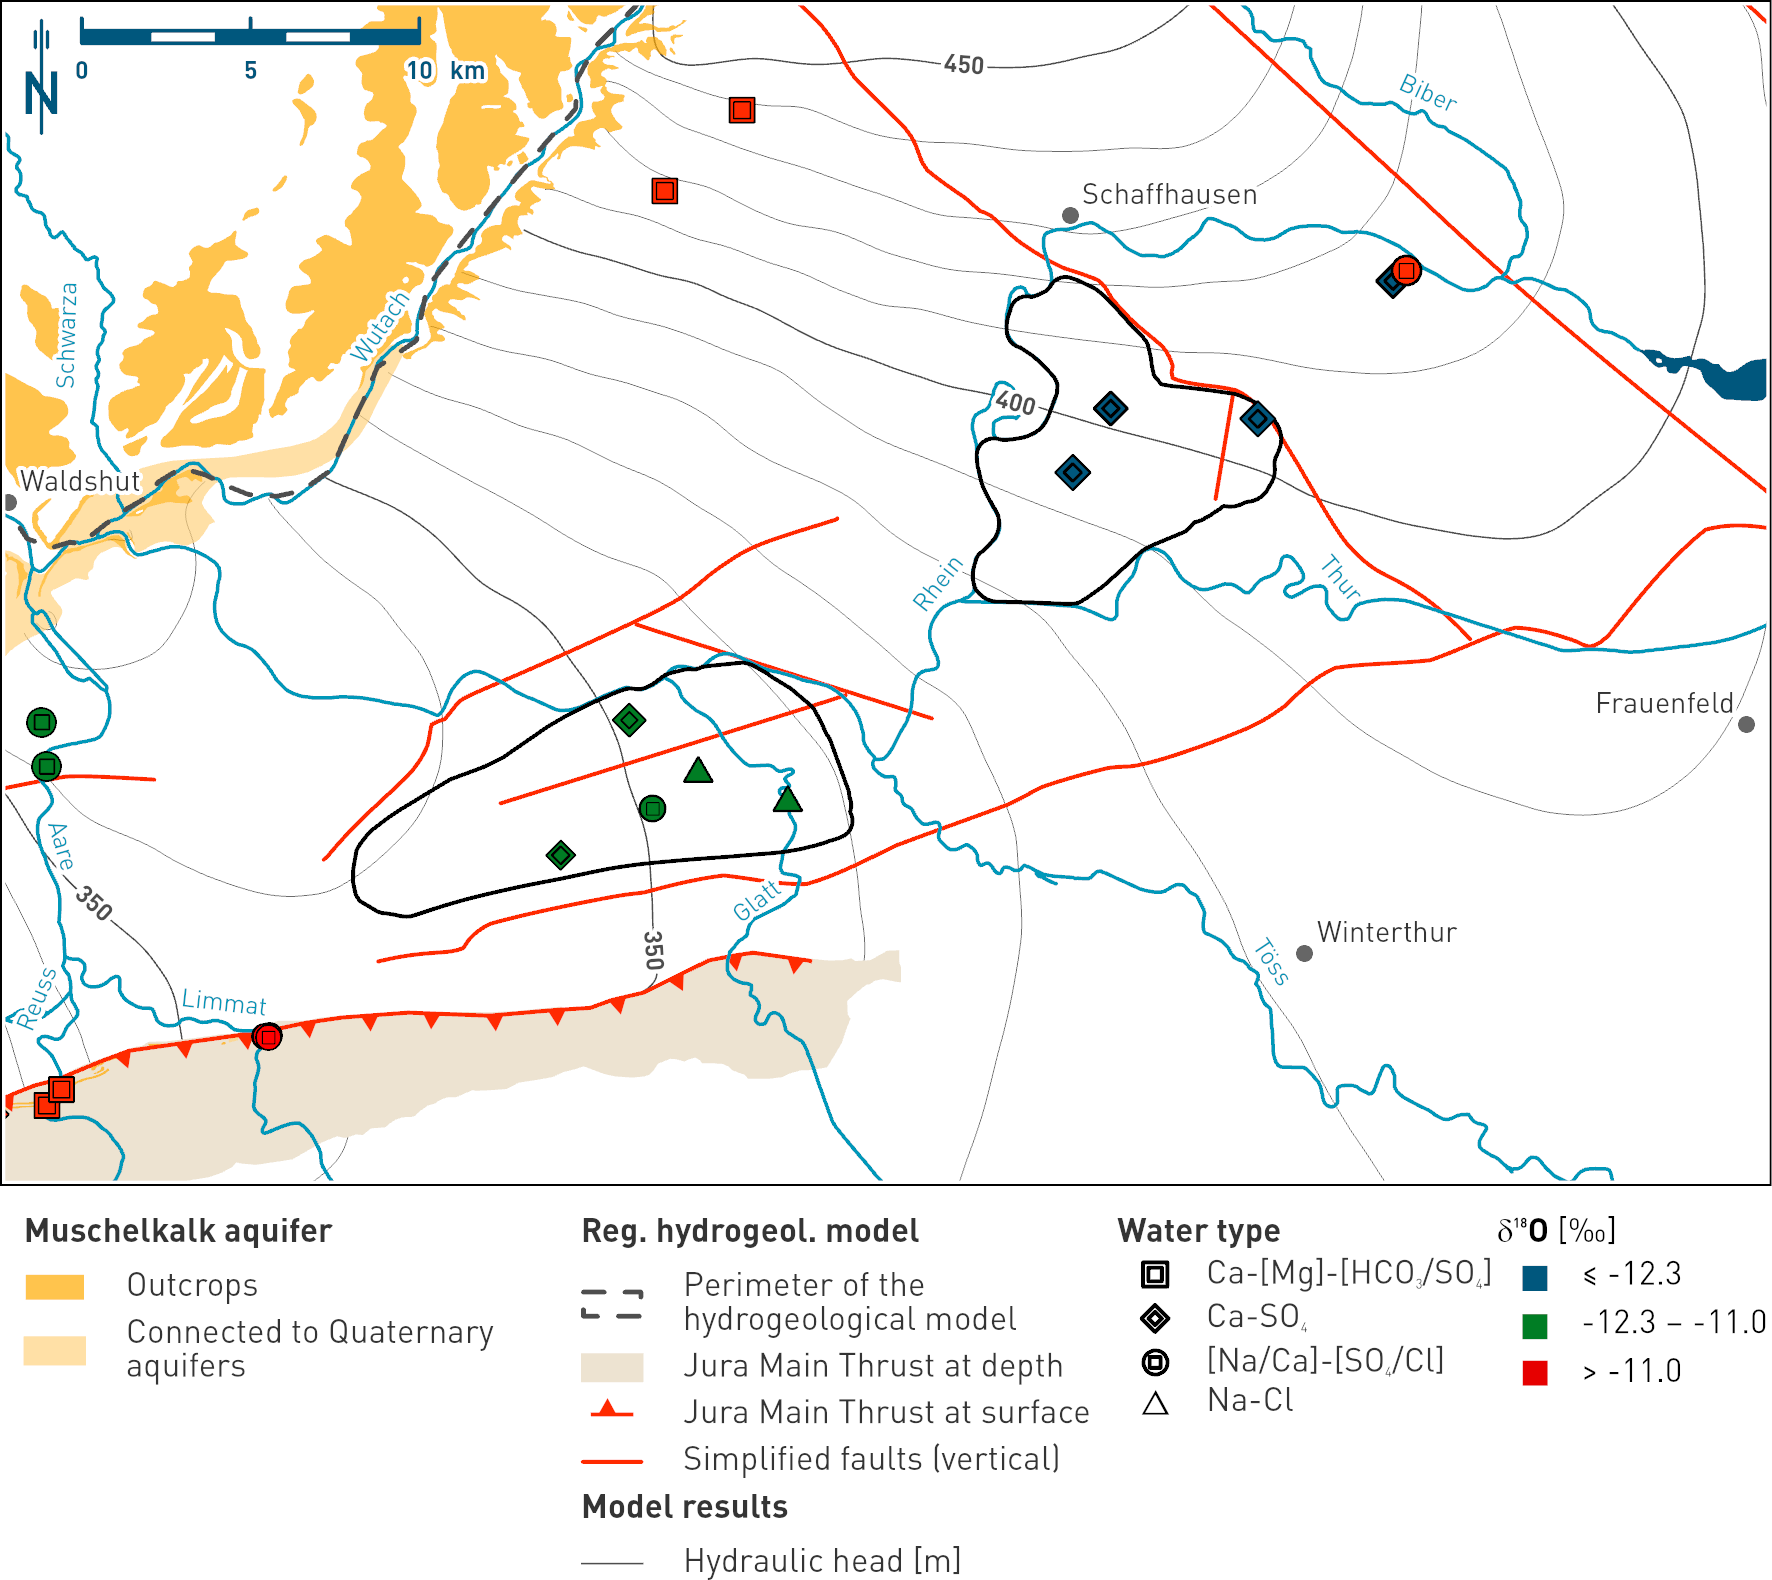
Fig. 4‑116:Map showing the distribution of the δ18O values in groundwaters of the Muschelkalk aquifer as manifestation of the regional groundwater flow system in the ZNO and NL siting regions
The general flow direction is illustrated in Fig. 4‑102. The symbols represent the water types while the colour of the fillings indicates the δ18O value range of the samples (note the different classes compared to Fig. 4‑113). The map illustrates the evolution from the particularly negative isotopic composition of the groundwater in the ZNO area to less negative values in NL (see text for details). The map also shows the Muschelkalk outcrops, a simplified regional fault pattern and the hydraulic head isolines according to the regional hydrogeological model (Section 4.5.4.5).
Na-Cl type groundwaters in the JO siting region
All groundwaters from the JO siting region are of Na-Cl type (Fig. 4‑112), which may be explained by a saline component reaching the Muschelkalk aquifer probably along the Jura Main Thrust south of the JO siting region. Based on strongly contrasting δ18O values and the lack of correlations with other chemical parameters plotted in Fig. 4‑114, they have probably experienced a contrasting hydrogeochemical evolution than the Muschelkalk groundwaters in the NL and ZNO siting regions. Hence, they do not belong to the same flow system as the one active in the ZNO and NL siting regions (Section 4.5.4.5) suggesting that, in the JO siting region, recharge occurs through the outcrops in the Jura Mountains to the south and not along the SE margin of the Black Forest as for the other two siting regions (Fig. 4‑113). In addition, based on the 81Kr and 14C model ages of the BOZ2 sample of less than 22 kyr and 14 kyr, respectively, also the mean groundwater residence time in the JO siting region may be quite different. Together with the δ18O value of around -10 ‰, these model ages point towards recharge occurring in the current Holocene interglacial period. Accordingly, the flow system in the Muschelkalk aquifer in the JO siting region may be more active than in the two other siting regions. This could be a result of the local tectonic setting (Section 4.3).
Summary of the Muschelkalk aquifer in the siting regions
In conclusion, the Muschelkalk aquifer in the ZNO and NL siting regions represents a regionally well-connected aquifer consisting of two main water components: (i) Ca-SO4 type groundwaters originating from meteoric water that infiltrated through the Muschelkalk outcrops along the SE margin of the Black Forest during the last glacial period (12 – 115 kyr) and a minor component of (ii) an older Na-Cl type groundwater of meteoric origin that upwelled into the Muschelkalk aquifer from the underlying crystalline basement along deep reaching faults (see discussion in following section). Locally, the dissolution of halite may lead to high concentrations of Na and Cl exceeding those of seawater; however, this is not necessarily related to cross-formation flow. In the JO siting region, the Muschelkalk aquifer belongs to a different, much more active hydraulic system where recharge probably occurred in the current interglacial period (< 12 kyr ago).
In the three siting regions, the deep aquifers situated above and below the potential repository host rock (Malm, Hauptrogenstein, Keuper, Muschelkalk) are separated by low-permeability aquitards such as the Opalinus Clay below the Malm/Hauptrogenstein aquifers and the anhydrite-rich Bänkerjoch Formation below the Keuper aquifer (Section 4.5.3). These aquitards act as highly efficient barriers and thus cause a pronounced separation in the behaviour of the aquifers. Based on the distinct hydrogeochemical properties of the aquifers discussed above, there is no indication for any advective groundwater flow across these aquitards. This is particularly manifested by the chloride concentration and 81Kr model age profiles shown in Fig. 4‑117. In each borehole, the two parameters differ by up to two orders of magnitude, whereas similar values are observed in each borehole for the same aquifer. In general, groundwater from the Muschelkalk aquifer displays the lowest 81Kr model ages and Cl concentrations, except for the samples affected by local halite dissolution (e.g. BUL1; Fig. 4‑117). In contrast, groundwater samples from the Malm aquifer show the highest 81Kr model ages and a preserved marine Na-Cl component, although it is located at the shallowest depth compared to the other deep aquifers relevant for the repository host rock. The profiles shown in Fig. 4‑117 thus emphasise that the deep groundwaters in the three siting regions experienced a highly distinct, aquifer-specific evolution and do not communicate hydraulically across the aquitards. Accordingly, the chemical signature of deep groundwaters is controlled by the local mineralogy as well as the corresponding, aquifer-specific hydrogeochemical evolution. The hydrogeochemical evolution is mainly affected by the regional connectivity, the transmissivity and the hydraulic head gradient driving groundwater flow. For instance, because of the higher hydraulic head gradient, higher transmissivity and better connectivity (Section 4.5.3), the Muschelkalk groundwaters display a lower mean residence time than groundwaters from the other three aquifers. Consequently, signatures of stable isotopes of the Muschelkalk groundwaters fall almost exactly on the Global Meteoric Water Line whereas significant shifts may be observed in samples of deep groundwaters from the other aquifers.
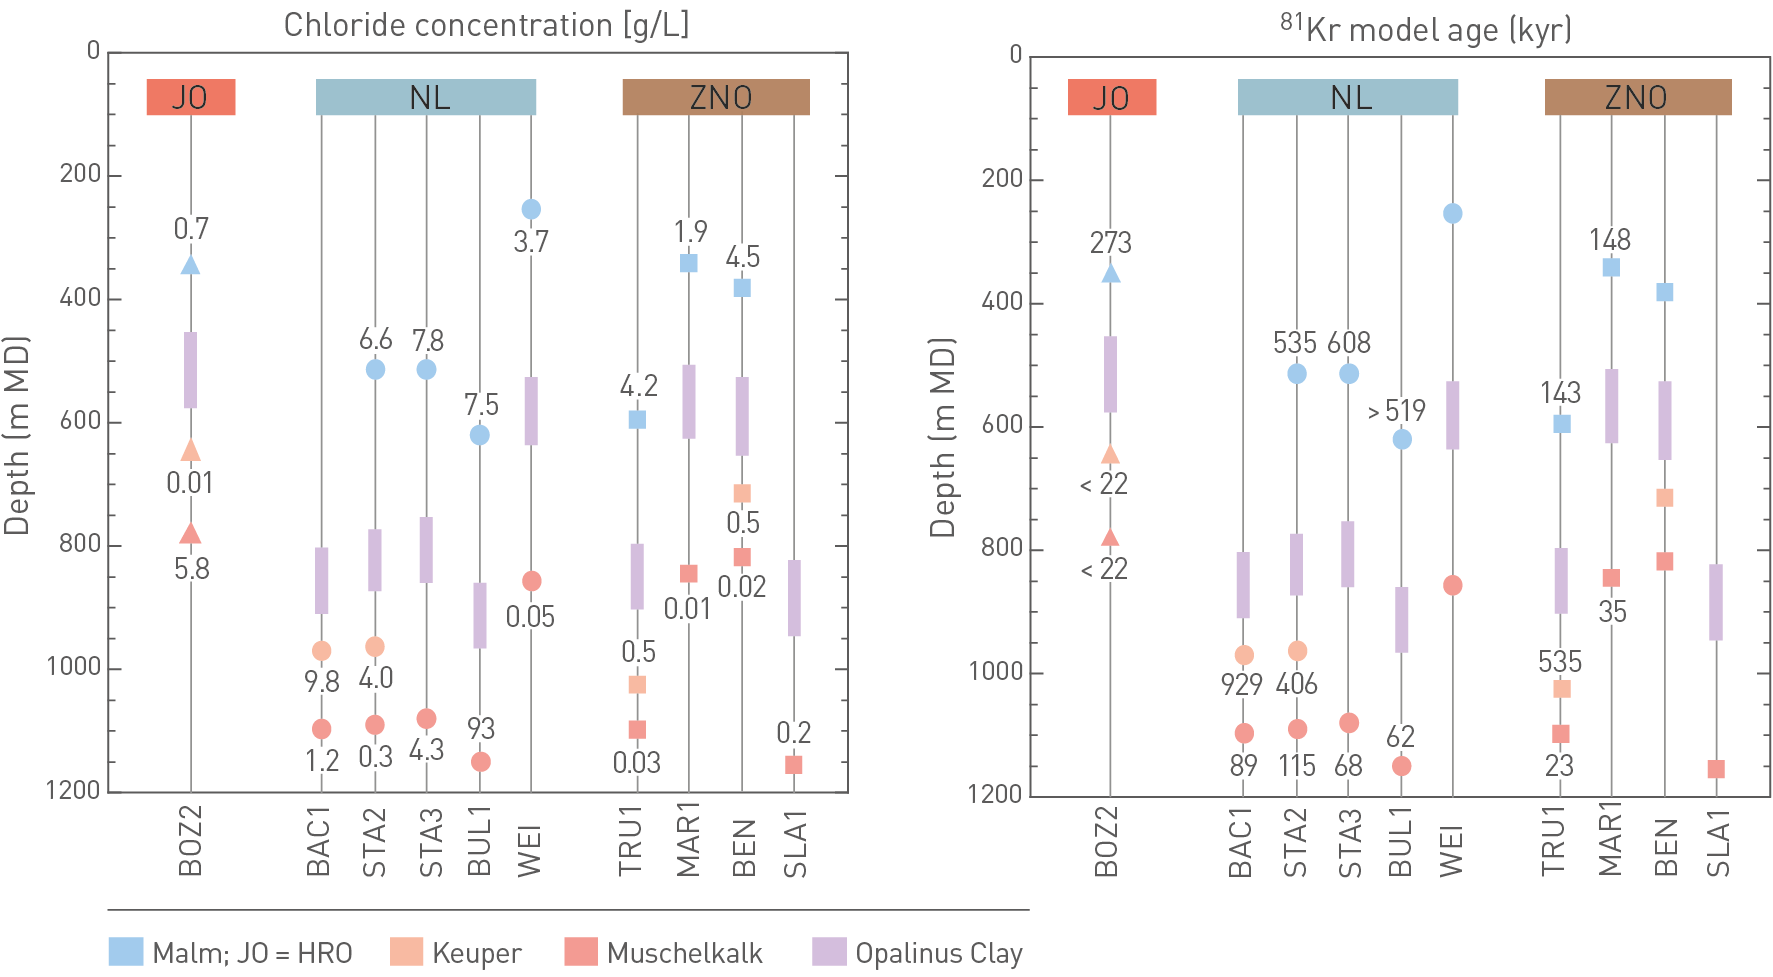
Fig. 4‑117:Chloride concentrations and 81Kr model ages in groundwater collected from boreholes in the three siting regions
The symbol colours (blue, orange, red) denote the aquifer from which the groundwaters were sampled and the adjacent number displays the corresponding chloride concentration in g/L and 81K model ages in kyr. The depth range of the Opalinus Clay in the different boreholes is shown as a reference in purple. High chloride concentrations observed in the Muschelkalk samples from BUL1 and STA3 are inherited from the dissolution of local halite occurrences and thus cannot be discussed in the regional context. For JO, data for the Hauptrogenstein aquifer (HRO) are shown (which is closer to the Opalinus Clay than the Malm aquifer).
Despite the strong aquifer-specific signature of deep groundwaters occurring in the aquifers above and below the Opalinus Clay and the lack of mutual hydrogeochemical interaction, three types of cross-formation flow appear to be relevant between this Mesozoic sedimentary sequence and the underlying crystalline basement as well as with the Molasse units located above. These exceptions are described below.
i) Downward migration into the Malm aquifer
Based on the strong similarity of Na-HCO3 and Na-Cl type groundwaters from the Molasse and Malm aquifers (Fig. 4‑104), the high salinity and Na-Cl type nature of the Malm groundwaters in the ZNO and NL siting regions is probably inherited from the penetration of seawater from OMM times into the USM and eventually into the Malm aquifer. While the downward migration of seawater from the OMM probably occurred several million years ago during Pliocene times, it appears to also be facilitated during glacial periods. This is manifested by δ18O values below -11 ‰ typical for recharge under cold climatic conditions of Na-HCO3 type groundwaters collected from the Malm and Molasse aquifers in the Bodensee region in Southern Germany (Fig. 4‑104, Fig. 4‑105). A potential explanation for the accelerated downward migration during glacial periods is that the water pressure at the base of large glaciers is high because it represents the thickness (i.e. the topography) of the entire glacier (e.g. Schintgen & Moeck 2021). Accordingly, the recharge of glacial meltwater through the underlying units of the Molasse sequence into the Malm aquifer may be promoted during glacial periods (Section 6.5). This hypothesis is consistent with the extent of glaciers during the last few glacial periods covering the locations showing Na-HCO3 type Malm groundwaters in the Bodensee region today (Preusser et al. 2011). Schintgen & Moeck (2021), however, have shown that the penetration of meteoric water through the entire Molasse sequence during glacial periods requires elevated permeability of the Malm aquifer. The low permeability of the Malm aquifer in the ZNO and NL siting regions (Section 4.5.3) is probably another reason why, in Northern Switzerland, such downward migration did not reach the Malm aquifer during the last glaciation, as evidenced from the lack of cold climate stable isotope signatures, high 81Kr model ages and high salinities (Fig. 4‑104, Fig. 4‑106). In other words, it allowed the preservation of the Na-Cl type waters in the Malm.
ii) Upwelling of groundwater from the crystalline basement into the Muschelkalk aquifer
The correlations between hydrogeochemical parameters of Muschelkalk groundwaters collected from the ZNO and NL siting regions (Fig. 4‑114) provide evidence for the upwelling of groundwater from the crystalline basement into the overlying Muschelkalk aquifer (see Section 4.5.5.5: Muschelkalk aquifer). It is unclear, however, whether upwelling still occurs today or only happened in the geological past. In either case, the upflow of water from the crystalline basement is driven by the hydraulic head gradient caused by the Black Forest Highlands and is restricted to fault zones (Fig. 4‑115). Upwelling rates, however, are low as manifested by the mean residence time inferred for the upwelling water component of at least 115 kyr, as well as the low proportion of a crystalline groundwater endmember inferred from the correlations shown in Fig. 4‑114.
iii) Episodic upwelling of gases from deep sources
4He concentrations in Na-Cl type Malm groundwaters from the ZNO and NL siting regions are above the maximum values expected from in-situ 4He production (Fig. 4‑104). In the case of TRU1 and MAR1 they even exceed the concentrations measured in the adjacent porewater (Rufer et al. 2024). In addition, deep sedimentary groundwaters from all three siting regions show 3He/4He ratios above those expected for Mesozoic sedimentary rocks. It follows that locally there are external 4He sources for the Na-Cl type Malm groundwaters whereas a regionally relevant external 3He source affects the 3He/4He ratio of all deep groundwaters.
For the Malm aquifer, 4He concentrations above those measured in the adjacent porewater suggest that He and other gases (e.g. CO2, CH4, N2) originate from the episodic upflow of gases along deep-reaching faults connecting the Malm aquifer with deeper units and bypassing the Mesozoic sedimentary sequence in between (Rufer et al. 2024).
The few percent of mantle-derived He identified in all deep aquifers is caused by the diffusive background 3He flux from the earth’s mantle into the crust, which may be variable in the three siting regions based on the different tectonic setting. For instance, the influence of the Hegau – Bodensee Graben decreases from east to west (Section 4.3). Elevated 3He/4He ratios are expected for the Hegau volcanic area. A regional decrease of the mantle-derived 3He flux may have caused the east-west trend of decreasing 3He/4He ratios in the Muschelkalk groundwaters, with highest values in the ZNO and lowest values in the JO siting region (Fig. 4‑112). In the case of the Muschelkalk aquifer, the 3He/4He ratio may be additionally affected by elevated dissolved 3He and/or 4He concentrations in the upwelling groundwater component and hence by advection (Fig. 4‑115). In any case, in contrast to the 4He input into the Malm aquifer, there is no evidence that the diffusive or advective 3He input occurs as gaseous He.
Thanks to the new boreholes of the TBO campaign, the hydrogeological understanding of the siting regions could be supplemented and refined. The combination of the hydrogeological dataset with the lithostratigraphic and structural geological investigations is the basis for the development of the 3D model understanding and the evolution with time. The major differences between the siting regions regarding hydrostratigraphy relate to the occurrence of the Hauptrogenstein aquifer exclusively in JO and the site-specific differences regarding the local Keuper aquifer. The siting regions NL and ZNO share many commonalities regarding the Muschelkalk aquifer and in some aspects also regarding the Malm aquifer. In the JO siting region flow systems are of a more local scale due to the tectonic and topographic situation.
The combination of the steady state hydrogeological model together with the hydrogeochemical dataset is the basis for the analysis of the flow systems. The combined dataset can be used for consistency checks and helps to identify transient states.
Malm aquifer: There is a well-established hydrodynamic understanding of the regional flow pattern in the Malm aquifer which can consistently be supported with the hydrogeochemical data. The Na-Cl type groundwaters in the NL and ZNO siting regions include variable contents of fossil OMM seawater. The fact that such an old water component is preserved can only be explained by comparatively low hydraulic conductivities and a quasi-stagnant area in the flow system. For the ZNO siting region, the groundwater model suggests recharge from the Malm outcrops in the north-east (Fig. 4‑105). This means that the current Na-Cl type groundwater will be increasingly displaced by freshwater in the future (Section 6.5). This is consistent with the observed mixing trends including the different salinities and model ages observed in the ZNO region, with MAR112 clearly more strongly influenced, while in BEN, and even more so in TRU1, more of the old component has been retained. A large fraction of the OMM seawater is preserved in the NL siting region where the samples from BUL1, STA3 and STA2 indicate a comparably uniform composition characterised by high salinities, high δ18O values and high 81Kr model ages (> 519 kyr; Fig. 4‑106). For this zone, the hydrodynamic model indicates low horizontal gradients and slow recharge via seepage from the overlying Molasse into the Malm, which is in agreement with earlier conceptual ideas of Molasse – Malm interaction (e.g. Schmassmann et al. 1990, Balderer 1990). Here, the findings consistently indicate a zone of quasi-stagnant conditions where the recharge into the Malm is limited by the low vertical hydraulic conductivity of the Molasse. Further to the north, in the Weiach borehole, the groundwater salinity is about 50% lower. This indicates a significant contribution of a freshwater component which might be related to the thinner Molasse cover here (top Malm is at a comparably shallow depth of 186 m).
Hauptrogenstein aquifer: There is a comparably small-scale flow system because of the local topography including the related outcrops and the regional faults delimiting the siting region in the south and in the north. In addition, the facies change from the Hauptrogenstein in the west to the clay-mineral-rich Klingnau Formation in the east affects thickness and the hydraulic conductivity of the aquifer. The groundwater sample from the BOZ2 borehole is of generally Na-SO4 type, characterised by a high 81Kr model age of 273 kyr, and displays a high total dissolved solid concentration of 4.5 g/L. No groundwater could be sampled in the boreholes BOZ1 and RIN. Overall, the location of the eastern boundary of the Hauptrogenstein aquifer is only weakly known.
Keuper aquifer: The Keuper aquifer is considered a local aquifer because of its lithological variability. Therefore, a site-specific discussion and evaluation is needed. In the framework of the hydraulic modelling, a base case and alternative model cases were considered to mimic the different permeable lithofacies and to explore the flow system.
-
JO: All boreholes provided evidence for the existence of a Keuper aquifer. Permeability in JO is probably related to a fracture network in the comparably thick Gansingen Member. The flow system is affected by the tectonic and topographic situation. Recharge occurs via nearby outcrops. Based on the measured heads, topographic considerations and the model scenarios, potential discharge areas are located in the Sissle or the Aare Valley and near the confluence of Aare, Reuss and Limmat. The hydrogeochemical data suggest large differences in flow dynamics between RIN and BOZ2 (the latter is close to outcrops in the north).
-
NL: In the NL siting region, the observed permeable zones relate to the channel facies (STA2) or the overbank deposits (BAC1) of the Ergolz Member. In the BUL1 and STA3 boreholes, hydraulic conductivities are low to very low. Overall groundwater flow therefore depends heavily on the internal structure and connectivity of these fluvial deposits. This was accounted for by different model cases in the hydrogeological modelling (Nagra 2024n). The calibration resulted in a base case model with about one order of magnitude lower hydraulic conductivity in NL compared to ZNO. All modelled cases indicate recharge from the outcrops in the north, which is consistent with the hydraulic heads measured in the boreholes. In detail, the hydraulic head distribution strongly depends on the assumption regarding the hydraulic conductivity distribution, but the discharge area indicated by all cases is located in the lower Aare Valley. The hydrogeochemical dataset indicates low flow dynamics and a correlation with lithofacies: The groundwater sampled from the channel facies of the Ergolz Member in STA2 is characterised by a high 81Kr model age of 406 kyr. For the sample from the somewhat less permeable overbank deposits in borehole BAC1, even a much higher residence time is indicated. Here, the quasi-stagnant conditions resulted in groundwater geochemistry largely equilibrated with the adjacent porewater. To conclude, the hydrogeological data can be explained by only limited to partly absent groundwater flow in the Keuper aquifer in NL.
-
ZNO: The Keuper aquifer in ZNO is closely related to the occurrence of the Seebi Member as a cavernous dolomite breccia. All boreholes of the region indicate an active Keuper aquifer by high hydraulic conductivities (and pumped groundwater samples) and/or anomalies of the natural tracers in the porewater. The similar hydrogeochemical composition of the groundwater samples from BEN and TRU1 agree with a well-connected aquifer in this siting region. The measured hydraulic heads and the hydrogeological model consistently indicate a general groundwater flow direction south to southeast with recharge in the Klettgau area (ca. 15 km to the northeast). Residence times in the system are high as indicated by the 81Kr model age of the TRU1 sample of 535 kyr.
Muschelkalk aquifer: The flow pattern modelled for the Muschelkalk aquifer is in good agreement with the borehole hydraulic head data. The large-scale flow system from the recharge area in the northern Wutach Valley across the ZNO and NL siting regions to the discharge area near the confluence of Aare and Rhine is also consistent with the hydrogeochemical data. There is a much more dynamic flow system compared to Malm aquifer as indicated by the hydrogeochemical data (e.g. 81Kr model ages MAR1 35 kyr and STA3 68 kyr) that include groundwaters of Ca-SO4 to the general [Na/Ca]-[SO4/Cl] type and locally also of Na-Cl type. The groundwater in this flow system can be explained by mixture of Ca-SO4 type water with a subordinate amount (< 20%) of an older component (Li, Cl, Sr isotopes) from the porewater of the rock matrix or from small amounts of water from deeper aquifers. In addition, the groundwaters are locally affected by dissolution of halite (notably BUL1). In the JO siting region, the flow systems are strongly affected by topography and the tectonic situation. The hydrogeochemical tracers point to a comparably active flow system, e.g. 81Kr model age of BOZ2 < 22 kyr. All groundwaters are of Na-Cl type, which are probably explained by a saline component reaching the Muschelkalk aquifer along the Jura Main Thrust south of the JO siting region.
In contrast to what is indicated by the hydrodynamic model, groundwater from MAR1 contains a stronger meteoric component. This might point to a more important flow from the outcrops in the NW to the westernmost ZNO region or an influence related to the overdeepened valley extending to the SE of Marthalen. ↩
Key points:
- Porewater investigations allowed derivation of profiles of natural tracers (including δ2H, δ18O, Cl, Br, 4He, 3He/4He) across the Mesozoic sedimentary column.
- These tracer profiles provide insight into the palaeohydrogeological evolution and dominant transport processes, as well as independent evidence for the hydraulic barrier effect of the host rock and the confining units.
- Transport modelling shows that the curved segments of the profiles result from diffusion-dominated exchange between the porewater and groundwater in aquifers, which were activated in the Pleistocene (variable times depending on the aquifer).
- The highest stable isotope values of the porewater are found in the central part of the Opalinus Clay host rock in NL and are interpreted as the oldest.
- Concentrations of the dissolved noble gas isotope 4He are more than 4 orders of magnitude higher than for air-saturated water. More than 65% of the He produced in Opalinus Clay since deposition is still present, which demonstrates the strong barrier efficiency of the system.
This section discusses data for mobile (i.e. non-retarded) natural tracers (stable isotopes of water, Cl, Br, He) obtained at the different sites investigated. From the shape of the tracer profiles, it is often possible to identify the hydrochemical boundaries of the low-permeability zone (aquitard) and to delineate the thickness of this zone. Furthermore, the relevance of transport processes (diffusion, advection) or of episodic events may be assessed by comparing data and model calculations. A careful analysis of the profiles and the palaeo-hydrogeological setting, including transport modelling, allows the past evolution of the groundwater-porewater interaction to be constrained and to test whether transport parameters obtained in the laboratory are applicable at larger scales.
It is advantageous to consider several different tracers to obtain more robust interpretations. The information provided by each tracer may differ. Tracers such as stable isotopes of water or anions are mostly influenced by processes at hydrogeological boundaries, while a tracer such as He is also affected by the internal production and release rate within the aquitard. Furthermore, transport parameters are not identical. For example, He diffusion coefficients in water are about three times higher, and effective He diffusion coefficients De in the Opalinus Clay are more than five times higher than those of a water tracer (Jacops et al. 2017), while De values of Cl are about four to five times lower than those of a water tracer. Also, during advective transport, anions typically experience a higher effective flow velocity because they are mostly located in larger pores (i.e. further away from negatively charged surfaces) with a higher local flow velocity. He transport tends to be more dominated by diffusion, while anion transport is more sensitive to advection compared to a water tracer. Finally, boundary conditions for the different tracers can vary independently, depending on the hydrogeological and climatic conditions. For example, freshwater recharge is characterised by low anion contents, while the signature of stable isotopes of such water depends also on the climatic conditions. The lack of unique relationships between boundary conditions for different tracers may, in turn, also complicate the definition of consistent sets of boundary conditions for the past.
The spatial distribution of tracer concentrations across low-permeability formations is the result of flow and solute transport processes that have acted over geological timescales. The composition of porewater in aquitards is affected by the initial water composition at the time of sediment deposition (connate water), by water-rock interactions and by solute exchange with adjacent aquifers. If the groundwater composition in an aquifer in contact with an aquitard changes as a result of a palaeo-hydrogeological event (e.g. new discharge zones, new recharge of meteoric water, different climatic conditions etc.; Fig. 4‑118), the changing groundwater signature propagates over time into the aquitard. As solute transport in an aquitard is generally slower than that in an aquifer, tracer profiles across the aquitard have a longer memory. They record situations in the distant past, in particular in their central region where signals from changing boundary conditions in the aquifers are most strongly retarded and attenuated. If molecular diffusion dominates transport across the aquitard, the trends of tracer concentrations are anticipated to be relatively smooth, while advection across the aquitard could (depending on other parameters) lead to sharper tracer fronts.
A tracer profile obtained in a given borehole can represent a steady-state situation, but more often it represents a snapshot of a slowly evolving, transient situation. The profile can be interpreted by transport modelling. The modelling tries to simulate the observed tracer pattern assuming suitable initial and boundary conditions in the past and using transport parameters that were derived from laboratory experiments. Before doing so, it is appropriate to be aware of the approximate ‘field of view', that is of the approximate time and space scales of observation. For one-dimensional diffusive transport, a diffusive timescale td for the propagation of a mobile (non-retarded) tracer over a distance x can be obtained as:
![]()
where Dp is the pore diffusion coefficient. If we assume a thickness x of an aquitard of 100 m and a Dp of 10–10 m2 s–1 (e.g. the Opalinus Clay at in-situ temperature), a change at the boundary of the aquitard would roughly propagate up to the centre of the aquitard in a time frame of about 0.8 Myr. For a thickness of 300 m, the characteristic time would increase ninefold, i.e. to 7.2 Myr. That is, it would still be expected to see a (transient) response of a change in boundary conditions within a formation of 100 or 300 m thickness if this change happened less than about 1 Myr or 7 Myr ago, respectively. In contrast, the new signature would already have affected large parts of the formation if the change had happened several Myr or several tens of Myr ago, respectively. The detailed response would also depend on the variability of diffusion properties or on any influence of advection, but this simple calculation sets a time frame for the interpretation of tracer profiles. It also shows that, during the long time since deposition of the Opalinus Clay, its porewater composition has definitively been altered, inter alia by exchange with groundwater in bounding aquifers and with porewater in embedding formations.
Different methods are required to obtain the concentrations of tracers. Values of the stable isotopes of water (δ2H, δ18O) were mainly obtained by diffusive isotope exchange experiments (Aschwanden et al. 2024, Gimmi et al. 2024). This method is well established and provides robust data for clay-mineral-rich samples but is more challenging and leads to slightly larger uncertainties for low-porosity samples (e.g. limestones or evaporites). Anion (Cl, Br) contents of the porewater were mainly obtained from aqueous leachates (Zwahlen et al. 2024, Wersin et al. 2023), but a substantial dataset from advective displacement (AD) and squeezing (SQ) experiments is also available. The aqueous leachate data have to be scaled by the anion-accessible porosity fraction in order to obtain concentrations per anion-accessible pore volume (as needed for transport modelling, see Section 5.4.2 and Zwahlen et al. 2024). The required scaling was done based on data from diffusion experiments or based on the combined data from advective displacement and squeezing experiments. The scaling leads in the end to increased uncertainties of the Cl or Br concentrations per accessible porewater, especially for low-clay samples (Wersin et al. 2023). The Br/Cl ratios, in contrast, are not affected by the uncertainty regarding the accessible pore fraction, which is probably very similar for the two ions and thus cancels out in their ratio. Noble gas contents in porewater were obtained by outgassing experiments (Rufer et al. 2024). Helium in particular is characterised by a low abundance in air and air-saturated water, an in-situ geogenic production through radioactive decay of U and Th in the rock matrix as well as a high diffusivity in the porewater. The resulting enrichment of helium in the aquitard porewater relative to (most) groundwaters and its efficient diffusive redistribution makes it a useful tracer to investigate and temporally constrain even younger hydrogeological disturbances.
Diffusive transport of δ2H, δ18O, Cl, and Br across the formations between the Malm and Muschelkalk was modelled using the numerical code PFLOTRAN (www.pflotran.org). Sensitivity calculations including advection were previously undertaken for data from the Benken (BEN) borehole in the ZNO region; they indicated the lack of any signature of an advective component (Gimmi & Waber 2004, Gimmi et al. 2007). Similar sensitivity calculations are being done for the new tracer profiles. Unlike the earlier simulations for data from the BEN (Gimmi et al. 2007) and Schlattingen-1 boreholes (Wersin et al. 2018), porosities and pore diffusion coefficients were varied with depth in the current modelling campaign, based on measured diffusion data (Van Loon et al. 2023) and temperature logs (Section 4.8).
Simulating the detailed evolution of the porewater in the low-permeability sequence since the time of deposition is not considered meaningful because of the collective uncertainties. It is likely that the changing boundary conditions since deposition and the prolonged interaction times have led to profiles with comparably smooth trends with depth, before more recent changes at the currently active boundaries left their signatures in the aquitard. Based on the tectonic and burial history of Northern Switzerland (Section 4.3.5), modelling concentrated on the last ~ 10 Myr, starting by using the δ2H and δ18O data that have comparably small analytical uncertainties. The procedure was as follows: First, approximate initial conditions for these simulations were fixed (constant value for δ2H based on maximum values towards the centre of the profiles, decreasing values with depth for δ18O based on the general trend in the central part, see Section 4.6.2). Then, step changes of the boundary conditions to the different aquifers (when present) to present-day values were applied. The times of these step changes were treated as unknowns; they were fitted so that a good match of the simulations with the overall shape of the profile was obtained. In some cases, two step changes of the boundary condition were considered, in order to account for observed trends. The evolution times derived in this way from the profiles of the water tracers were then used for the subsequent simulations of the profiles of Cl and Br (also setting their constant initial concentrations at the maximum values found in the central part).
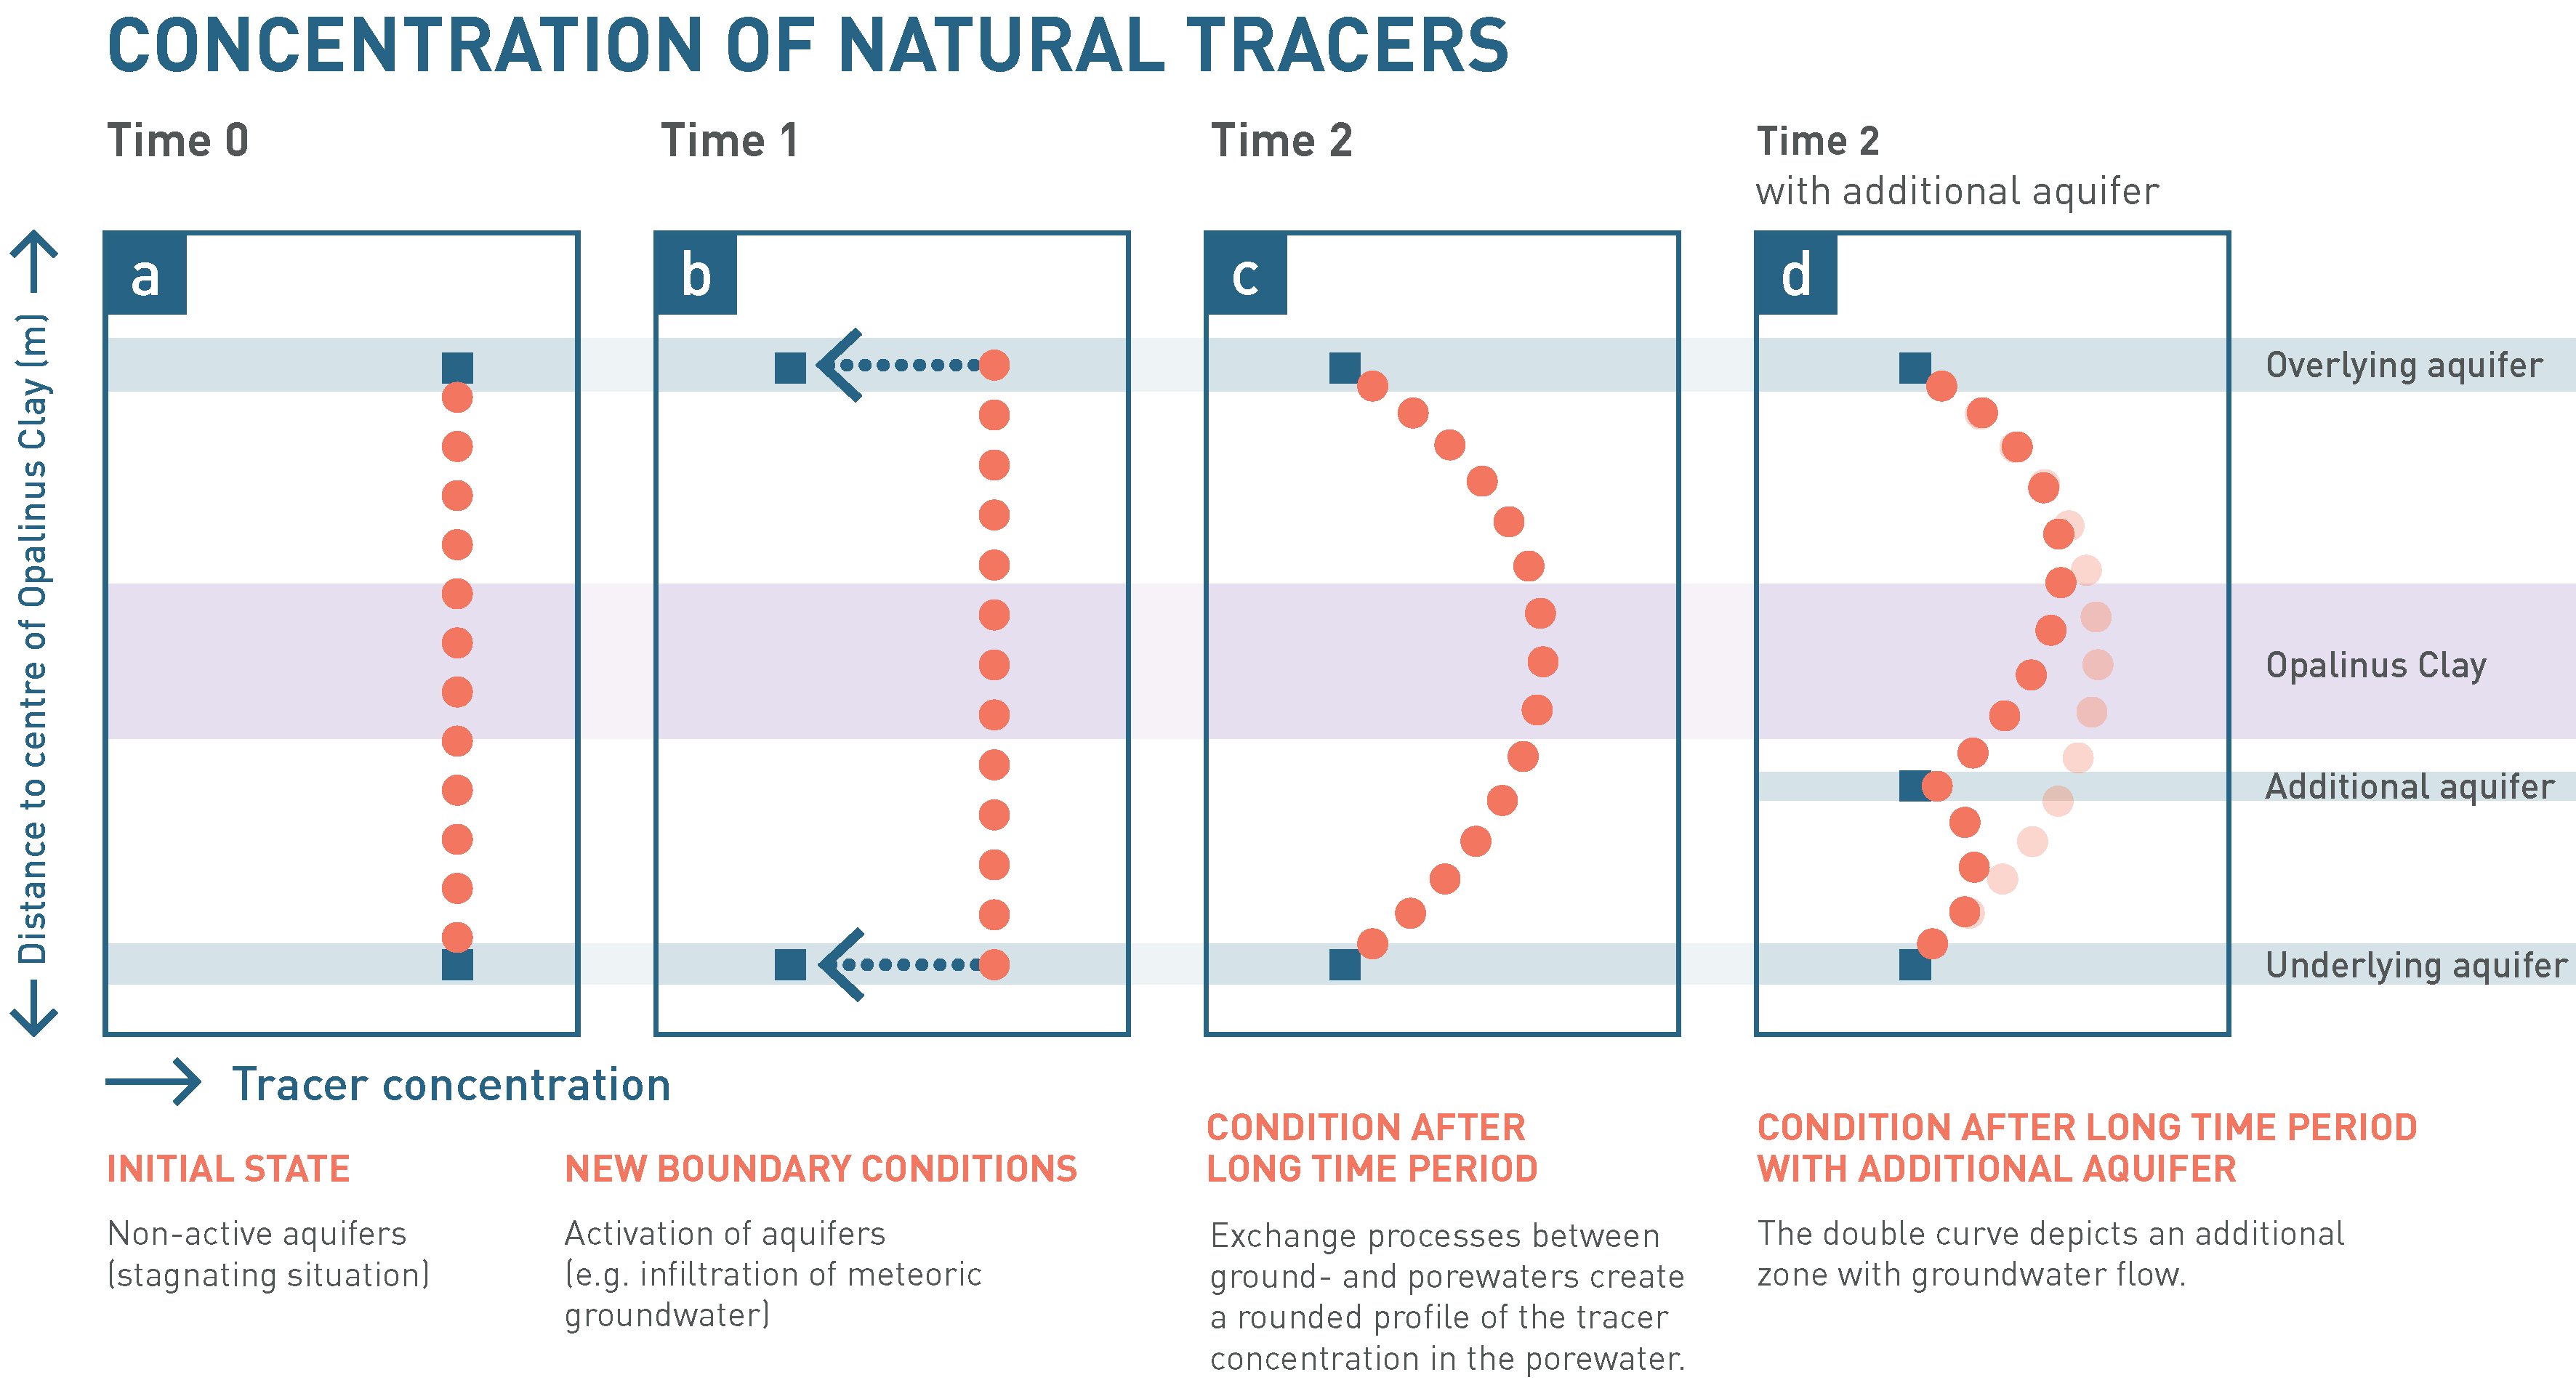
Fig. 4‑118:Illustration of possible evolution of tracer profiles across an aquitard sequence driven by concentration changes in two or more bounding aquifers
Example of a tracer without in-situ production.
General observations
The measured depth profiles of stable isotopes of water (δ2H, δ18O; Gimmi et al. 2024) of the eight sites of the TBO campaign with vertical boreholes together with the BEN borehole are presented in Fig. 4‑119 and Fig. 4‑120. The data show trends which are thought to be indicative of diffusive transport (Gimmi et al. 2007). The scatter and uncertainties are largest in regions of low porosity such as in the Malm limestones, in the heterogeneous «Herrenwis Unit» of the Upper Dogger, or in the anhydrite-bearing zones of the lower part of the Keuper (Bänkerjoch Formation). This is mainly because of experimental difficulties associated with these lithologies (Aschwanden et al. 2024). Scatter is much smaller in clay-mineral-rich units with larger porosity, such as in the Opalinus Clay.
Porewater isotope results for depth intervals of the aquifers generally agree well with those obtained for corresponding groundwater samples (when available). This corroborates the quality of the porewater dataset, as local equilibrium in these intervals can be assumed (diffusion is fast over short distances, and groundwater residence times are generally > 10 kyr; Section 4.5.5). In some intervals with potential aquifers, no groundwater could be sampled during packer tests because the hydraulic conductivity was too low. This was the case in the Malm in BAC1, in the Hauptrogenstein in BOZ1, and in the Keuper in BOZ1, STA3, BUL1 and MAR1.
The profile shapes of δ2H and δ18O can be roughly classified into three types. Type 1, exemplified by those of BAC1, STA3 and BUL1, is characterised by more or less linear profiles down to the lower part of the Keuper. Type 3, the other endmember type, is characterised by clearly curved profiles or profile parts, especially towards the top of the Keuper. This group includes the profiles from BOZ2, STA2, TRU1, and BEN. Type 2 is intermediate, with less pronounced curved profiles towards the top of the Keuper. It includes BOZ1 and MAR1. Note that this classification is based on the profiles of δ2H and δ18O. The profiles of Cl or Br at the latter two sites exhibit more pronounced curvatures compared to the hydrogen and oxygen isotopes of the water.
Interactions with groundwater in aquifers
The distinction of the three profile types is clearly related to the occurrence of flowing groundwater in aquifers. Notably, Keuper groundwater could be sampled in all clearly curved profiles of type 3 (BOZ2, STA2, TRU1 and BEN; see Section 4.5). In contrast, no Keuper groundwater could be sampled in two of the three more or less straight profiles of type 1 (STA3, BUL1). Interestingly, the hydraulic conductivity was also too low to sample groundwater in the Keuper packer interval in the intermediate type 2 profiles (BOZ1, MAR1) with a weak excursion only, while sampling was possible in the type 1 profile of BAC1 showing hardly any curvature towards the Keuper. Type 1 profiles (no excursion towards the Keuper) are found in NL, type 2 and type 3 profiles are found in all study areas, with most strongly curved profiles in the ZNO region (Section 4.5).
The observations regarding the influence of flowing groundwater in the Keuper are consistent with the general understanding of this aquifer. They corroborate the lateral variability in this aquifer mentioned earlier (Gimmi & Waber 2004, Gimmi et al. 2007) when presenting the tracer profiles from the BEN borehole. The variability is related to the regionally changing lithofacies of this formation (more sheetlike water-conducting structures in ZNO, more sandy fluvial channels in NL, probably a dolomitic member in JO; Section 4.5.3.10). As a result, hydraulic conductivity and flow velocity are locally very variable, in particular in NL, leading to the different profile types.
Groundwater in the Malm (or in the Hauptrogenstein in the case of BOZ2) could be sampled in all profiles except BOZ1 and BAC1. This groundwater clearly influenced the shape of the upper part of these profiles (in MAR1, the porewater dataset is limited as only the lowermost part of the Malm was cored). In BAC1, no Malm groundwater could be sampled, but the uppermost porewater values start to decrease again upwards; it is possible that water flow occurred further above. The transmissive zones in the Malm are generally (except for BEN) located above the Schwarzbach Formation (Section 4.5.3.3), that is near to or above the uppermost porewater data point of BAC1.
The profile trends towards the Malm aquifer are mostly relatively flat, less curved than towards the Keuper groundwater. This indicates long-term stable boundary conditions and comparatively long interaction times (as diffusion coefficients are not especially large in these massive limestones; Van Loon et al. 2023), probably longer than those towards the Keuper groundwater. A prominent exception is TRU1, where a possibly more recent change in the Malm groundwater composition may have caused the bending of the upper part of the δ18O (but not δ2H) profile towards higher values. To a lesser degree, STA2 and possibly also STA3 show a similar feature. The curvature towards the Hauptrogenstein groundwater in BOZ2 is relatively steep, indicating a shorter interaction time compared to those for the interaction with the Malm groundwater at the other sites (assuming diffusion coefficients are of similar order). In BAC1, the comparatively flat profile above the Keuper groundwater could indicate a longer interaction time between groundwater and porewater but, combined with the less negative groundwater signature in the Keuper than at other sites, it could also hint at a comparably small volume of interacting groundwater because of slow flow of groundwater and/or a small extent of the transmissive zone (consistent with a zone away from the main water flow, Section 4.5), both leading to stronger alteration of the groundwater signature by exchange with the porewater.
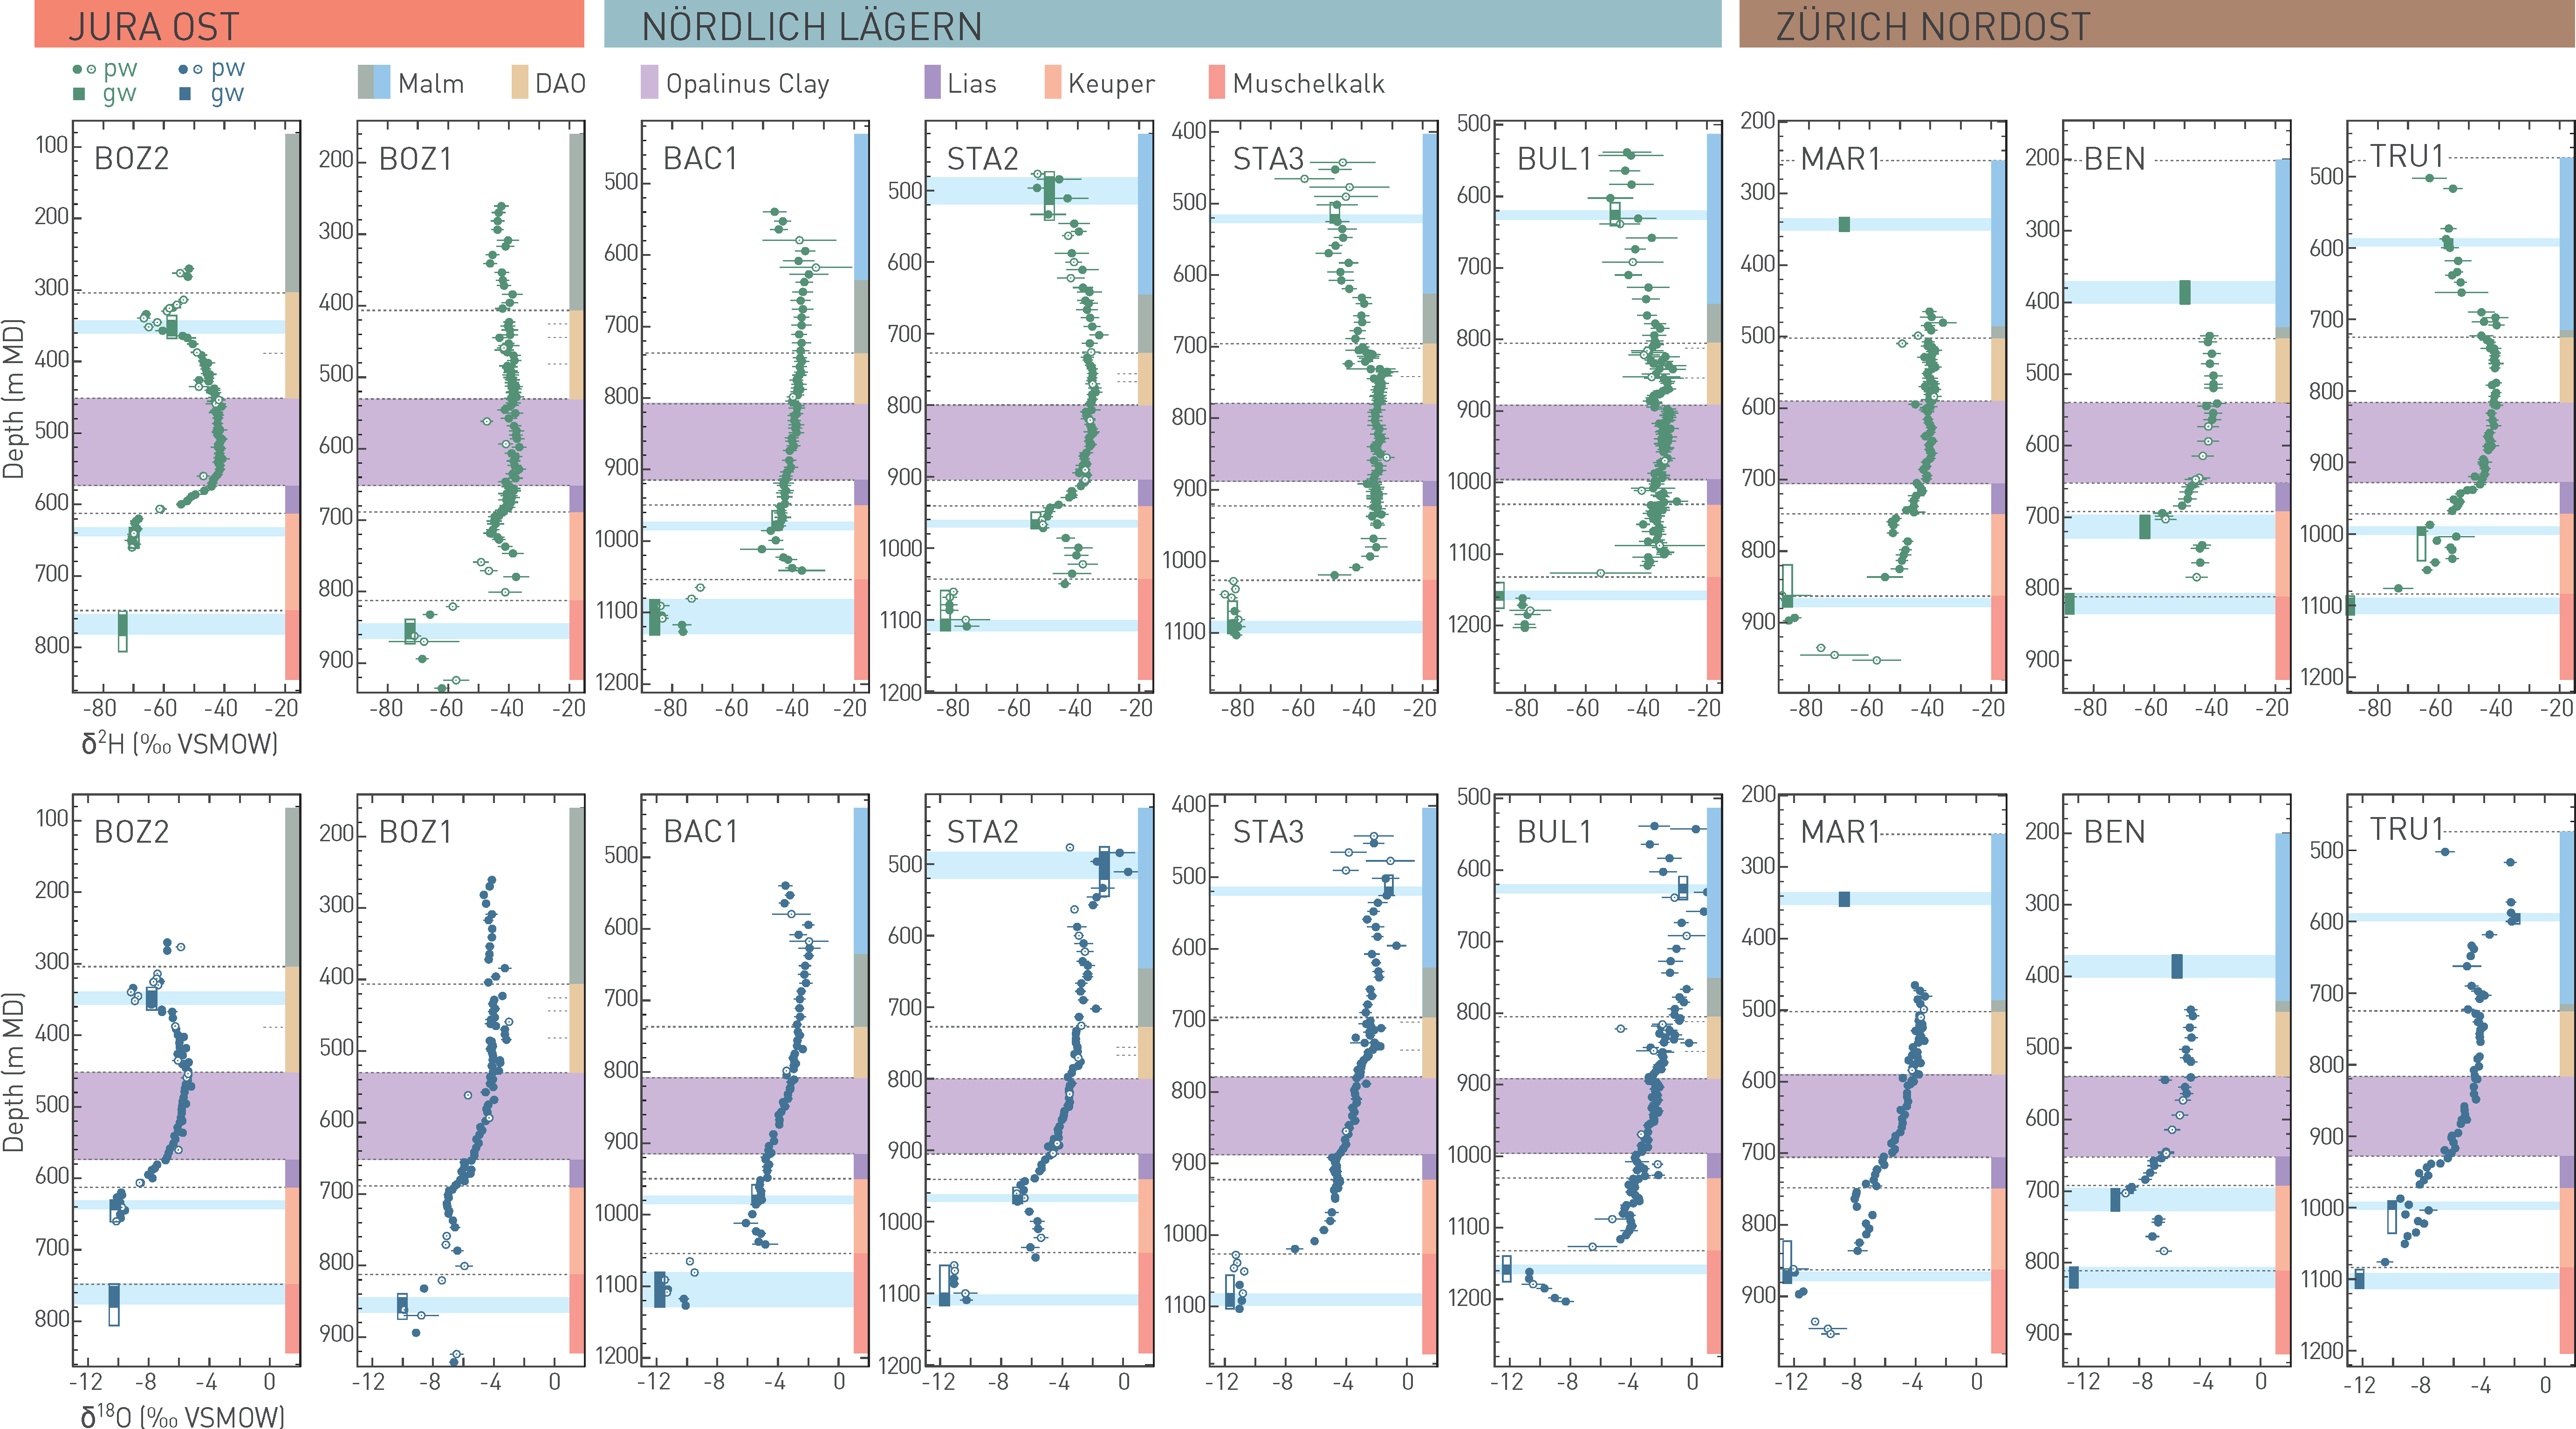
Fig. 4‑119:Profiles of δ2H (top row) and δ18O (bottom row) in porewater (pw) and groundwater (gw) in the different siting regions
Porewater data were derived from diffusive isotope exchange experiments; open symbols: less reliable (potential artefacts or contamination with drilling fluid). Where groundwater could be sampled, open rectangles show packer intervals, closed rectangles and light blue bars most likely inflow zones. DAO: Dogger Group above Opalinus Clay. Light blue background indicates the location of the transmissive zone in the aquifers.
At depth, all profiles are then clearly influenced by groundwater in the Muschelkalk aquifer, where minima of δ2H and δ18O are observed. The steep gradients of porewater δ2H and δ18O towards the most negative values in the Muschelkalk aquifer indicate a comparatively late change of the signature in this aquifer, and/or very low diffusion coefficients in the overlying Bänkerjoch Formation (containing clay-bearing to massive anhydrite beds; Section 4.2.3, Mazurek et al. 2023a).
Relationship between δ2H and δ18O values
The δ2H and δ18O pore- and groundwater data can be compared with respect to their position relative to the Global Meteoric Water Line (GMWL). This provides information regarding the origin of – and interactions between – pore- and groundwaters. The Malm groundwaters plot distinctly to the right of the GMWL (see Fig. 4‑121 with ground- and porewater of four boreholes; see also Fig. 4‑104 in Section 4.5.5.2 for Malm groundwater in all boreholes). This indicates generally long residence times (see discussion in Section 4.5.5). The Hauptrogenstein, Keuper and Muschelkalk groundwaters are located on or near the GMWL (see also Fig. 4‑109, Fig. 4‑110, Fig. 4‑112 and Fig. 4‑121). Keuper waters – except at BAC1 and STA2 – have a modern recharge signature, indicating recharge under climatic conditions similar to recent conditions (e.g. during an interglacial period in the Quaternary). The values slightly to the right of the GMWL in BAC1 and STA2 could indicate a more pronounced interaction with the aquitard porewaters, for instance because of a lower thickness of transmissive zones and/or lower water flow velocity. Muschelkalk waters in JO have a modern recharge signature, while those in NL and ZNO indicate a colder recharge temperature than at present. The porewater values evolve from the Malm or Hauptrogenstein through an intermediate peak in the lower Malm, Dogger Group above Opalinus Clay or the Opalinus Clay with maximum δ2H values (but not maximum δ18O values, Fig. 4‑121) towards the Keuper or Muschelkalk waters. The curved depth trends demonstrate that the porewater data in the aquitard represent a transient situation and not a steady tracer distribution between the bounding aquifers. This also means that the values in the aquitard (and especially in the central part) do not originate from the presently measured groundwater values, but from an earlier evolution.
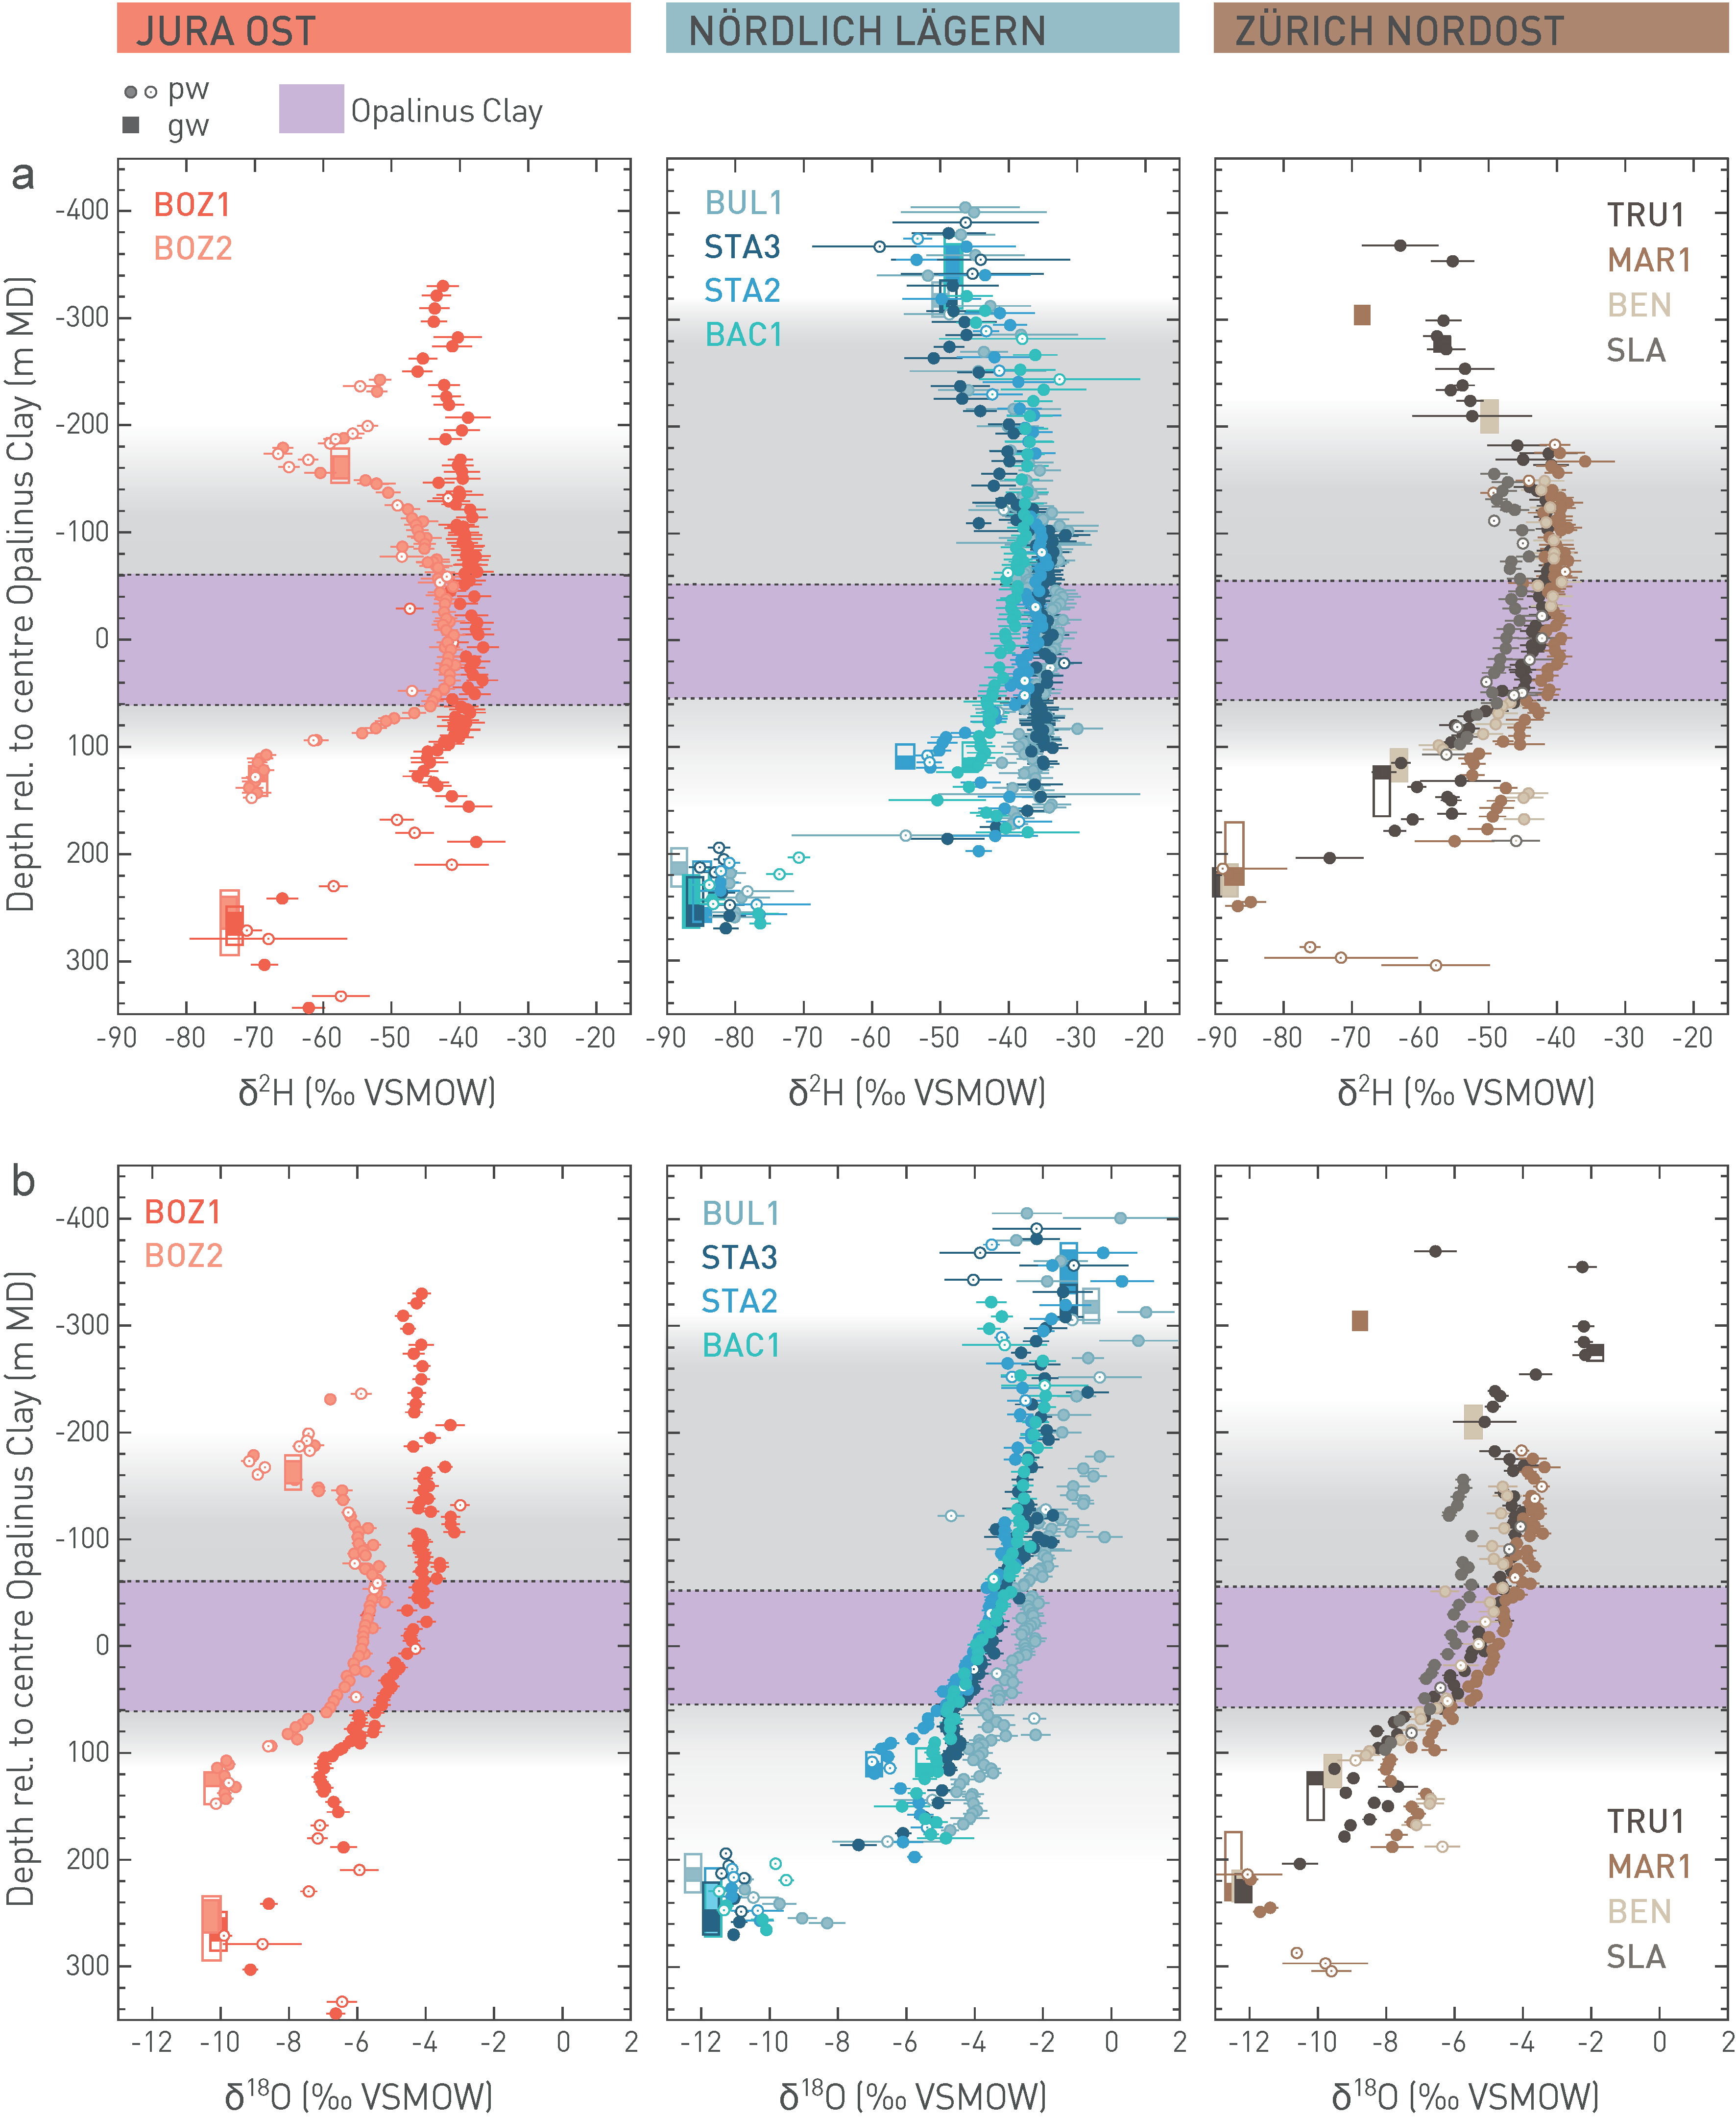
Fig. 4‑120:Comparison of profiles of δ2H (a) and δ18O (b) in porewater (pw) and groundwater (gw) of the different geological siting regions
For the groundwater, open rectangles show packer intervals, closed rectangles most likely inflow zones. Porewater data were derived from diffusive isotope exchange experiments; open symbols denote less reliable data (because of potential artefacts or contamination with drilling fluid). The grey background illustrates in an approximate way the extent of the low-permeability sequence between bounding aquifers in each region.
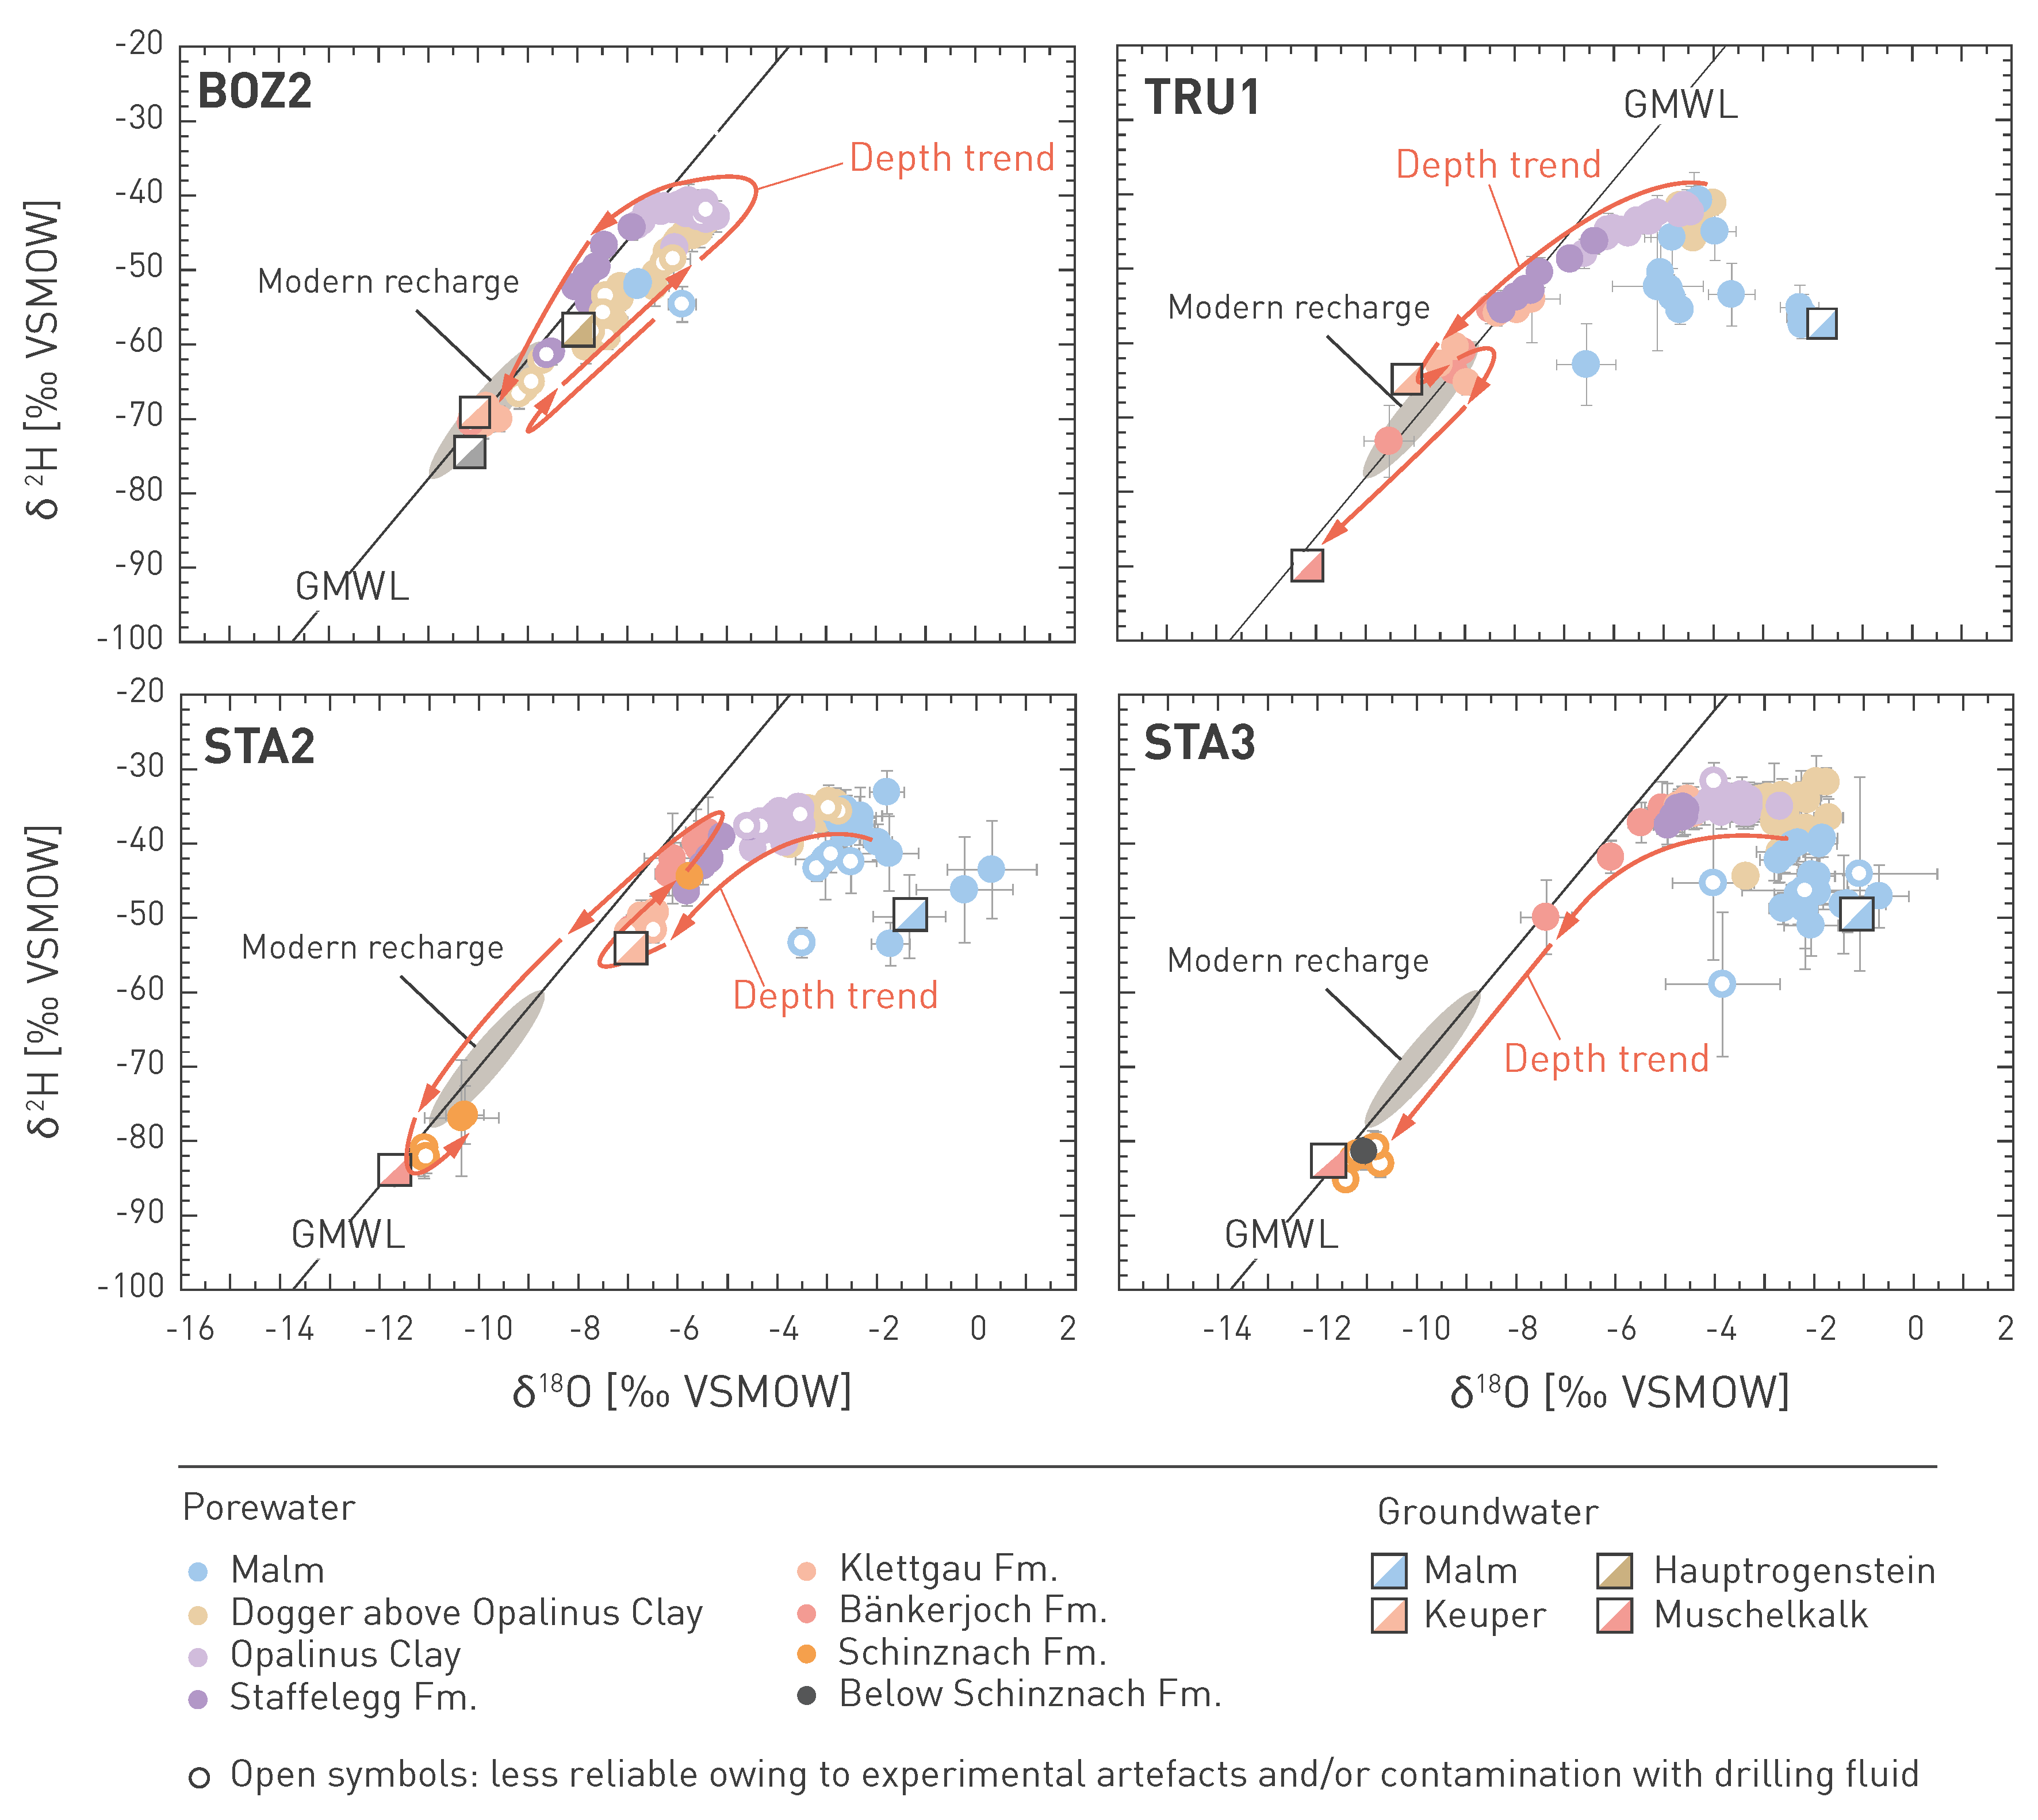
Fig. 4‑121:Signatures of stable water isotopes for BOZ2, STA2 and TRU1 (all influenced by Keuper groundwater) as well as for STA3 (no Keuper groundwater)
Graphs show the evolution from the Malm groundwater (STA2, STA3, TRU1) or the close to meteoric Hauptrogenstein groundwater (BOZ2) towards meteoric, modern recharge groundwater (BOZ2, TRU1) or a mixture of meteoric and older groundwater (STA2) in the Keuper aquifer (if present), and then towards modern recharge groundwater (BOZ2) or colder climate meteoric water (TRU1, STA2, STA3) in the Muschelkalk aquifer.
Qualitative interpretation of the profiles of δ2H and δ18O
The good similarities between the different siting regions in terms of maximum observed δ2H or δ18O values and ‘background’ trends in the central parts become obvious in Fig. 4‑120, as well as the similarities and differences in terms of bounding aquifers. The similarities demonstrate that the isotopic signatures in the different siting regions share a largely common evolution. The area has been continental probably since the Late Cretaceous (except for the short Upper Marine Molasse Group period) and erosion occurred down into the karstified Malm limestones (Section 3.4.2). The contact with meteoric water at the surface during that time led to negative isotope values as observed today in the central parts of the aquitard sequence. The later deposition of the Upper Marine Molasse Group (OMM, which has affected the groundwaters in the Malm aquifer in the NL and ZNO siting regions, see Section 4.5.5.2) probably had only a minor influence on the isotope signatures in the deeper aquitard sequence. The more recent evolution of the profiles was triggered by contact with flowing groundwater in aquifers. The specific evolution is related to the timing of events in the groundwater (such as the activation of flow by erosion in the recharge and/or discharge areas), to the specific local groundwater values in each aquifer, as well as to the thickness of the low-permeability sequence, which is schematically shown as grey background in Fig. 4‑120. The thickness is largest for NL and smallest for JO. This difference, as well as the difference in hydrogeological situation and topography, may partly be responsible for the generally lower isotope values of the profiles in JO compared to those in other areas, and also for their comparatively low Cl contents (Section 4.6.3). However, for instance for BOZ2, the isotope gradients towards the Keuper and Hauptrogenstein are steep, and it appears that the maximum values in the central part are not yet affected by the present-day boundary conditions. This means that the lower values in the central part in BOZ2 and also in BOZ1 compared to those in other profiles cannot be the result of the present-day boundary conditions, but probably evolved at earlier times. This also becomes evident when plotting only the values from the Opalinus Clay in a δ2H – δ18O diagram (Fig. 4‑122). Slightly different trends are seen in the different areas. The data in NL start from values furthest to the right of the GMWL, while the data in JO and in ZNO start at values closer to the GMWL. At the same time, the lowest values in JO and ZNO reach or nearly reach, respectively, the GMWL, while the lowest values in NL still remain to the right of the GMWL. The trend lines for NL and ZNO are also similar, while that for JO has a shallower slope.
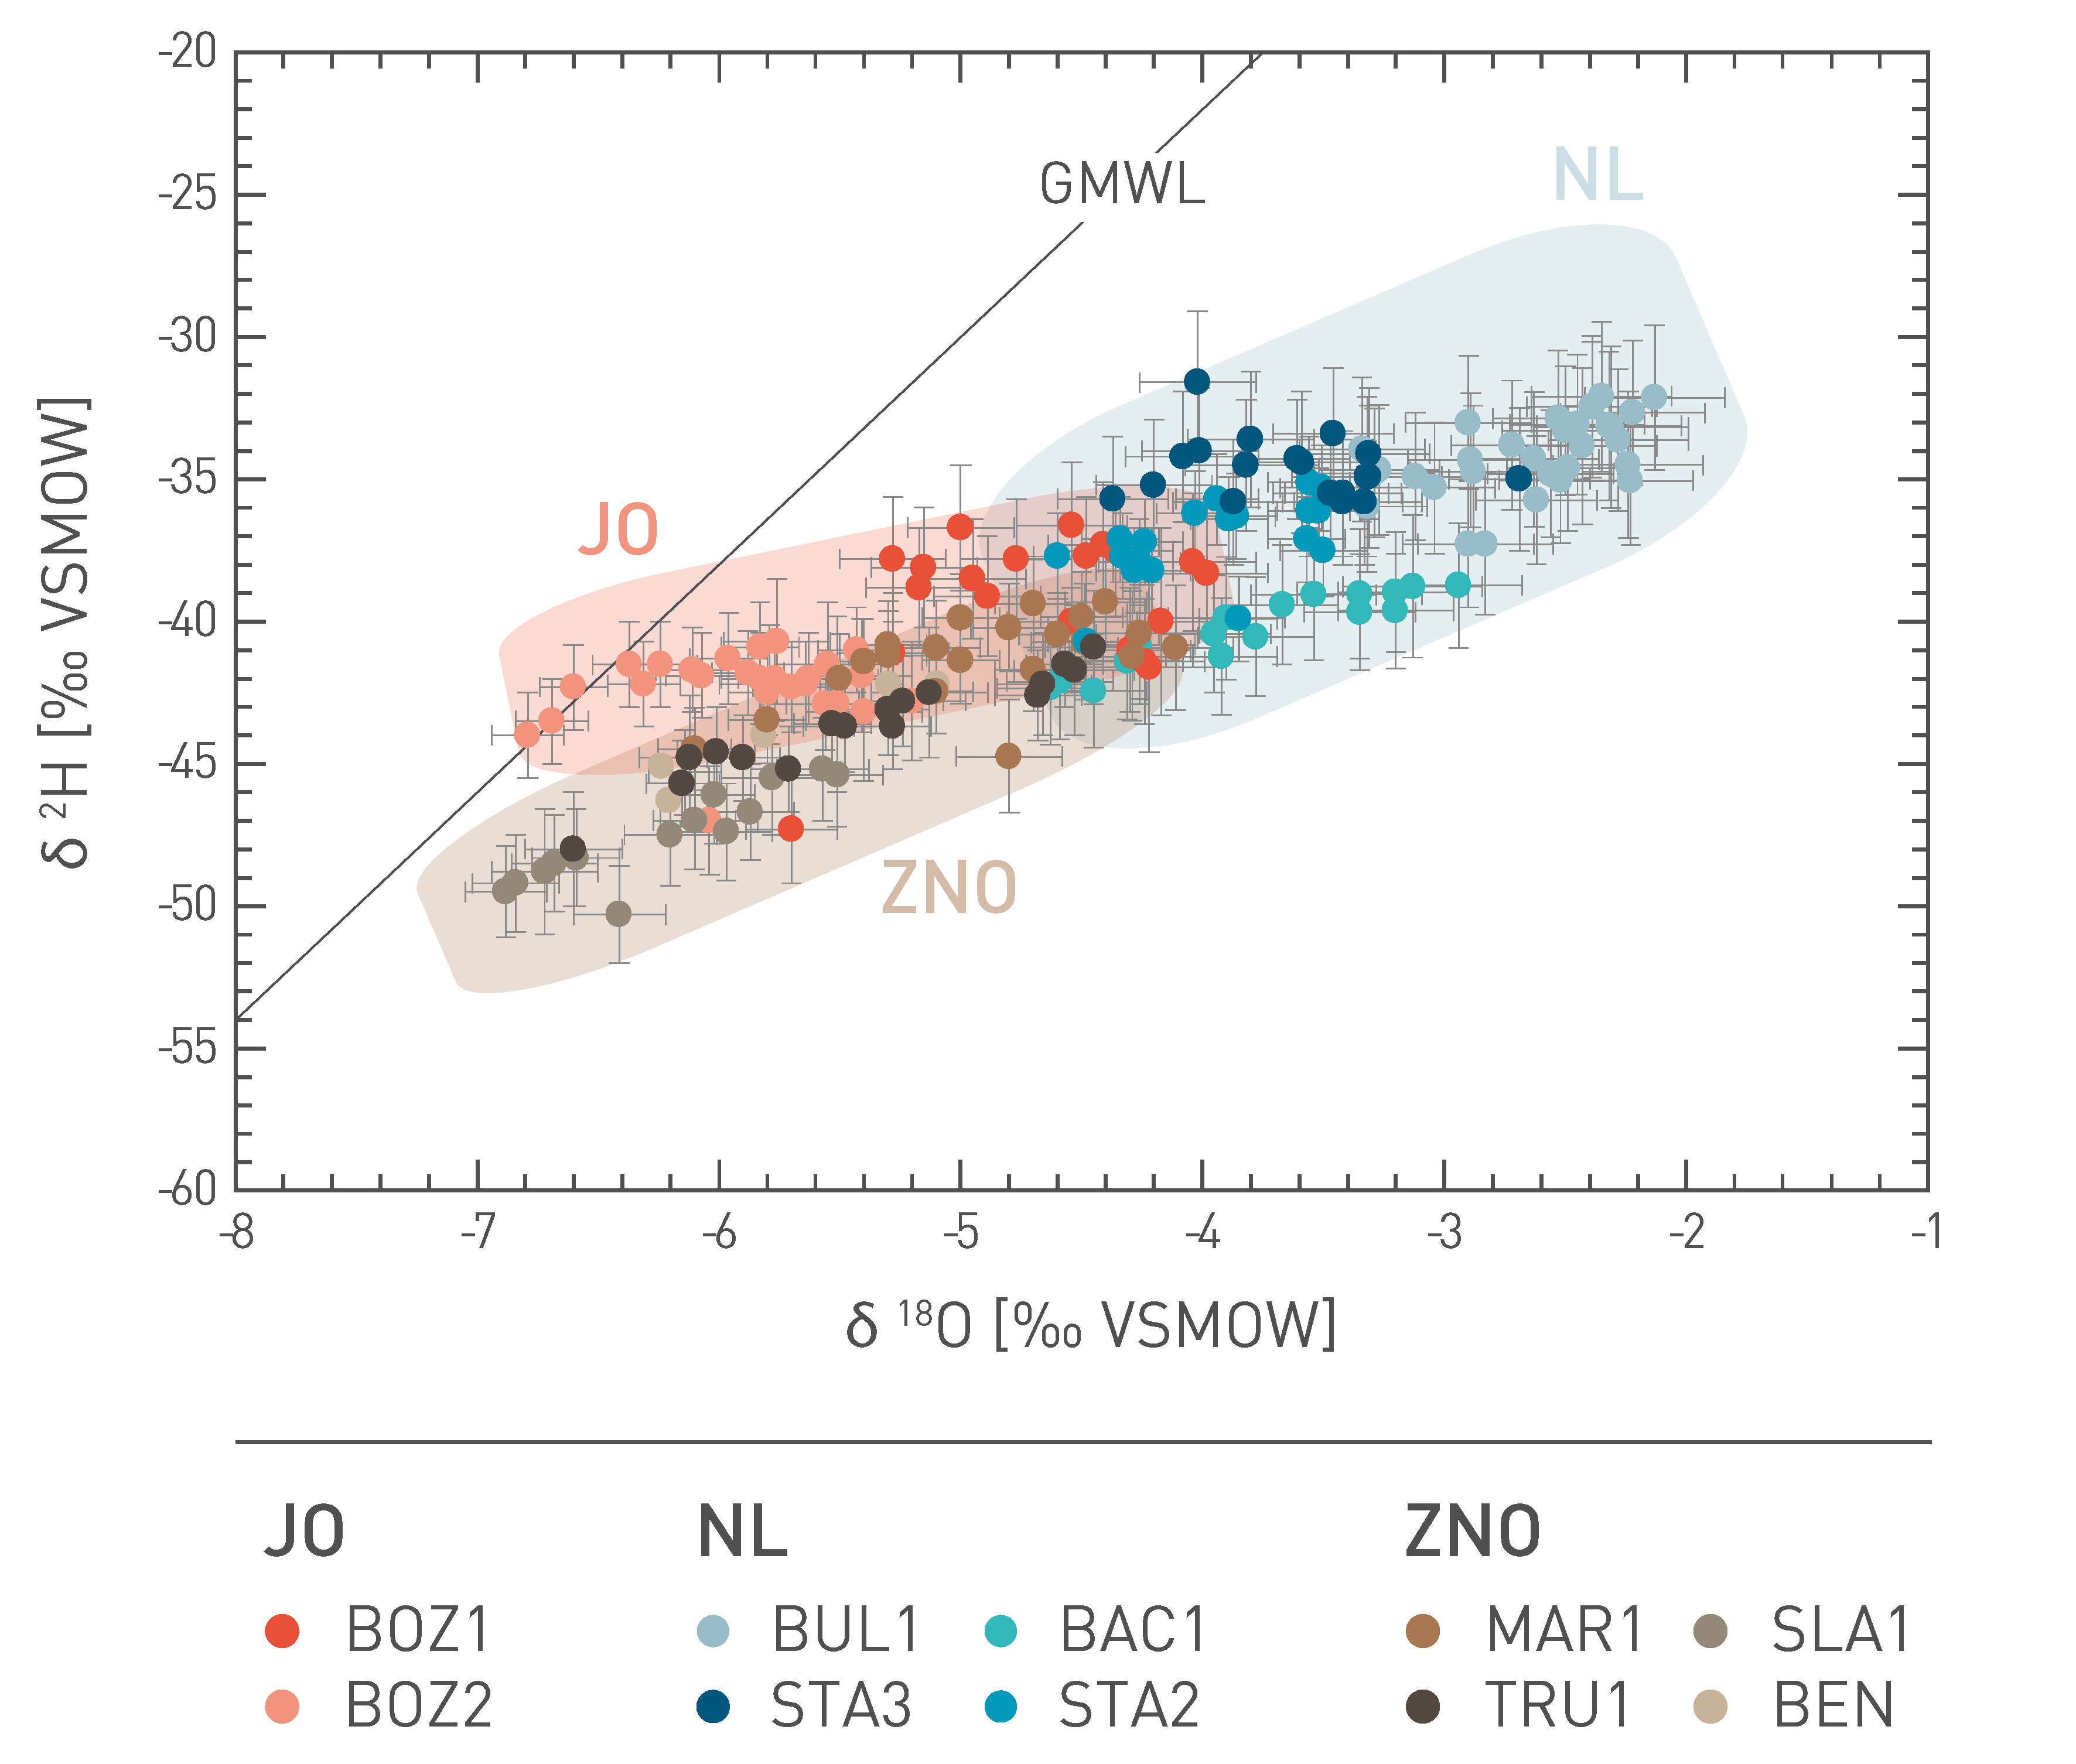
Fig. 4‑122:Signatures of stable isotopes in porewater of the Opalinus Clay in the different siting regions
For groundwater values, see Fig. 4‑121.
Results of modelling of the profiles of δ2H and δ18O
As noted in Section 4.6.1, modelling concentrated on the more recent evolution (the last ~ 10 Myr), starting from constant values with depth (δ2H) or values slightly decreasing with depth (δ18O) that match the trends in the central parts of the profile. The boundary values at each aquifer were then changed in a single step to present-day values (or, in a few cases only, in two steps, to account for observed trends). The times of the changes, that is the evolution times, were fitted for each aquifer in order to obtain a good match between simulations and measurements.
The simulations for pure diffusion match the data well, especially in the part between the Malm or Hauptrogenstein and Keuper aquifer, as shown for four examples in Fig. 4‑123. Evolution times in the range of ~ 1.5 – 3 Myr were obtained for the Malm aquifer in NL and ZNO (when ignoring the second step) or of 0.45 Myr for the Hauptrogenstein aquifer in JO of ~ 0.1 – 0.7 Myr for the Keuper aquifer (where present), and of ~ 0.02 – 0.15 Myr for the Muschelkalk aquifer (Tab. 4‑2).
Tab. 4‑2:Evolution times derived from the modelling of the δ2H and δ18O profiles
* Second step. ** Poorly constrained, no data in lower part.
|
Evolution times [Myr] based on modelling of the δ2H and δ18O profiles | ||||
|---|---|---|---|---|
|
JO BOZ2 |
NL STA2 |
NL STA3 |
ZNO TRU1 |
|
|
Malm aquifer |
1.6 |
2.65 |
2.15 0.15* |
|
|
Hauptrogenstein aquifer |
0.45 |
|||
|
Keuper aquifer |
0.15 |
0.1 |
0.65 |
|
|
Muschelkalk aquifer |
0.05** |
0.08 |
0.15 |
0.02 |
The derived evolution times for all aquifers depend to some degree on the initial conditions selected and the local diffusion coefficients (which are uncertain for the Bänkerjoch Formation above the Muschelkalk). However, in general, the simulations indicate that changes in the Malm occurred at earlier times than those in the Keuper, while the Muschelkalk boundary only changed comparably late in its history to present-day values.
These results are in line with those from earlier simulations for the BEN profile in the ZNO siting region (Gimmi et al. 2007), where diffusive evolution times of ∼ 0.55 Myr were estimated for the signature towards the Keuper. The estimated time for TRU1 in this work is well within the range of 0.2 − 1.5 Myr given by Gimmi et al. (2007) when considering various uncertainties for the less comprehensive dataset at BEN.
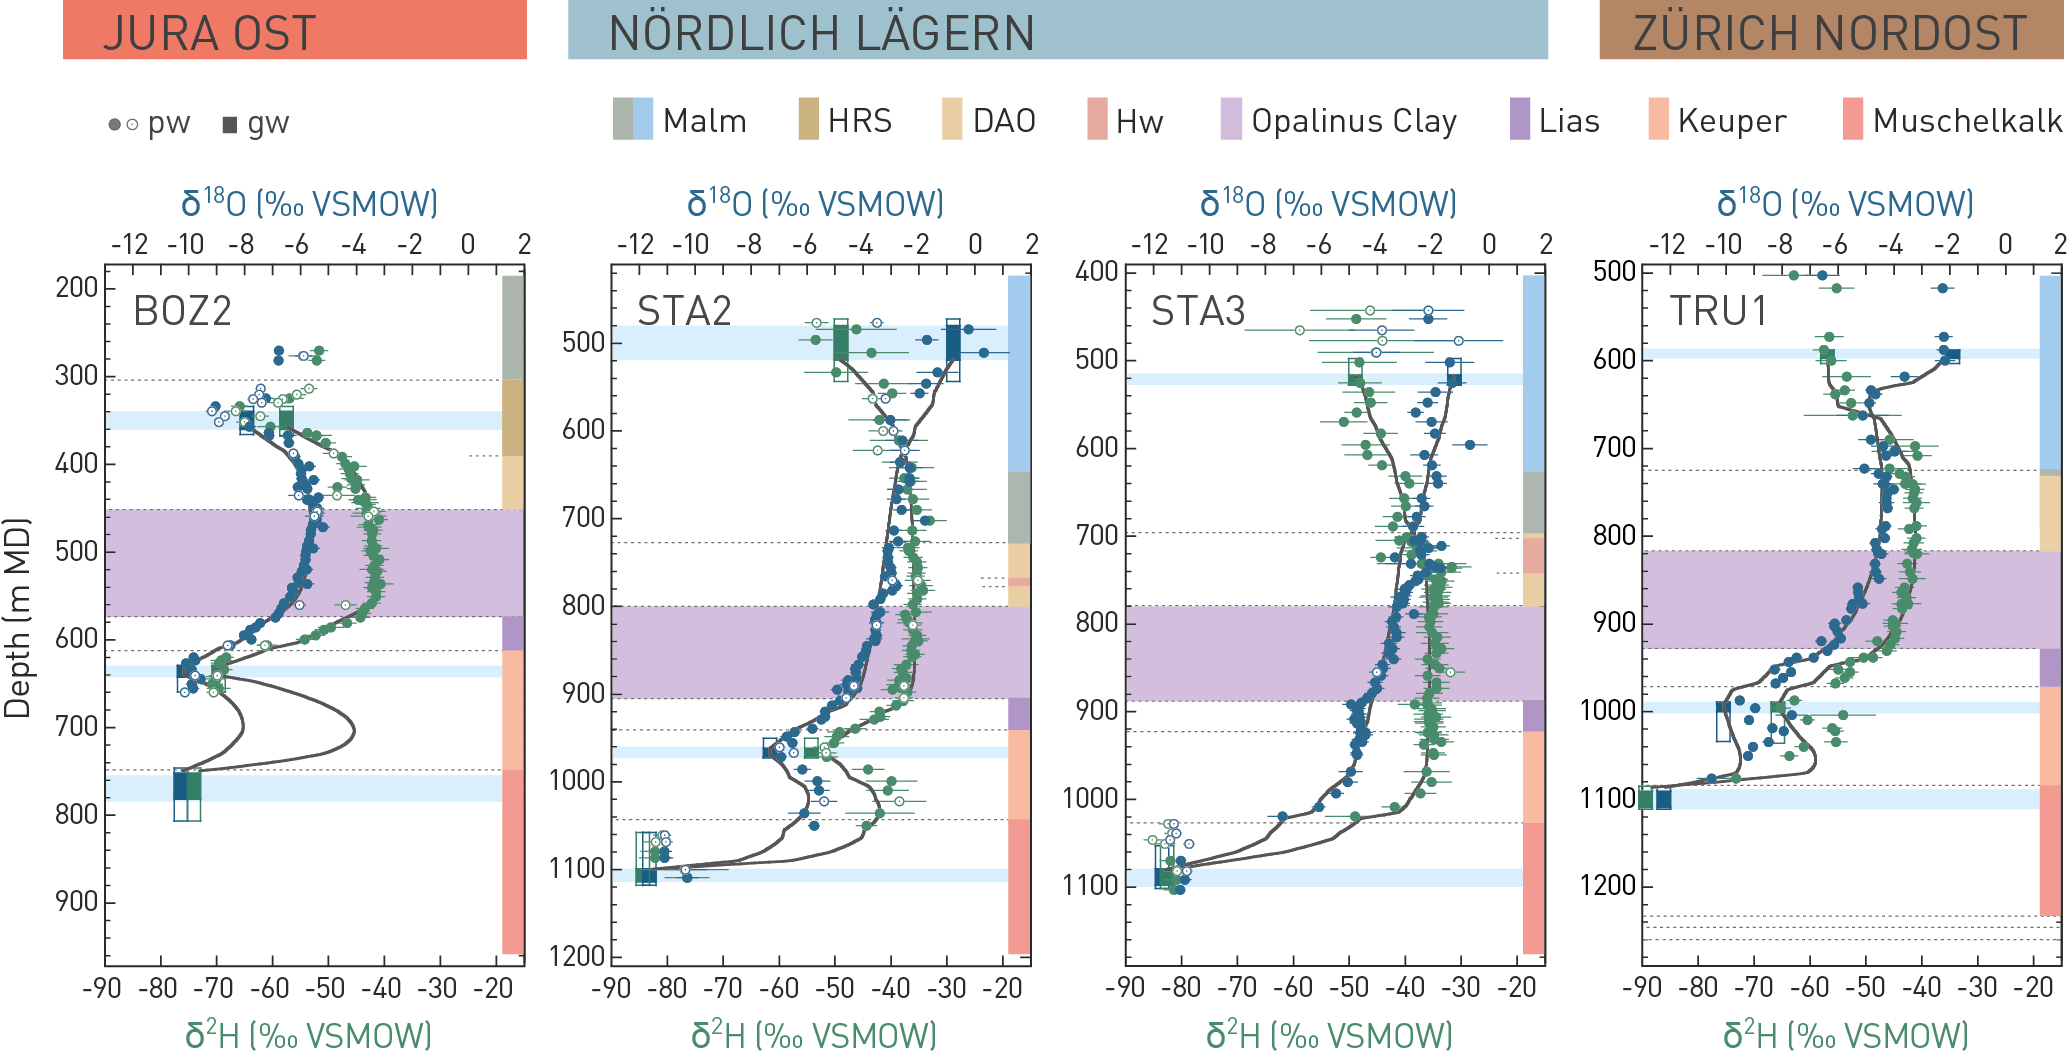
Fig. 4‑123:Comparison of measured and simulated profiles of stable water isotopes in BOZ2, STA2, STA3 and TRU1
The solid black lines show the simulation results. Porewater data were derived from diffusive isotope exchange experiments; open symbols: less reliable (potential artefacts or contamination with drilling fluid). Where groundwater could be sampled, open rectangles show packer intervals, closed rectangles and light blue bars most likely inflow zones. DAO: Dogger Group above Opalinus Clay, HRS: Hauptrogenstein, Hw: «Herrenwis Unit». The evolution times used for the simulations are shown in Tab. 4‑2. Light blue background indicates the location of the transmissive zone in the aquifers.
The example simulations demonstrate typical results for evolution times towards the aquifers. While specific evolution times derived for each profile and each aquifer vary to some degree (also depending on the assumed initial conditions and local diffusion coefficients), the observed general tendencies appear plausible. For instance, the evolution times for the Malm and Keuper signature in ZNO and NL could relate to the creation of new recharge and discharge zones related to the eastward migration of the Aare – Rhine catchment including diversion of the initially eastward flowing Alpenrhein through the Klettgau Valley (Section 3.4.5). Also, the variability of the local Keuper aquifer properties (Section 4.5.3.10) is reflected in the broad range of the evolution times. In addition, the hydraulic situation in the more western JO area is different from that in the more eastern regions, influenced by topography and the tectonic situation.
The tendency of having mostly longer evolution times for the Malm boundary condition, intermediate times for the Keuper boundary condition and shortest time for Muschelkalk appears also to be plausible. The short times derived for the Muschelkalk boundary condition could be related to the diversion of the Wutach River (Section 3.5) and infiltration of glacial melt water. However, the large uncertainty in the diffusion coefficients for the lowest part of the profile (anhydrite with possibly very low diffusion coefficients) propagates into large uncertainties for the Muschelkalk evolution times.
Profiles of chloride in porewater
The chloride profiles across the sampled Jurassic and Triassic sequence of the eight TBO boreholes and the BEN borehole are depicted in Fig. 4‑124. Looking at the Opalinus Clay porewaters, which generally reflect maximum Cl concentrations and salinities, the lowest Cl concentrations occur in JO boreholes (~ 2 - 5 g/L; Fig. 4‑124), whereas the Cl concentrations from the NL and ZNO boreholes are higher, in the range of ~ 7 - 14 g/L, the highest concentrations being encountered in the BUL1 borehole. In general, porewater data from aqueous leachates scaled with the anion accessibility derived from diffusion data are shown, as well as data directly obtained from advective displacement (AD) or from squeezing (SQ). A scaling of aqueous leachate data based on the anion accessibility from the combined AD and SQ data leads to almost identical results for the profiles in the NL and ZNO regions. For the JO profiles with the lowest salinities, however, the different scalings lead to different results, and both derived porewater datasets are shown (only for the Opalinus Clay, as no AD and SQ data are available for the other formations).
All boreholes exhibit similar Cl patterns, in particular across the Jurassic sequence, where continuous profiles, albeit with some scatter, are manifested. This is in line with the corresponding δ18O and δ2H profiles. Further similar features of the chloride profiles and the stable water isotope profiles are evident:
-
Porewater concentrations mostly agree well with those of groundwaters in the same area.
-
Profile shapes are influenced to different degrees by the Keuper aquifer in a similar way to those of the stable water isotopes where three types were defined (see above). Thus, BUL1, STA3 and BAC1 profiles show flat shapes down to the lower part of the Keuper (type 1). Conversely, BOZ1, BOZ2, TRU1, MAR1 and BEN show a clear curvature towards the Keuper aquifer (type 3). STA2 lies somewhere in between, displaying less prominent curvature towards the Keuper aquifer (type 2).
The Cl profiles also indicate some dissimilar features and generally more scatter with regard to the profiles of stable water isotopes, mostly related to the uncertainties in the anion-accessible porosity fraction, as also exemplified by the different scalings shown for JO (see Section 5.4.2). Furthermore, relative errors in water contents increase in low-porosity rocks, in particular for lithologies with small-scale heterogeneity. For example, some variation is manifested in the upper confining units which are both vertically and laterally more heterogeneous than the Opalinus Clay. In this context, the «Herrenwis Unit» in the middle Dogger Group, a low porosity limestone with strong variations in clay-mineral content, is noteworthy. Considerable scatter is also seen in the lithologically heterogeneous Triassic rocks in the lower part of the sequence. Despite this scatter, different trends between the lower Keuper and the Muschelkalk aquifer can be discerned (e.g. decreasing with depth in BAC1, STA2 and STA3, increasing in BOZ1 and BUL1).
The different trends in the lower Triassic section are related to compositional differences in the Muschelkalk aquifer, in which Cl concentrations in the groundwater vary between < 1 g/L to 86 g/L. In contrast, variations in stable water isotope signals are small in this aquifer, all suggesting a strong meteoric component. Available porewater data below the Muschelkalk aquifer point to high Cl concentrations. Locally, the Cl data in the lower part of the Triassic and groundwater data in the Muschelkalk aquifer indicate the influence of halite dissolution from the laterally heterogeneous salt layer in the Zeglingen Formation. This is corroborated by the Br/Cl ratios (see below) and the δ37Cl data (Wersin et al. 2023).
Overall, the ensemble of Cl profiles suggests diffusive exchange between the porewaters and the bounding aquifers in a similar way as indicated for the data of stable water isotopes.
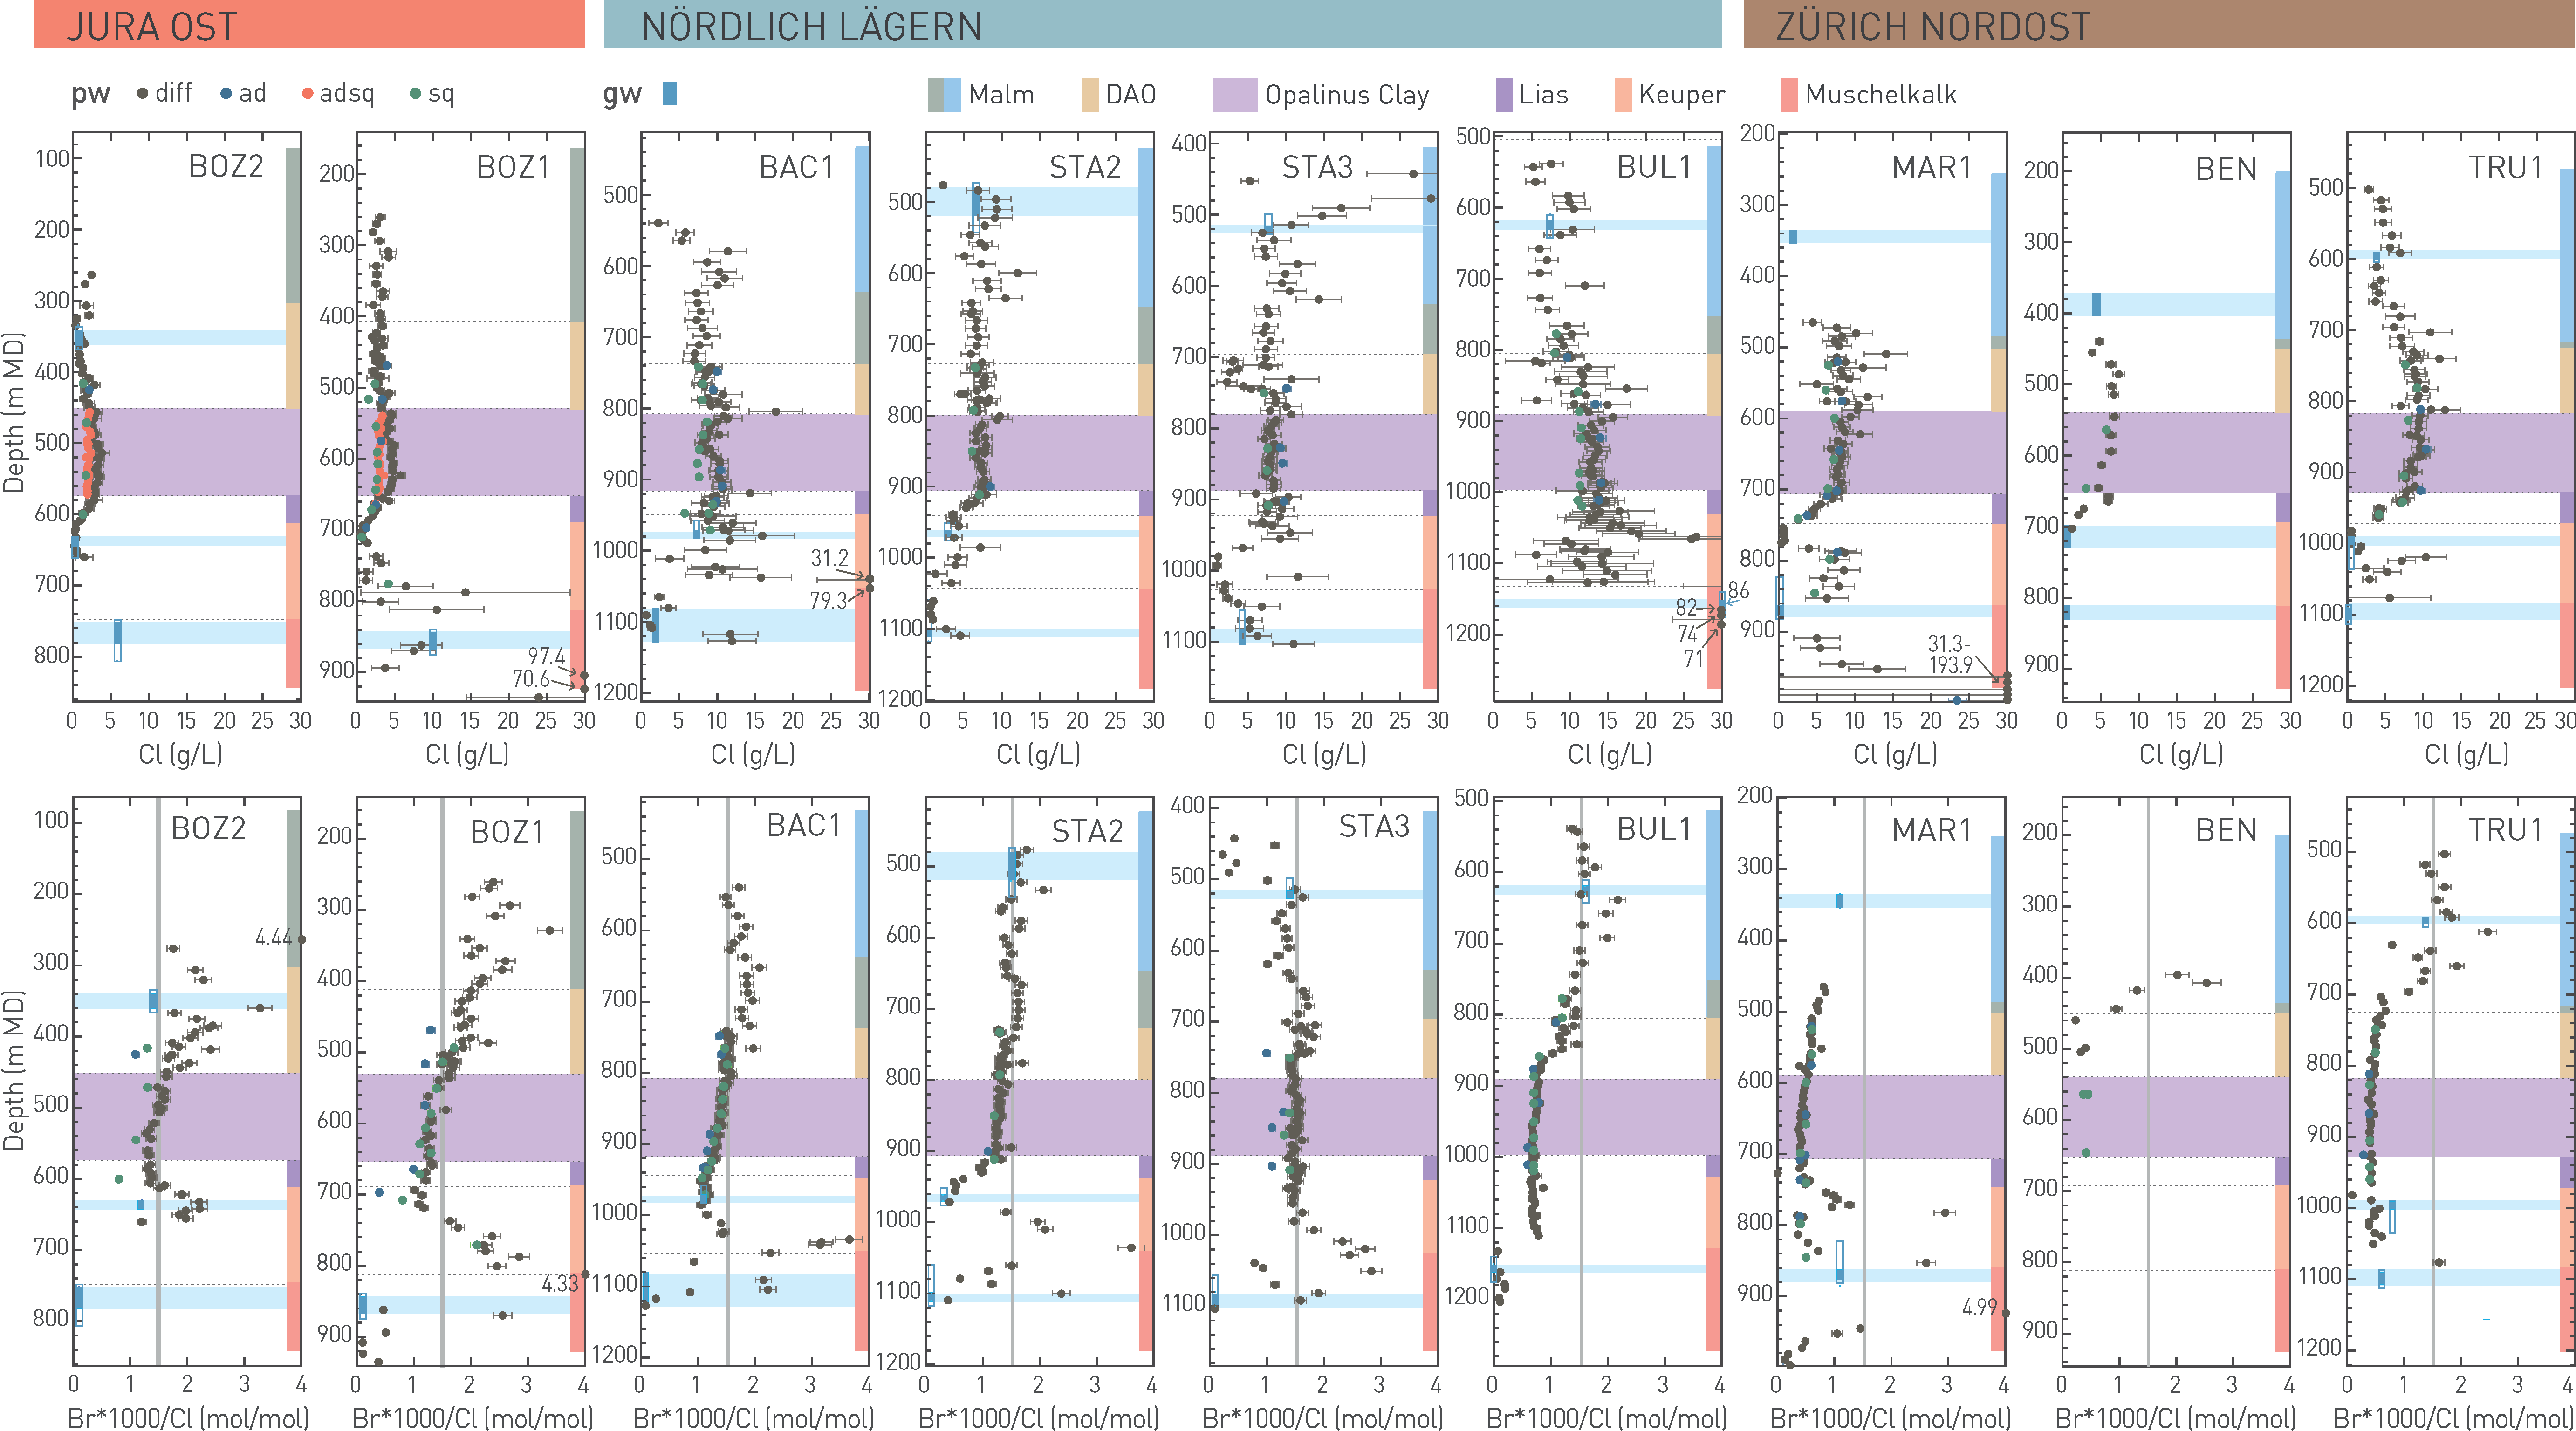
Fig. 4‑124:Profiles of chloride (top row) and Br/Cl ratios (bottom row; grey vertical lines indicate seawater ratio) in porewater of the different boreholes
Porewater data were derived from aqueous leaching and scaled based on diffusion data (diff) or based on advective displacement and squeezing data (adsq), or directly from advective displacement (ad) or squeezing (sq) data. For groundwater samples (gw), open rectangles show packer intervals, closed rectangles and light blue bars most likely inflow zones. DAO: Dogger Group above Opalinus Clay. Light blue background indicates location of transmissive zone in the aquifers.
Profiles of Br/Cl ratio of porewater
The Br/Cl profiles (Fig. 4‑124) are much smoother and uncertainty ranges are smaller when compared to the single anion profiles. This is because the ratios can be calculated directly from the aqueous extraction data without scaling to the accessible pore space.
The agreement between porewater and adjacent groundwater is again evident in most cases, but in some cases differences occur. Moreover, the continuity of the Br/Cl ratios across the largest part of the profiles, and particularly in the Opalinus Clay, is manifested. This further supports the very similar diffusion behaviour of Cl and Br in the porewater. Regional differences in the Br/Cl ratios can be observed and a trend with Br/Cl ratios in the Opalinus Clay and confining units close to that of seawater in the west (comprising BOZ2, BOZ1, BAC1, STA2, STA3), shifting to ratios below seawater in the east (BUL1, MAR1, TRU1) can be inferred.
The top part of the sequence in the Malm displays Br/Cl ratios close to seawater for all boreholes except for MAR1 (note, however, that for this borehole no porewater data are available in most of the Malm section).
In the centre of the low-permeability sequence, the porewater of the Lias and Dogger (sometimes extending into the upper Keuper) shows a trend from marine Br/Cl ratios in the western boreholes to lower values in the east. There is no obvious correlation with the chloride concentration, the occurrence of halite in the lower Muschelkalk or the hydrogeological conditions in the adjacent aquifers. The Br/Cl ratio in the Opalinus Clay probably reflects conditions that predate the current hydrogeochemical environment in the embedding aquifers. The scatter of the data in this section is conspicuously low, and the Br/Cl values are constant or show only limited trends with depth.
In the lower part of the sequence, there is a tendency towards lower Br/Cl ratios but strong variations with positive anomalies in the anhydrite-bearing Bänkerjoch Formation (BOZ1, BAC1, STA2, STA3, MAR1) can be seen in most of the boreholes, sometimes reaching the upper Schinznach Formation (STA3, MAR1). Br/Cl ratios in the Muschelkalk aquifer are well below the marine value, further supporting the influence of dissolution of halite from the underlying Zeglingen Formation (which has a very low Br/Cl ratio, see Kharaka & Hanor (2014). This interpretation is supported by δ37Cl data, which yielded similar values for the underlying halite in the three siting regions where analyses were performed (BOZ1, STA3, BUL1). Note that mixing of the groundwater by dilute meteoric water hardly affects the Br/Cl signals.
Results of modelling
The modelling of the Cl profiles followed the same procedure as that described above for the water tracers, also with initial conditions set to approximately maximum values in the central parts of the profiles. However, the evolution times were not fitted. Instead, the times derived from the stable water isotopes were directly applied for Cl and Br/Cl. For BOZ2, the two different variants of the porewater data were considered: the one with the anion accessibility based on diffusion data, the other based on advective displacement and squeezing data. The differences between the two sets simply represent the uncertainty of the porewater data.
The modelling of four example profiles is presented in Fig. 4‑125. Approximate matches with the data could be obtained in all cases for transport by diffusion. For BOZ2, however, the timing had to be slightly adjusted compared to that obtained from the water isotopes when modelling the Cl and Br/Cl porewater contents based on the accessibilities obtained from diffusion experiments. Also, compared to the stable isotopes of water, considerable deviations between data and simulations appear in some zones, especially where Cl or Br show a large scatter (e.g. drop to low Cl concentrations in the «Herrenwis Unit» or above the Muschelkalk for STA3). As these zones
do not show any peculiarities, either in the stable isotope values or in the Br/Cl ratios or in the He values, it is believed that these deviations are mainly related to an increased uncertainty in the porosity and the anion-accessible fraction for the more heterogeneous limestone formations, and/or because of contributions from fluid inclusions.
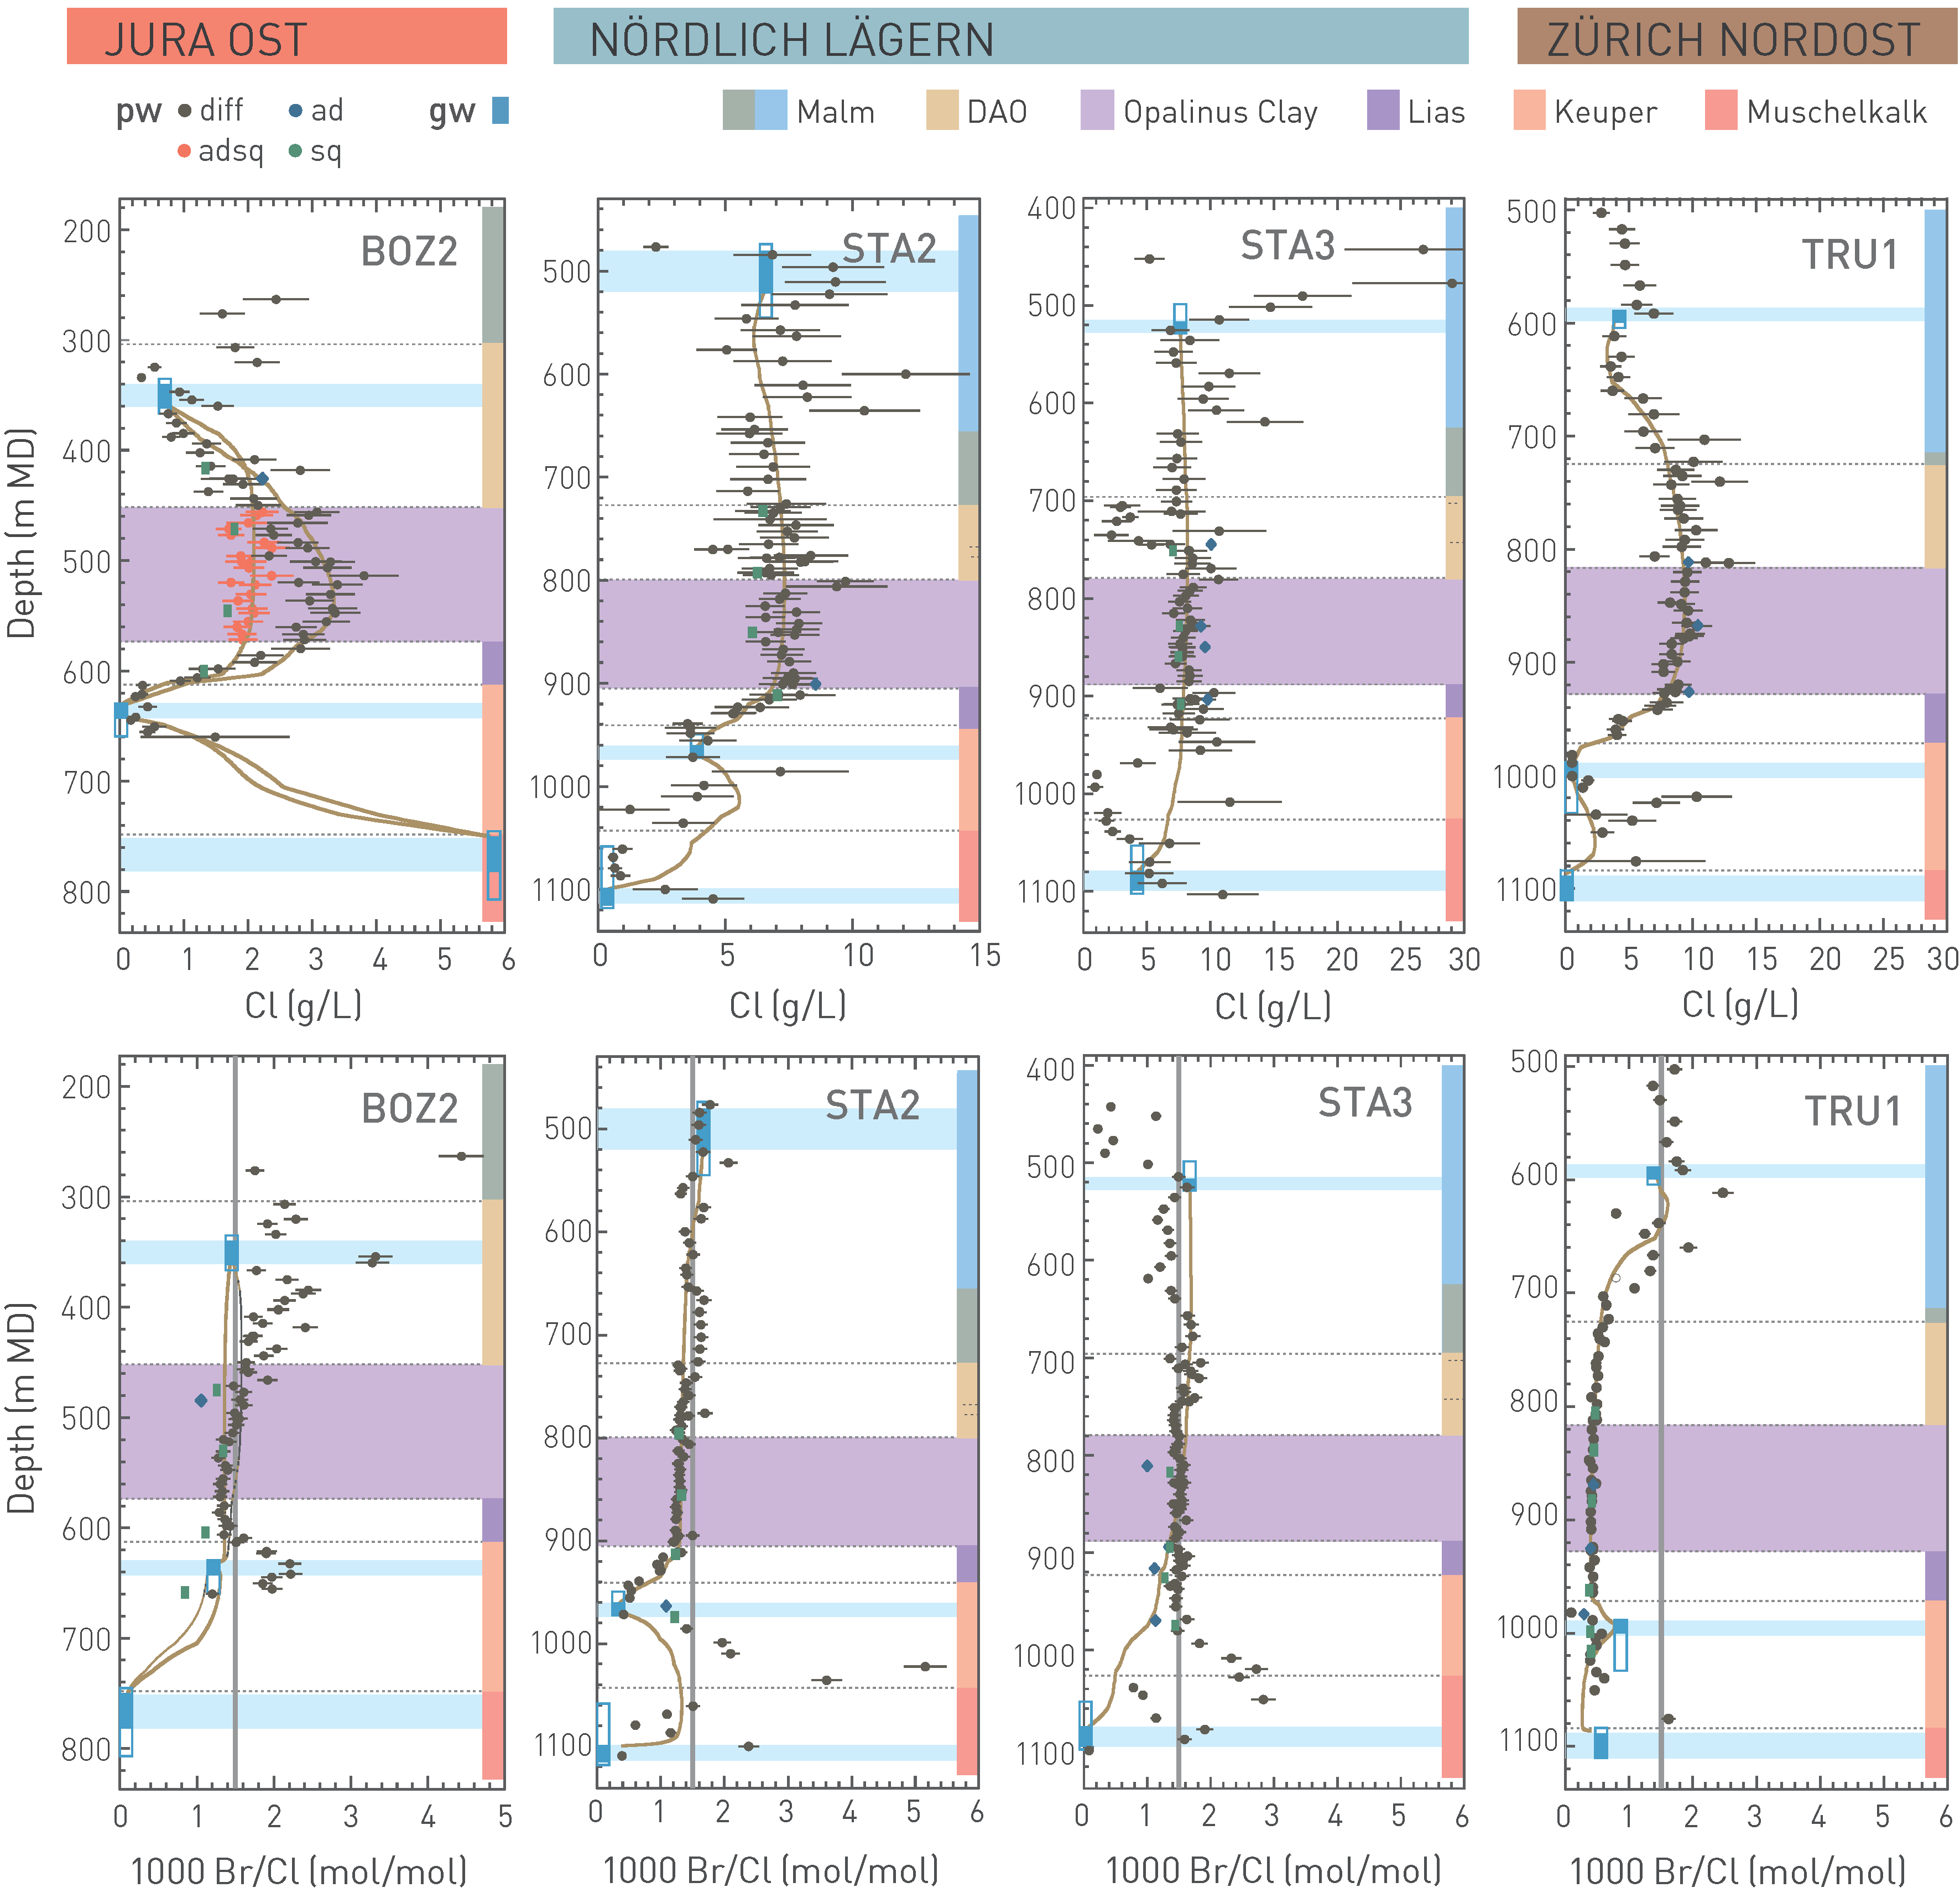
Fig. 4‑125:Comparison of measured and simulated profiles of chloride (top row) and of the Br/Cl ratio (bottom row; grey vertical lines indicate seawater ratio) at BOZ2, STA2, STA3 and TRU1
The brown solid lines show the simulation results (data and simulations for two variants for BOZ2, see text). Porewater (pw) data were derived from aqueous leaching and scaled based on diffusion data (diff) or based on advective displacement and squeezing data (adsq), or directly from advective displacement (ad) or squeezing (sq) data. Where groundwater (gw) could be sampled, open rectangles show packer intervals, closed rectangles and light blue bars most likely inflow zones. DAO: Dogger Group above Opalinus Clay. Light blue background indicates the location of the transmissive zone in the aquifers.
Two boreholes per siting region were investigated for dissolved helium in porewater (JO: BOZ1, BOZ2; NL: BUL1, STA3; ZNO: TRU1, MAR1), with the results summarised here and discussed in more detail in Rufer et al. (2024).
General observations
The porewater helium profiles from all six boreholes (Fig. 4‑126) show generally smooth trends above the Muschelkalk – interpreted to be indicative of diffusive transport – and are largely comparable in shape to the δ2H and δ18O profiles (Section 4.6.2). Over the low-permeability, clay‑mineral-rich Lias – Dogger sequence, all profiles show similar concentrations of 4He in the porewater and predominantly flat profile shapes with depth. As an exception, the BOZ2 profile is influenced in the upper part of this section by the groundwater of the Hauptrogenstein aquifer. 3He/4He porewater signatures from the central aquitard section show similarly flat profiles with well ‑constrained isotope ratios. It is noteworthy that helium shows no discernible anomalies in the «Herrenwis Unit» of NL.
Interactions with groundwaters
All helium profiles extend to the Keuper aquifer (Klettgau Formation) or beyond. In two boreholes, transmissivities in the Klettgau Formation were sufficiently large to sample groundwater (BOZ2, TRU1; see Fig. 4‑85, Section 4.5.3.10). The associated 4He porewater profiles show a curvature from higher 4He concentrations in the hanging units towards lower values close to the groundwater, indicating helium transport in this direction in the past. In BOZ2, the groundwater has a lower 4He concentration compared to the adjacent porewater, supporting such an interpretation also at the present time. In TRU1, however, the presently measured 4He groundwater value exceeds that of the adjacent porewater by an order of magnitude, contrasting the observed curvature of the 4He porewater profile (see discussion below). The 3He/4He ratios of the porewater in both boreholes match the 3He/4He ratios of the Keuper groundwater. In the other four boreholes, hydraulic transmissivities in the Klettgau Formation were too low to obtain groundwater samples, and the 4He porewater profiles show no apparent anomalies. The 3He/4He profiles of the BOZ1 and MAR1 porewaters, however, do show clearly higher values for samples measured from the Klettgau Formation, indicating some exchange with an isotopically different groundwater, consistent with the observations of the δ2H and δ18O profiles (Section 4.6.2). In NL, while a singular slightly higher porewater 3He/4He value was obtained from the Keuper in the BUL1 borehole, the limited spatial resolution of these profiles in both boreholes does not allow a conclusive interpretation.
Towards the top, all helium profiles (except MAR1) extend to the depth of the Malm (NL, ZNO) or Hauptrogenstein (JO) aquifer, and groundwater samples could be obtained in all investigated boreholes except BOZ1. The small anomalies in the porewater 4He value of BOZ2 towards the lower groundwater value, and the lack of any excursion in the 3He/4He porewater profile, suggests an exchange between the porewater and – in terms of helium – an isotopically similar but lower concentration groundwater. No excursion is seen in BOZ1. In NL and ZNO, the STA3 and TRU1 porewaters tend to higher 4He concentrations and lower 3He/4He values with shallower depth. In both boreholes, the 3He/4He value of the Malm groundwater is similar (~ 1 × 10⁻⁷) and matches the porewater 3He/4He values at the same depth. This congruence, however, contrasts with the mismatch between the 4He concentrations of the groundwater and adjacent porewater, with the groundwater concentration being roughly 10 times lower in STA3 and 10 times higher in TRU1 compared to the porewater. These observations could indicate a past exchange with a groundwater having a 3He/4He signature similar to the present-day groundwater but a different 4He concentration (higher in STA3 and lower in TRU1). As the 3He/4He ratio of the groundwater is lower than that of the porewater in the central aquitard, the helium of the groundwater must originate from a source with a more radiogenic (lower 3He/4He ratio) signature than the sampled aquitard lithologies (see discussion below). BUL1 shows somewhat divergent profile shapes, with porewater 4He concentrations being elevated in the lower Malm, but then returning to values near identical to the groundwater in the aquifer. The 3He/4He ratio of the present-day Malm groundwater in BUL1 is also lower than that of the central aquitard porewater, again indicating an external source for (at least a part of) the helium in the groundwater. The porewater 3He/4He ratios, however, increase from the central aquitard towards the groundwater, suggesting past exchange with a groundwater characterised by a higher 3He/4He ratio. A former contact with a groundwater with an admixture of air-saturated water (3He/4He of 1.38 × 10⁻⁶; Kipfer et al. 2002) or with helium derived from a subcontinental mantle-like reservoir (3He/4He of 6.5 – 8.5 × 10‑6, Ballentine et al. 2002 and references therein) would allow this observed 3He/4He increase to be explained.
At depth, five of the porewater helium profiles intersect the Muschelkalk aquifer, from which groundwater with roughly one (JO), two (NL) and three (ZNO) orders of magnitude lower 4He concentration compared to the respective central aquitard porewater was encountered. These five contiguous 4He porewater profiles show steep gradients towards very low values close to the groundwater depth, generally the lowest observed porewater 4He concentrations in the profiles. These gradients mimic the δ2H profiles (Section 4.6.2) and are also similarly observable in the anion tracer profiles (Section 4.6.3). They are interpreted to be the result of either very low porosity (Mazurek et al. 2023a) and diffusivity in the anhydrite-rich lithologies in that interval and/or of recent changes in the groundwater composition. The corresponding porewater 3He/4He profiles from the central aquitard to the Muschelkalk groundwater are mostly flat and roughly match the 3He/4He ratio of the groundwater in NL and ZNO. In JO, the basal part of the porewater 3He/4He profiles trend to lower values towards the Muschelkalk, again matching the groundwater signature in the aquifer.
Discrepancy between 4He concentrations in the Keuper and Malm groundwater and adjacent porewater in the TRU1 borehole
In this borehole, the sampled 4He concentration in the Malm and Keuper groundwater exceeds that of the adjacent porewater samples by roughly a factor of 10, while the corresponding 3He/4He signatures are nearly identical. With the groundwater 4He concentration also exceeding the values of the central aquitard porewater, it cannot be explained by diffusive flux from the aquitard into the groundwater as the sole source but requires a helium source external to the investigated aquitard/aquifer sequence. A pervasive helium flux from depth across the Mesozoic sediment stack can be excluded because it would contradict the observed low 4He concentrations in the aquitard porewaters and – at least recently – be restricted by the Muschelkalk groundwater with its very low 4He concentration. In consequence, this external helium must be supplied to the different groundwater levels in a manner that largely bypasses the aquitard lithologies between them. Based on the groundwater chemistry, gas and isotope compositions of the groundwaters in the Malm, Keuper and Muschelkalk aquifers, a possible pathway along a steep tectonic fault crosscutting the entire sediment stack, such as the NW-SE-trending Neuhausen Fault situated at distance of less than 1 km to the northeast was suggested (Rufer et al. 2024) and references therein). In such a scenario, potential source lithologies for such a radiogenic (low 3He/4He) helium component could be the units of the Permo-Carboniferous Trough and the crystalline basement.
Enrichment of the different groundwaters by such a helium component migrating upwards along a fault would, to a large extent, be controlled by the relation between the ascending helium flux and the groundwater flux. Groundwaters with low flow rates and high residence times would become more enriched in helium and have their 3He/4He signature lowered compared to faster flowing aquifers with lower residence times. With the groundwater residence times gradually increasing from the Muschelkalk to the Keuper and Malm aquifers in ZNO, the observed groundwater concentrations and 3He/4He signatures qualitatively fit with this conceptual enrichment model.
In-situ production of 4He, minimum accumulation times and diffusion timescales of the observed porewater helium system
The calculated in-situ production of radiogenic 4He shows broadly comparable ranges over most of the stratigraphic stack (Rufer et al. 2024), with notably lower production rates (compared to the more clay-mineral-rich central aquitard) in the evaporitic strata of the Bänkerjoch and the Zeglingen Formation and in the dolostones and limestones of the Schinznach Formation and the Malm. In the carbonate dominated lithologies, these lower 4He production rates are compensated by higher release coefficients of helium from the rock matrix to the porewater. As a result, 4He accumulation rates in e.g. the limestones of the «Herrenwis Unit» in NL are similar to those in more clay-rich units (Rufer et al. 2024). Over all three regions, both, 4He in-situ production and accumulation rates of specific lithotypes are very comparable between boreholes and correspond well to established data such as e.g. from the BEN borehole (Rufer & Waber 2015) or the compilation given in Waber & Traber (2022).
Minimum necessary accumulation times for the presently observed 4He in the porewater over the stratigraphic column clearly indicate that in-situ produced helium is diffusively redistributed along the concentration gradient, generally from the units of the Lias – Dogger via the over- and underlying units into the bounding groundwaters with significantly lower 4He concentrations (at least in the past for Malm and Keuper in TRU1). As such, the porewater of all these aquifer/ aquitard units must be considered an open system with respect to diffusive transport of dissolved gas.
Based on calculated diffusion timescales, helium would require at least 1.8 Myr to diffuse from the centre of the Opalinus Clay to the under- or overlying aquifers (assuming an aquitard thickness of 300 m). These values are much shorter than the minimum 4He porewater accumulation times in the Opalinus Clay (~ 115 Myr in JO, ~ 149 Myr in NL and ZNO; Rufer et al. 2024). This, together with the observed flat 4He and 3He/4He porewater profiles in the clay-mineral-rich central sections, implies that the porewater helium inventory across the Lias – Dogger aquitard is the result of a long-term evolution of the porewater system driven by He production and diffusion towards the boundaries.
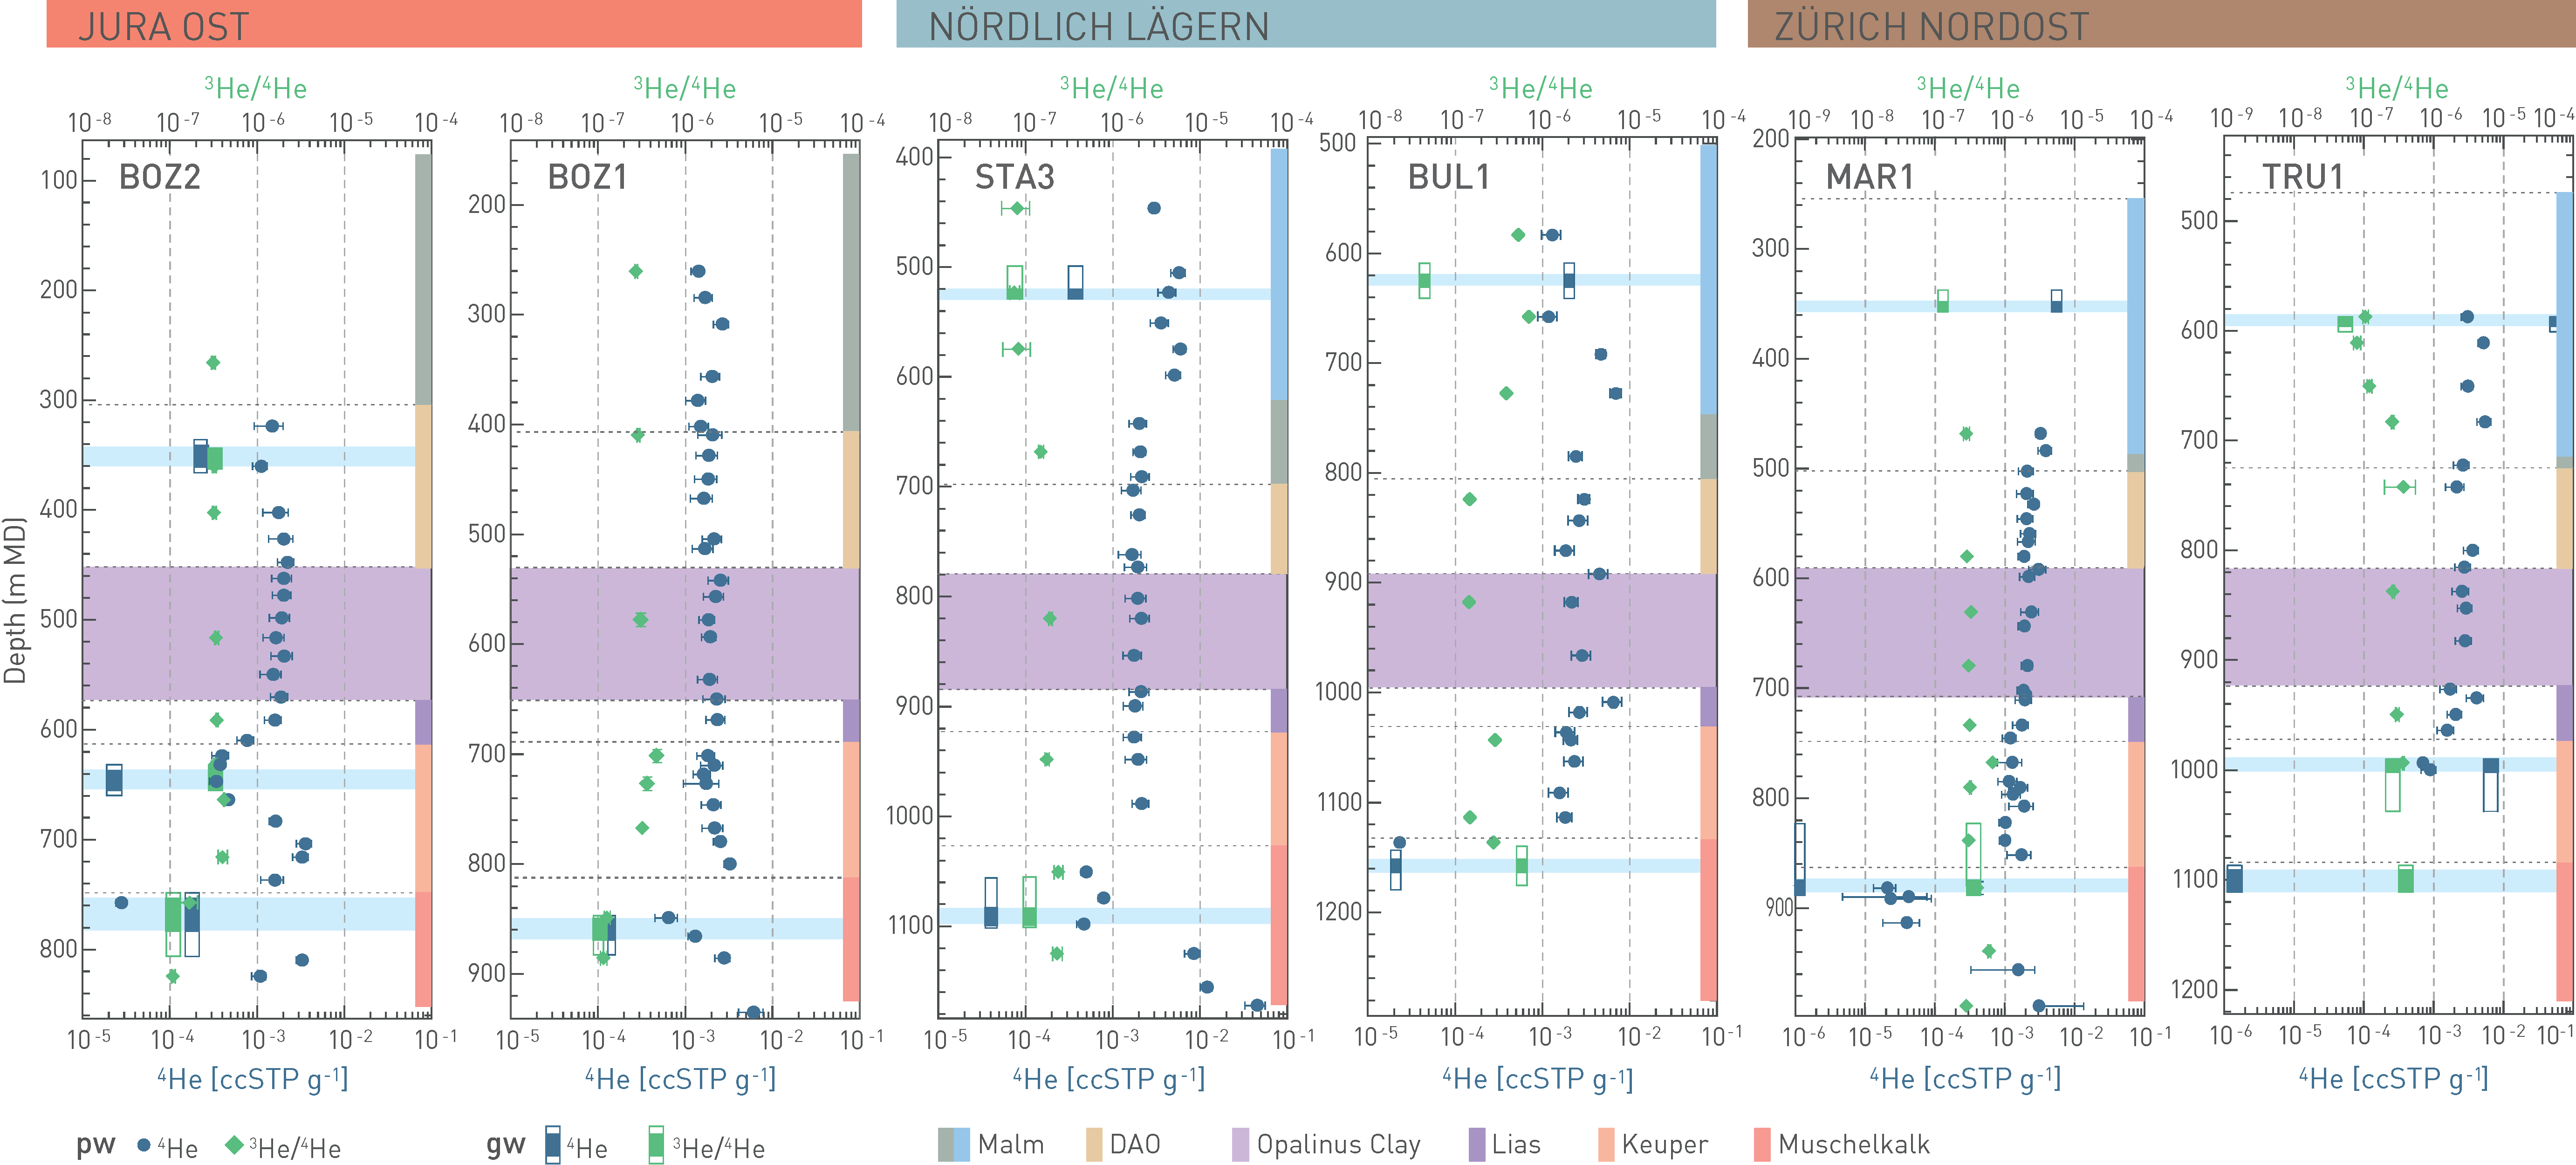
Fig. 4‑126:Profiles of 4He concentrations and 3He/4He ratios in porewater (pw) and groundwater (gw) for the BOZ2 and BOZ1 (JO), STA3 and BUL1 (NL) and MAR1 and TRU1 (ZNO) boreholes
For the groundwater, open rectangles show packer intervals, closed rectangles most likely inflow zones. DAO: Dogger Group above Opalinus Clay.
Tracer profiles support the hydrogeological understanding of the siting regions
The profiles of each of the different natural tracers (stable isotopes of the water molecule, Cl and Br/Cl, 4He and 3He/4He) across the Mesozoic sequence are influenced by various processes that occurred in the past. Most of the profiles are clearly affected by the tracer signatures in an overlying aquifer (the Malm aquifer in ZNO/NL and the Hauptrogenstein aquifer in JO) and in an underlying aquifer in the Muschelkalk, while only some profiles are also clearly affected by the signatures in an aquifer in the upper part of the Keuper (Fig. 4‑119, Fig. 4‑124, Fig. 4‑126). This is consistent with the general hydrogeological knowledge in this area, where the aquifers in the Malm and in the Muschelkalk are known to be of regional extent, while the aquifer in the Keuper has a more local and more variable character (Section 4.5.3.10).
In most cases where porewater tracer profile shapes suggest the presence of an active aquifer and flowing groundwater, the latter could be sampled. In two cases (BOZ1, MAR1), the profile shapes of the stable water isotopes and the anions (and to a limited extent 3He/4He) indicate the presence of an active aquifer in the Keuper, but no groundwater could be sampled from packer tests because of too low hydraulic conductivity. In two other profiles (STA3, BUL1) where no groundwater could be sampled in the Keuper, no signature of flowing groundwater is seen. These comparisons demonstrate the additional value of profiles of natural tracers in characterising the hydraulic situation.
Characteristic shapes of the tracer profiles are strongly influenced by the Pleistocene landscape evolution
The groundwaters in the aquifers generally show signatures more evolved towards freshwater, that is lower δ values of stable water isotopes and lower Cl concentrations compared to the ‘older’ porewater signatures in the aquitards between the aquifers. This results in curved profiles of these tracers towards the aquifers, with signatures of the tracers in the porewater approaching those of the groundwater of the aquifers. The noble gas tracer 4He shows partly similar curved profiles to the water tracer δ2H, from higher values in the centre of the aquitard towards lower values in the aquifers.
It is evident, and corroborated by tracer transport simulations, that the more recent evolution (mostly during the Pleistocene) of the profiles occurred due to changes in the boundary conditions in the aquifers, probably following the creation of new recharge and discharge zones for the aquifers. 1D transport simulations were performed for all profiles, taking into account the vertical heterogeneity in porosities and diffusion coefficients according to measured data. The simulations demonstrate that diffusive transport dominated the development of the tracer profiles, and they provide estimates for evolution times of the profiles towards the Keuper aquifer, and partly also for evolution times towards the Malm or Hauptrogenstein and the Muschelkalk aquifers. Specific evolution times derived for each profile and each aquifer vary to some degree (also depending on the initial conditions and parameters used) but are mostly consistent between the water and anion tracers. The trends in evolution times for the different aquifers (longer times of ~ 1.6 – 2.6 Myr for the Malm boundary, intermediate times of ~ 0.7 – 0.1 Myr for the Keuper boundary, shortest times of ~ 0.15 – 0.02 Myr for the Muschelkalk boundary) appear also plausible. These times are broadly in line with the overall understanding of the hydrogeological system and the landscape evolution. The eastward migration of the drainage divide between Rhine and Danube, including the diversion of the Alpenrhein to the west through the Klettgau Valley and a stepwise lowering of the baselevel (Sections 3.5, 6.4.1.2), probably affected recharge and discharge areas in the Malm and Keuper aquifers. The much shorter evolution time of the Muschelkalk aquifer in ZNO may be related to the diversion of the Wutach from the Danube into the Rhine system (Chapter 3, Section 6.4.1.3) and possible infiltration of glacial melt water. The higher variability of evolution times in the Keuper aquifer compared to the Malm and even more so to the Muschelkalk aquifer probably reflects the more variable nature of the local Keuper aquifer (Section 4.5.3.10).
Long-term geochemical stability evidenced by the near-linear, similar central parts of the profiles
The tracer values in the central parts of the aquitard sequence are interpreted to be 'older' compared to those towards the aquifer boundaries, but they are clearly no longer those of the original seawater at the time of sediment deposition. This means that these porewaters were affected by solute exchange with the overlying or also underlying porewater or groundwater during the long time since deposition, and by production in the case of He. For the water tracers and the anions, an exchange with freshwater has obviously occurred, probably by diffusive exchange with water in shallow aquifers (the surface was exposed to continental, meteoric conditions most of the time since the Late Cretaceous). This led to the observed lower values compared to the original seawater in the central part. In addition, the porewater in the central parts also shows some signs of modification by water-rock interactions (for δ18O) and by exchange with porewater having been affected by precipitation and dissolution reactions (e.g. halites, for Cl and Br concentrations). This earlier history of the profiles is more difficult to reconstruct quantitatively, but the near-linear segments of the profiles in the central parts indicate geochemical stability over very long geological periods (millions to tens of million years).
Remarkably, the signatures of δ18O, δ2H, or of He in the Opalinus Clay are relatively similar between the different sites (Fig. 4‑119, Fig. 4‑126). The comparably small differences are probably related to a large part to the older, pre-Pleistocene history and not to differences in the present-day signatures of the groundwaters, because these do not yet affect the central parts of the profiles. The overall similarities demonstrate that the porewaters at the different sites experienced a largely common development. That is, they were influenced by the same processes over very long times (millions to tens of million years).
For Cl, the differences in the central part of the profiles (e.g. in the Opalinus Clay) are – in relative terms – larger than for the water tracers. This is interpreted as being related to an earlier, more local input of Cl from the dissolution of underlying evaporitic formations in some of the profiles, i.e. from the dissolution of halite from the underlying Zeglingen Formation. This interpretation is supported by δ 37Cl data, which yielded similar values in the porewater and for the underlying halite. The localised character of the Cl input is probably related to the heterogeneous distribution of halite beds, and possibly also to discrete faults across the overlying low-permeability anhydrite beds. In any case, the Cl input mainly in BUL1 in NL and TRU1 and MAR1 in ZNO must have occurred a very long time ago, because the signatures reach comparably high up in the profiles. It should also be noted that high Br/Cl ratios significantly above that of seawater were observed approximately at the base of Bänkerjoch Formation in some boreholes, which may originate from the evaporation of seawater beyond the saturation of Br salts. The preservation of such high ratios, together with the presence of highly soluble evaporitic minerals remaining since the time of deposition in this zone, is remarkable but in line with the extremely low porosity (and therefore low diffusion coefficients) in the anhydrite-rich rocks.
The He data also support the long-term geochemical stability of the system. While relevant fractions of the He produced in situ in the central part of the low-permeability sequence (i.e. in the Opalinus Clay) have been lost most probably by diffusion, concentrations of the dissolved noble gas isotope 4He are still more than 4 orders of magnitude higher than in air-saturated water. For the Opalinus Clay, build-up times of > 115 Myr can be calculated from these concentrations and the in-situ production rates. More than 65% of the He produced in the Opalinus Clay since deposition is still present, which demonstrates the strong barrier efficiency of the system.
Key points:
- Mineralised fractures (veins) can be observed in all stratigraphic units. The Opalinus Clay in particular shows only few. They are thin (thickness mostly 0.5 – 3 mm) and are mainly found in narrow zones (1 – 2 metres thick). Between such zones, the Opalinus Clay is essentially free of veins.
- The combination of U-Pb dating, clumped isotope thermometry and isotope signatures of vein minerals allow constraining the palaeohydrogeological evolution and the behaviour of the geological barrier over timescales beyond the memory window of the porewater tracer profiles.
- In general, the data indicate evolutions of the mineral-forming fluids from modified seawater-type prior to the Eocene times towards meteoric waters in the Cenozoic.
- The investigated veins in the Opalinus Clay precipitated from fluids with less negative δ18O values compared to the present-day porewater and/or at higher temperatures. This suggests vein formation prior to Pliocene cooling.
- Based on δ13C and Sr-isotope data, an internal evolution of the mineral-forming fluids is conceivable for the Opalinus Clay, however, they could also attest to an efficient rock-buffering.
Mineralised fractures (veins) record the composition of the fluid at the time of mineral precipitation, that is they are archives of the evolution of ground- and porewater. The combination of U/Pb and U/Th dating, clumped isotope thermometry (see also Section 4.3.5) and other isotope proxies allows reconstruction of the palaeohydrogeological evolution, notably for the time period older than the memory window of the porewater tracer profiles (Section 4.6) or from the analyses of groundwater composition (Section 4.5.5). Comparing such information to present-day values for pore- and groundwater provides an insight into the long-term behaviour of the aquitards (geological barriers), particularly with respect to fluid flow along fractures. Note that hydromechanical processes leading to self-sealing of fractures are discussed in detail in Section 5.7.
This section summarises the investigations of vein mineralisation in the TBO drill cores and draws conclusions on past transport in the aquifer-aquitard systems. It builds on previous studies on palaeo-fluid flow in the Mesozoic cover in Northern Switzerland by Pearson et al. (1991; old Nagra boreholes), Nagra (2001; Benken borehole), de Haller et al. (2011; Oftringen borehole), Mazurek & de Haller (2017; Mont Terri rock laboratory), Mazurek et al. (2018; Schlattingen borehole) and Looser (2022; clay pit of Frick).
The approach for reconstructing palaeo-fluid flow is based on the investigation of mineralised structures by 1) thin-section petrography to identify the inventory of different types of mineralisation, different mineral growth generations and paragenetic sequences and 2) using a set of selected isotope tracers (δ 18O, δ13C, δ34SSO4, δ18OSO4, 87Sr/86Sr) and clumped isotope thermometry (Meckler et al. 2014, Müller et al. 2017) of secondary minerals. Thus, knowing the δ18O value of the mineral and the temperature of precipitation allows the calculation of δ18O of the mineral-forming fluid. These results are then combined with information on the timing of mineral precipitation obtained from U-Pb and U-Th geochronology for reconstructing their evolution with time. The respective analytical protocols and methods are described by Dold & Spangenberg (2005), Waber (2020) and Looser (2022).
Challenges related to reconstructing palaeo-fluid flow in sedimentary sequences relate to the different behaviour of solutes/isotopes while interacting with the rock. In the case of carbon and strontium, the rock is the dominant reservoir and thus generally buffers the isotope composition of the fluid. This means that external fluid signals will be obliterated during migration, especially when fluid/rock ratios and fluid fluxes are low. In contrast, the oxygen isotope system is more robust to rock buffering as the water constitutes a very large reservoir for oxygen. Apart from concentration differences between rock and fluid, concentration differences between different fluids also have to be considered. For example, an infiltrating meteoric water with low strontium concentrations has a limited potential to change the Sr isotope signal of a local marine porewater showing high strontium concentrations (i.e. lever rule).
Ultimately, it has to be noted that geochemical data do not provide direct information on the transport mechanisms. These have to be deduced in the context of the regional hydrogeological evolution and be verified by transport simulations. Thus, for the remainder of this section, the term "migration" is used for solute movement in the underground by either advection or diffusion.
In general, two different types of mineralisation were distinguished: 1) infills of primary macropores mainly observed in the Upper Dogger («Herrenwis Unit») and the Lias (Staffelegg Formation) and 2) tectonic mineralisations associated with fractures, i.e. veins. The latter are unevenly distributed over the Mesozoic sequence. The greatest density of veins is observed in the competent carbonates of the Malm Group (Section 4.3.4, Fig. 4‑61, Fig. 4‑65, Fig. 4‑69), where they can attain thicknesses of a few centimetres (Fig. 4‑127a, b). The less competent, clay-mineral-rich Dogger – Lias units show distinctly fewer veins, the Opalinus Clay in particular shows only few. Most of these veins are between 0.5 – 3 mm thick (Fig. 4‑127c, d) and are mainly found in narrow zones (1 – 2 metres thick). Between such zones, the Opalinus Clay is essentially free of veins.
In general, mineralisation is associated with micro faults (i.e. slickenfibres) or within extensional joints and tension gashes (e.g. blocky calcite with no shear or slip indicators). The investigated veins exhibit a large variation in orientation, reflecting the polyphase deformation history of Northern Switzerland (Section 4.3 and Chapter 3; Akker et al. 2023).
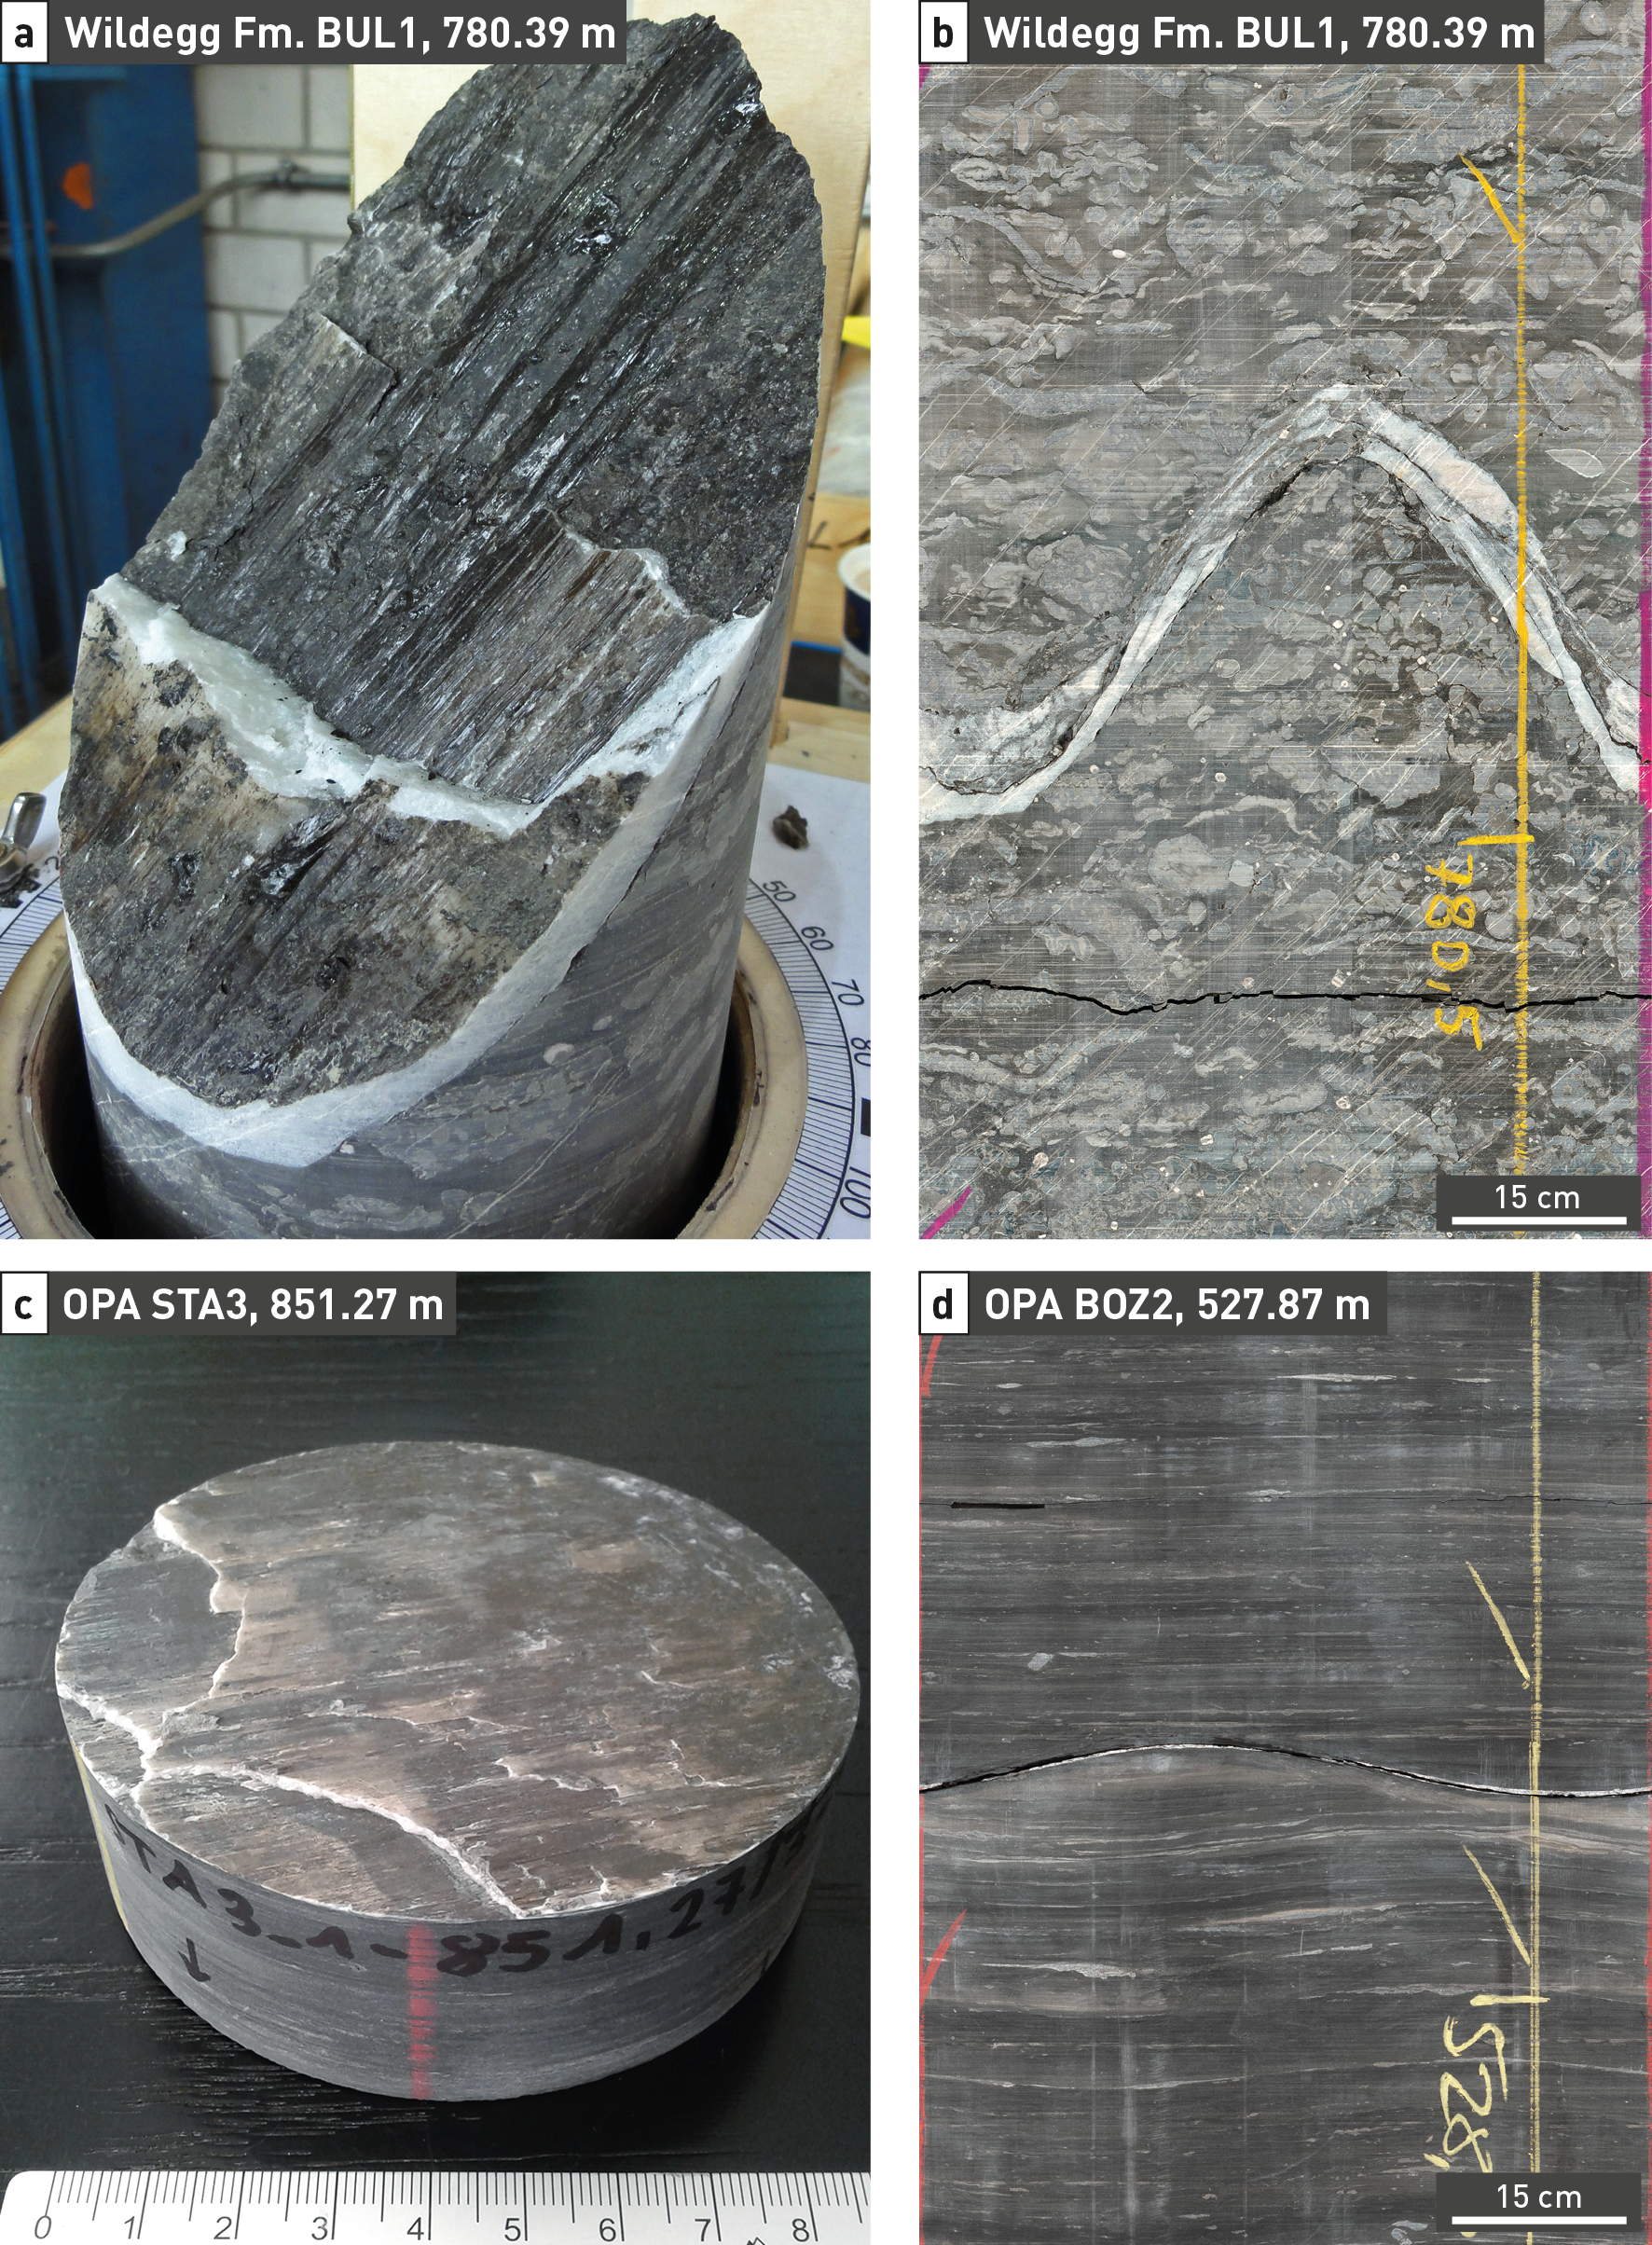
Fig. 4‑127:Examples of veins from the TBO boreholes
(a) Reverse micro fault with cm-thick synkinematic calcite in the Malm Group of the BUL1 borehole (from Nagra (ed.) 2021a, Dossier V). (b) 360° core photograph of the same structure (from Nagra (ed.) 2021a, Dossier V). (c), (d) Reverse micro fault with mm-thick synkinematic calcite in the Opalinus Clay of the STA3 and BOZ2 boreholes, respectively.
Information on the petrography of secondary mineralisations in the Dogger – Keuper interval for various sites across Northern Switzerland (i.e. older boreholes of Nagra and SEAG, Mont Terri) is documented in a variety of reports and publications, which are compiled and summarised by Mazurek & Aschwanden (2020). The TBO boreholes yielded a similar inventory of vein-filling minerals as observed in nearby older boreholes, including calcite, which is consistently present at all investigated sites and constitutes the dominant infill of veins. Calcite vein-fillings are either single-phase (Fig. 4‑128a) or they contain multiple generations, the latter reflecting polyphase deformation and precipitation (Fig. 4‑128b; see also Akker et al. 2023). Additionally, there are minor occurrences of celestite (Fig. 4‑128c) and pyrite as vein-infills, mainly in the Dogger Group above Opalinus Clay and in the Opalinus Clay itself. Also, there are minor occurrences of dolomite with saddle habitus as pore infills in the «Herrenwis Unit» (Fig. 4‑128d).
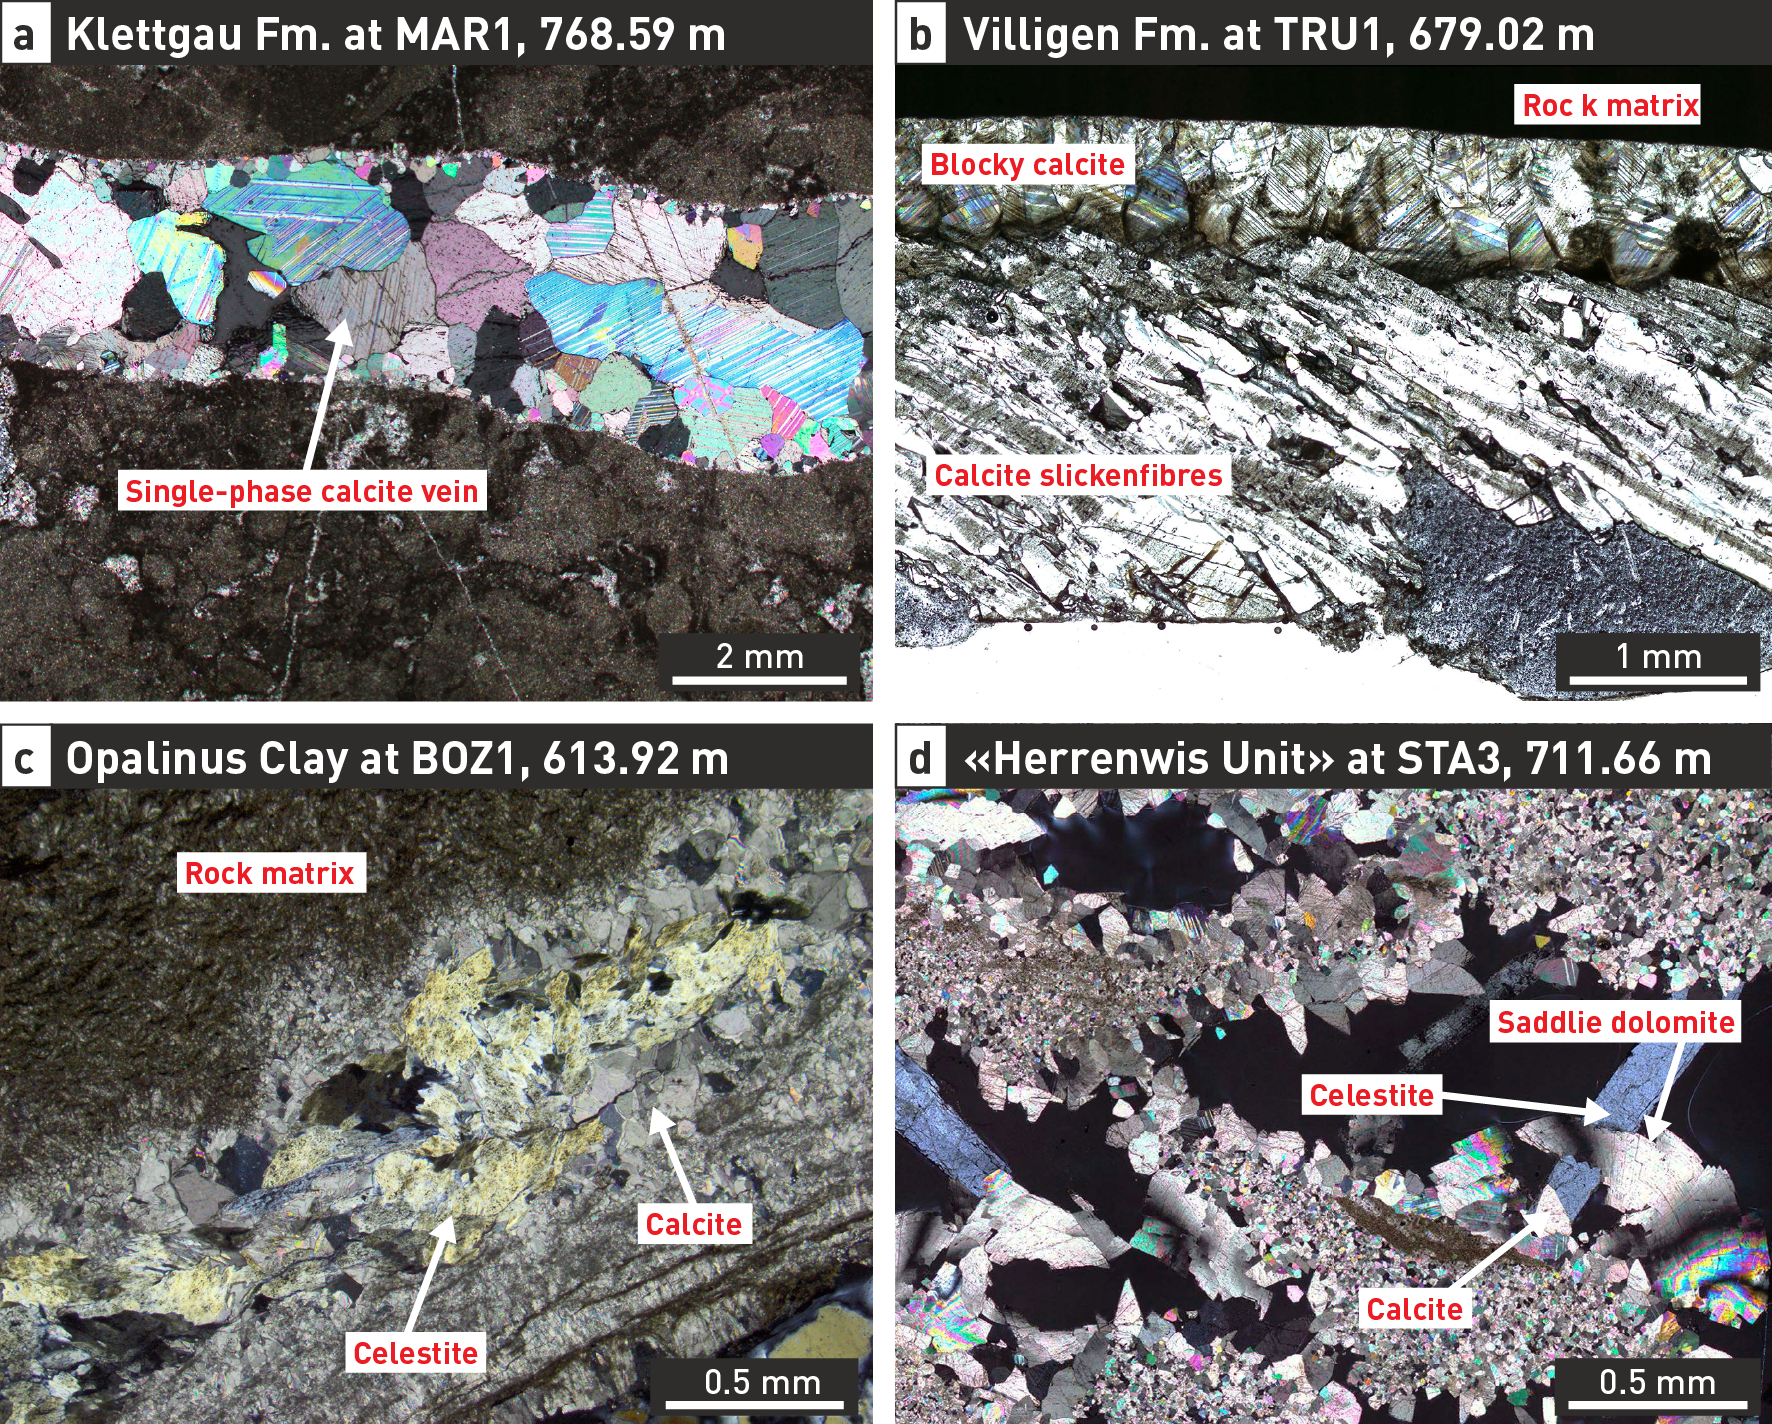
Fig. 4‑128:Mineralised structures in the Opalinus Clay and other Mesozoic units
(a) Single-phase calcite vein (cross-polarised transmitted light microscopy). (b) Two calcite generations representing polyphase deformation (plane-polarised transmitted light microscopy). (c) Calcite-celestite intergrowth in a tension gash (cross-polarised transmitted light microscopy). (d) Saddle dolomite as pore filling. Saddle dolomite typically shows curved crystal faces (cross-polarised transmitted light microscopy).
During the Jurassic and probably parts of the Cretaceous, marine conditions prevailed in Northern Switzerland (Mazurek & de Haller 2017). The δ18O values of calcite-forming fluids (obtained from clumped isotope thermometry, see Section 4.3.5) in the Mesozoic strata for this period are mostly around 0 ‰ VSMOW or even slightly above (Fig. 4‑129). They can be interpreted as remnants of old formation water that evolved from the original seawater by interaction with the rock in the course of geological history. The slightly negative δ18O values of some early-diagenetic phases in the Lias Group may evidence localised, short-term emergence (Section 4.2.5; see also Reisdorf & Wetzel 2018).
In the Late Eocene, at around 52 Ma, the δ18O values of calcite-forming fluids started to evolve towards meteoric signatures, reaching -4 to -5 ‰ VSMOW during the Oligocene – Early Miocene times (Fig. 4‑129 and Fig. 4‑130a). This trend resulted from subaerial exposure since at least Eocene times (Chapter 3, Section 4.3.5; Schegg & Leu 1998, Mazurek et al. 2006), which led to karstification in the top of the Malm Group, deposition of the Bohnerz Formation (Siderolithic Group) and, ultimately, direct recharge and in-diffusion of meteoric water into the Mesozoic strata. Continental conditions persisted throughout the Oligocene and downward migration of meteoric water into the Mesozoic strata continued. Surficial freshwater for this time period showed δ18O values (based on fossil bone and tooth apatite of vertebrates; Tütken et al. 2006, Tütken & Vennemann 2009, Héran et al. 2010, Tütken 2014, Tütken & Absolon 2015, Ring et al. 2020) that are in good agreement with those of the calcite-forming fluids observed in the Malm Group and the Dogger Group above Opalinus Clay.
Samples from the clay pit in Frick (Fig. 4‑60) show meteoric δ18O values in the Staffelegg Formation at 21 – 34 Ma (Fig. 4‑130b). The processes by which the meteoric signals were transported to these levels of the strata are not yet fully understood. However, the Cenozoic evolution of the Frick area differs from the siting regions in the sense that Molasse deposits were substantially thinner. Whether this is due to non-deposition or due to OMM to post-OMM erosion remains unclear (Diebold et al. 2006). The erosional event removed not only possible older Molasse deposits but also locally Mesozoic units down to the Dogger Group (Diebold et al. 2006). That is, there were probably prolonged meteoric conditions, and the relevant overburden thickness was substantially thinner, resulting in a more direct transmission of meteoric signals. Furthermore, the relative proximity to the Upper Rhine Graben (Section 4.3.3) could have had an influence on vertical fluid flow by the formation of normal faults at that time. Based on the aforementioned reasons, these samples from Frick are not necessarily representative for the palaeohydrogeological evolution of the siting regions.
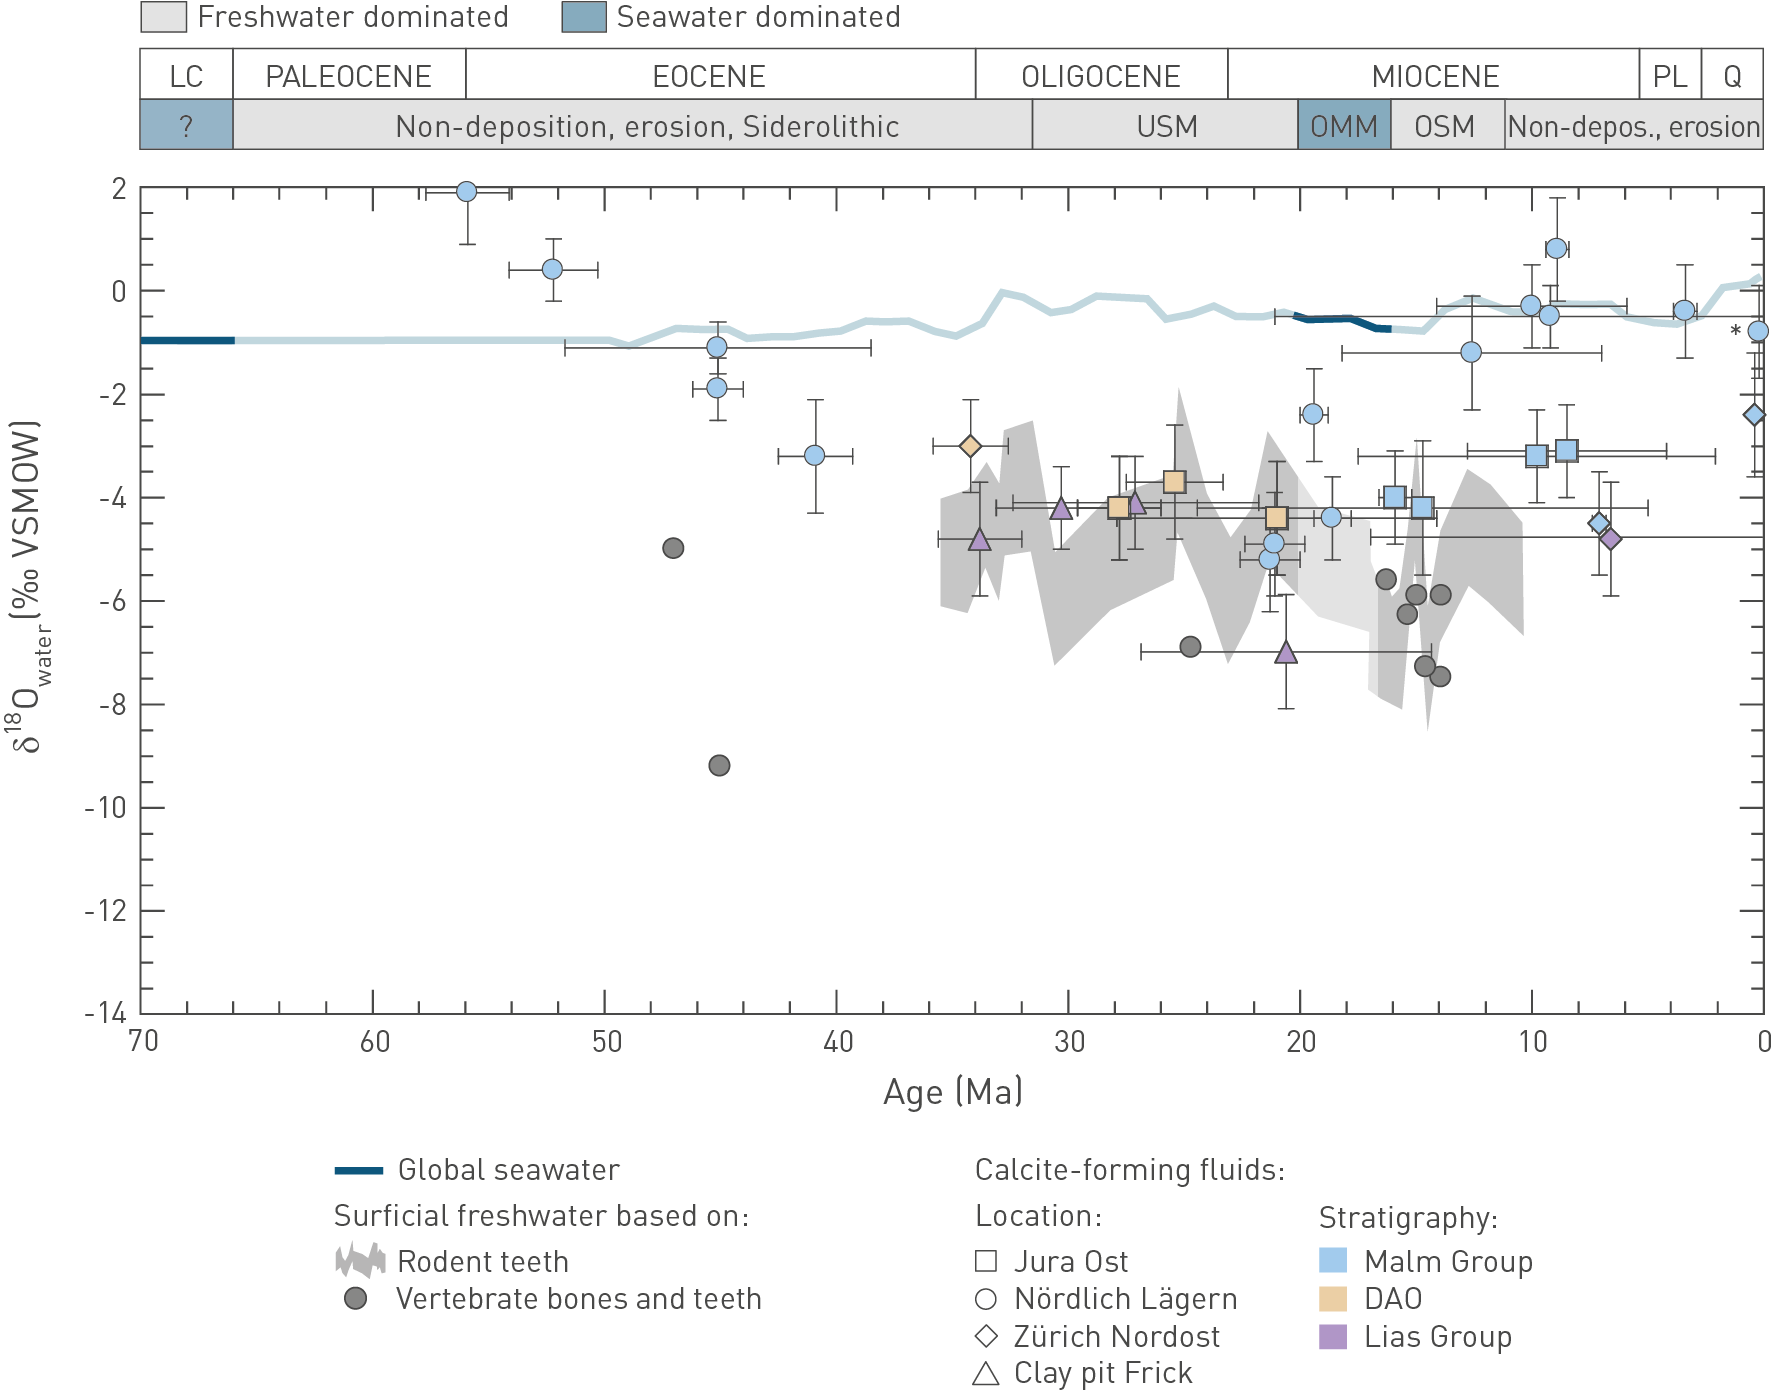
Fig. 4‑129:Evolution of δ18O of calcite-forming fluids over the last 70 Ma as obtained from coupled clumped isotope thermometry and U-Pb and U-Th dating of calcite cements
For comparison, literature data for seawater (Lear et al. 2000) and Eocene – Miocene surficial freshwater are also shown Tütken et al. 2006, Tütken & Vennemann 2009, Héran et al. 2010, Tütken 2014, Tütken & Absolon 2015, Ring et al. 2020. As a result of consistently low U concentrations and high Pb contents (dominated by common Pb), no reliable U-Pb age data could be obtained for vein calcite in the Opalinus Clay (Akker et al. 2023). Data for the Lias at the Frick clay pit are from Looser (2022). Q: Quaternary, PL: Pliocene, LC: Late Cretaceous, DAO: Dogger Group above Opalinus Clay. Post-kinematic calcite (see text for details). Data of regional fault-related outcrops in the Eastern Jura (see Fig. 4‑73) are not shown here because they are not considered representative for the fluid evolution in the comparably weakly deformed and deeply buried Mesozoic strata in the siting regions.
For the siting regions, the earliest occurrence of meteoric waters in the Lias Group is indicated by a vein in ZNO dated to 7 Ma (although the uncertainty on the age is large). The calcite-forming fluid shows similar negative δ18O values as observed for the Dogger Group above Opalinus Clay (ZNO and JO) during the Oligocene. Thus, for the hydrogeological evolution of the Opalinus Clay in the siting regions, an influence of meteoric waters is indicated latest by Late Miocene times.
For the Malm Group, a large variability in δ18O values is indicated for the Miocene Epoch (Fig. 4‑129). This variability is interpreted to result from:
-
Downward migration of seawater during the Burdigalian marine transgression and deposi- tion of the Upper Marine Molasse Group (OMM) at around 16 – 20 Ma (Garefalakis & Schlunegger 2019; Chapter 3), which interrupted Miocene freshwater-dominated conditions. This is also evidenced by distinct trends of upwards decreasing δ13C and increasing 87Sr/86Sr values from vein calcite in the top of the Malm Group at the Oftringen borehole (see also de Haller et al. 2011 and for the NL boreholes Fig. 4‑132 and Fig. 4‑133).
-
After deposition of the OMM, freshwater-dominated conditions were re-established and meteoric water migrated into the Mesozoic strata. The Molasse deposits are relatively thin in JO (ca. 100 m in total), whereas in NL they reach a thickness of more than 400 m. For the latter siting region this results in higher burial temperatures (50 – 80 °C in NL vs. 45 – 60 °C in JO for the Malm Group) and longer transport distances, i.e. potentially longer subsurface residence time of the calcite-forming fluids during which their isotope composition is modified by the interaction with the rock.
For two of the veins in the Malm Group, U-Th geochronology yields Pleistocene ages. The corresponding vein calcite from ZNO (Villigen Formation, TRU1-1) is synkinematic, collected from a strike-slip fault that formed in response to contraction (Section 4.3.4). In contrast, the vein calcite from NL («Felsenkalke» and «Massenkalk», STA3-1) is post-kinematic, i.e. reflecting a fluid pulse with no concurrent deformation. The mineral-forming fluids of these two young vein calcites show the same difference in their δ18O values as observed for Miocene times, i.e. with seawater-type δ18O values in NL and distinctly more negative values in ZNO. Similarly, as explained above, variation in subsurface residence times, transport distances and burial temperatures can explain the difference in the δ18O values of the calcite-forming fluids between the siting regions. Also, the groundwater in the Malm aquifer can play a role: At least for the vein from the Villigen Formation in ZNO (0.4 Ma; Fig. 4‑130), a transient hydraulic connection with the Malm groundwater (i.e. as sampled at present) is evident. This is indicated by a distinct shift of the calcite-forming fluid towards a more positive δ18O value (in good agreement with those of the groundwater) relative to the present-day porewater in the adjacent rock.
As observed for the confining units, calcite-forming fluids in the Opalinus Clay show a large variability in their δ18O signatures ranging from modified seawater-type to distinctly negative values (Fig. 4‑130e). The consistently low U concentrations and the high Pb contents of the vein calcites dominated by common Pb (Akker et al. 2023) result in no reliable U-Pb age data being obtained (except for two Jurassic ages; Fig. 4‑73) that would help to better constrain the evolution of the calcite-forming fluids. Following the above observations for the confining units, i.e. involving a transition from modified seawater-type to meteoric δ18O values during Eocene – Oligocene times, it is argued that the variability observed for the calcite-forming fluids in the Opalinus Clay reflects a similar evolution. Based on the temperature – depth history of the Mesozoic strata (Mazurek et al. 2006, Looser 2022; Section 4.3.5), the temperatures of vein formation of 57 – 102 °C for the modified seawater-type (Paleocene and older) and 50 – 81 °C for the meteoric waters (Eocene and younger) are consistent with such a hypothesis. This is illustrated in Fig. 4‑131a, which shows the temperature and δ18O values of calcite-forming fluids together with the timing of precipitation in veins of the confining units. Hence, for the Opalinus Clay, vein formation during Late Jurassic - Cretaceous, as well as later during Eocene – Miocene times, is indicated. Note that all calcite-forming fluids in the Opalinus Clay show less negative δ18O values and/or higher temperatures compared to the present-day porewater in the adjacent rock matrix (Fig. 4‑131b), suggesting that vein formation occurred before Pliocene cooling started at around 5 Ma (Section 4.3.5), i.e. beyond the memory window estimated for the porewater δ18O profiles (Section 4.6.2).
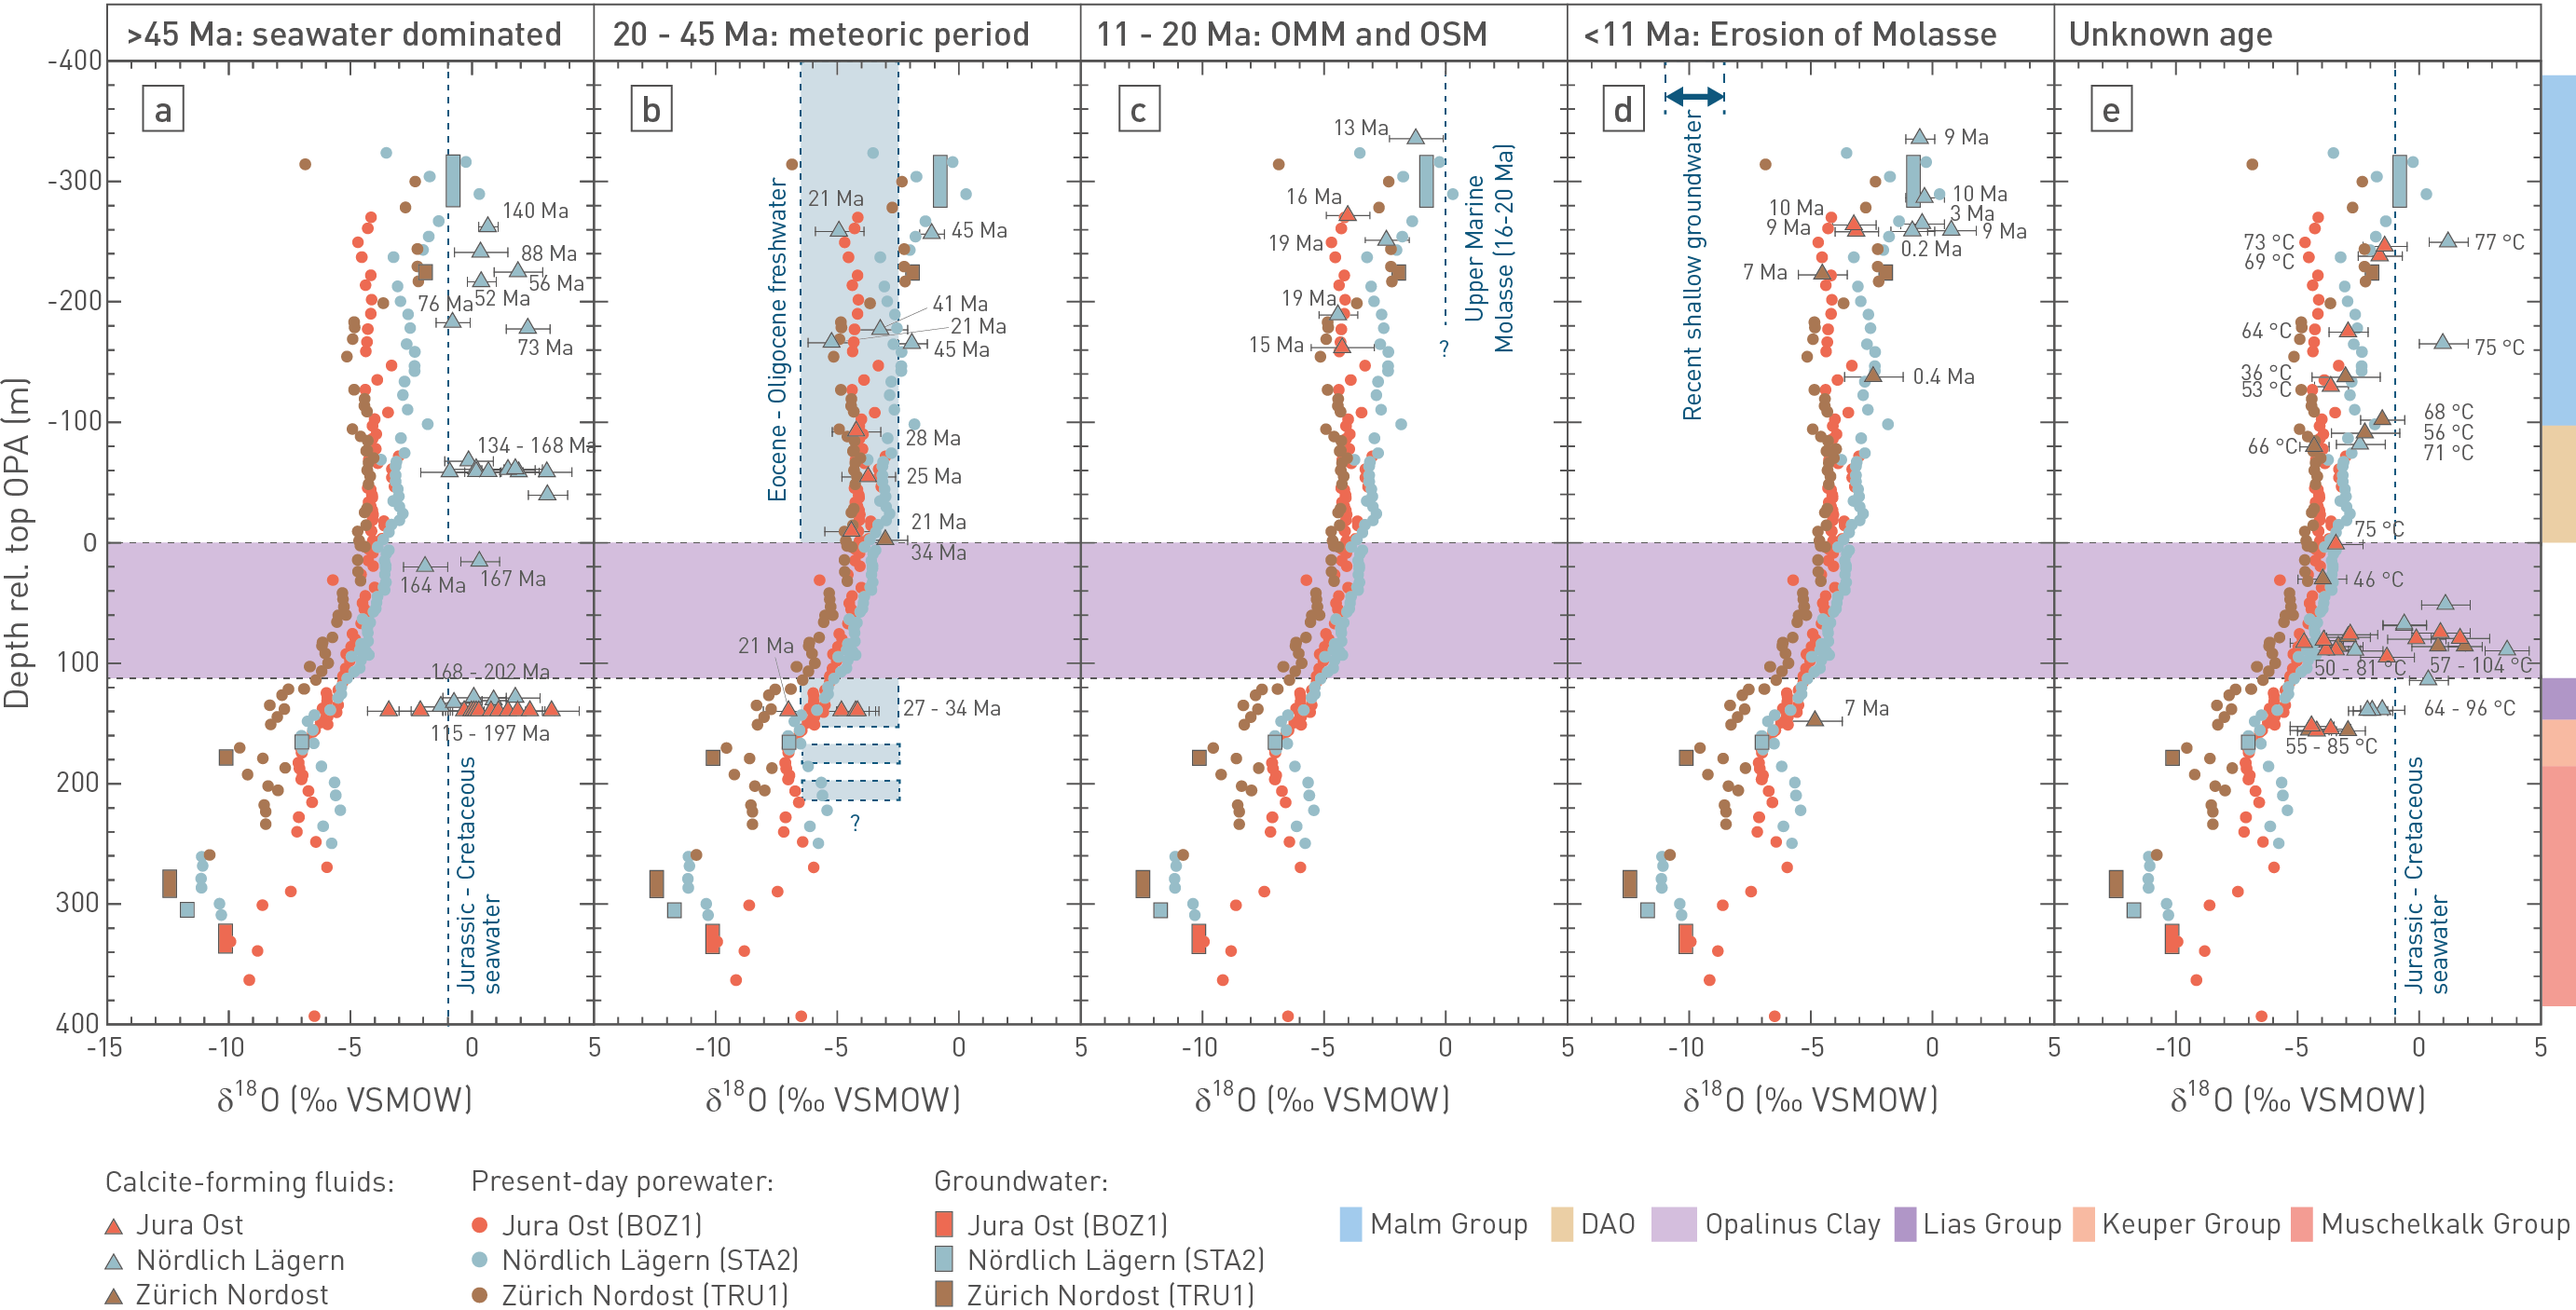
Fig. 4‑130:Depth profiles of the oxygen isotope composition of calcite-forming fluids derived from clumped isotope thermometry for different time periods
Depths are relative to the top of the Opalinus Clay. For comparison, the oxygen isotope composition of the present-day porewater is also illustrated (Section 4.6), as well as the values for the groundwater in the confining aquifers (Section 4.5.5). The numbers indicate U-Pb/Th ages or clumped isotope temperatures for structures with no reliable age data. a) Time period for which calcite-forming fluids constitute remnants of old formation water that evolved from the original seawater by interaction with the rock. b) Time period during which meteoric waters migrated into the Mesozoic strata before deposition of the Upper Marine Molasse Group (OMM). c) Situation during deposition of the OMM and the Upper Freshwater Molasse (OSM) Groups. d) Situation after Molasse deposition. e) Samples with no reliable age data.
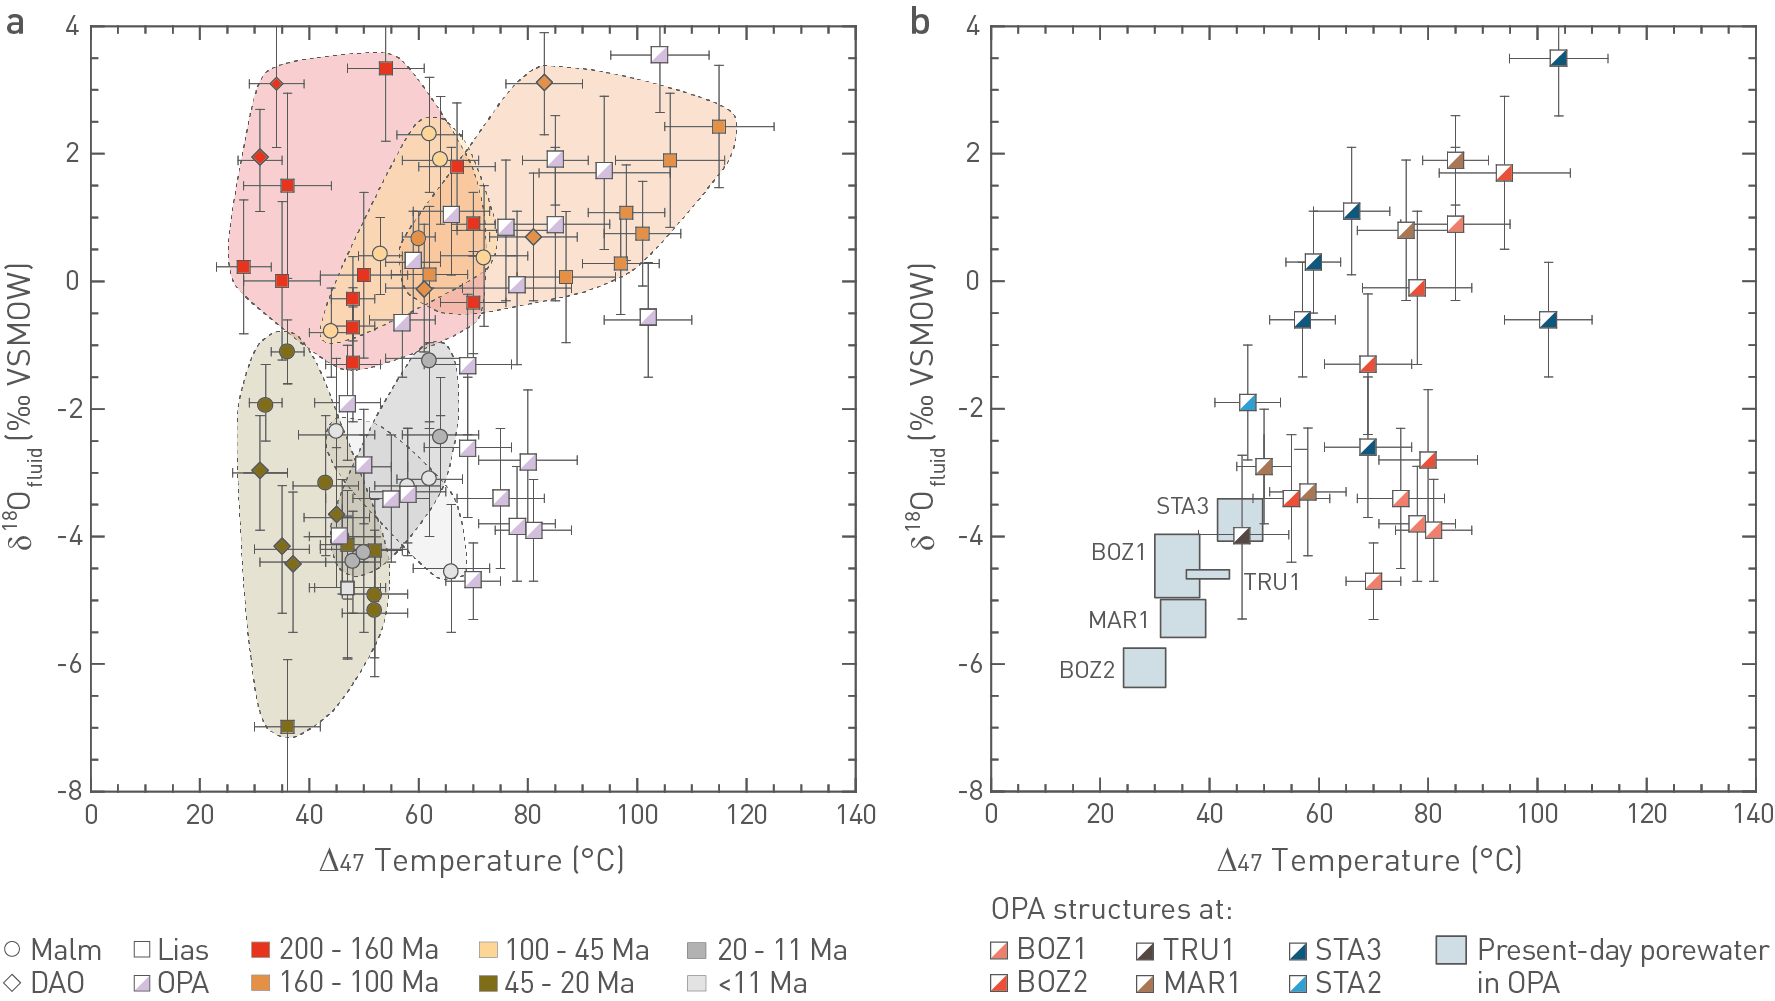
Fig. 4‑131:Temperature and δ18O values of calcite-forming fluids from clumped isotope thermometry
a) The coloured fields indicate the timing of vein formation in the units above and below the Opalinus Clay (based on U-Pb geochronology) to better constrain the timing of vein formation in the Opalinus Clay (no reliable U-Pb data; see text). Calcite-forming fluids from the Malm affected by relatively shallow, near-surface processes (e.g. downward migration of OMM seawater) are not shown in this graph (see Section 4.7.6). b) Calcite-forming fluids in the Opalinus Clay compared to the δ18O values and temperatures of the present-day porewater in the adjacent rock matrix. DAO: Dogger Group above Opalinus Clay, OPA: Opalinus Clay.
Regarding the δ13C of vein calcite, the Opalinus Clay generally shows similar values to the matrix carbonate (except for JO; see below), but at lower levels compared to the Malm Group (Fig. 4‑132). This difference probably reflects the relatively higher content of organic material in the clay-mineral-rich lithologies (e.g. Nagra (ed.) 2021a, Dossier VIII), which provides a source for isotopically light carbon. Thus, an internal evolution of the calcite-forming fluids is conceivable for the Opalinus Clay. However, the coherence of δ13C of veins and rock matrix is a necessary but not a sufficient argument. Fracture apertures in the clay-mineral-rich lithologies are generally very narrow and potential fluid fluxes were supposedly low; thus, rock buffering is considered very effective, and any external carbon isotope signal could be obliterated by the interaction with the rock (see Section 4.7.2). Vein calcite in the Opalinus Clay in JO is somewhat exceptional because δ13C values of vein calcite and matrix carbonate are clearly different, with the former showing distinctly more negative values. The reason for this is yet to be resolved. Potentially, it reflects an external signal, but it could also result from, for instance, the decomposition of organic material (Harrison et al. 2022), similarly to what was suggested for the very negative δ13C values of early diagenetic calcite in the underlying Staffelegg Formation.
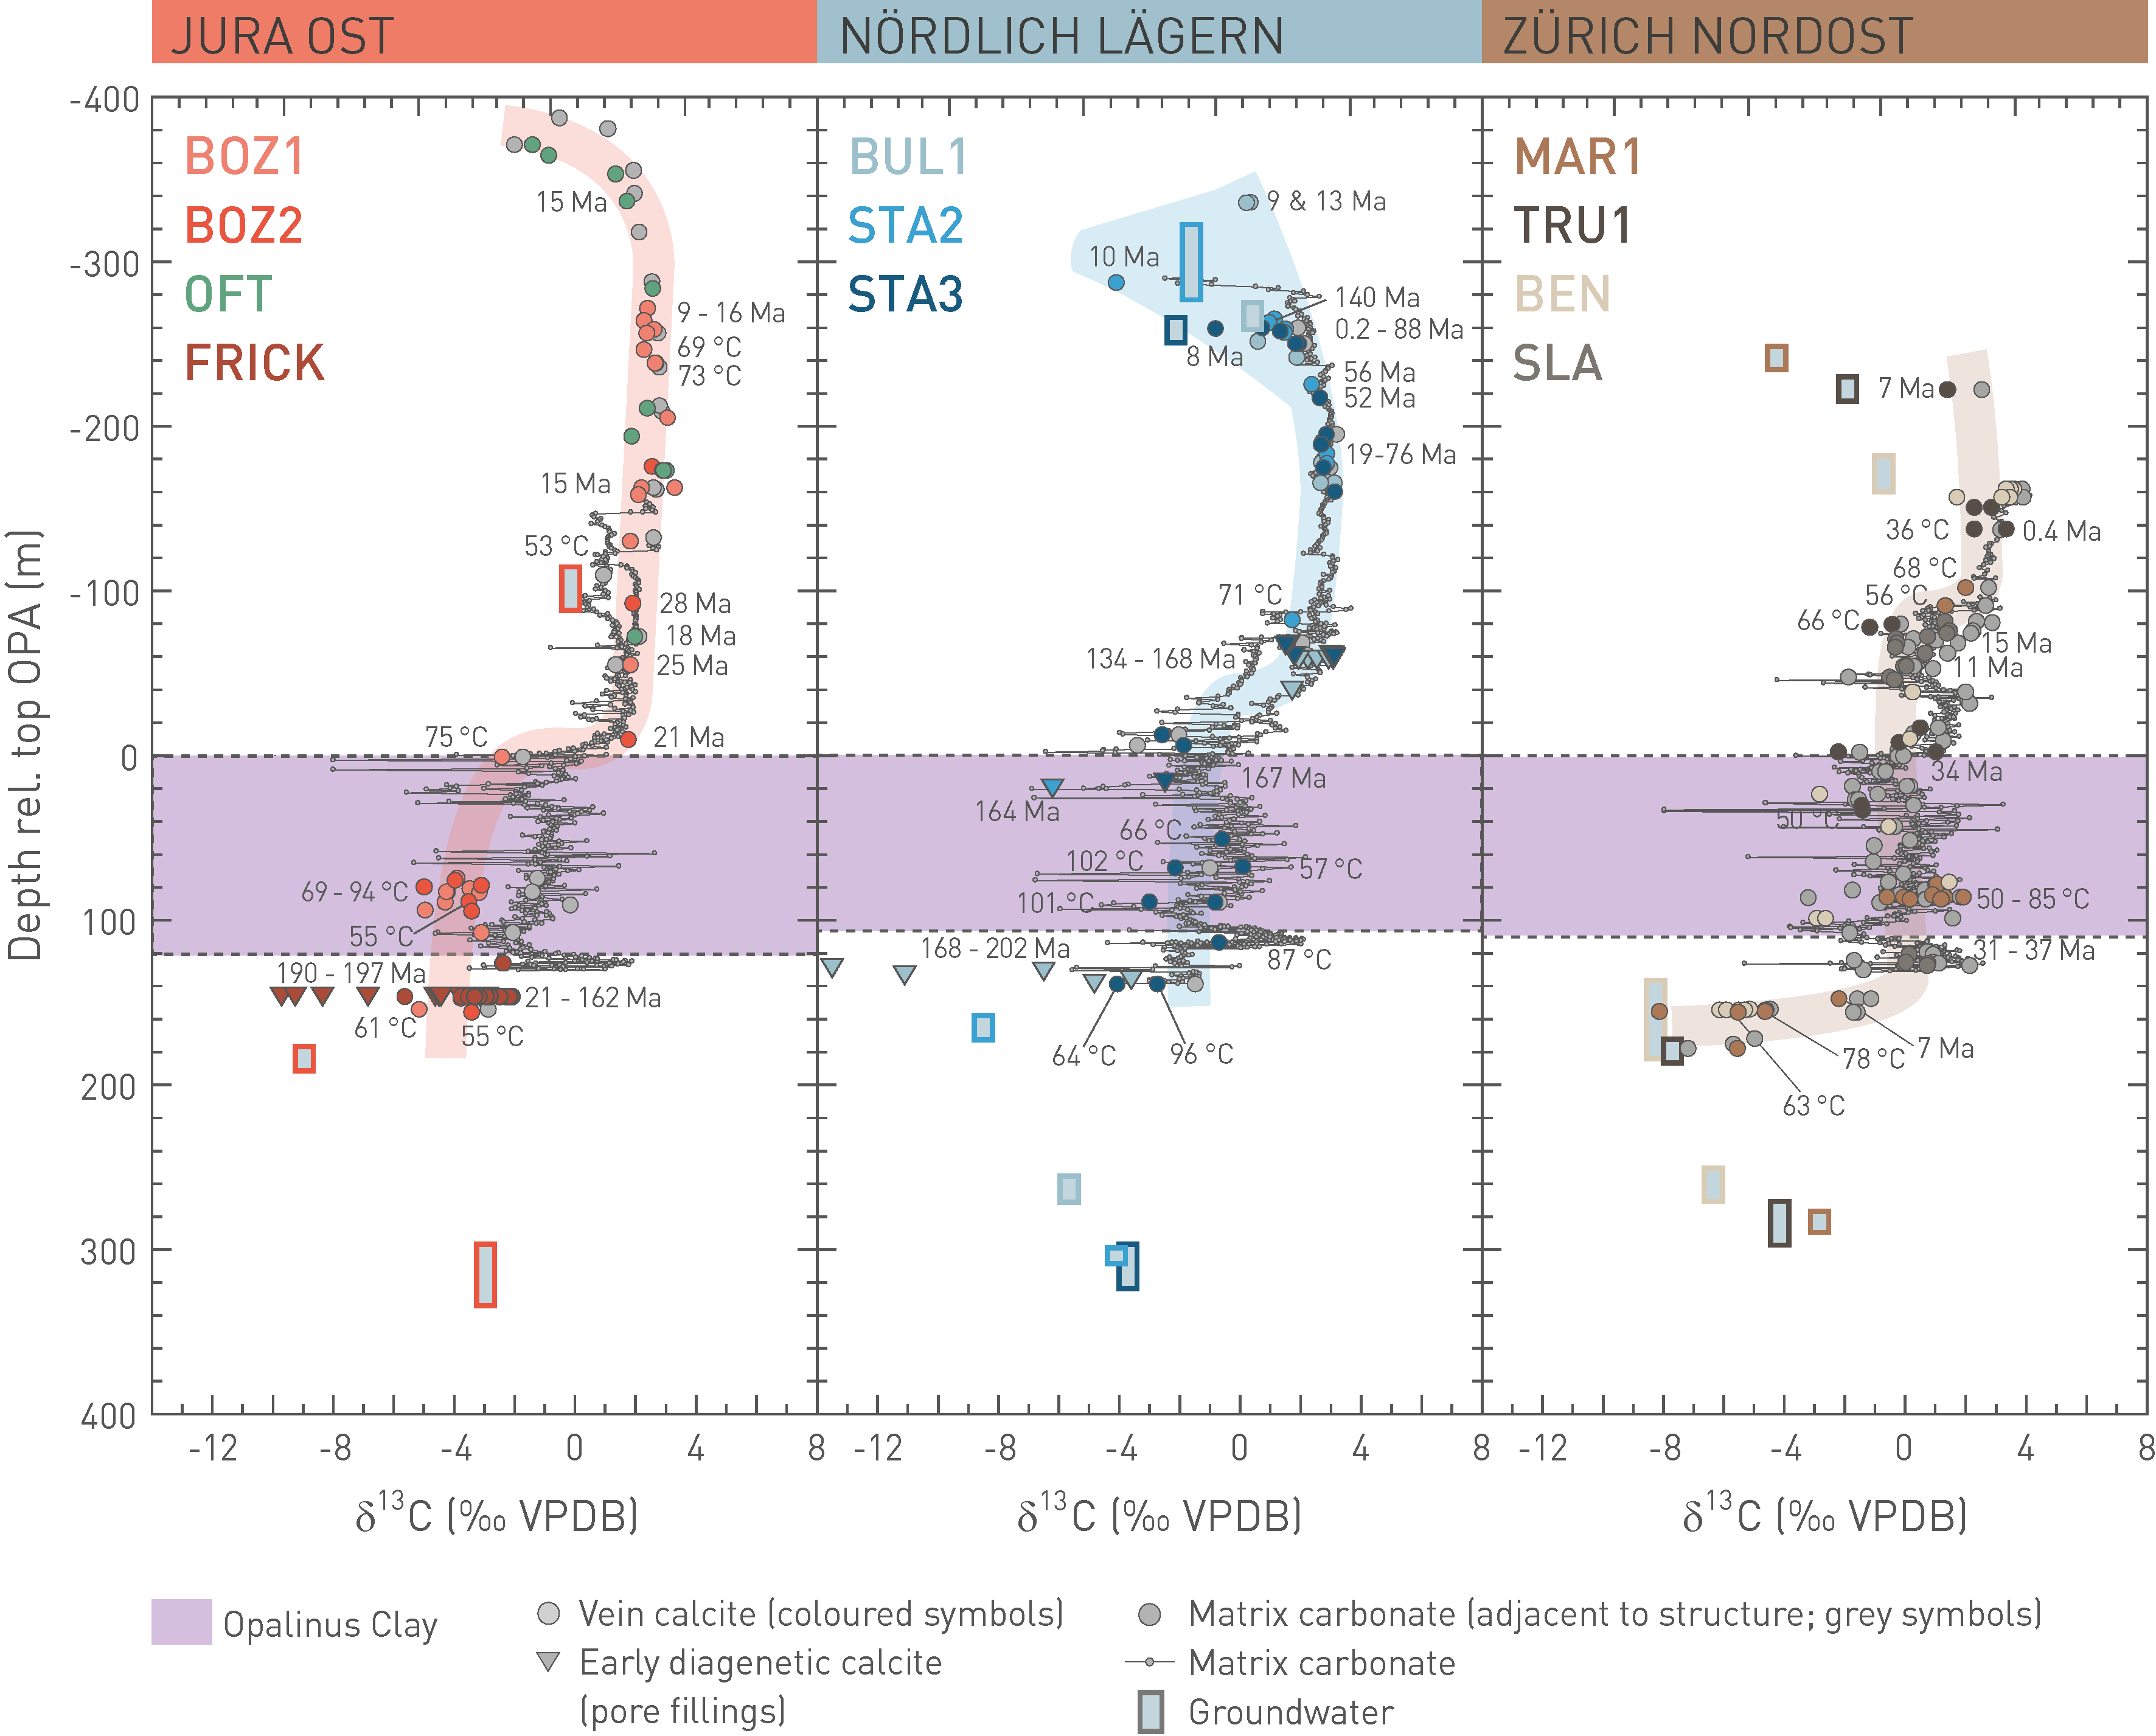
Fig. 4‑132:Depth profiles of the carbon isotope composition of vein calcite and matrix carbonate
Depths are relative to the top of the Opalinus Clay. For comparison, the carbon isotope composition of the groundwater samples is also shown. The black numbers indicate U-Pb ages (Ma) or clumped isotope temperatures (°C) for samples with no reliable U-Pb age. The coloured fields highlight the trends observed for vein calcite. Data for the older Benken (BEN), Oftringen (OFT) and Schlattingen (SLA) boreholes are from Nagra (2001), de Haller et al. (2011) and Mazurek et al. (2018). The data from the clay pit of Frick are from Looser (2022). Note that the OFT data are illustrated in the JO plot although the borehole is located ca. 27 km southwest of the siting region. Matrix carbonate composition based on Ruf et al. (2005), Nagra (ed.) 2023a, Dossier IV) and Wohlwend et al. (2024). OPA: Opalinus Clay.
In the Opalinus Clay, 87Sr/86Sr ratios of vein calcite and celestite are all higher compared to the overlying more calcareous lithologies (Fig. 4‑133; except for the top of the Malm Group where downward migration of Burdigalian seawater is evident). Also, 87Sr/86Sr ratios of vein calcite are higher compared to the matrix carbonate. This implies that the mineral-forming fluids in the Opalinus Clay evolved within rubidium-bearing lithologies where they picked up radiogenic strontium from continuous rubidium decay. An evident source for radiogenic strontium is the rubidium associated with clay minerals. As for the carbon isotopes, an internal evolution of the mineral-forming fluids is conceivable for the Opalinus Clay (bulk rock 87Sr/86Sr ratios up to 0.714052; Nagra 2001) but again this could also simply attest to an effective rock buffering (see Section 4.7.2).
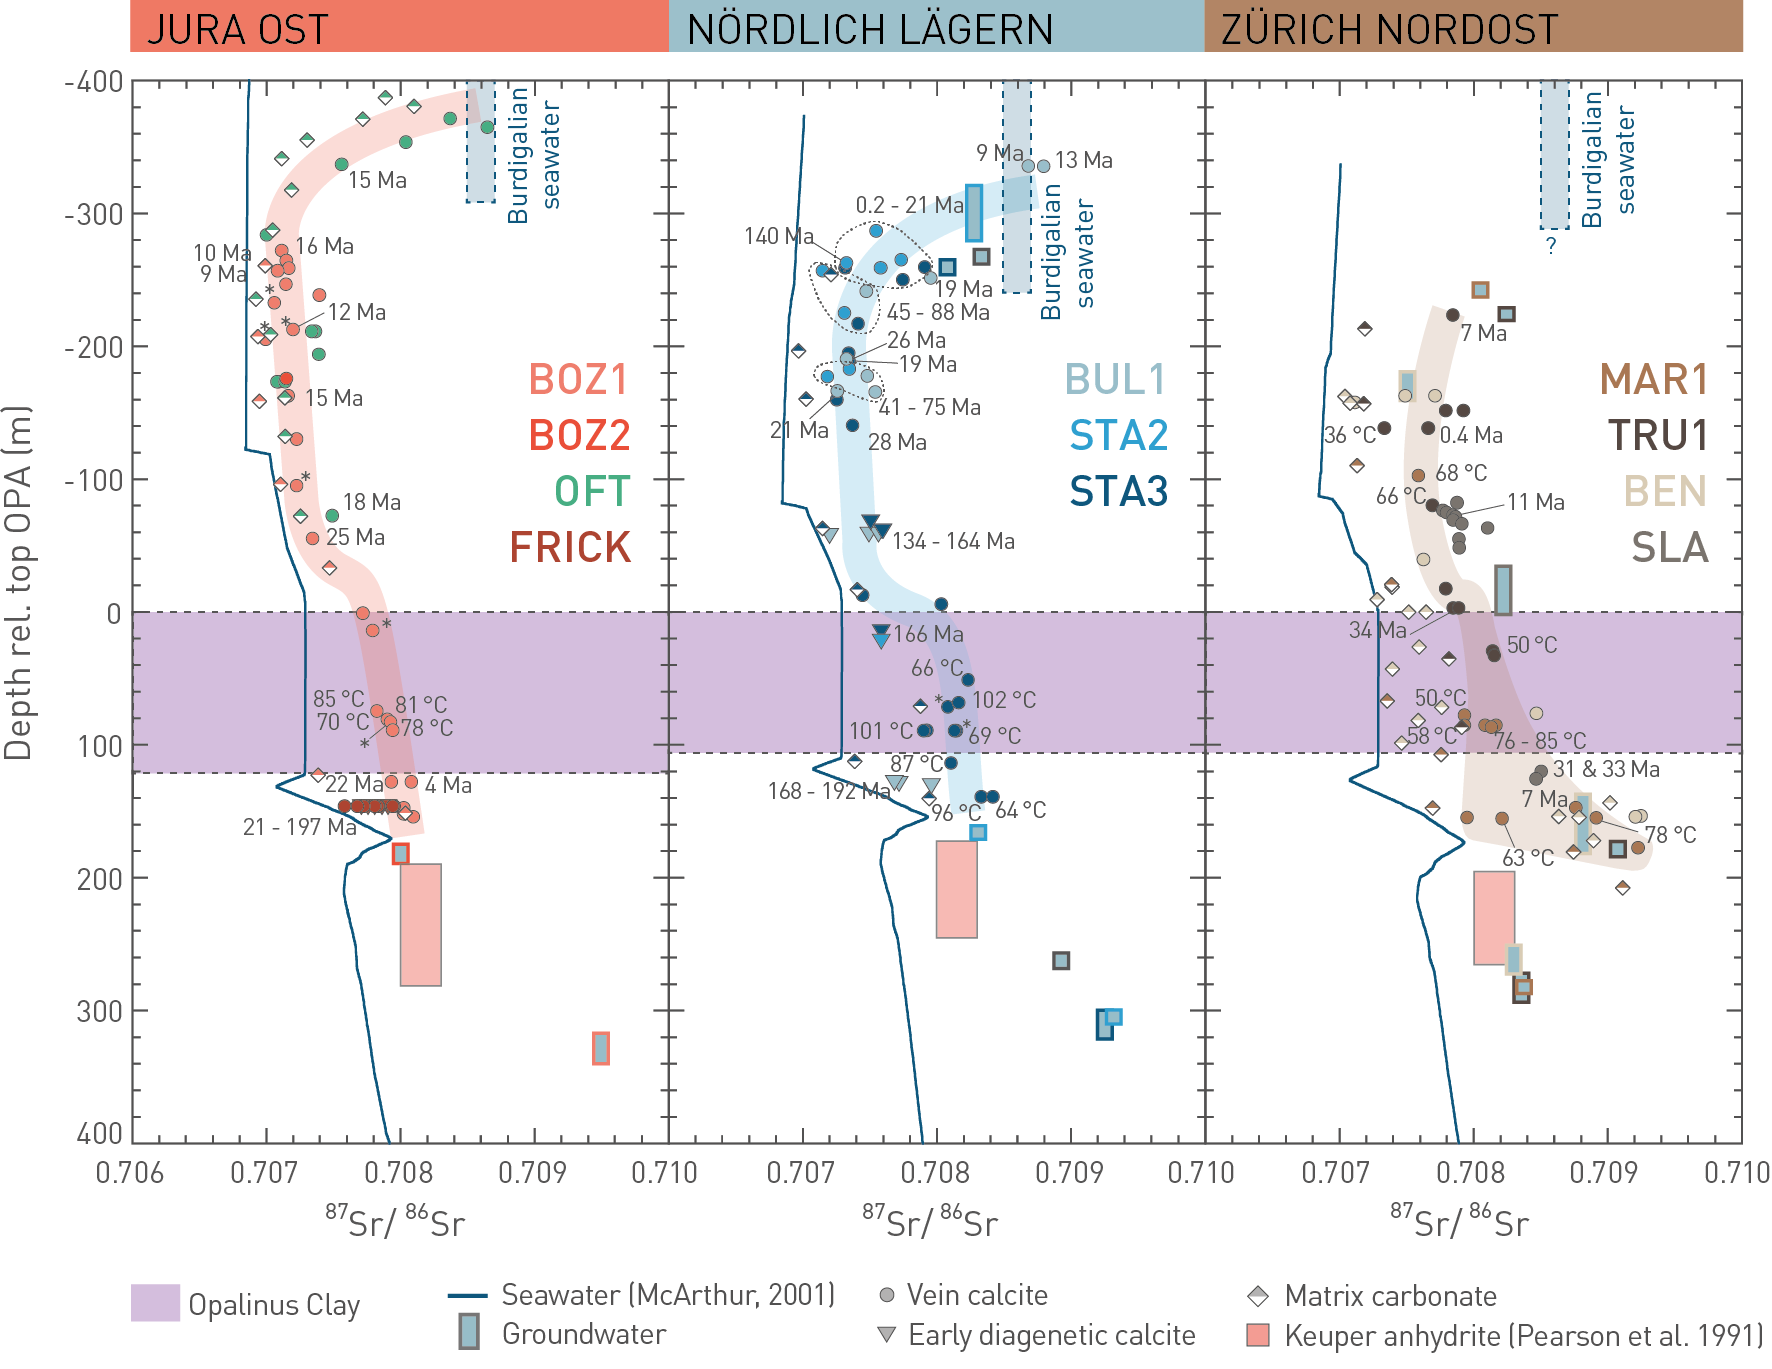
Fig. 4‑133:Depth profiles of strontium isotope ratios of vein calcite, vein celestite and present-day porewater
Depths are relative to the top of the Opalinus Clay. For comparison, the palaeo-seawater line is also illustrated (McArthur et al. 2001), as well as the present-day groundwater in the confining aquifers (Section 4.5.5) and Keuper anhydrite (Pearson et al. 1991). The black numbers indicate U-Pb ages (Ma) or clumped isotope temperatures (°C) for samples with no reliable U-Pb age. The coloured fields describe the general trends observed for the mineral-forming fluids (see text for details). Data for the Benken (BEN), Oftringen (OFT) and Schlattingen (SLA) boreholes are from Nagra (2001), de Haller et al. (2011) and Mazurek et al. (2018). The data from the clay pit of Frick are from Looser (2022). Note that the OFT data are illustrated in the JO plot although the borehole is located around 27 km southwest of the siting region. OPA: Opalinus Clay. Samples marked with an asterisk refer to vein celestite.
Fig. 4‑134 shows the δ34S and δ18O isotope signatures for vein celestite observed in the BOZ1 and STA3 boreholes. For comparison, isotope data for marine sulphate during different geological periods are also illustrated (Claypool et al. 1980), as well as δ34S and δ18O values of evaporites in the Bänkerjoch Formation and the Muschelkalk Group (Rick 1990, Pearson et al. 1991, Bernasconi et al. 2017). The vein celestite in all of the investigated samples shows δ18O versus δ34O outside the range of marine sulphate at all times at which seawater was potentially present in the region, indicating modification by sulphate reduction. This is further evidenced by the occurrence of pyrite as vein infill (Section 4.7.3). The slope of the resulting isotope enrichment in a plot of δ34S versus δ18O varies as a function of different factors (bacterial vs. abiotic reduction, open vs. closed system, effects of Rayleigh distillation) but mostly lies in the range of 0.25 – 0.4 (Pierre 1989, Clark & Fritz 1997). Fig. 4‑134 shows that such a slope fits reasonably well with the isotope data of celestite in the Malm Group, with Jurassic seawater as a likely source of the sulphate (i.e. internally sourced, pre-dating Eocene – Oligocene influx of meteoric water). One sample (marked with an asterisk in Fig. 4‑134) falls off this general trend by showing a distinctly lower δ18O value. The sulphate of this vein celestite potentially originates from Burdigalian seawater associated with the deposition of the Upper Marine Molasse Group. A similar hypothesis was proposed by de Haller et al. (2011) for vein celestite in the Malm Group of the Oftringen (OFT) borehole.
For vein celestite in the Opalinus Clay, a slope of 0.25 – 0.4 in the δ34S versus δ18O plot also fits reasonably well the isotope data, however, with sulphate originating in the underlying evaporites of the Keuper. Based on similar trends, Mazurek & de Haller (2017) also proposed Keuper-sourced sulphate for vein celestite in the Opalinus Clay at the Mont Terri rock laboratory. This does not necessarily imply advective communication between the Keuper units and the Opalinus Clay, it could result from diffusive exchange over long timescales. Present-day porewaters in the Opalinus Clay – Lias interval show increasing sulphate concentrations with increasing depth (e.g. Nagra (ed.) 2023a, Dossier VIII), thus, this concentration gradient makes upward diffusion of sulphate a plausible scenario.
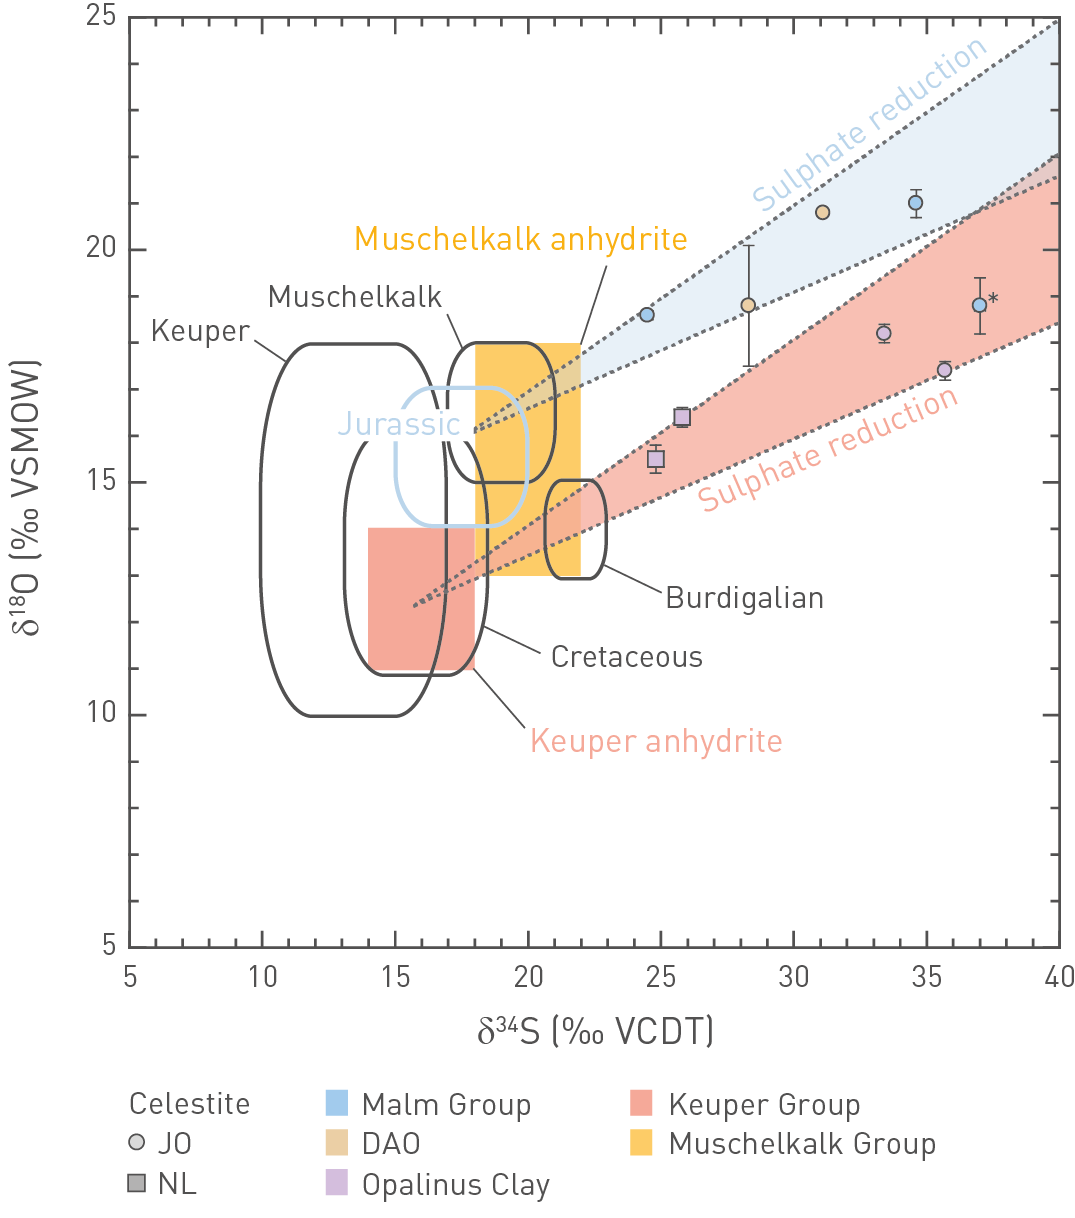
Fig. 4‑134:δ18O and δ34S values for vein celestite observed in boreholes in Northern Switzerland
Solid lines represent ranges for marine sulphate during different geological periods (Claypool et al. 1980). Data for anhydrite in the Gipskeuper and Muschelkalk are from Rick (1990), Pearson et al. (1991) and references therein and Bernasconi et al. (2017). DAO: Dogger Group above Opalinus Clay. The two fans bordered by dotted lines indicate the trends of sulphate reduction (Pierre 1989, Clark & Fritz 1997). These trends fit the isotope data of vein celestite reasonably well, suggesting Jurassic (and Burdigalian) seawater as the source of sulphate for vein celestite in the Malm and DAO, whereas vein celestite in Opalinus Clay seems to be sourced from Keuper anhydrite. Celestite occurrences at ZNO were generally too small to be analysed.
Isotope investigations combined with U-Pb geochronology show that, during the Eocene – Oligocene, downward migration of meteoric surface waters affected the Malm Group – Dogger Group above Opalinus Clay interval. At the clay pit of Frick, similar negative δ18O values are observed for calcite-forming fluids in the Lias Group below the Opalinus Clay. Neither the origin nor the process(es) by which these signals were transported in the vertical dimension are fully understood. In any case, evidence from U-Pb dating, the general geodynamic evolution and structural mapping suggest that the fluid evolution at Frick is not necessarily representative for the siting regions further east.
Downward migration of Burdigalian seawater during deposition of the Upper Marine Molasse Group is evidenced for the top 100 – 200 m of the Malm section at the Oftringen (OFT) and NL boreholes. In contrast, at JO, mineral-forming fluids from similar depth and age do not show any seawater signals. Most likely, such regional differences reflect the location of the palaeo-shoreline during OMM deposition. Müller et al. (2002) show that the transgression of the Burdigalian sea covered both NL and ZNO, whereas JO was largely unaffected (Section 3.4.4). Moreover, during late Burdigalian and Langhian times an erosive phase affected the JO area, eroding parts of the older Molasse deposits and in places cutting channels into Mesozoic units (Diebold et al. 2006). It is thus likely that possible marine porewaters would have been rapidly displaced by meteoric waters.
For one of the youngest Pleistocene structures in the Malm Group, a hydraulic connection with the groundwater in the Malm aquifer (i.e. as sampled at present) is evidenced. Minimum transport distances estimated from the isotope profiles are in the range of 80 – 100 m. Advection was the likely transport mechanism, however, transient fluid fluxes must have been short-lived, affecting only the porewater in close proximity to the water-conducting structures, otherwise anomalies in the porewater isotope profiles would be expected, which is not the case.
For the time period pre-dating the evolution times of the porewater tracer profiles (Section 4.6), the hydrogeological history of the Opalinus Clay remains poorly constrained, because veins are infrequent, thin and U-Pb geochronology was unsuccessful. In general, a similar evolution as for the confining units is likely, involving modified seawater-type mineral-forming fluids prior to the Eocene, followed by a change towards meteoric waters in the Cenozoic. However, the underlying transport process(es) of this change are not exactly known. In general, δ13C and 87Sr/86Sr values of vein calcite are consistent with an internal evolution of the mineral-forming fluids, however, the isotope signals could also result from an effective rock buffering by which external signals were possibly obliterated. Thus, thin veins in the Opalinus Clay can be explained by external or by internal fluid sources. The underlying mechanisms for the latter include local pressure drops in response to slip induced by tectonic deformation (Diamond 1998) or mixing of chemically different waters (Sanz et al. 2011).
Based on the observed regional cooling at around 5 Ma (Section 4.3.5), clumped isotope temperatures of vein calcite in the Opalinus Clay (Akker et al. 2023) suggest a minimum Pliocene age for these veins, thus documenting for at least this time the efficient barrier properties of the Opalinus Clay. Further constraints on the timing of vein formation in the Opalinus Clay derived from rock-mechanical considerations are presented in Section 5.7.6.
Key points:
- Temperatures in the Opalinus Clay and in the deep aquifers correlate well with depth below surface.
- In the siting regions, measured temperatures for mid Opalinus Clay are in the expected range from 28 °C (510 m below surface, borehole BOZ2) to 45 °C (940 m below surface, BUL1 borehole).
- For the aquifers, temperatures vary between 6 – 32 °C for mid Malm and 45 – 58 °C for mid Muschelkalk.
- Clay-mineral-rich units show considerably higher temperature gradients than limestones, reflecting the different thermal conductivities of the rocks.
- The new temperature data are in agreement with the expectations. The known anomalies southeast and northeast of the JO siting region can be explained by the local hydrogeo-logical and tectonic setting.
This section provides an overview of the temperature conditions in the three siting regions. Further information related to the geothermal conditions, including details on the thermal properties of the relevant units and on the thermo-hydraulic conditions at site scale, can be found in Nagra (2024w).
Formation temperatures have been obtained from wireline temperature logging performed in the BOZ1, BOZ2, BUL1, STA2, STA3, MAR1 and TRU1 TBO boreholes several months after borehole completion (see Tab. 2‑1 for references to the corresponding data reports). In addition, in the BOZ1, STA3 and MAR1 boreholes, long-term temperature monitoring systems were installed (Longridge et al. 2024). The temperatures show the expected depth dependence (Fig. 4‑135) with gradients dependent on the respective lithologies and, in the case of the potential aquifers, also possible flow (and hence transmissivities). The temperature profiles do not provide evidence for previously unknown significant transmissive zones.
For boreholes with a long-term monitoring system, geothermal gradients have been calculated under the assumption of a yearly average surface temperature of 10 °C, resulting in average gradients of 44 and 47 °C/km (BOZ1: 47 °C/km, STA3 and MAR1: 44 °C/km). These values are in the expected range for Northern Switzerland and there are no relevant site-specific differences.
Geothermal gradients within the lithological units correlate well between the boreholes. For the Opalinus Clay, the gradients are comparably high (7 – 7.5 °C/100 m). Such high gradients are typical for clay-rich rocks with a low thermal conductivity (~ 1.5 W/mK for the Opalinus Clay; Nagra 2024w), whereas carbonates display a low thermal gradient and high thermal conductivity (~ 4 W/mK for carbonates from the Muschelkalk aquifer; Nagra 2024w).
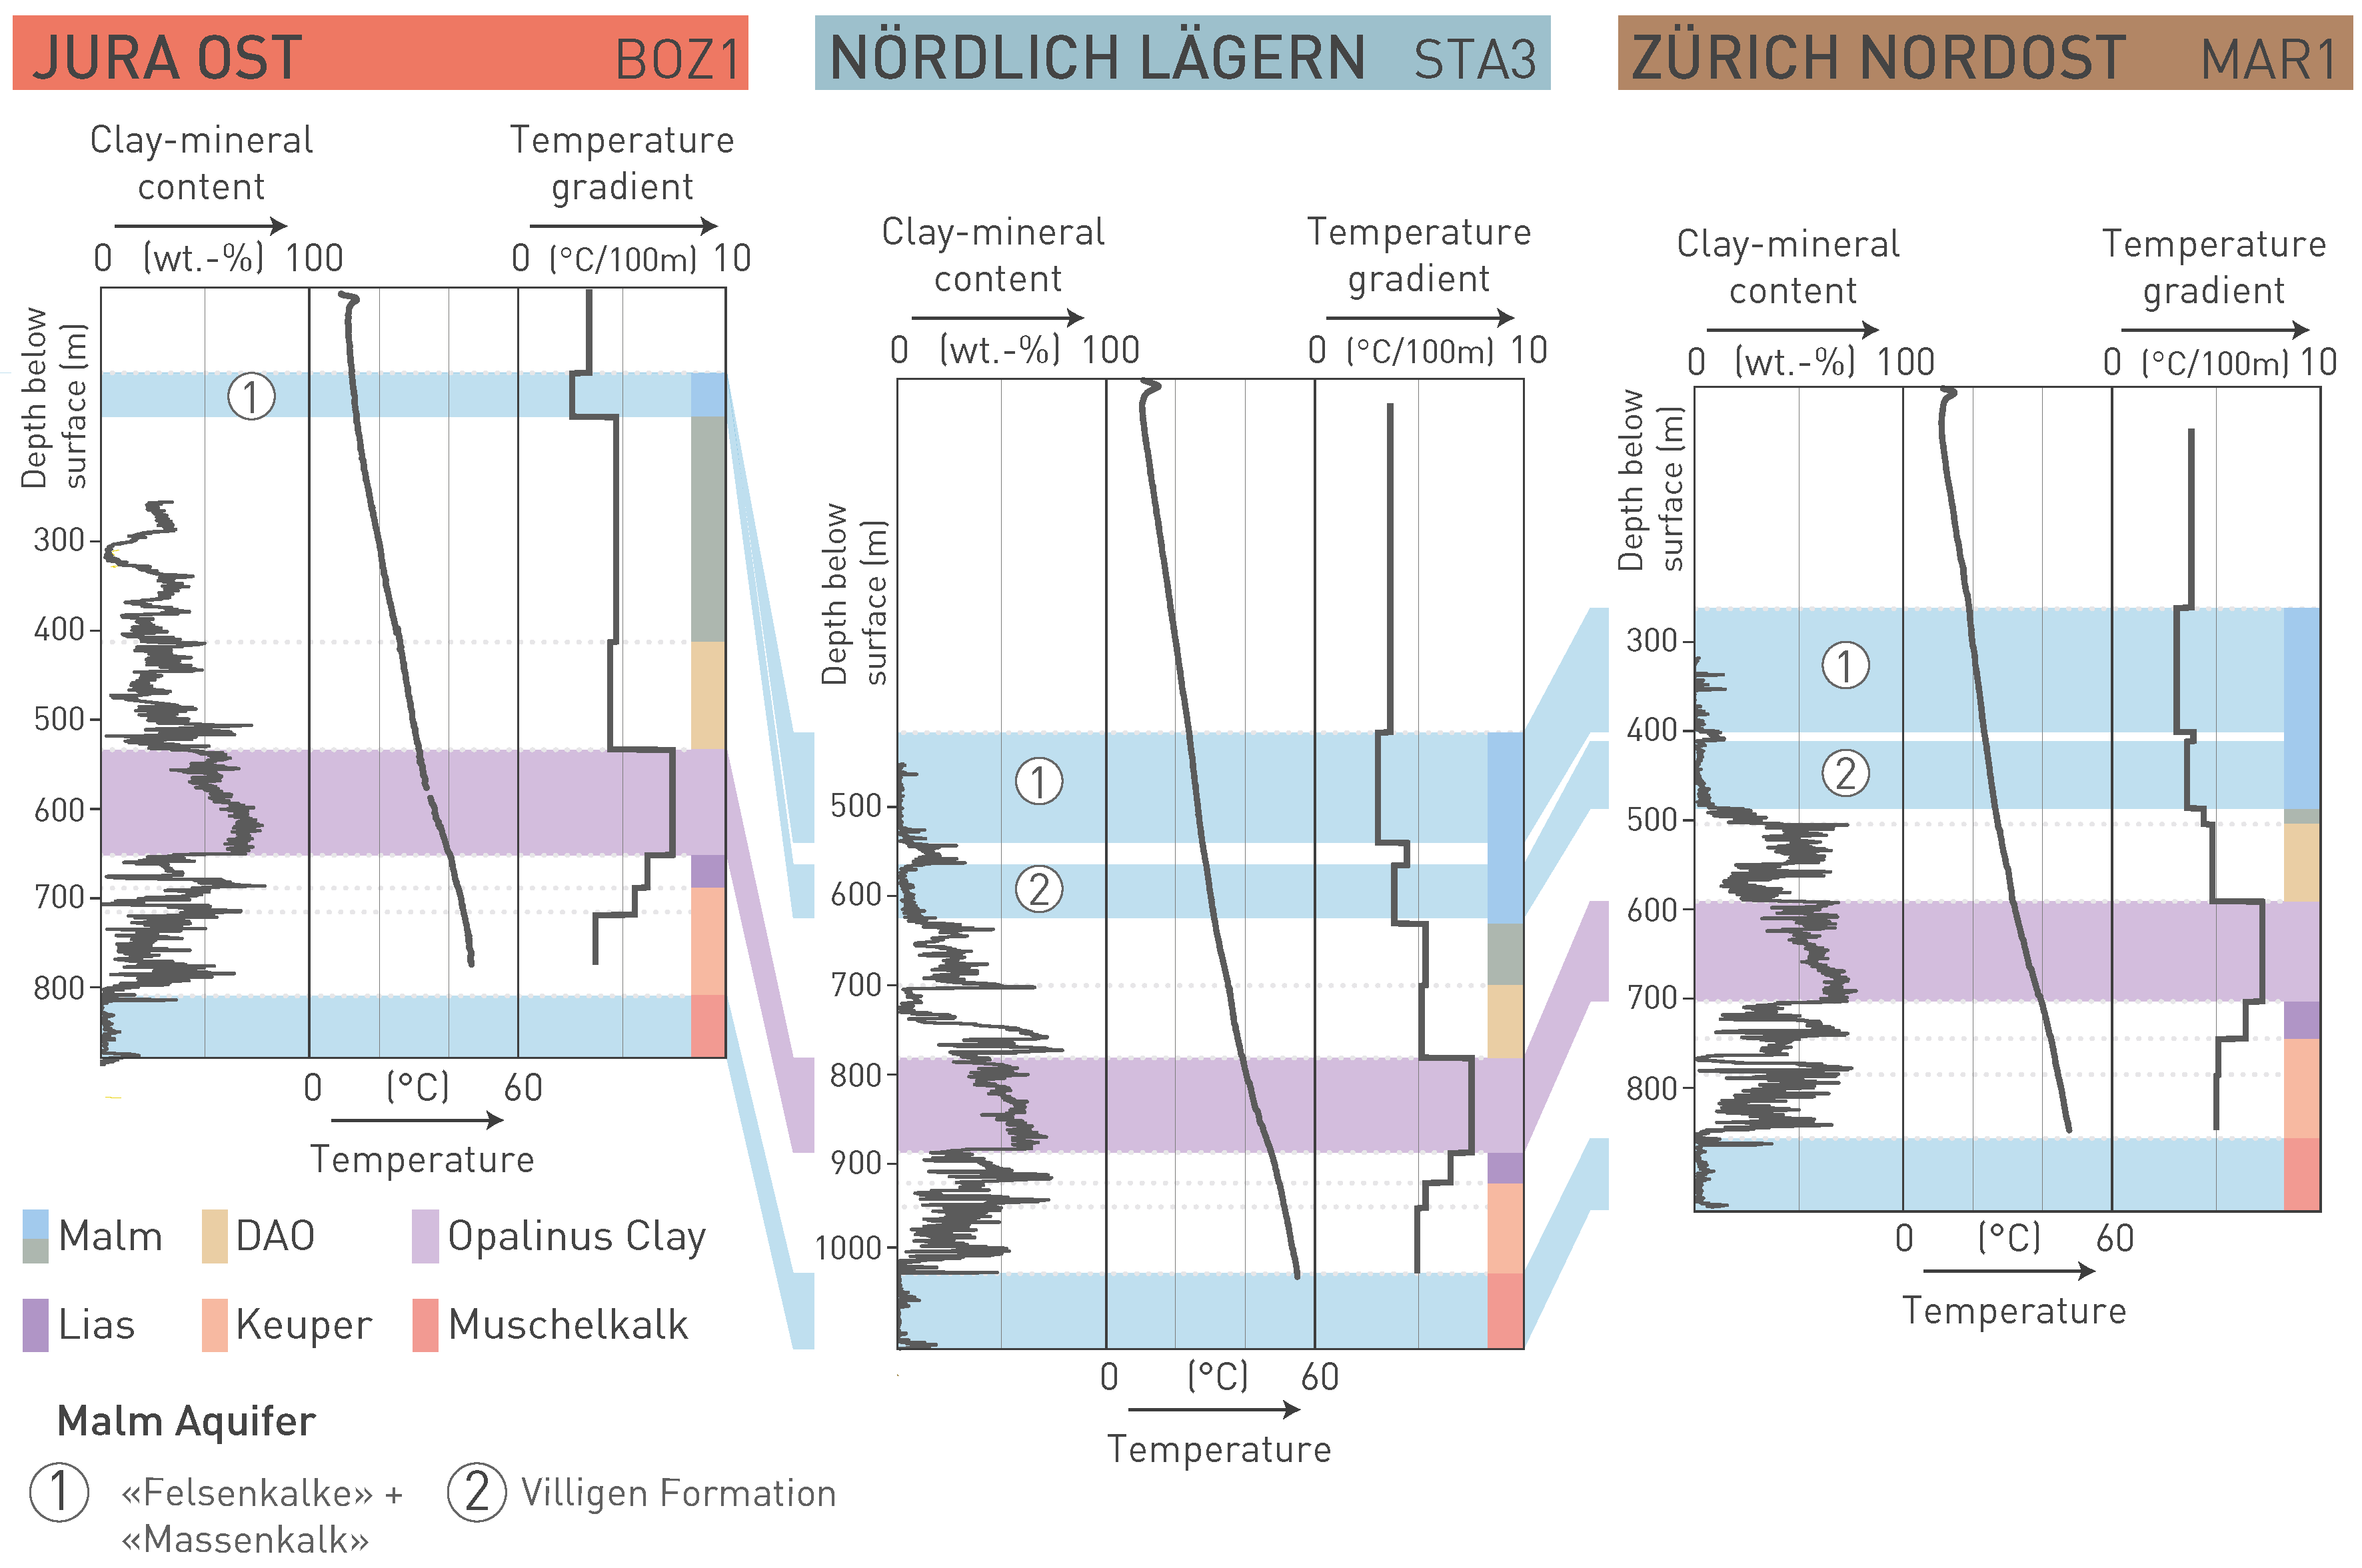
Fig. 4‑135:Temperature profiles and lithology-dependent temperature gradients
Shown here are temperature measurements from the fibre-optic long-term monitoring system together with calculated temperature gradients (for the borehole and for each unit) and the corresponding clay-mineral content. Note the increased temperature gradients in units with high clay-mineral contents.
Measured temperatures for mid Opalinus Clay in the siting regions correlate well with depth and range from 28 °C (510 m below surface, BOZ2 borehole) to 45 °C (940 m below surface, BUL1 borehole) (Fig. 4‑136). For mid Malm and mid Muschelkalk aquifers, the observed temperatures are 6 – 32 °C and 45 – 58 °C for, respectively (Fig. 4‑136).
The heatflow map of Northern Switzerland (Schärli & Rybach 2002, published in Nagra 2002), shows two distinct thermal anomalies:
-
The first anomaly is located south to southeast of JO, approximately between Baden and Schinznach. This anomaly is located along the Jura Main Thrust and the southern limit of the Konstanz – Frick Trough (Fig. 4‑55). Hydrogeologically, this zone reflects the regional discharge area for the Muschelkalk aquifer south of the Jura Main Thrust (Fig. 4‑102; Nagra 2024n). The upwelling thermal waters feed the well-known thermal springs of Baden and Bad Schinznach which are located where the Limmat and Aare cut through the easternmost Internal Jura.
-
The second anomaly is located to the northeast of JO, in the lower Aare Valley, just north of the Konstanz – Frick Trough. This is slightly to the south of the regional discharge area of the Muschelkalk aquifer for the flow system north of the Jura Main Thrust (Fig. 4‑102). In addition, it is an area with known upward-directed hydraulic gradients in the crystalline basement. These can be explained by recharge in the Black Forest hilly area and the overall low hydraulic conductivity of the Konstanz – Frick Trough preventing further southbound flow (Voborny et al. 1994). See Nagra (2014g, Dossier VII) and Rybach (2009) for further discussion.
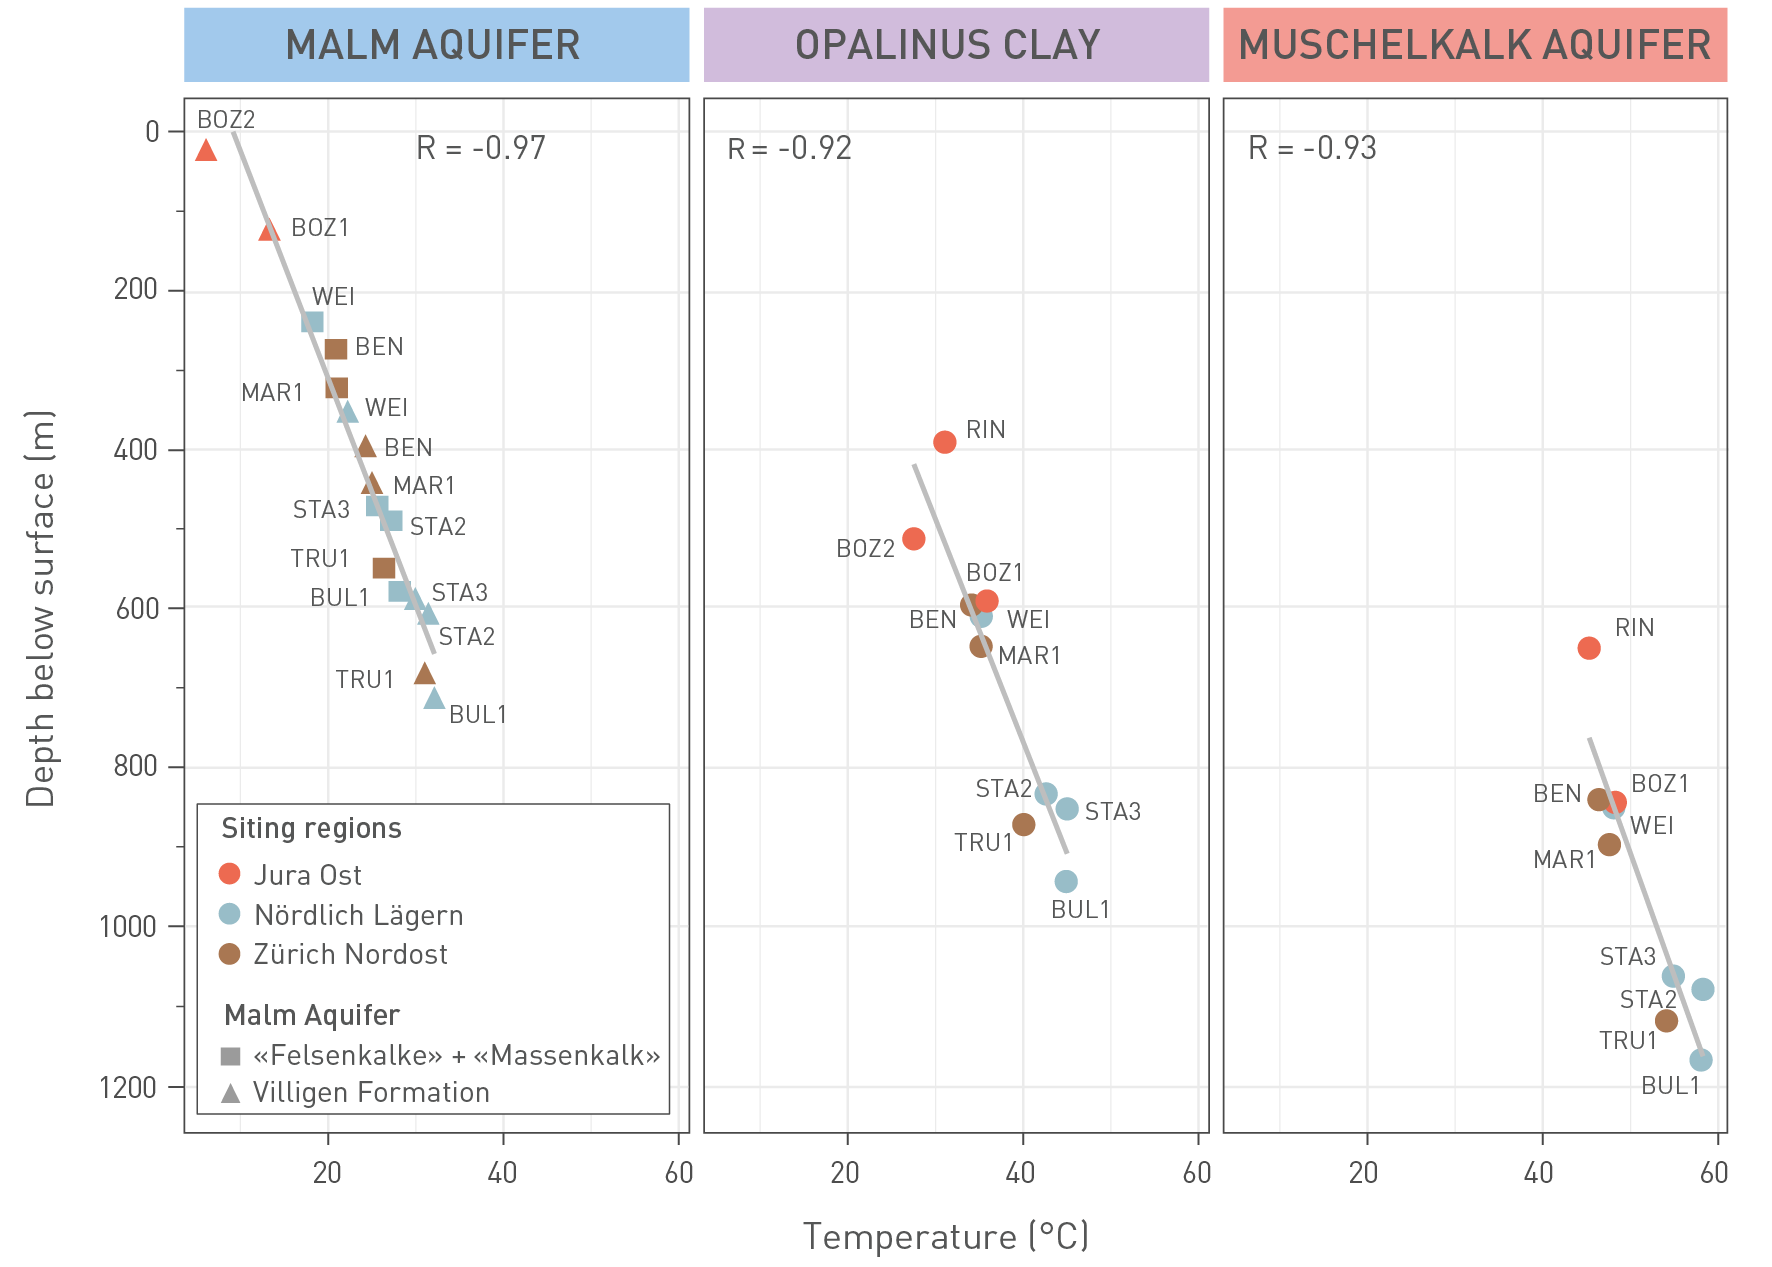
Fig. 4‑136:Cross-plots of temperature (°C) vs. depth below surface (m) for the Malm aquifer, Opalinus Clay and Muschelkalk aquifer
Data points are colour-coded according to the siting regions. Temperature values were taken from the centre of the respective unit. For the Muschelkalk aquifer of STA3, the given temperature corresponds to the top of the unit, as no data are available for the deeper part. Where data from the long-term monitoring system and temperature logging exist, the data from the long-term monitoring system were selected. Note that the value for the Malm aquifer in BOZ2 is influenced by seasonal temperature variation. The data show linear relationships between depth and temperature.
To conclude, these thermal anomalies can be explained by the local hydrogeological and tectonic setting favouring heat transport towards these zones. The situation in the potential disposal zones of the three siting regions is different. Here, the observed temperature profiles can be modelled reasonably well with a constant basal heat flow (Nagra 2024w).
This section summarises important findings of Chapter 4. Observations from deep boreholes and key parameters are compiled site-specifically by projection to a reference borehole (Fig. 4‑137, Fig. 4‑138, Fig. 4‑139). This forms the basis for the site-specific delineation of the low-permeability confining units (Fig. 4‑140).
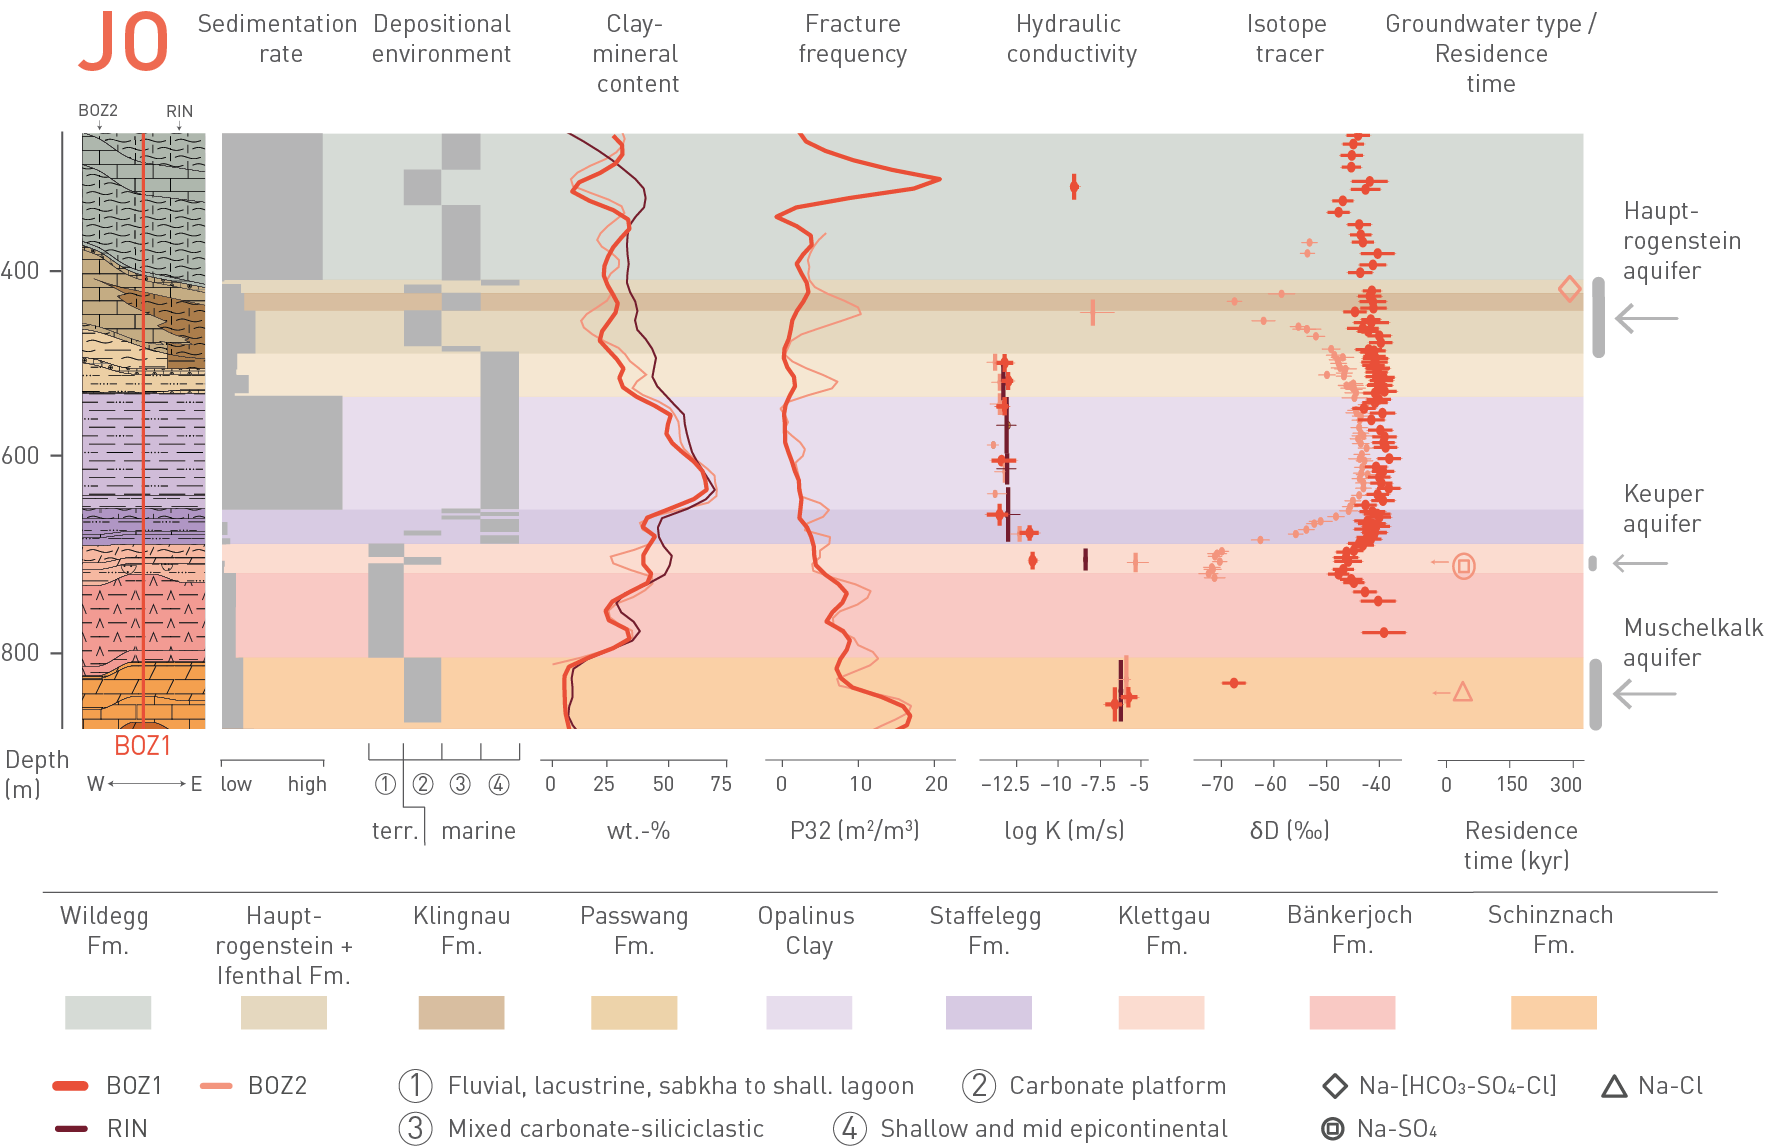
Fig. 4‑137:Key observations between Muschelkalk and Hauptrogenstein aquifers in JO
Data from the BOZ2 and RIN boreholes are projected to the reference borehole BOZ1. The arrows next to the groundwater symbols indicate maximum residence times. Fracture frequency and clay-mineral-content regression lines were smoothed with a moving average. shall.: shallow.
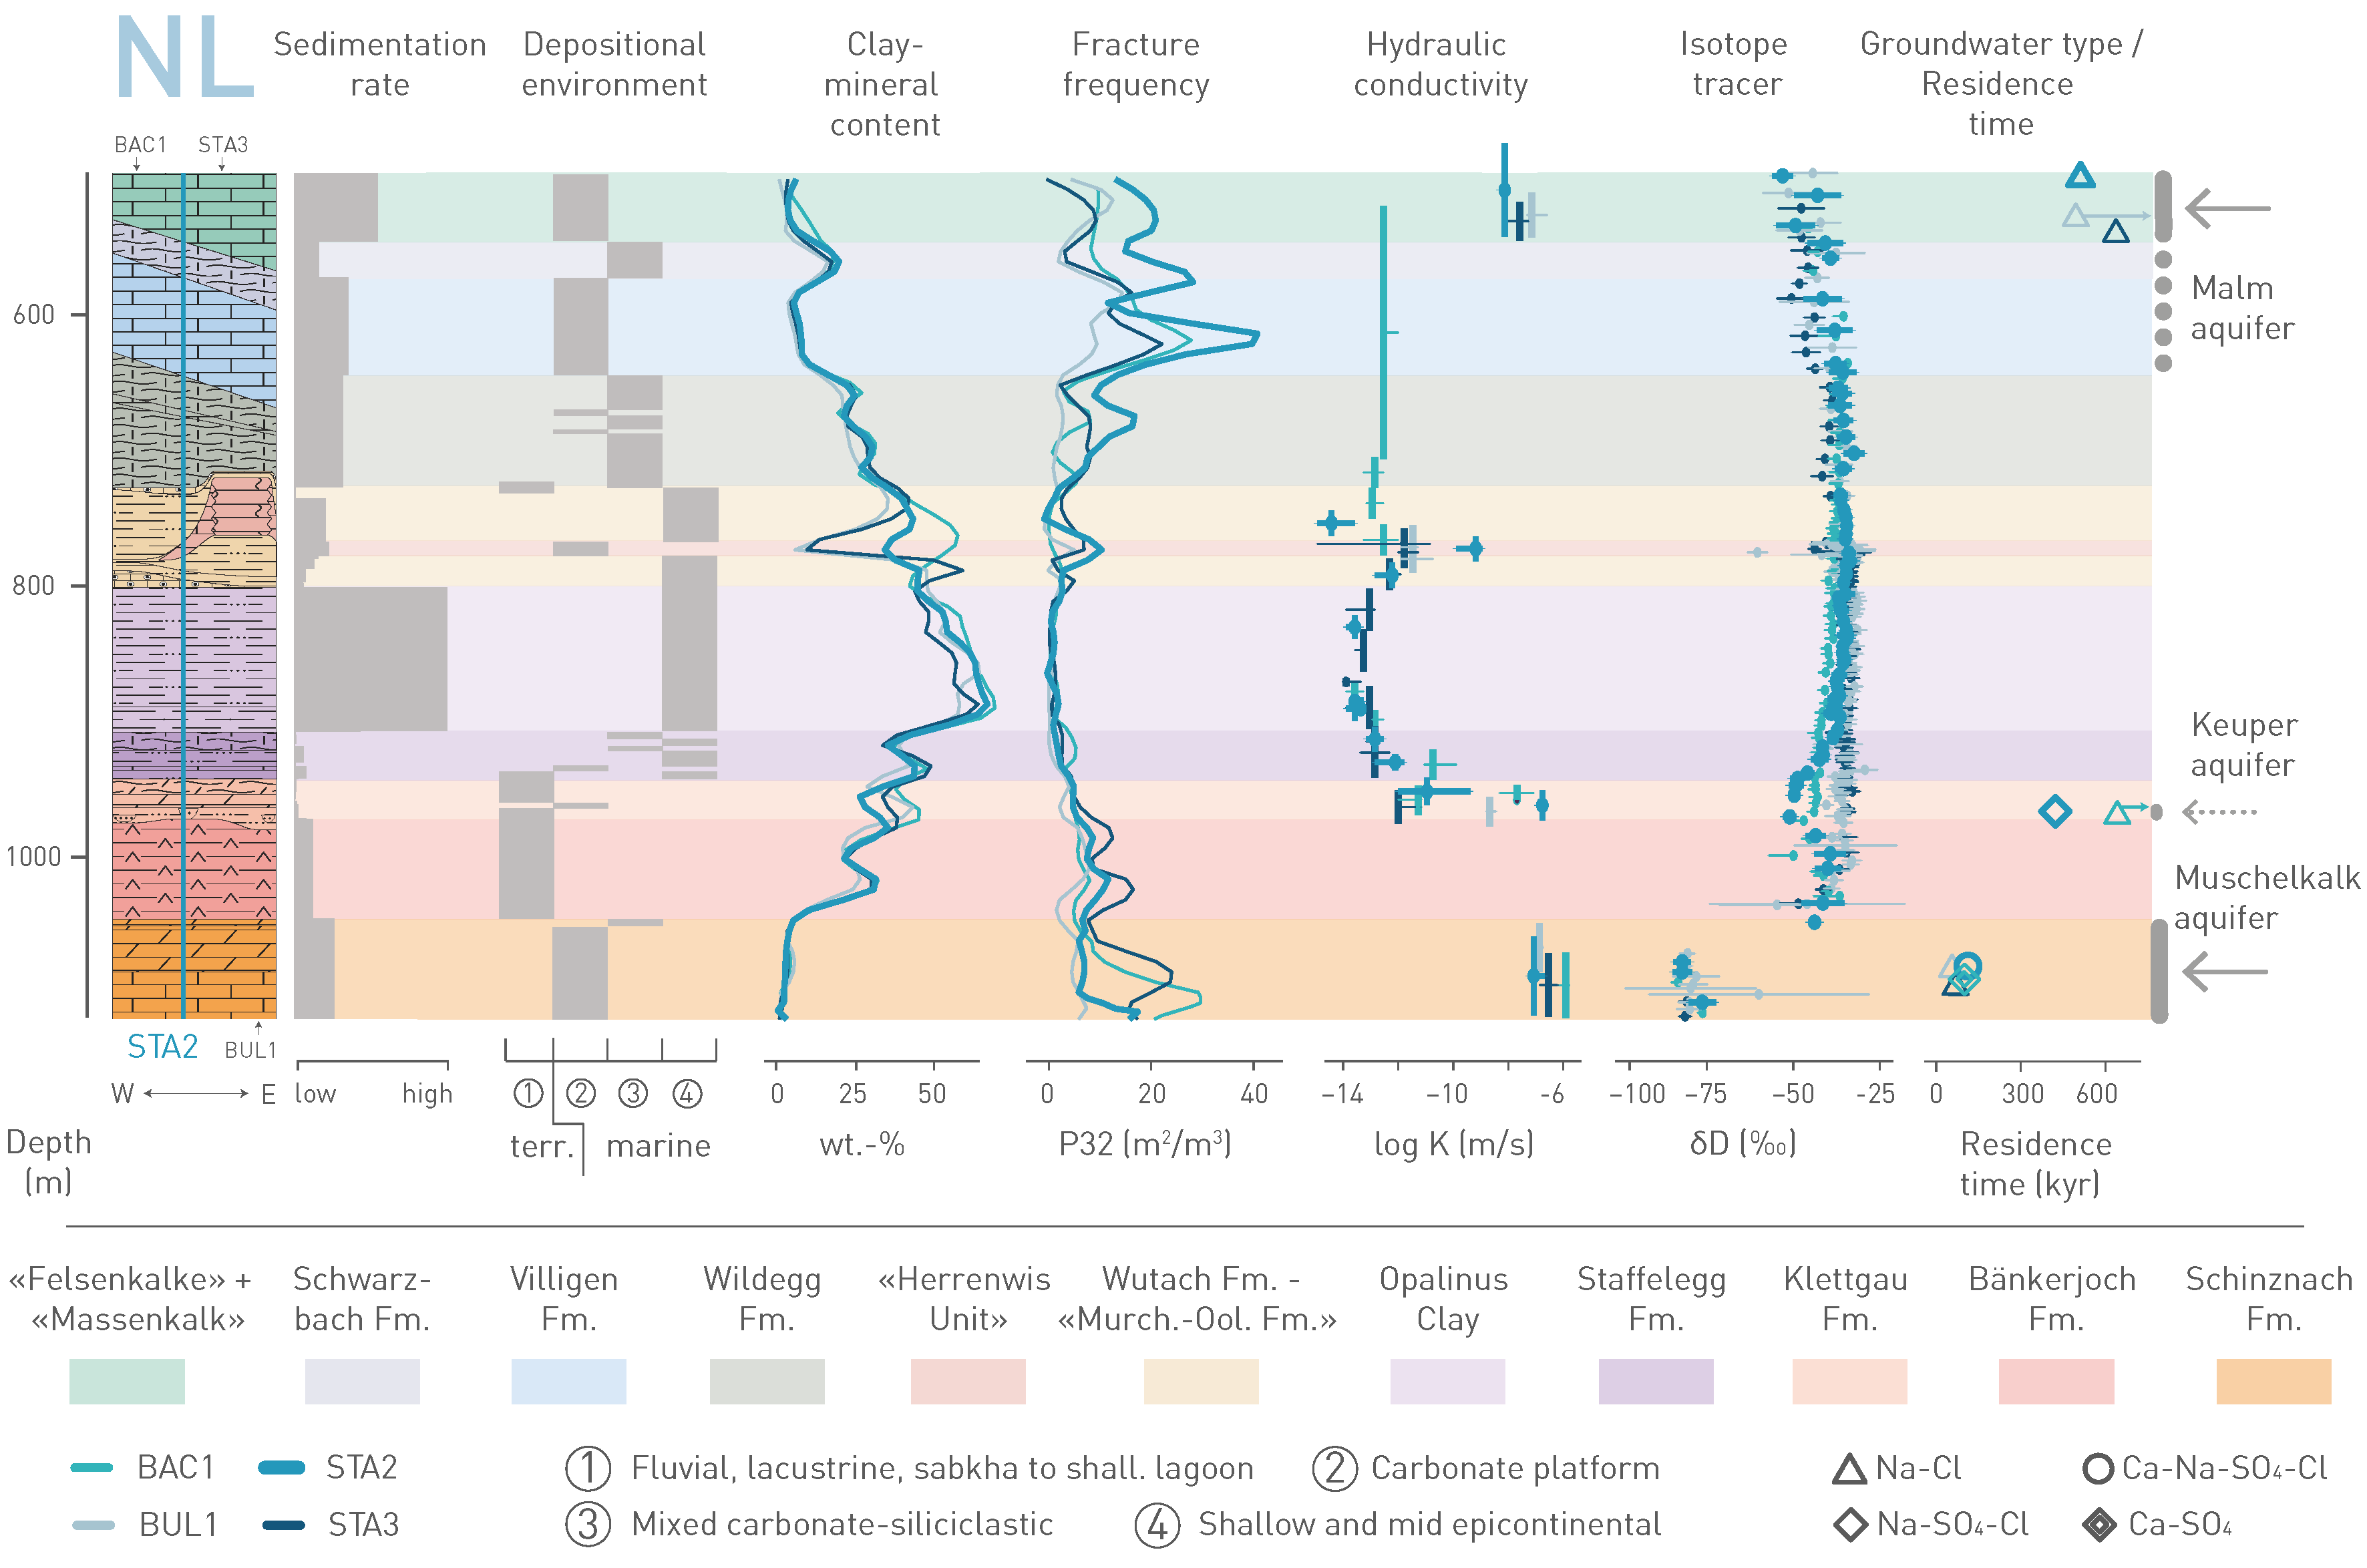
Fig. 4‑138:Key observations between Muschelkalk and Malm aquifers in NL
Data from the BAC1, BUL1 and STA3 boreholes are projected to the reference borehole STA2. The arrows next to the groundwater symbols indicate minimum residence times. Fracture frequency and clay-mineral-content regression lines were smoothed with a moving average. shall.: shallow.
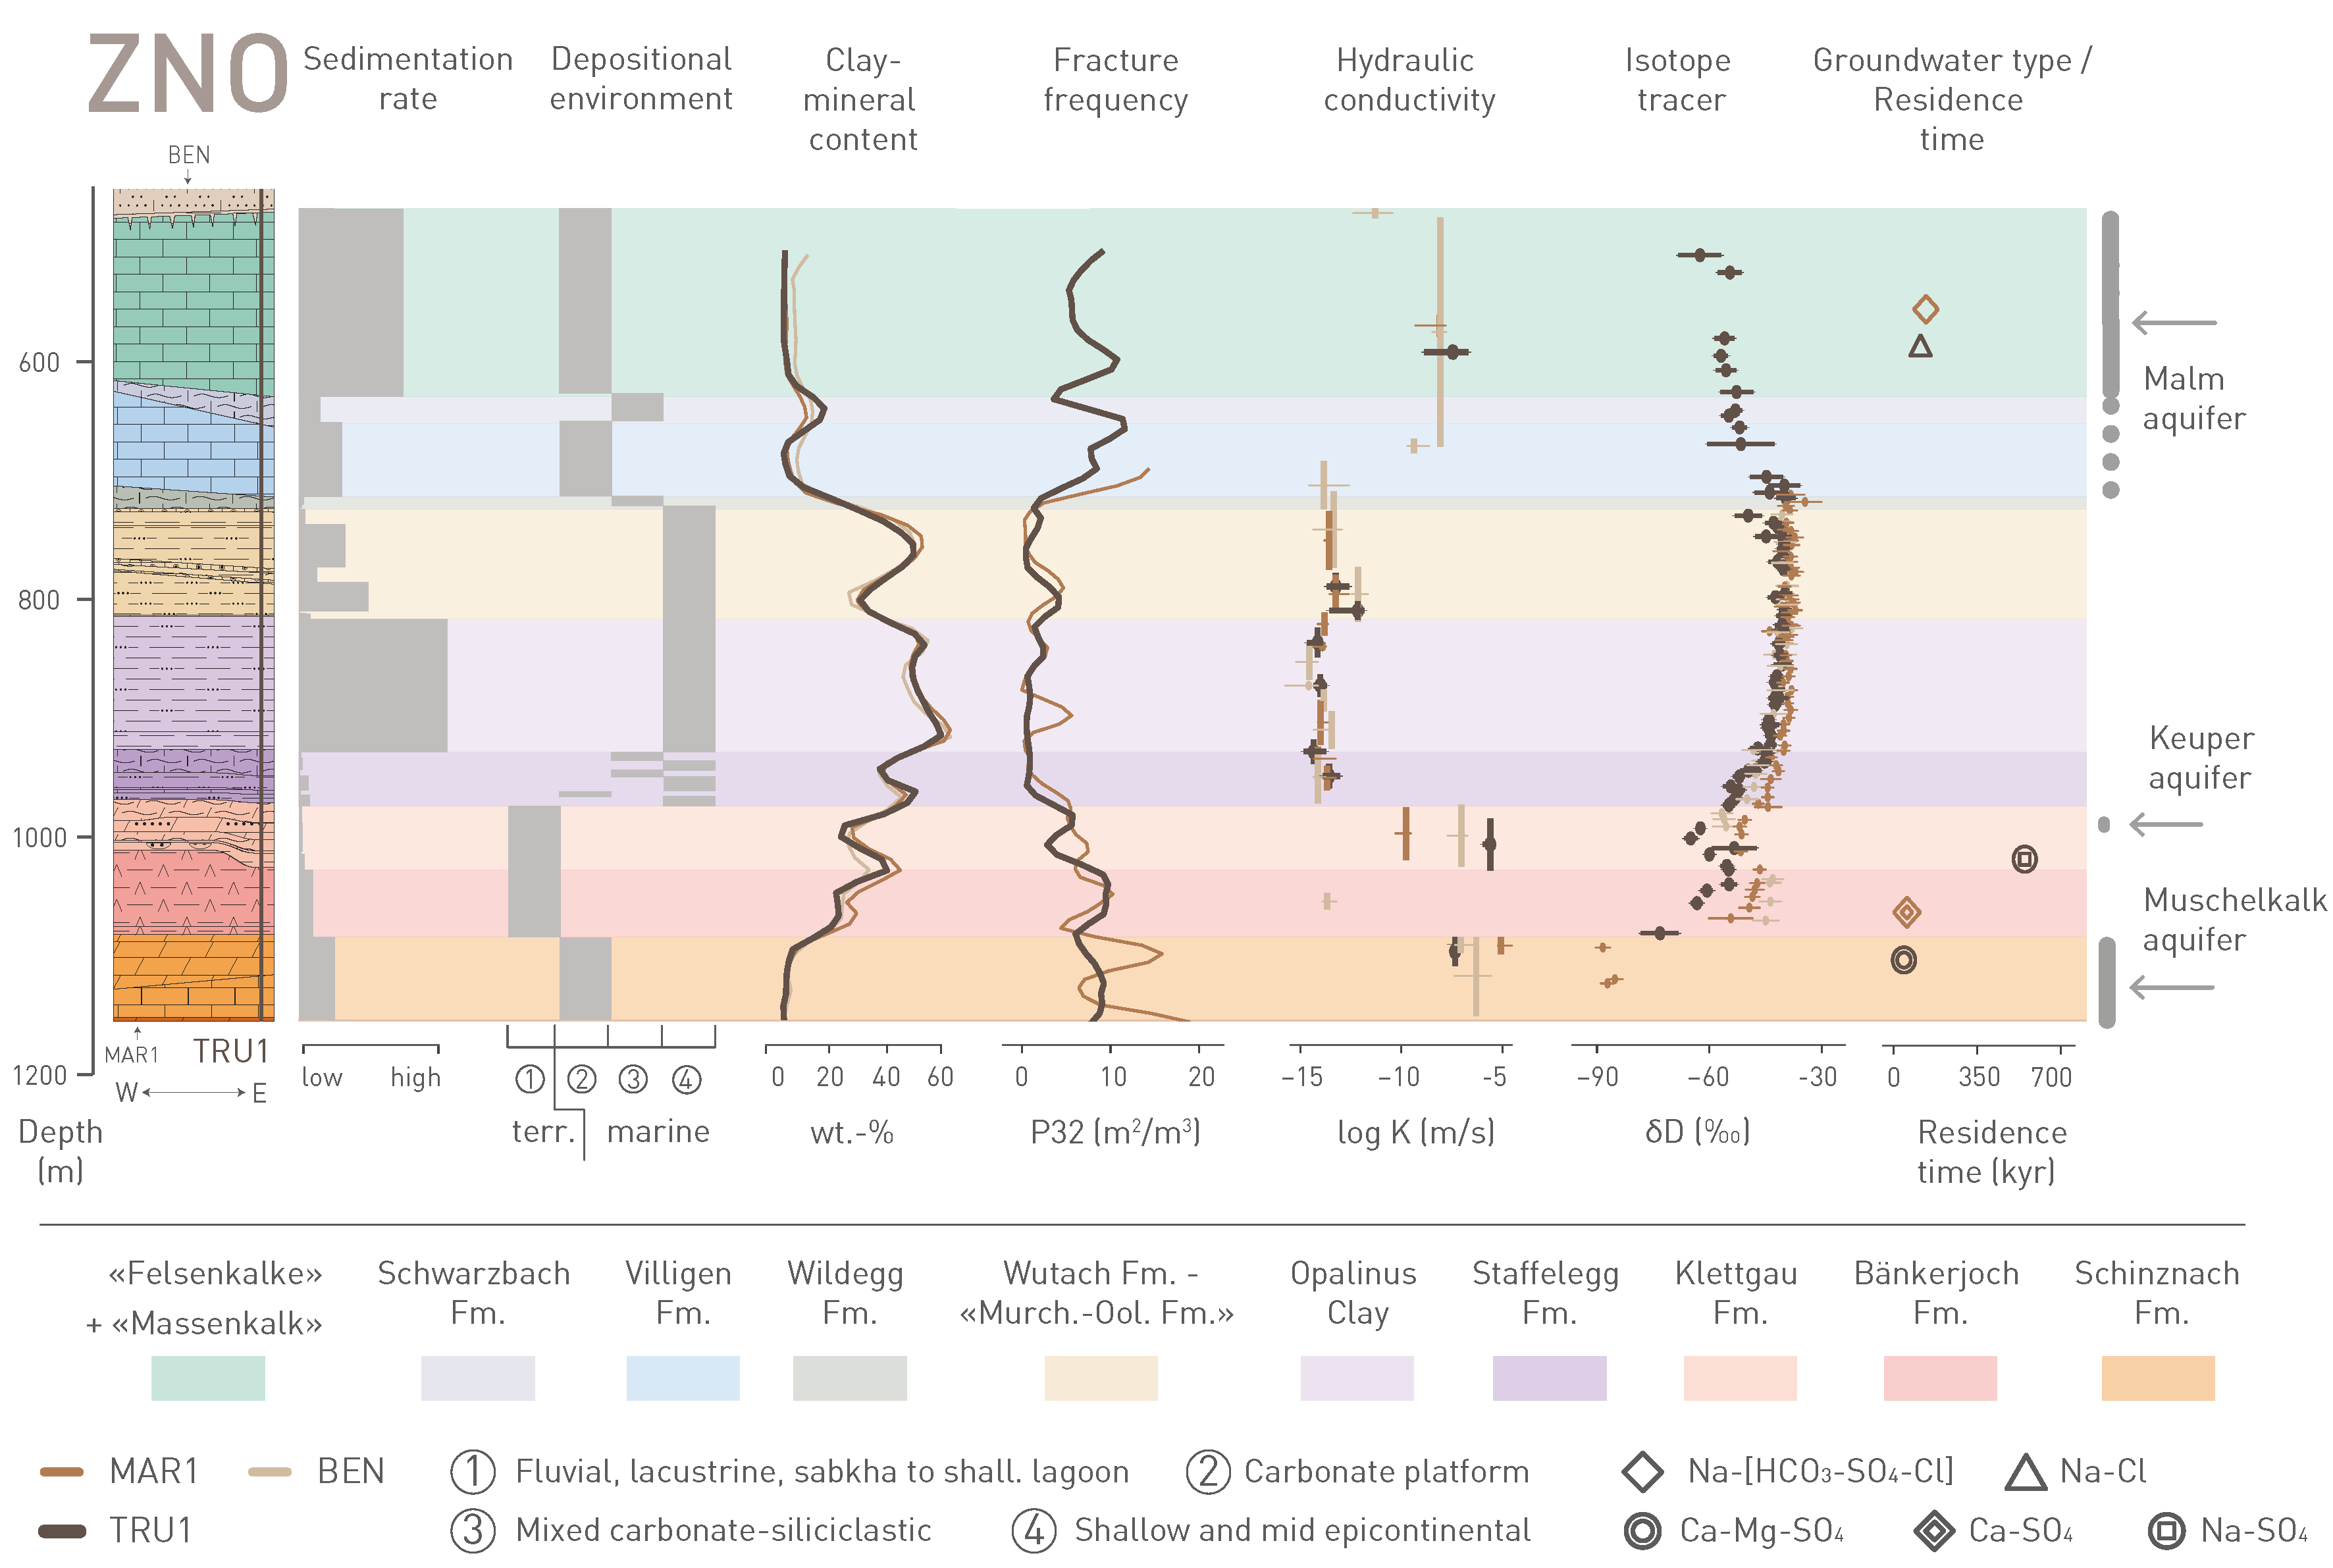
Fig. 4‑139:Key observations between Muschelkalk and Malm aquifers in ZNO
Data from the MAR1 and BEN boreholes are projected to the reference borehole TRU1. Fracture frequency and clay-mineral-content regression lines were smoothed with a moving average. shall.: shallow.
With regard to the barrier function, the geological units presented in Fig. 4‑137, Fig. 4‑138 and Fig. 4‑139 can be allocated to three groups with similar characteristics: Host rock, low-permeability confining units and deep aquifers:
-
The Opalinus Clay host rock is the core of the transport barrier. It is characterised by a small lateral variability compared to other Mesozoic formations in Northern Switzerland. This is related to the depositional environment represented by a shallow epicontinental sea with a high clay-mineral input (comparably high sedimentation rates). The general subfacies succession can be correlated between all boreholes across the siting regions. The fracture frequency is lower compared to more competent units. Numerous hydraulic packer tests demonstrate a very low hydraulic conductivity. This is consistent with the straight profiles of isotope tracers, with no indications for localised flow.
-
Above and below the host rock, the natural barrier is complemented by low-permeability confining units in all the siting regions. Overall, these show characteristics similar to the host rock, but with greater lithological heterogeneity (e.g. intercalated sandy and calcareous beds) and larger differences between the siting regions, particularly in the Dogger Group above Opalinus Clay. For example, the clay-mineral-rich units directly above the Opalinus Clay include more calcareous and sandy beds in JO and ZNO compared to NL and are generally more clay-mineral-rich in NL. In the eastern part of NL, particularly clay-mineral-rich units are overlain by a ca. 40 m thick isolated carbonate platform («Herrenwis Unit»). The lithological differences in the confining units reflect local changes in the depositional environment, which were strongly influenced by bottom currents. The clay-mineral content in the confining units is more variable but, overall, still high. This favours a more ductile deformation behaviour and is consistent with low overall fracture frequency, as observed in the Opalinus Clay. The hydraulic tests show low hydraulic conductivities, which is consistent with the shape of tracer profiles with no indication for groundwater flow. This indicates diffusion-dominated transport in the host rock and confining units over long timescales.
-
The confining units are bounded at the top and at the base by deep aquifers. The situation differs across the siting regions:
JO: The low-permeability zone is located between the regional Hauptrogenstein aquifer and the local Keuper aquifer. The carbonate platform of the Hauptrogenstein, known as a regional aquifer further to the west, extends into the JO siting region. This is demonstrated by the measured enhanced hydraulic conductivities and by the shape of the natural tracer profiles in the BOZ2 borehole. To the east, there is a facies transition to the clay-mineral-rich Klingnau Formation. Probably related to the facies transition, no transmissive section was drilled in the eastern boreholes (RIN and BOZ1). Residence times of the groundwater sample of the BOZ2 borehole is high, but the salinity and the water isotope composition indicate more interaction with meteoric waters in the past compared to most of samples from the Malm aquifer in NL and ZNO. The lower confining units are bounded by the Keuper aquifer, which is probably linked to the fractured dolomitic Gansingen Member, as indicated by hydraulic tests and tracer profiles. The 81Kr model age for the BOZ2 Keuper aquifer groundwater are low, probably due to sampling close to the recharge area.
NL: The regional Malm and the local Keuper aquifer, which was observed in some boreholes only, define the vertical extent of the low-permeability zone. In the stiffer limestone units of the Malm Group, fracture frequencies are higher compared to the weaker units below (e.g. the Opalinus Clay, Staffelegg Formation). The hydraulic tests indicate water flow related to fractures, mainly in the upper part of the limestone series («Felsenkalke» and «Massenkalk»). The Malm groundwaters contain varying contents of fossil Na-Cl water of marine origin. In NL, the marine component is particularly large and, together with long groundwater residence times, indicates quasi-stagnant conditions. In contrast to the other siting regions, indications for water flow in the Keuper aquifer are limited to sandstone channels (Ergolz Member), which only occur locally. Indications for enhanced hydraulic conductivities were only observed in two boreholes, however, with high groundwater residence times. The very local occurrence of the Keuper aquifer means that it is possible that stratigraphically deeper units, down to the Muschelkalk aquifer, contribute to the barrier function in NL (potential additional confining units in Fig. 4‑140).
ZNO: The low permeability zone is delimited by the Malm and the Keuper aquifers, respectively. As in NL, water flow in the Malm aquifer is related to fractures and is located mainly in the upper part («Felsenkalke» and «Massenkalk»). The water isotopic composition and the residence times indicate a slightly more active system compared to NL, particularly in the eastern part which is characterised by lower overburden thickness. In the Keuper aquifer, there are consistent indications for water flow in the Seebi Member from all boreholes in this area (hydraulic tests and/or tracer profiles). The Seebi Member is relatively thick in ZNO and includes a porous dolomitic breccia and sandstones. Groundwater residence times are large.
The regional Muschelkalk aquifer occurs in all the siting regions and represents the most dynamic flow system as demonstrated by comparably high hydraulic conductivities, clear signatures in tracer profiles and comparably low groundwater residence times.
A comparison of the lithological and hydrogeological situation between the three siting regions is shown in Fig. 4‑140. Regarding the barrier efficiency, the thickness of the host rock and confining units is an important characteristic. The distance between the centre of the host rock and the next overlying aquifer is largest in NL and smallest in JO. The distance between the centre of the host rock to the closest underlying aquifer (Keuper aquifer) delimiting the lower confining units is similar in all the siting regions. However, because of the peculiar, very local nature of the Keuper aquifer in NL, the units down to the Muschelkalk aquifer could contribute to the barrier function.
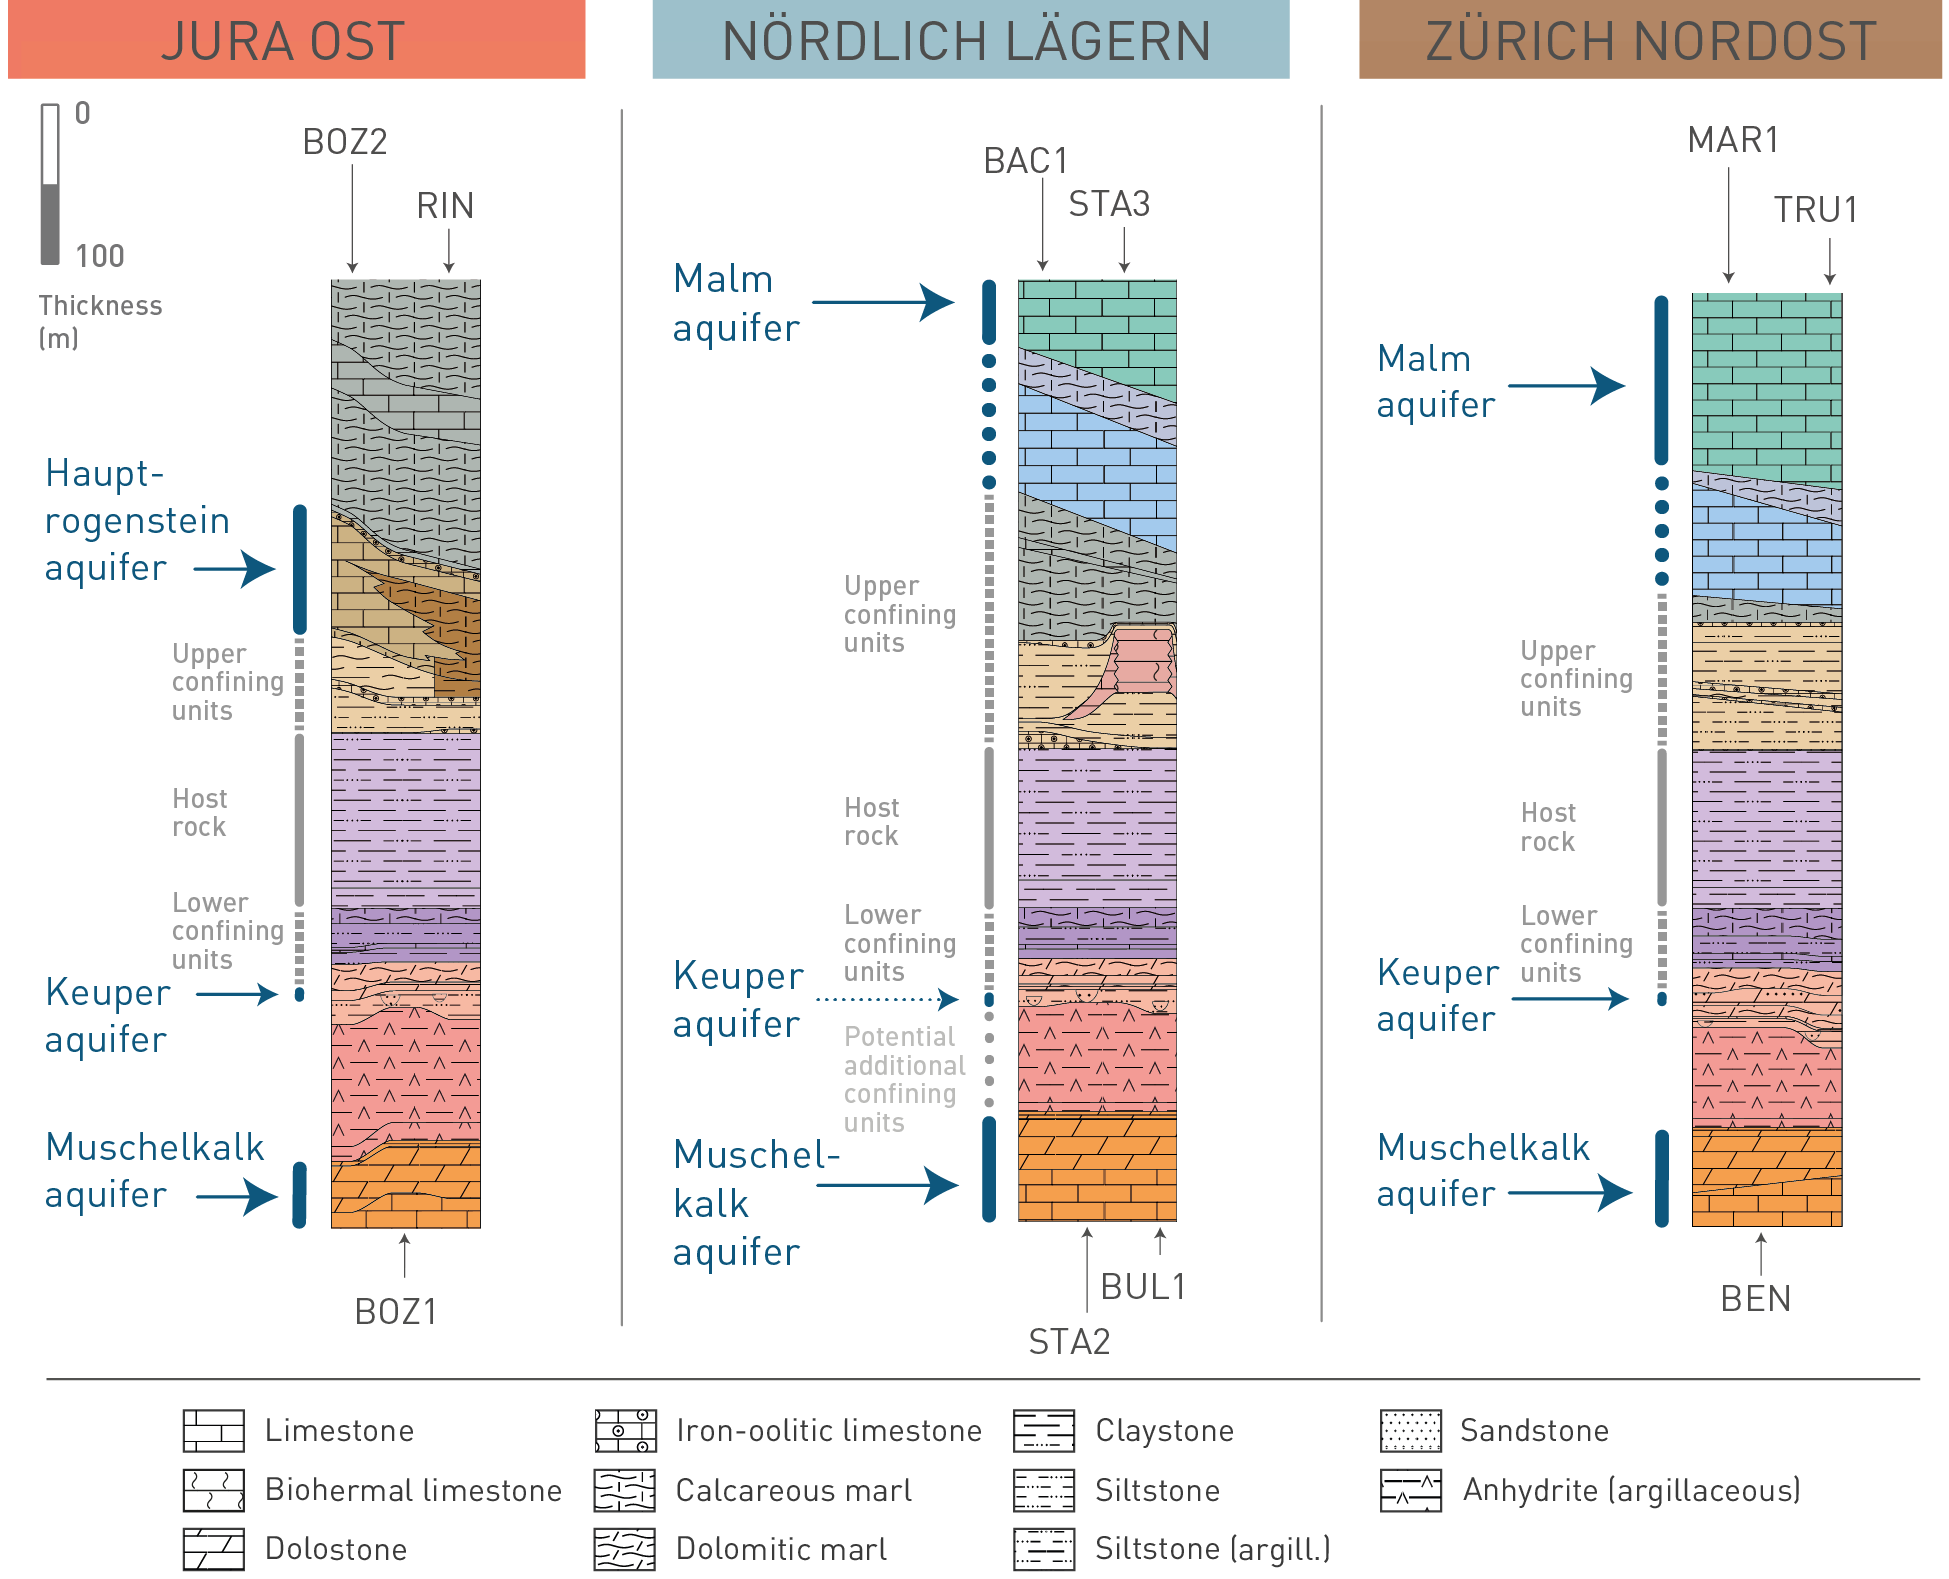
Fig. 4‑140:Extent of host rock and low-permeability confining units and location of neighbouring aquifers for the JO, NL and ZNO siting regions
Key datasets guiding the extent of the host rock and confining units are shown in Fig. 4‑137, Fig. 4‑138 and Fig. 4‑139. Note that the distance between the centre of the host rock and the next aquifer above is largest in NL. The distance to the lower aquifer is similar in all the siting regions. As a result of the peculiar, much more local nature of the Keuper aquifer in NL (see discussion in text), the anhydrite- and clay-mineral-rich units of the lower Keuper may contribute to the barrier function as additional confining units.
Besides these observations, the following aspects discussed in Chapter 4 are regarded as particularly relevant:
-
With respect to the lateral extent of the potential repository zone and the flexibility for the placement of the disposal areas, all the siting regions show areas devoid of seismically mappable faults. In NL this area is the largest.
-
The geological past provided numerous evidence for reactivation of larger structures, such as the regional fault zones, during later deformation episodes. This preference to reactivate pre-existing structures over the formation of new faults is anticipated to continue in future (Section 6.2).
-
Present-day orientation of SHmax was confirmed and is roughly NNW-SSE-trending in all the siting regions. The orientation of SHmax across the entire Mesozoic sequence and especially across the evaporitic units and the Opalinus Clay is indicative of a relatively stable present-day stress field.
-
Overall, the independent evidence gained from ground- and porewater investigations provides valuable insights into the past transport processes in the aquitard/aquifer system in the siting regions over timescales spanning several orders of magnitudes (ca. 104 to 107 years). In all the siting regions, the barrier efficiency is demonstrated by the profiles of natural tracers in porewater, which are best explained by molecular diffusion being the dominant transport mechanism. The isotopic composition of the Opalinus Clay porewater indicates a larger fraction of old porewater and a smaller overprint by meteoric water in NL, compared to the other siting regions.
-
The high contents of the noble gas isotope 4He in Opalinus Clay porewater demonstrate the strong barrier efficiency: Concentrations are more than 4 orders of magnitude higher than for air-saturated water. More than 65% of the He produced in Opalinus Clay since deposition is still present.
-
The study of mineral-filled fractures ('veins') indicates the evolution of the mineral-forming fluids from modified seawater-type prior to the Eocene times towards more meteoric waters in the Cenozoic. This trend resulted from subaerial exposure since at least Eocene times, which led to karstification in the top of the Malm Group, deposition of the Bohnerz Formation (Siderolithic Group) and downward migration of meteoric surface waters. The investigated veins in the Opalinus Clay were precipitated from fluids with less negative δ18O values than today’s porewater at higher temperatures. This suggests vein formation prior to Pliocene cooling.
-
Temperatures in the Opalinus Clay and in the Malm and Muschelkalk aquifers correlate well with depth below surface. In the siting regions, no distinct local temperature anomalies are indicated by the new boreholes and by comparison with temperature modelling. The previously known local temperature anomalies in the lower Aare Valley are restricted to the southeast and to the northeast of the JO siting region and can be explained by the local hydrogeological and tectonic setting (probable heat transport in the Muschelkalk aquifer and along basement faults).