
The prevailing orientation of SHmax in the siting regions was constrained by new borehole data using the orientation of borehole breakouts, drilling-induced tensile fractures and fractures generated as a result of MHF testing (Section 4.4.3). The results (Fig. 4‑76) are very much consistent with those predating the new boreholes (Heidbach & Reinecker 2013):
-
SHmax trends in a NNW-SSE orientation, with a small counter-clockwise rotation of SHmax from east to west. The mean SHmax orientation based on the borehole data is 172 ± 9.3° (ZNO), 166 ± 10.8° (NL) and 163 ± 7.6° (JO) (Fig. 4‑76), indicating that SHmax is approximately perpendicular to the arc-shaped Jura Fold-and-Thrust Belt.
-
The dominant SHmax orientation is also stable in the vertical direction, i.e. orientations derived from boreholes (to a depth of 1.3 km) are in general agreement with SHmax orientations derived from earthquake focal mechanisms at much greater depths (up to 30 km; Nagra 2024o).
-
In individual boreholes, the SHmax orientation is relatively stable across the Mesozoic sediments, and across the Opalinus Clay in particular. The few exceptions presenting local variations of SHmax orientations are discussed in Nagra (2024o).
-
A comparison with palaeo-strain data (Madritsch & Hammer 2012) indicates broad consistency of the SHmax orientation with deformation features since Miocene times.
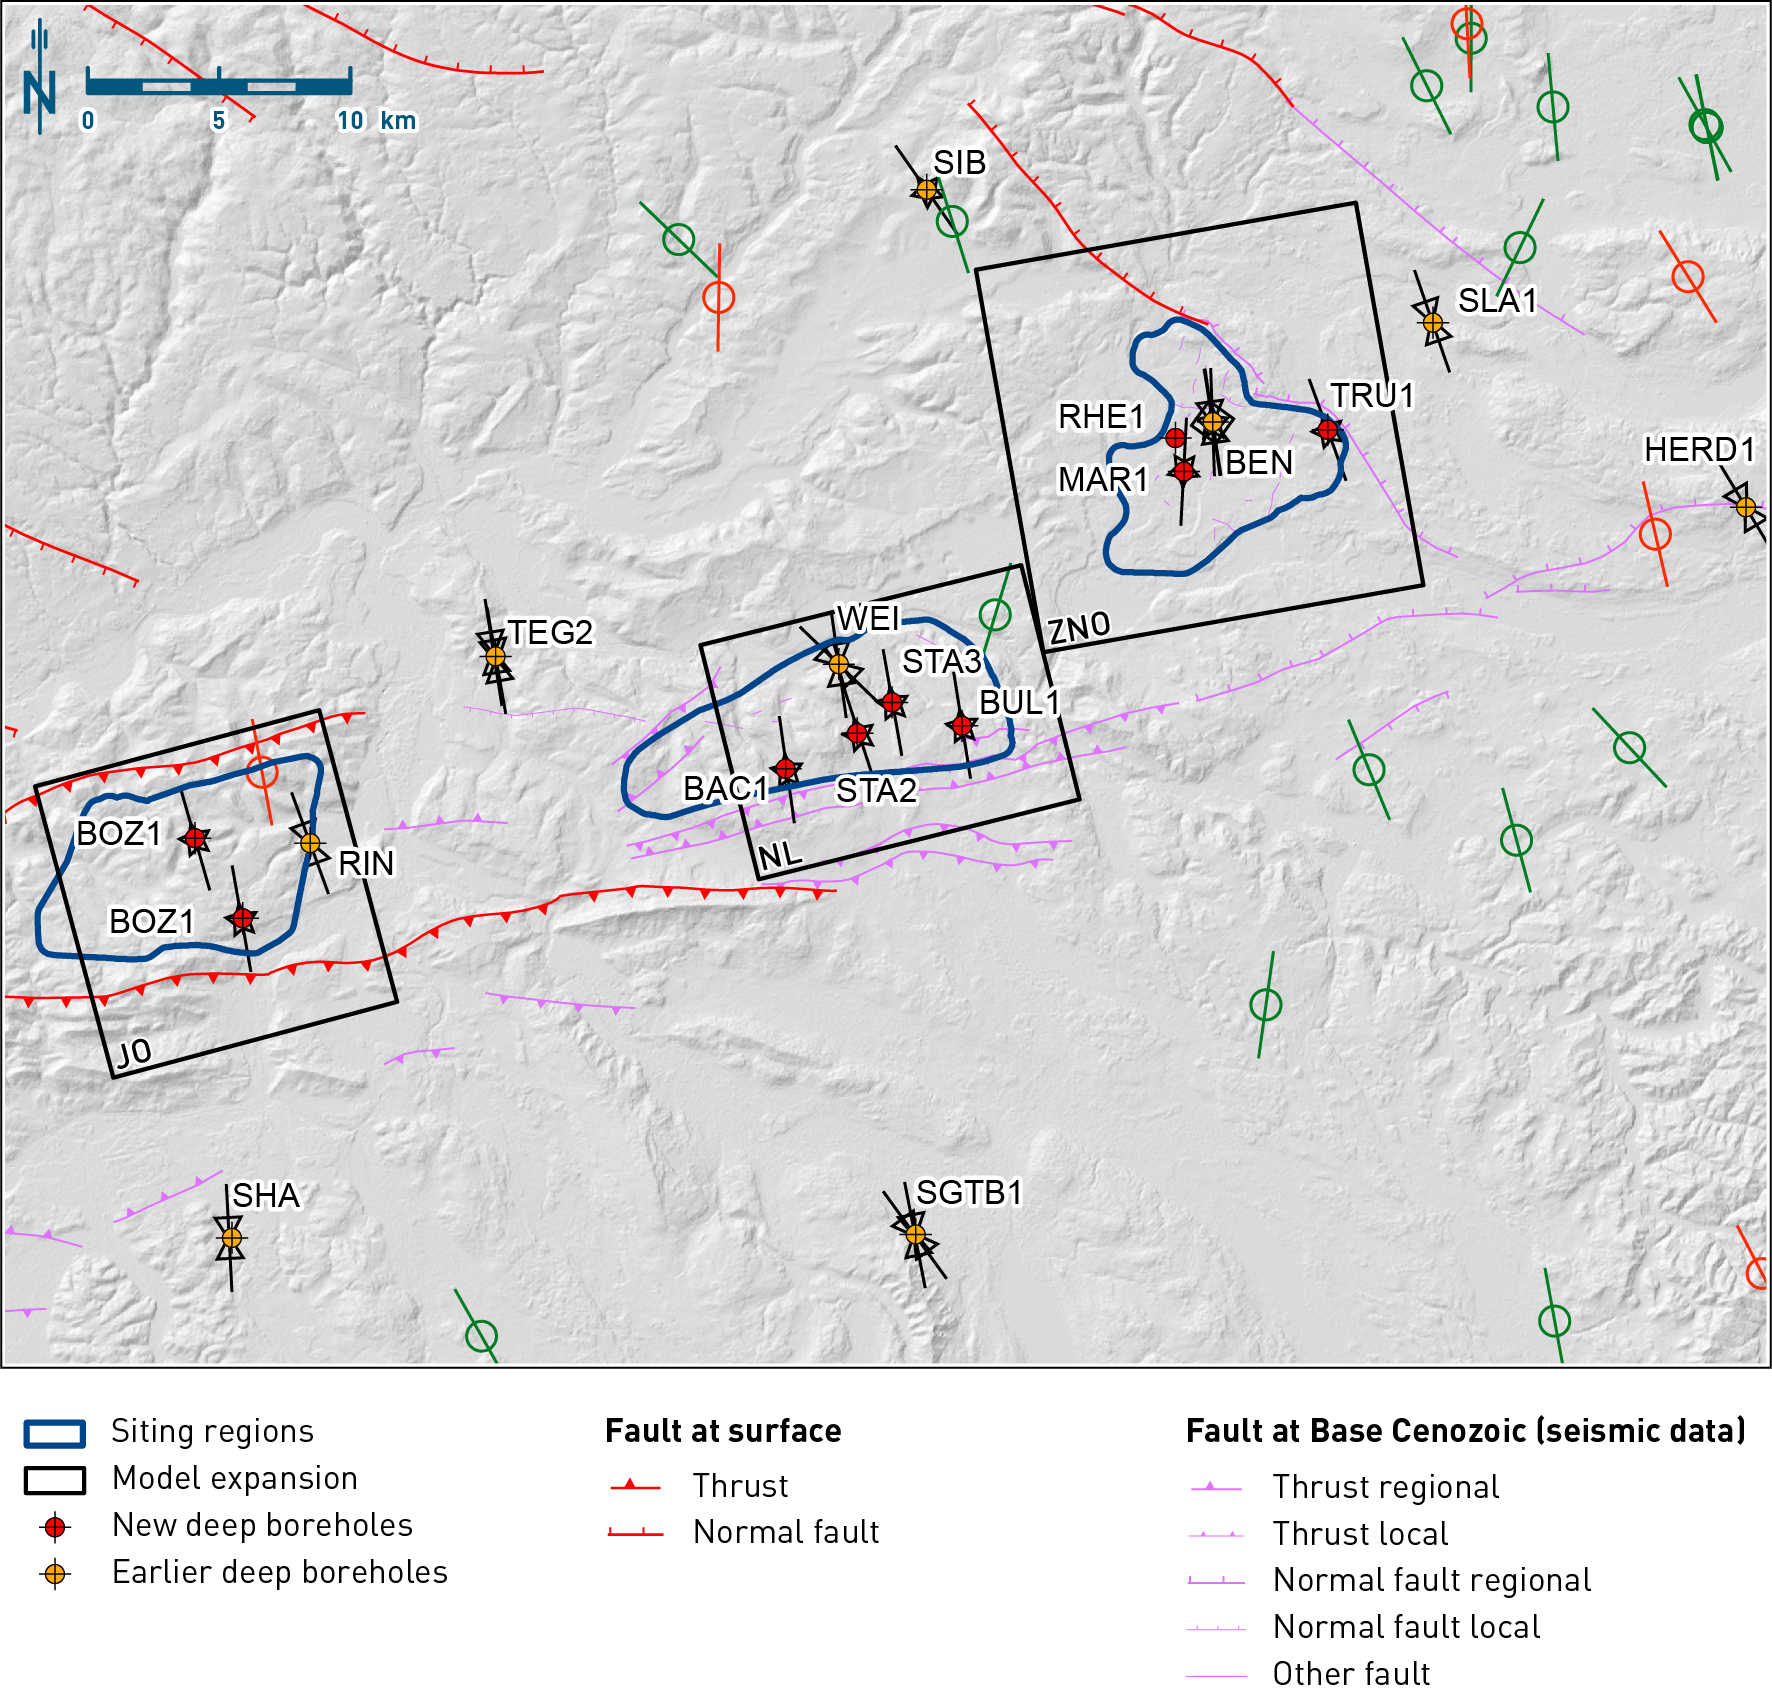
Fig. 4‑76:Orientation of maximum horizontal stress SHmax in the siting regions
Black lines indicate SHma orientations derived from borehole data. Red lines (normal faulting stress regime) and green lines (strike-slip stress regime) indicate SHmax orientations derived from earthquake focal mechanisms. Black squares indicate the extent of site-specific 3D geomechanical-numerical models. Note that only a selection of the structures from the 3D seismic interpretation on Top Villigen Formation were projected to Base Cenozoic and are shown to highlight the structural trends of regional importance.