
5. Key characteristics of the host rock and clay-mineral-rich confining units as geological barriers (NTB 24-17)
Key points:
- The Opalinus Clay is characterised by consistently high clay-mineral contents (> 40 wt.‑%). This mineralogical composition controls the pore structure and ensures very low hydraulic conductivities and efficient self-sealing of faults. Consequently, solute transport in the Opalinus Clay is diffusion-dominated.
- Moderate salinity and neutral pH of the porewater, and chemical conditions buffered by mineral equilibria provide highly stable geochemical conditions in the Opalinus Clay.
- Tectonic strain in clay-rich rocks is accommodated by more distributed and segmented deformation, which impedes continuous flow paths.
- Confining units above and below the Opalinus Clay also exhibit low hydraulic conductivity and contribute to the barrier function but show larger variability in hydraulic properties and a lower self-sealing potential.
Clay-rich rocks are widely recognised as providing excellent barrier properties for radioactive waste containment. The two key characteristics of these geomaterials are i) very small pore sizes, and ii) significant clay-mineral content. The small pore sizes result in extremely low hydraulic conductivities, and the abundance of clay minerals is responsible for high retention and high self-sealing potential.
The Opalinus Clay has pore sizes in the nm range, and the clay-mineral content in all the siting regions is high throughout the formation (> 40 wt.-% when averaged over metre scale). These properties are similar to those of other clay-rich rocks, notably the Callovo-Oxfordian, the designated host rock for the French deep geological repository, and the Toarcian-Domerian at the Tournemire rock laboratory (OECD/NEA 2022). The mineralogy and basic properties of these rocks are also comparable with many top seals of hydrocarbon reservoirs (Fisher et al. 2023).
This chapter provides a detailed characterisation of the host rock in terms of the properties and processes relevant for its efficiency as a geological barrier to fluid transport. In the various sections, the clay-mineral-rich confining units are characterised in comparison with the Opalinus Clay to highlight their potential to contribute to the geological barrier of a repository in the Opalinus Clay. In a few cases, the comparison is extended to limestones of the aquifer units to better emphasise the favourable barrier properties of the Opalinus Clay and its related confining units.
-
Section 5.2 explores the spatial variability of the mineralogy of both the whole rock and the clay fraction, and diagenetic mineral sequences. The clay-mineral content is of great relevance, because transport properties and the self-sealing potential directly correlate with it, as will be summarised in Section 5.10.
-
Section 5.3 is dedicated to porosity and pore-size distributions, including correlations with mineralogy. The pore network controls transport properties but also clay mineral – porewater interactions, which in turn affect the porewater chemistry.
-
As will be shown in Section 5.4, the porewater chemistry, rock mineralogy and porosity network provide a very stable geochemical environment in the Opalinus Clay.
-
Section 5.5 summarises key geomechanical properties, deformation behaviour of and typical fault architecture in the Opalinus Clay. The volumetric behaviour, notably the volumetric expansion from unloading (swelling) is relevant for self-sealing (Section 5.7). The main features of the deformation behaviour of the Opalinus Clay are also put into context with the relatively low tectonic overprint.
-
Sections 5.6 to 5.9 provide detailed information on the transport properties of the Opalinus Clay. The hydraulic conductivities (Sections 5.6) are low, and mass transport is dominated by diffusion (Section 5.8). The section on self-sealing (Section 5.7) provides further evidence and a conceptual explanation for the absence of significant fracture- or fault-related transmissivities in the rock.
For the various sections, the properties and behaviour of the Opalinus Clay were examined across different scales (e.g. microscale, core, borehole, tunnel). Considerable effort went into correlating geochemical, hydrogeological and geomechanical properties with basic properties such as density, porosity and clay-mineral content. A high clay-mineral content stands out as the fundamental characteristic ensuring favourable barrier properties. In contrast to the continuously clay-mineral-rich Opalinus Clay, the low-permeability confining units are characterised by a higher mineralogical variability, including layers with reduced clay-mineral content and thus limited self-sealing potential.
Although the chapter sequentially addresses the rock microstructure (porosity and mineralogy), deformation behaviour and transport properties, it is noted that all these aspects are strongly interdependent (hydromechanical coupling) as emphasised in Fig. 5‑1. This figure also provides an overview of the sections included in this chapter (see numbers in brackets).
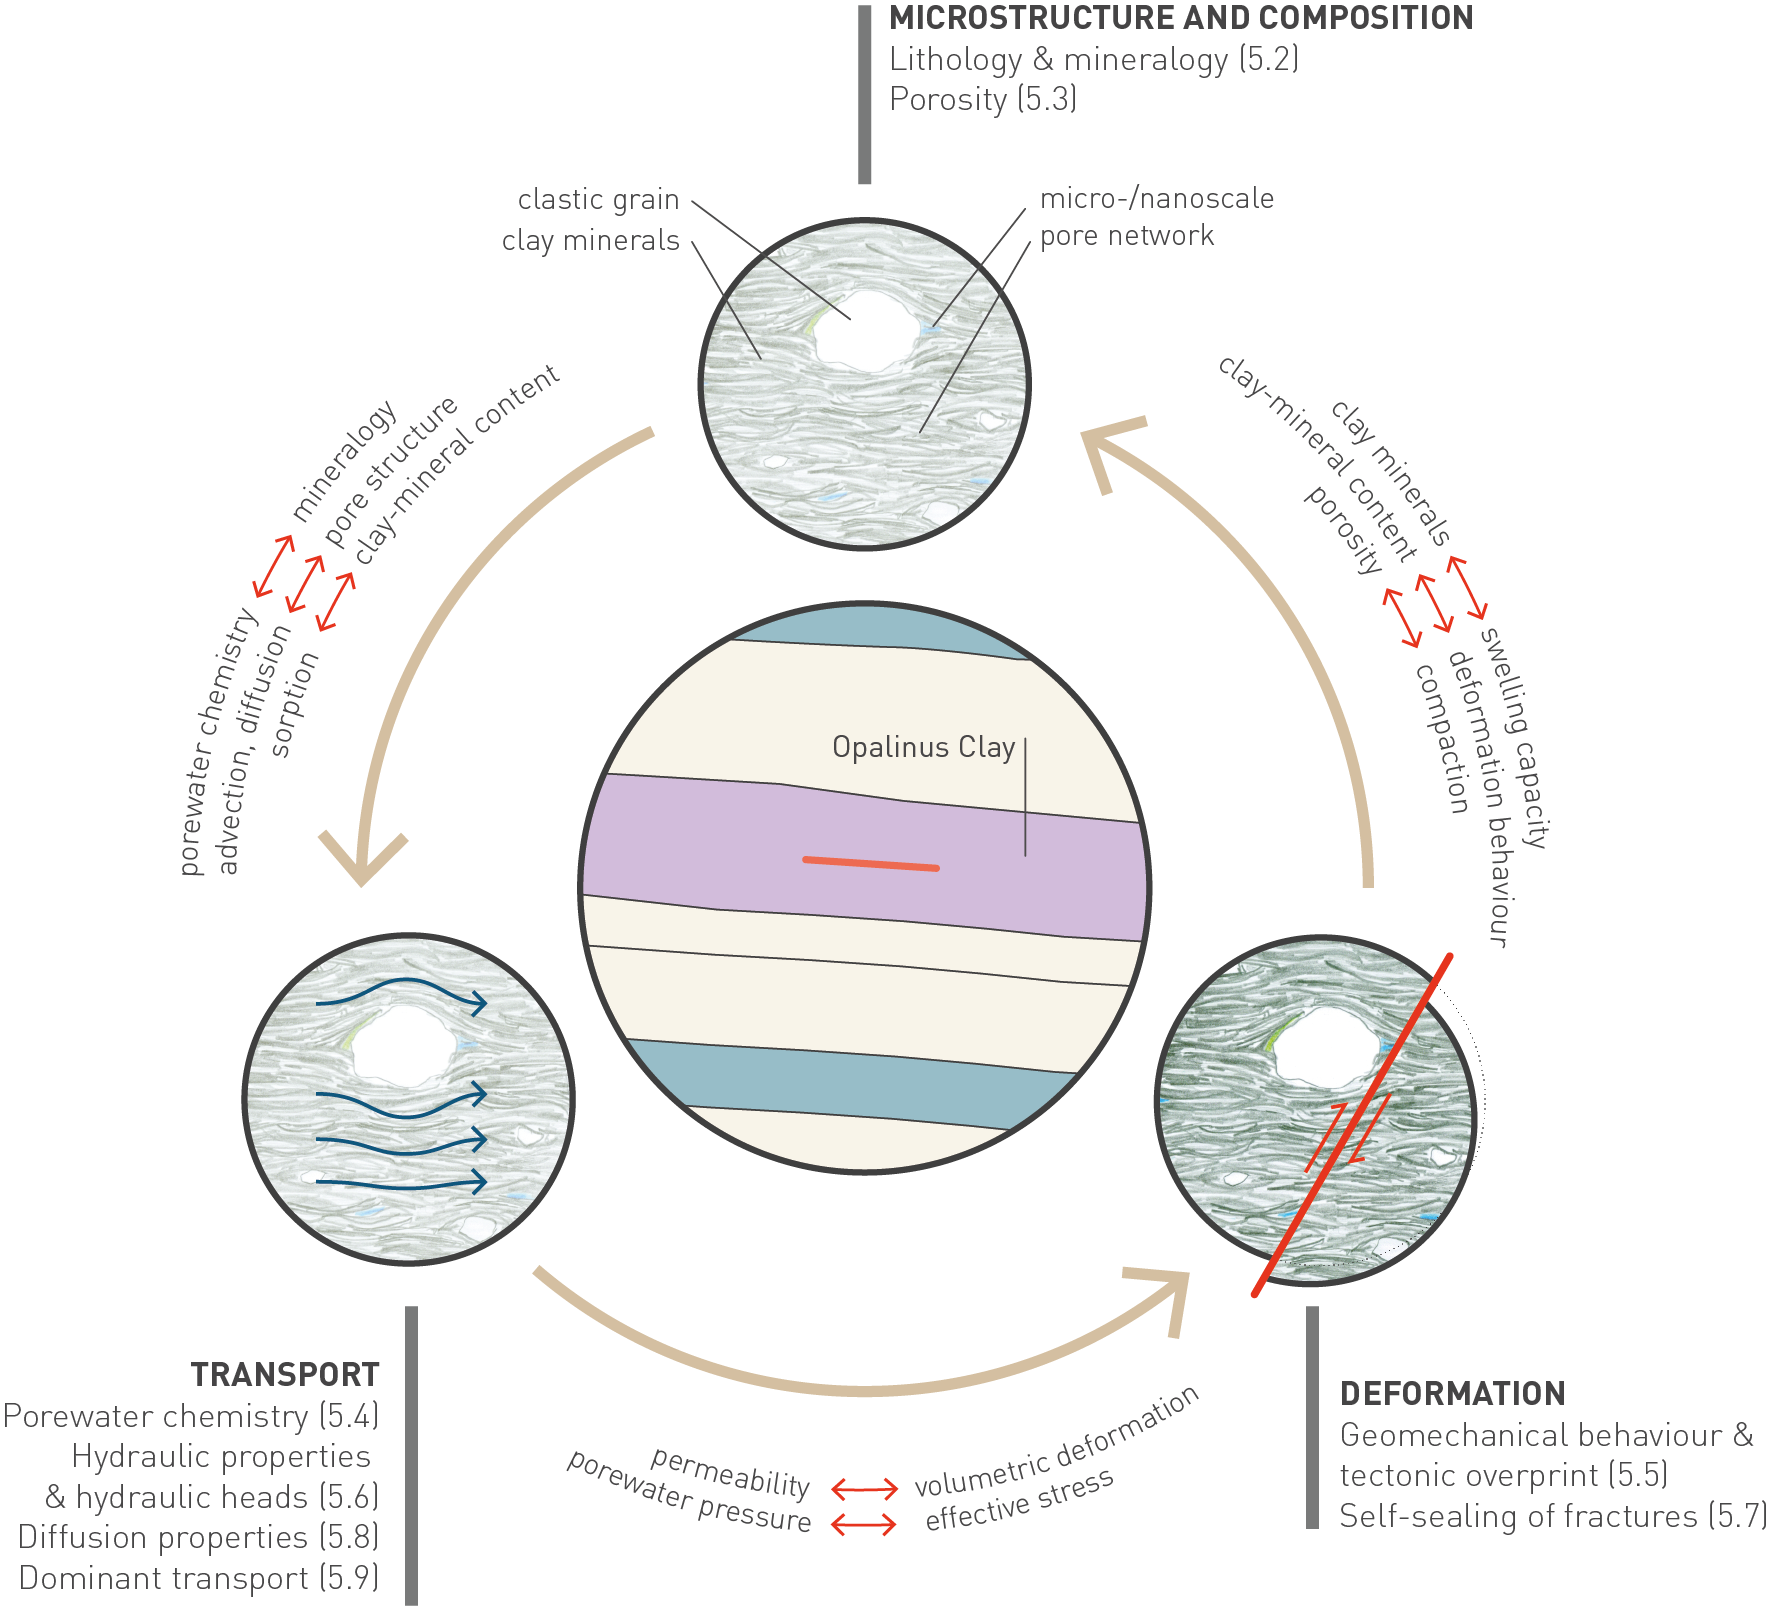
Fig. 5‑1:Coupling between structure, deformation behaviour and transport properties in the Opalinus Clay
Numbers in brackets relate to sections dedicated to the various topics in this chapter.
Key points:
- The Opalinus Clay is characterised by average clay-mineral contents between 55 and 60 wt.-%. There is no relevant difference between the siting regions.
- In the study area, the Opalinus Clay is characterised by comparably minor lithological and mineralogical variations in the vertical dimension. Characteristic depth trends in the different boreholes can be correlated at regional scale, that is, the composition is predictable.
- The composition of the clay-mineral fraction in the Opalinus Clay varies only slightly in the vertical dimension and is also consistent laterally. No relevant spatial variability must be expected regarding swelling or sorption behaviour.
- The similar mineral composition in the Opalinus Clay across the study areas allows the use of the same set of equilibrium phases in the porewater model for all siting regions.
- The confining units are mostly clay-mineral-rich, but show a larger variability compared to the Opalinus Clay. They include layers with low clay-mineral contents and thus reduced self-sealing potential.
The mineralogical composition of the host rock and the confining units is directly correlated to several safety-relevant aspects and serves as a good proxy for many relevant barrier properties. It provides direct input for estimating the sorption of radionuclides and for defining the porewater composition. In this context, it affects the speciation of solutes and therefore the mobility of radionuclides and the stability of the engineered barriers. Mineralogy, notably the clay-mineral content, correlates with porosity and geomechanical properties and thus plays a key role for self-sealing behaviour, permeability, and diffusion coefficients.
The sedimentological and stratigraphic features of the Opalinus Clay are presented in Section 4.2.6.
The structure of the Opalinus Clay on scales between tens of km to 1 nm, i.e. a scale ranging over 13 orders of magnitude, is illustrated in Fig. 5‑2. The main methods and sources of information include, in order of decreasing scale, geophysical borehole logs, macroscopic core inspection, thin-section analysis, scanning electron microscopy (SEM) and transmission electron microscopy (TEM). More detail is provided in Mazurek & Aschwanden (2020).
On a regional scale, several Opalinus Clay subunits can be distinguished and correlated laterally (Section 4.2.6). The same subunits can be identified in all three siting regions, and only a minor variability of the total thickness of the Opalinus Clay can be seen.
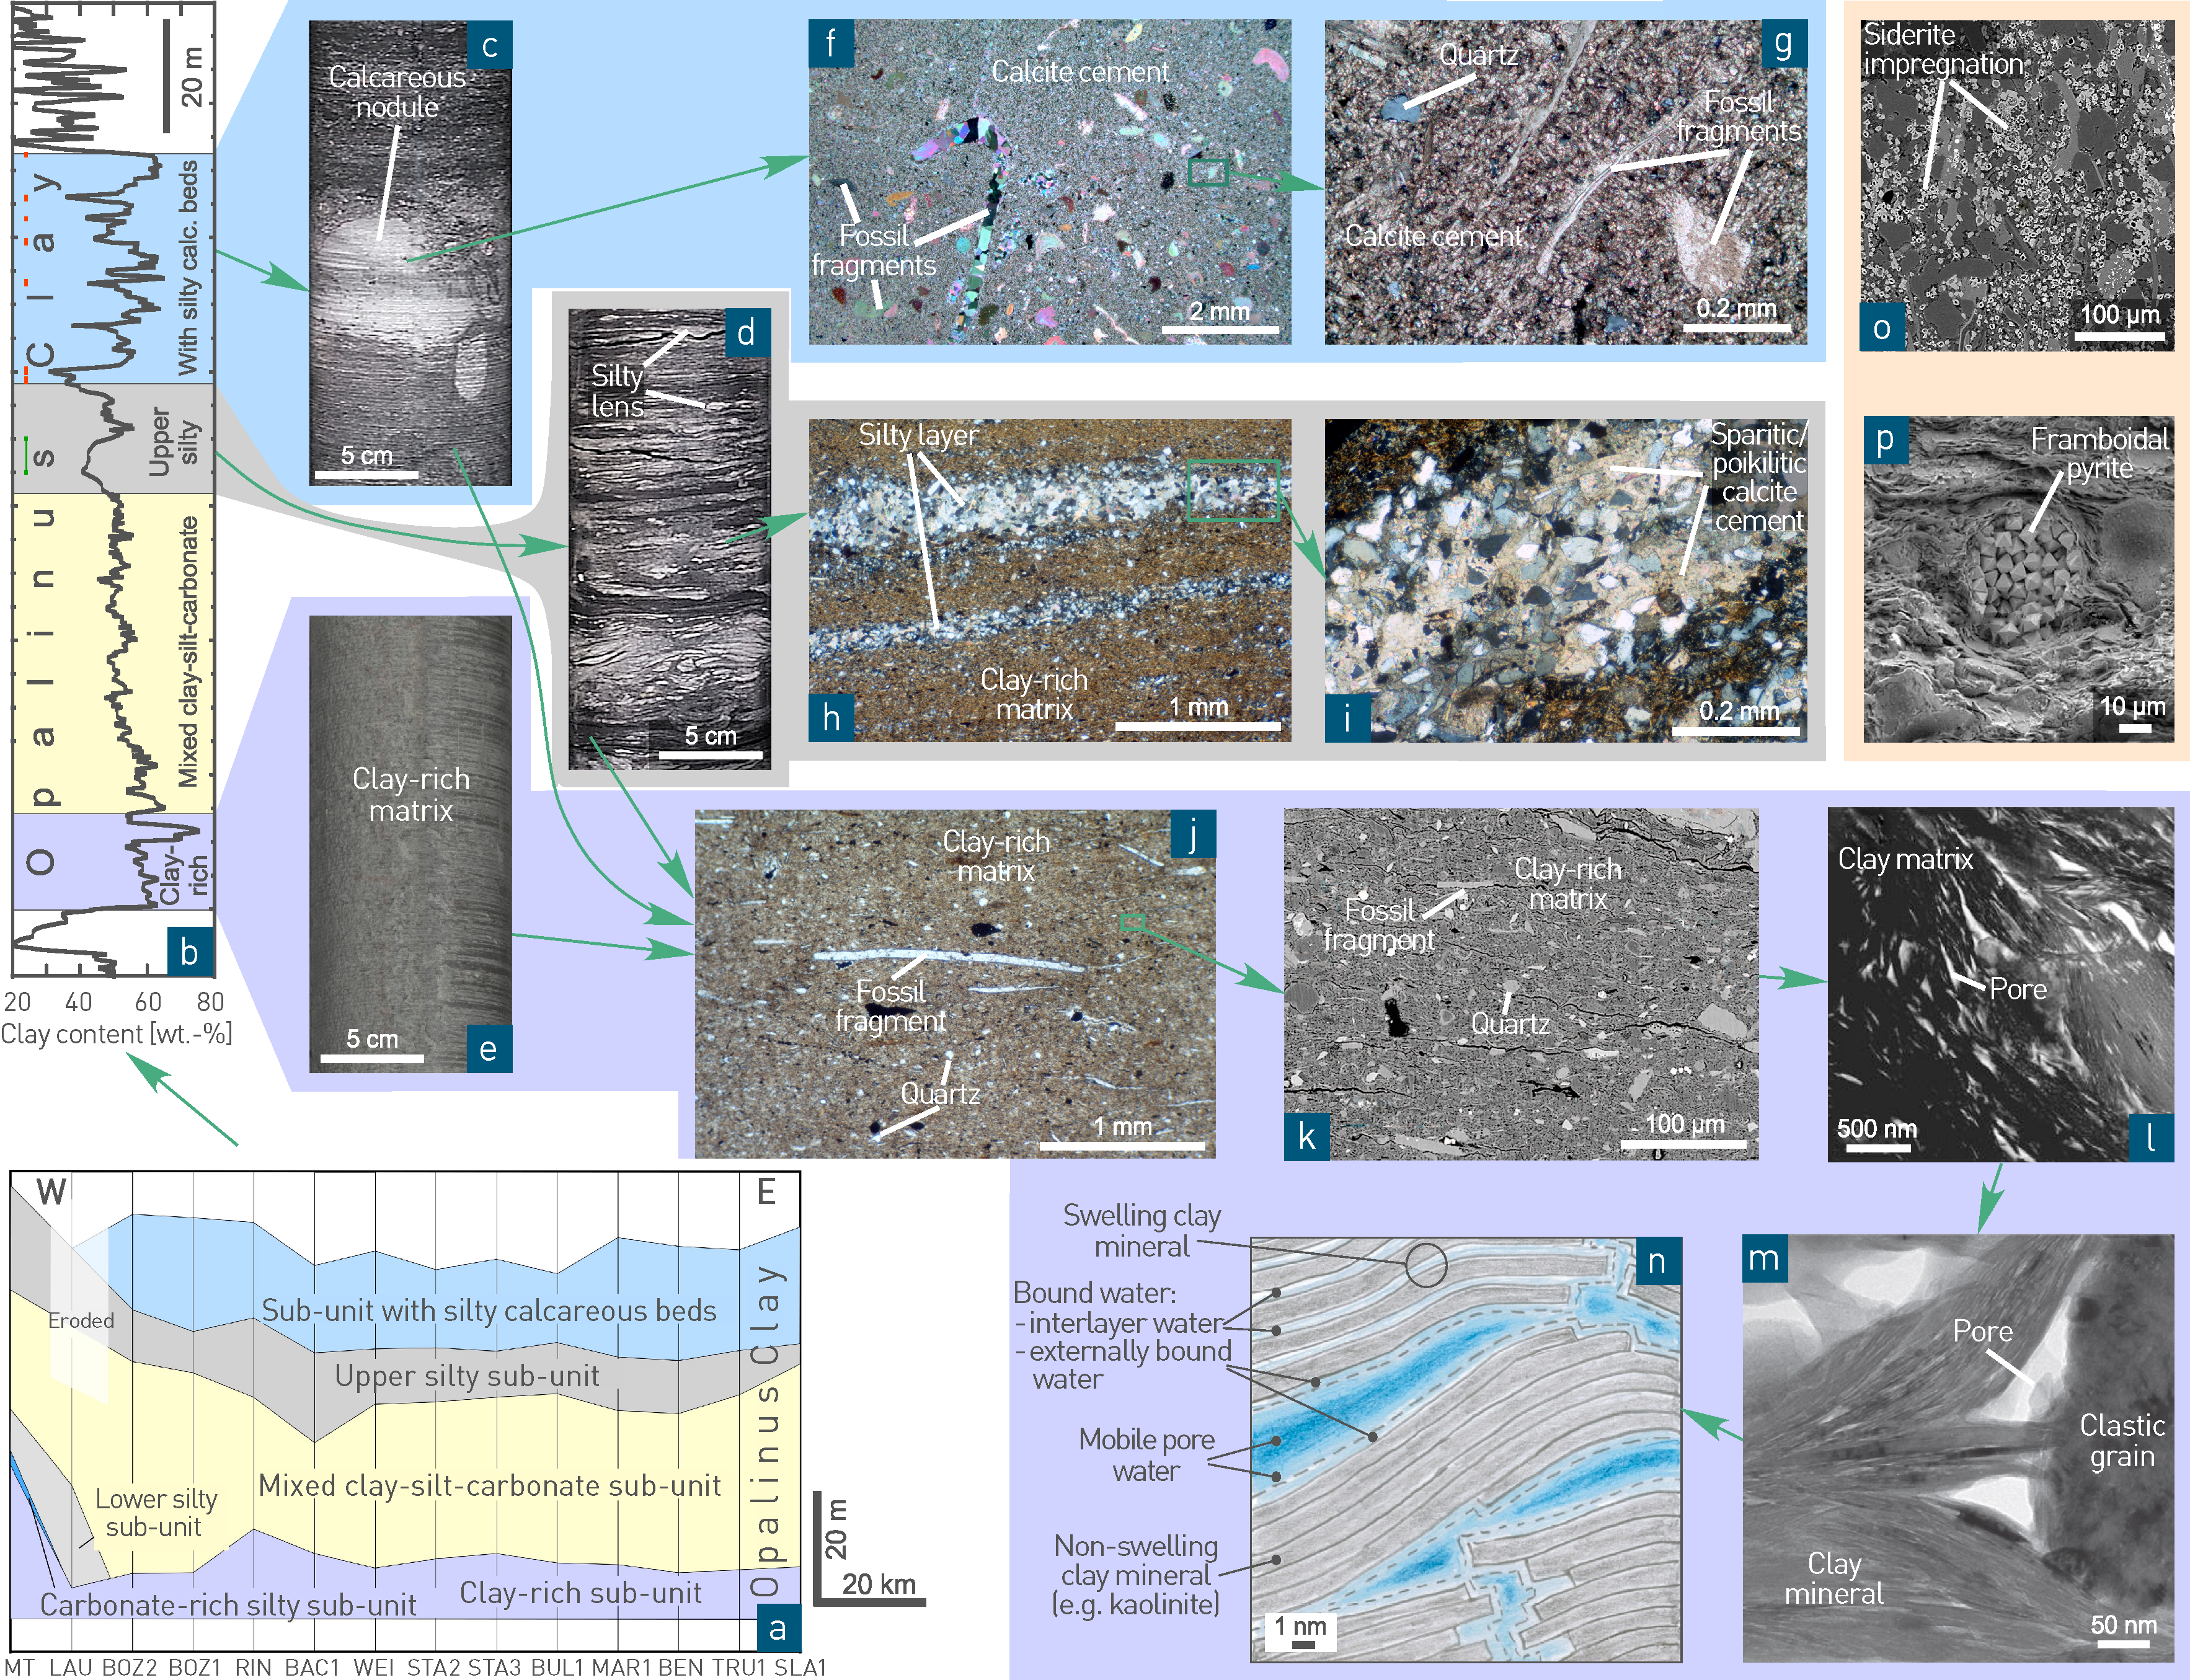
Fig. 5‑2:Conceptual representation of the structure of the Opalinus Clay over a length scale range of 13 orders of magnitude
Adapted from Mazurek & Aschwanden (2020). MT: Mont Terri.
(a) Regional distribution of subunits
(b) Typical borehole profile with subunits, discrete heterogeneities and clay-mineral log (Benken borehole, BEN)
(c) Calcareous nodule in the «Sub-unit with silty calcareous beds» (BEN 549.22)
(d) «Upper silty sub-unit» (BEN 582.83)
(e) «Clay-rich sub-unit» (Mont Terri rock laboratory, MT BDB-1 220.74)
(f) Thin-section photograph of a calcareous nodule from the «Sub-unit with silty calcareous beds» (Schlattingen borehole, SLA 852.80, transmitted light, crossed polars)
(g) Detail from (f)
(h) Thin-section photograph from the «Upper silty sub-unit» showing two silty lenses (BEN 575.35, transmitted light, parallel polars)
(i) Thin-section photograph from the «Upper silty sub-unit» showing a close-up of a silty lens cemented by sparitic/poikiloblastic calcite (MT 808.40, transmitted light, crossed polars)
(j) Thin-section photograph from the «Clay-rich sub-unit» (MT 968.50, transmitted light, parallel polars)
(k) SEM image from the «Clay-rich sub-unit» (MT FE tunnel, from Seiphoori et al. 2017)
(l) TEM image of the clay matrix (from Keller & Holzer 2013)
(m) TEM image of the clay matrix (MT sample, from Keller et al. (2013)
(n) Artist’s view of the clay structure on the nanometre scale (from Nagra 2002)
(o) Siderite impregnation in a concretion (SLA 833.69, from Wersin et al. 2013)
(p) Pyrite framboid (MT FE tunnel, from Seiphoori et al. 2017).
On the borehole scale (Fig. 5‑2b), discrete heterogeneities such as calcareous beds/nodules with a thickness in the range of 0.1 – 0.6 m (Mazurek & Aschwanden 2020) occur in the upper part of the formation in all the siting regions. It should be noted that, even in sections with calcareous beds/nodules present, the average clay-mineral content at the metre scale is > 40 wt.-%. Individual heterogeneities often cannot be correlated between boreholes, indicating limited lateral extent. At the base of the Opalinus Clay, a particularly clay-rich layer extends across the whole study area, with average clay-mineral contents well above 50 wt.-%.
On this basis, the Opalinus Clay illustrated in Fig. 5‑2c – e can be conceptually simplified to:
-
Clay matrix with variable contents of disseminated quartz and calcitic fossil fragments in all subunits
-
Calcareous beds/nodules
-
Silty lenses, most frequently occurring in the silty subunits.
The small-scale calcareous and silty heterogeneities are embedded in a clay-rich matrix, which is the dominant building block. This fact is illustrated by arrows pointing from Fig. 5‑2c – e towards Fig. 5‑2j. Calcareous beds/nodules are illustrated in Fig. 5‑2f – g on the thin-section scale. They consist of fossil fragments, silty particles and a calcite cement, with only small amounts of clay minerals. Fig. 5‑2h – i illustrate silty lenses on a microscopic scale. These can contain clay minerals or, as shown in Fig. 5‑2h – i, consist of almost pure quartz ± feldspars. Given the originally large pore apertures, the lenses are mostly cemented by sparitic and/or poikilitic calcite cement.
The clay-rich matrix is the quantitatively dominant building block of the Opalinus Clay and is illustrated in Fig. 5‑2j – n. It contains varying amounts of disseminated quartz and calcitic fossil fragments (Fig. 5‑2j – k). Note that, under the SEM, only a small fraction of the pore space can be visualised, given the limited resolution (at best around 10 nm). Fig. 5‑2l – m visualises the clay matrix under TEM. Visible pores are due to geometric incompatibilities between clay aggregates or between clay and non-clay minerals. Pores with even smaller, nanometric apertures constitute a substantial part of the pore space. These apertures are difficult or impossible to image and are thus illustrated by a conceptual sketch in Fig. 5‑2n. Porosity is also present in the interlayer space of swelling minerals, particularly smectite (within illite/smectite mixed-layer minerals).
Apart from the cementation by several calcite generations, siderite and pyrite are the only quantitatively relevant diagenetic neoformations (Section 5.2.5) and occur in all subunits of the Opalinus Clay (Fig. 5‑2o – p). Siderite can be found in concretions with sizes in the range of centimetres or as disseminated crystals in the clay matrix. Pyrite occurs in the form of 1 – 10 µm-size framboids or as larger crystals. Pyrite concretions are also found, even though much less frequently than in the case of siderite.
The Opalinus Clay is the most clay-mineral-rich unit throughout the study area, with no systematic differences in the mineralogical composition between the siting regions (Fig. 5‑3, Fig. 5‑4). Vertically, the clay-mineral content increases slightly with depth. Remarkably, the occurrence of siderite is almost exclusively limited to the Opalinus Clay. As shown in Fig. 5‑4, the average clay-mineral content is well above 50 wt.-% at all studied locations.
Limestones and marls are the main lithologies present in the Malm Group.
The Dogger Group above Opalinus Clay is also clay-mineral-rich, but includes heterogeneities such as Fe-rich oolites, sandy lithologies (mainly in ZNO) or limestones such as the «Herrenwis Unit» in NL and the Hauptrogenstein in JO (see also Sections 4.2.7 and 4.5.3).
The Staffelegg Formation (Lias Group) below the Opalinus Clay consists of six generally clay-mineral-rich members showing consistent mineralogical compositions throughout the study area, but with substantial vertical heterogeneity (Mazurek et al. 2023a). Clay-mineral contents tend to be slightly higher in the ZNO siting region, particularly in the Frick Member. The underlying Triassic units are mineralogically heterogeneous, given the presence of evaporitic minerals (mainly anhydrite) and dolomite.
Additional figures showing mineralogical variability are included in Nagra (2024m).
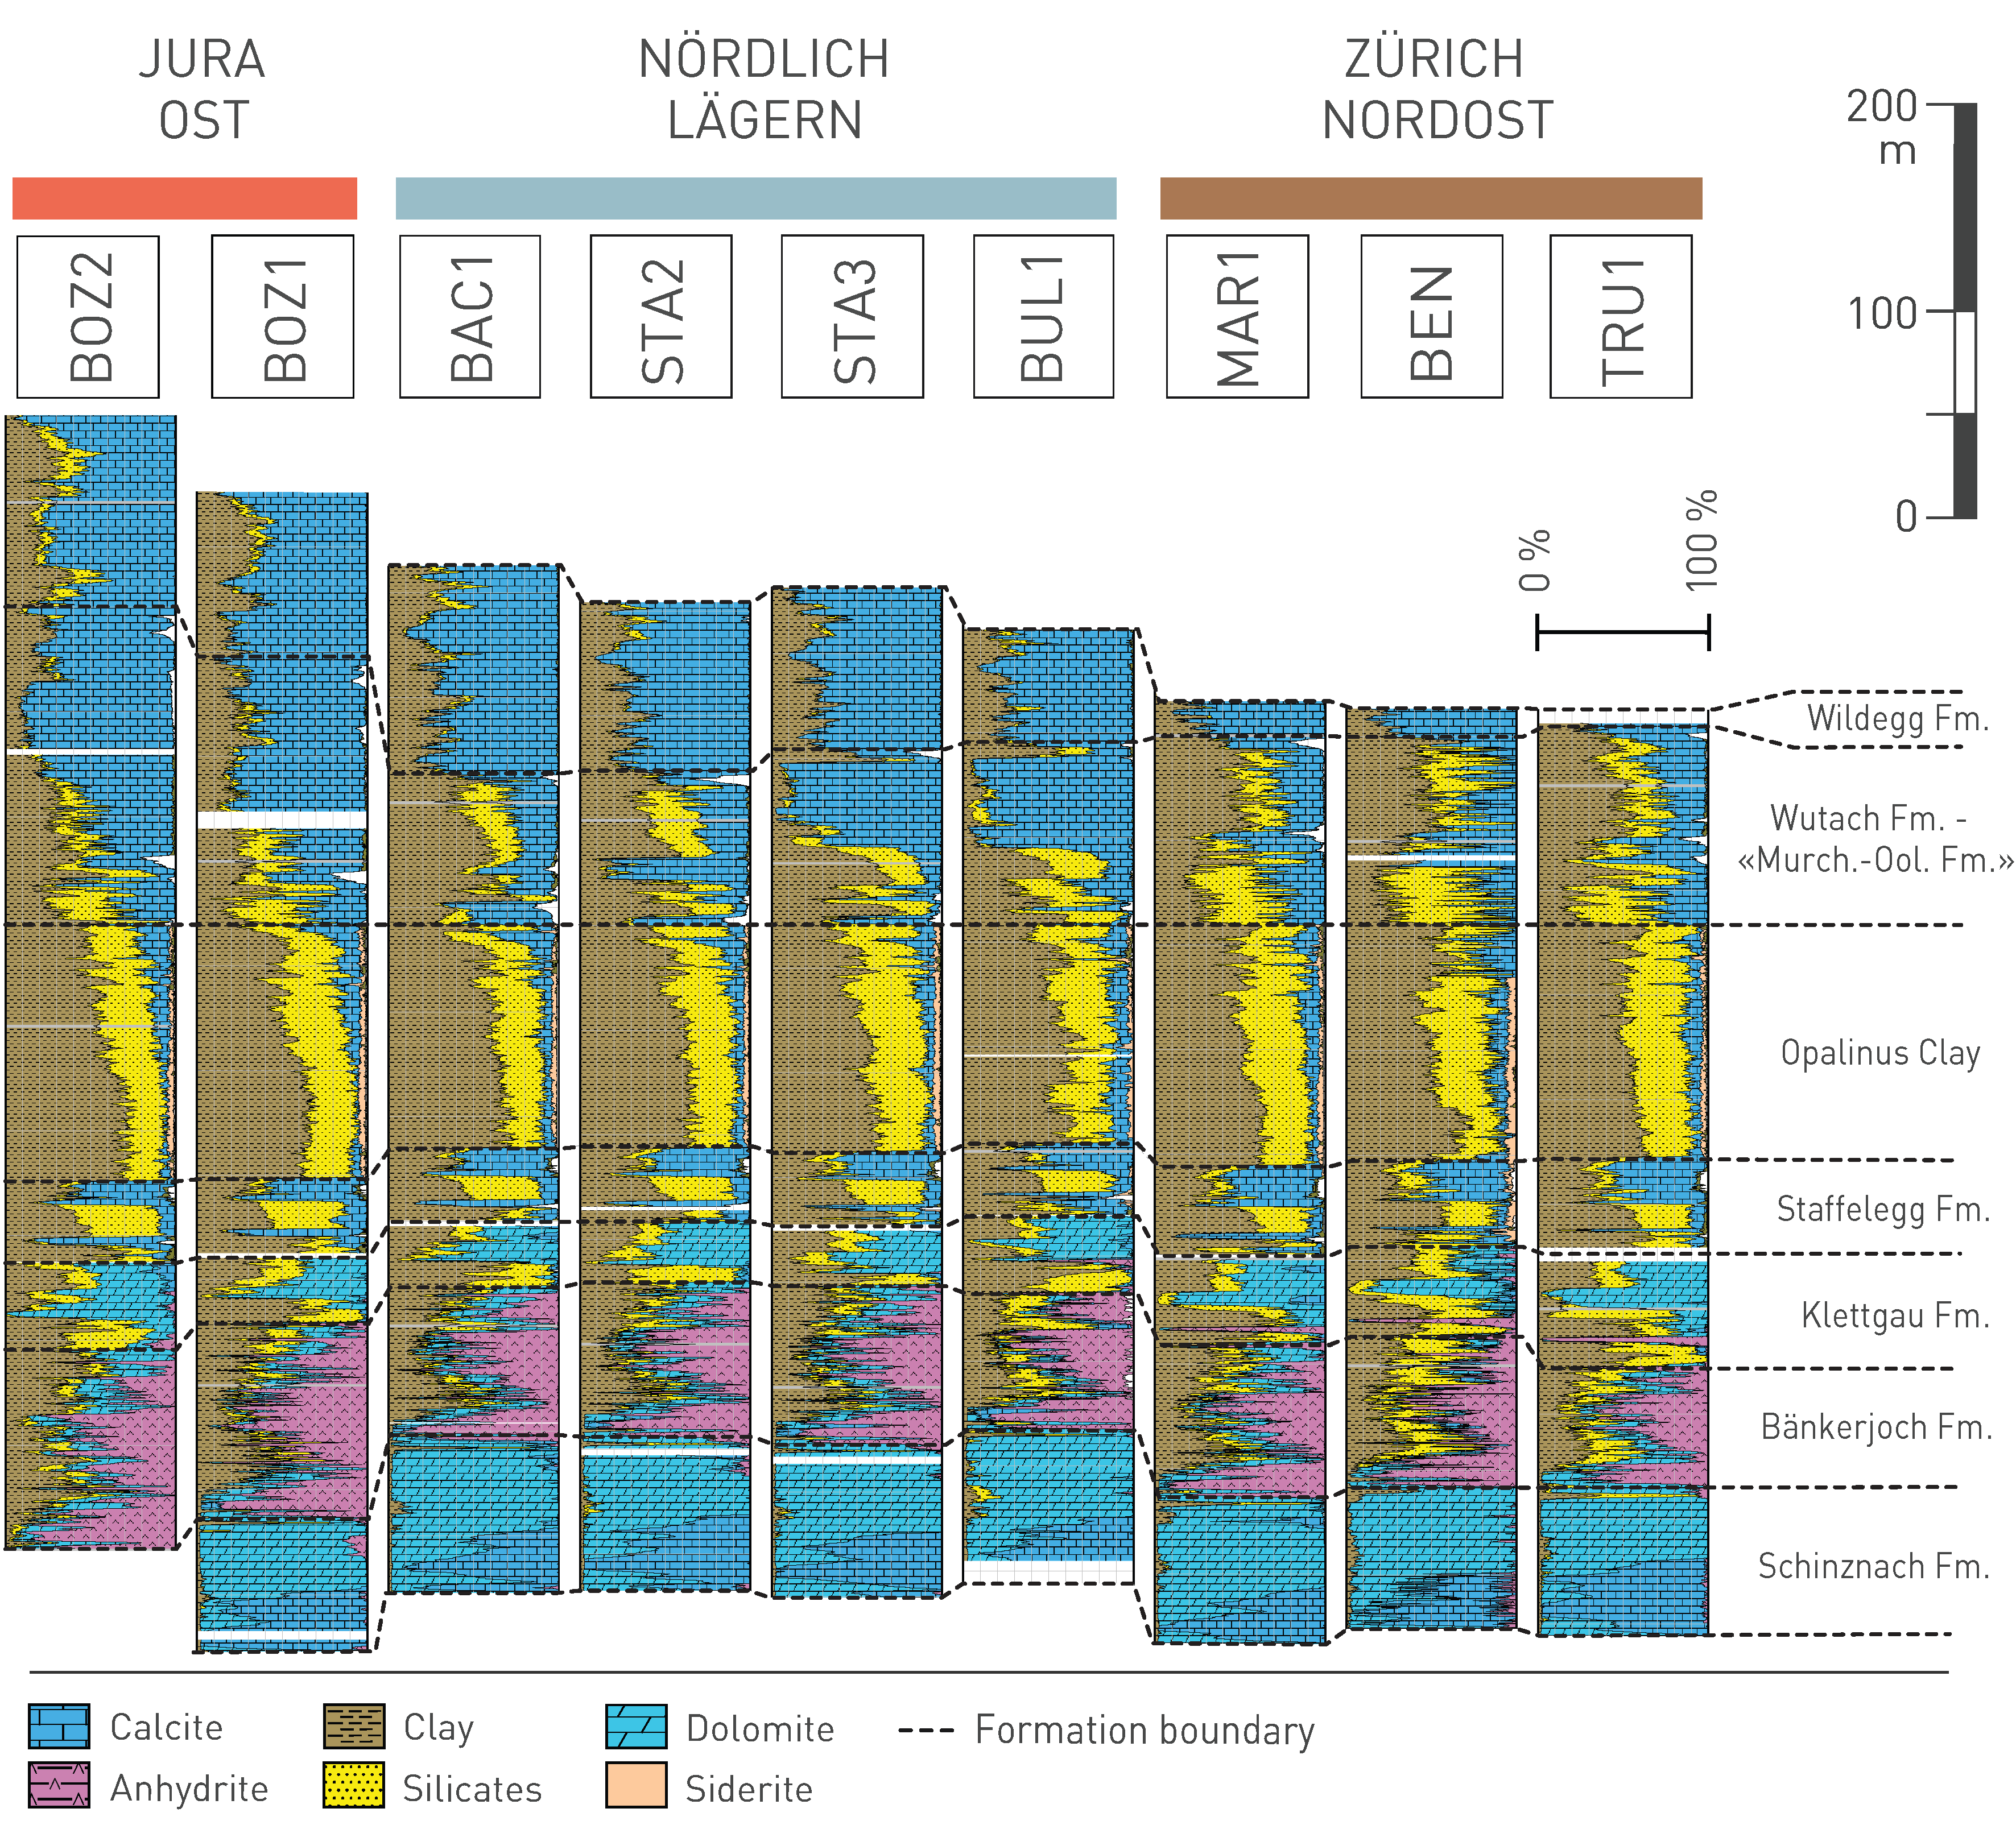
Fig. 5‑3:Mineralogical composition of formations in boreholes of the siting regions
Continuous mineralogy from core-calibrated geophysical logs (Becker & Marnat 2024).
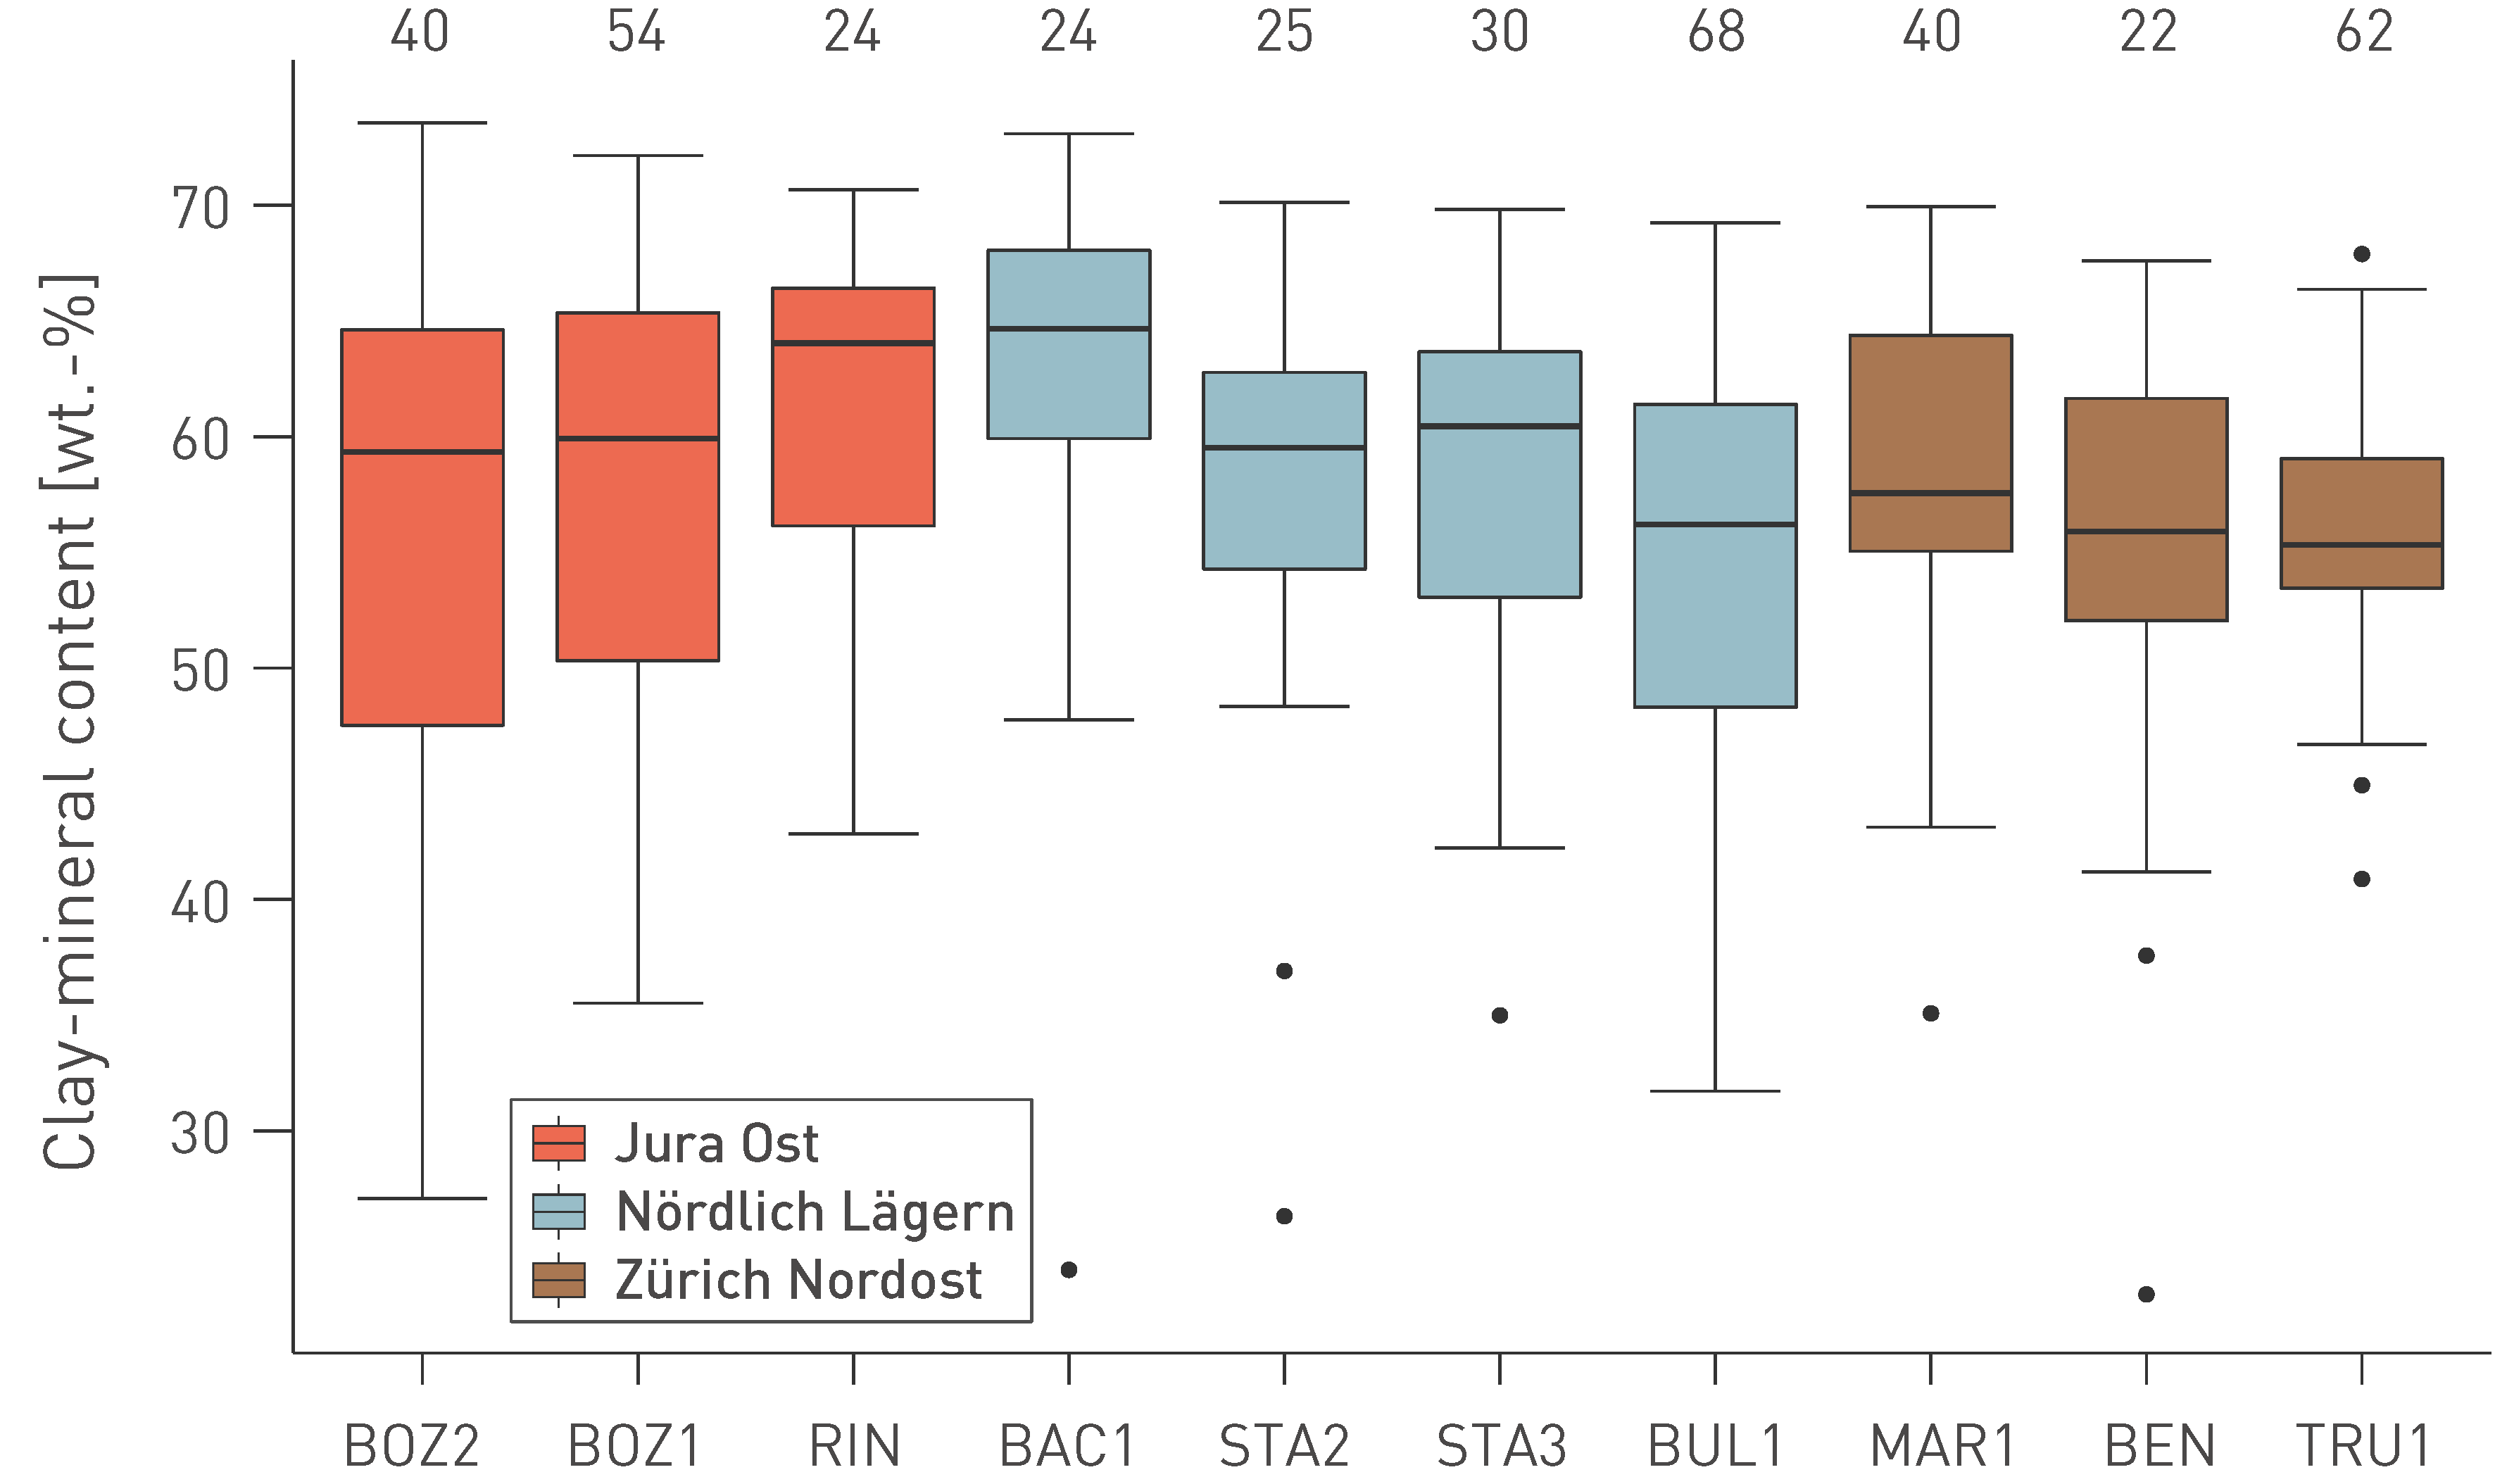
Fig. 5‑4:Clay-mineral content of the Opalinus Clay in boreholes of the siting regions, based on laboratory data
Each box encloses 50% of all measured values. The horizontal line in the box indicates the median, and the whiskers (error bars) the minimum and maximum values (min: 25th percentile – (1.5 × interquartile range); max: 75th percentile + (1.5 × interquartile range)). The black dots indicate outliers. The values above the boxplots denote the number of samples.
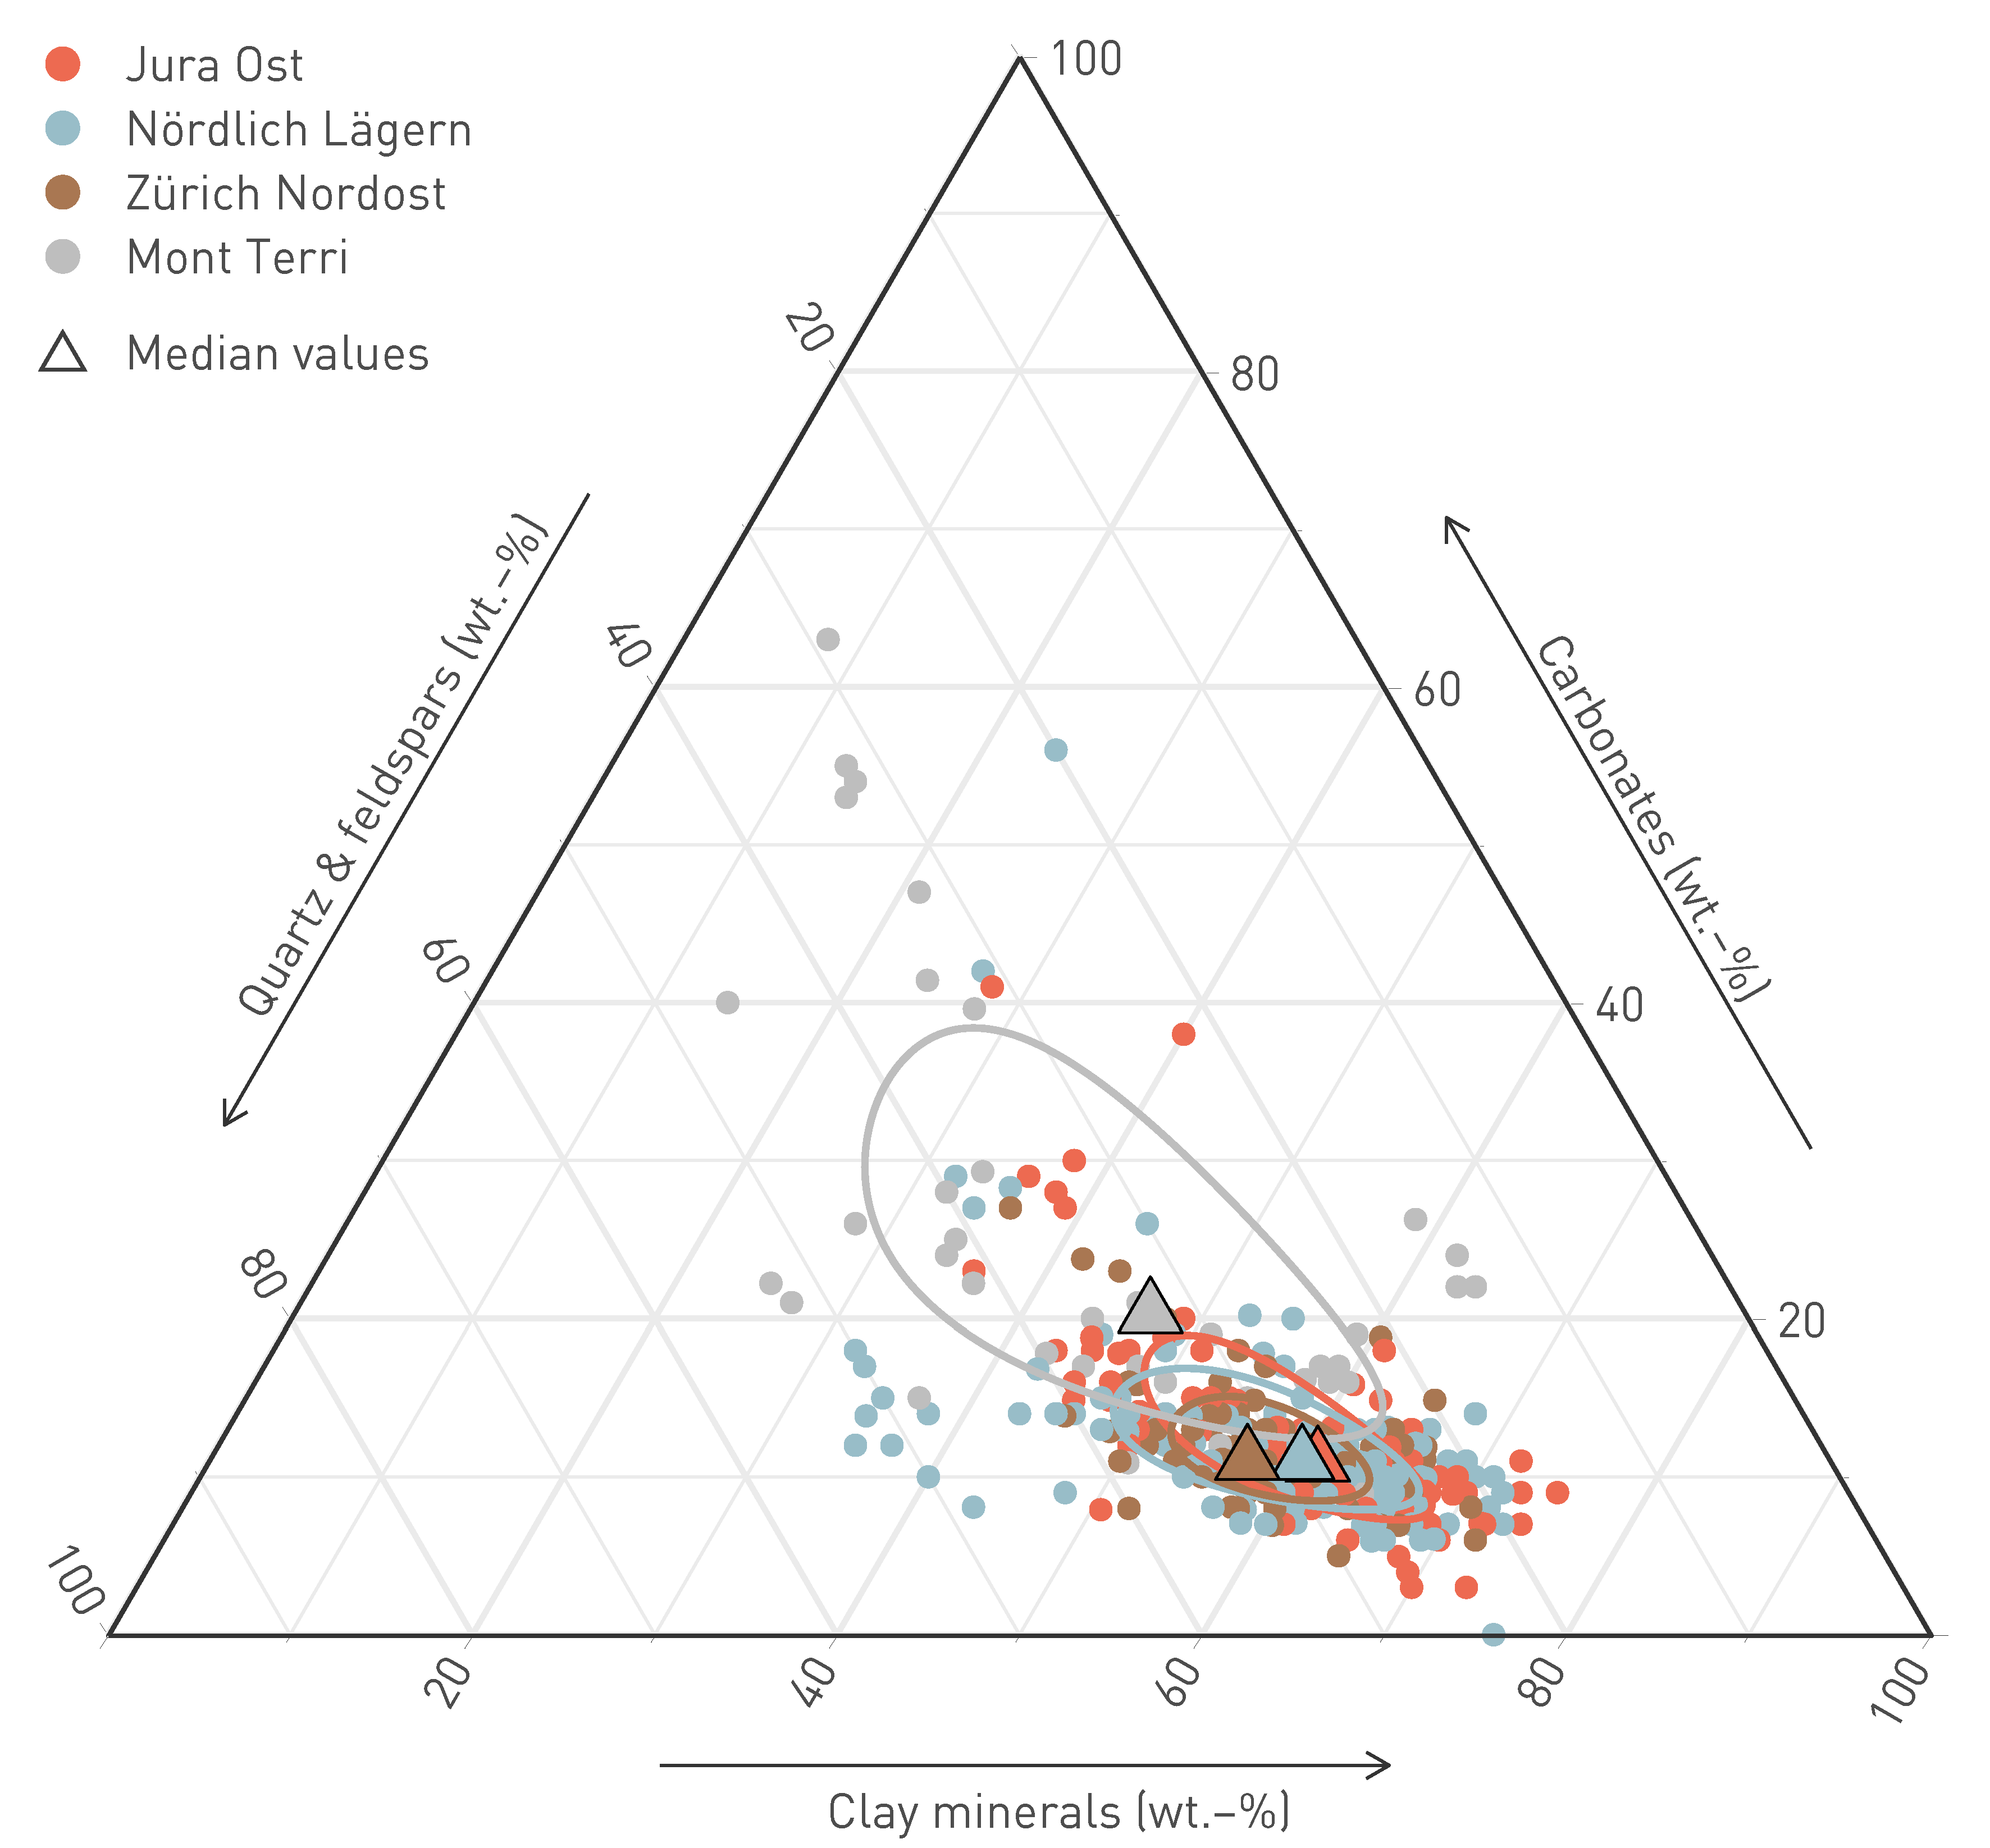
Fig. 5‑5:Mineralogical composition of the Opalinus Clay based on laboratory data from X‑ray diffraction
Data are shown for all TBO boreholes and for Mont Terri (BDB1 borehole). Triangles and ellipses show median values and variance for each region. Note the small differences between the three siting regions. The Mont Terri samples with low clay-mineral content relate to the carbonate-rich silty facies, which is absent in Northern Switzerland.
The composition of the clay-mineral fraction is of importance for the evaluation of processes such as sorption or swelling. In the Mesozoic profile, it includes illite, illite-rich illite/smectite mixed layers, kaolinite, chlorite, and small proportions of chlorite/smectite mixed layers. Trace amounts of smectite may also occur. In the Opalinus Clay, the relative proportions of endmember clays13 show only slight variability (Fig. 5‑6). Only a slight upward increase in the illite/kaolinite endmember ratio is observed (Fig. 5‑6). This means that relevant properties such as swelling and sorption behaviour can be considered constant throughout the formation. Above and below the Opalinus Clay, the illite/kaolinite endmember ratio increases substantially.
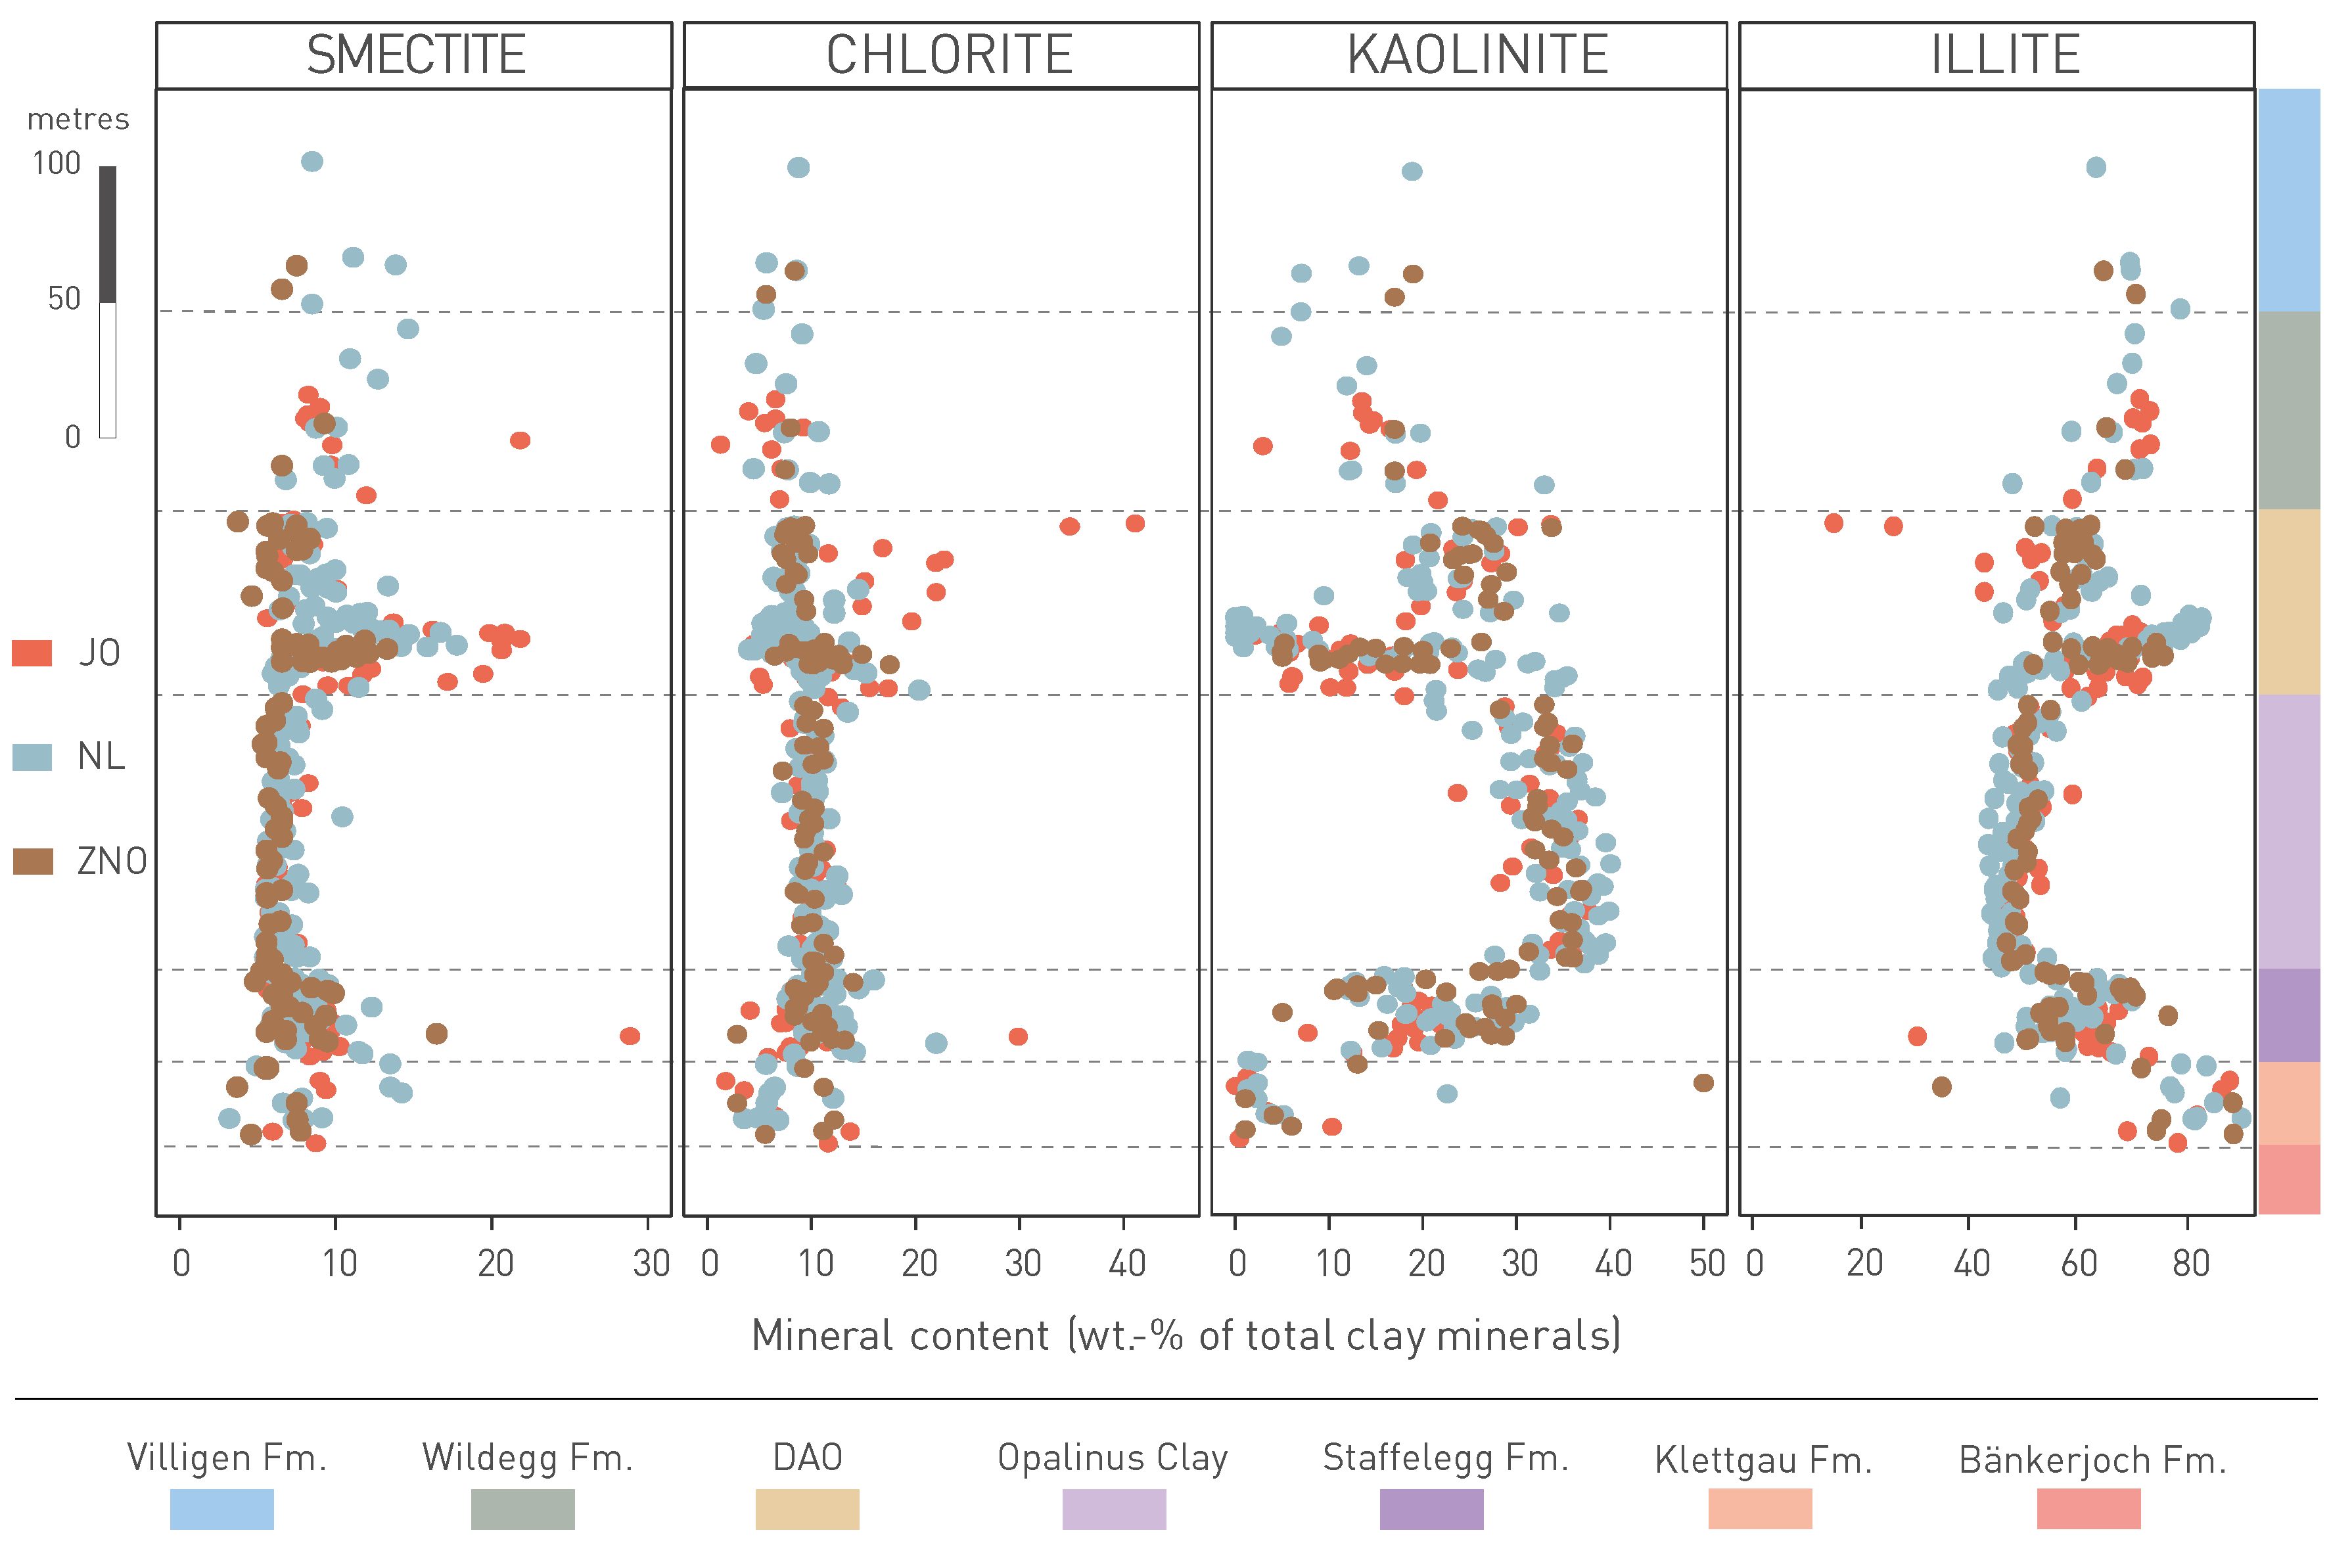
Fig. 5‑6:Composition of the clay-mineral fraction in the TBO boreholes in profile view
Clay endmembers are shown. Data are projected to profile STA2. DAO: Dogger Group above Opalinus Clay.
For the endmember compositions, the illite, chlorite and smectite components of mixed-layer phases were added to the respective pure phases. The smectite endmember refers almost exclusively to mixed-layer phases. ↩
After deposition on the seafloor, sediments were compacted during burial (Chapter 3, Fig. 3‑4) and affected by dissolution – precipitation reactions that influenced the mineralogical composition and porosity. These coupled processes caused cementation, affected the pore-size distribution and resulted in a modification of the initial (typically marine) porewater. Fig. 5‑7 provides a summary of the diagenetic evolution of the Opalinus Clay and its confining units based on the summary of Mazurek & Aschwanden (2020). Mineralisation in veins is described separately in Section 4.7.
The effects of early diagenesis (eogenesis), i.e. processes that occur within the first 100 m of burial, are quantitatively particularly important and mainly include the precipitation of aragonite/ Mg-calcite, pyrite I, siderite, calcite I and dolomite I (Fig. 5‑7). The precipitation of framboidal pyrite I and dolomite I affected all lithologies, including those that are clay-mineral-rich. In contrast, precipitation of aragonite/Mg-calcite and calcite I only occurred in areas rich in bioclastic material whose early diagenetic dissolution provided the solutes for pore-occluding cement precipitation. Siderite was mainly detected in the Opalinus Clay. Note that, from a quantitative perspective, diagenetic cements in the clay-rich matrix of the Opalinus Clay are only minor. Later cements related to burial diagenesis (mesogenesis), such as authigenic quartz and poikilitic calcite II, are more strongly expressed in silty/calcareous lithologies but only weakly in the clay-rich bulk of the rock. Diagenetic celestite and Ba-Sr sulphate have been detected by conventional transmitted light microscopy in both the Opalinus Clay and in the confining units. They mainly occur as fillings of interstices and as xenomorphic, fibrous cement in the rock matrix (Fig. 5‑7). It was argued that the solutes of these cements were supplied by dissolution of bioclasts (Lerouge et al. 2014).
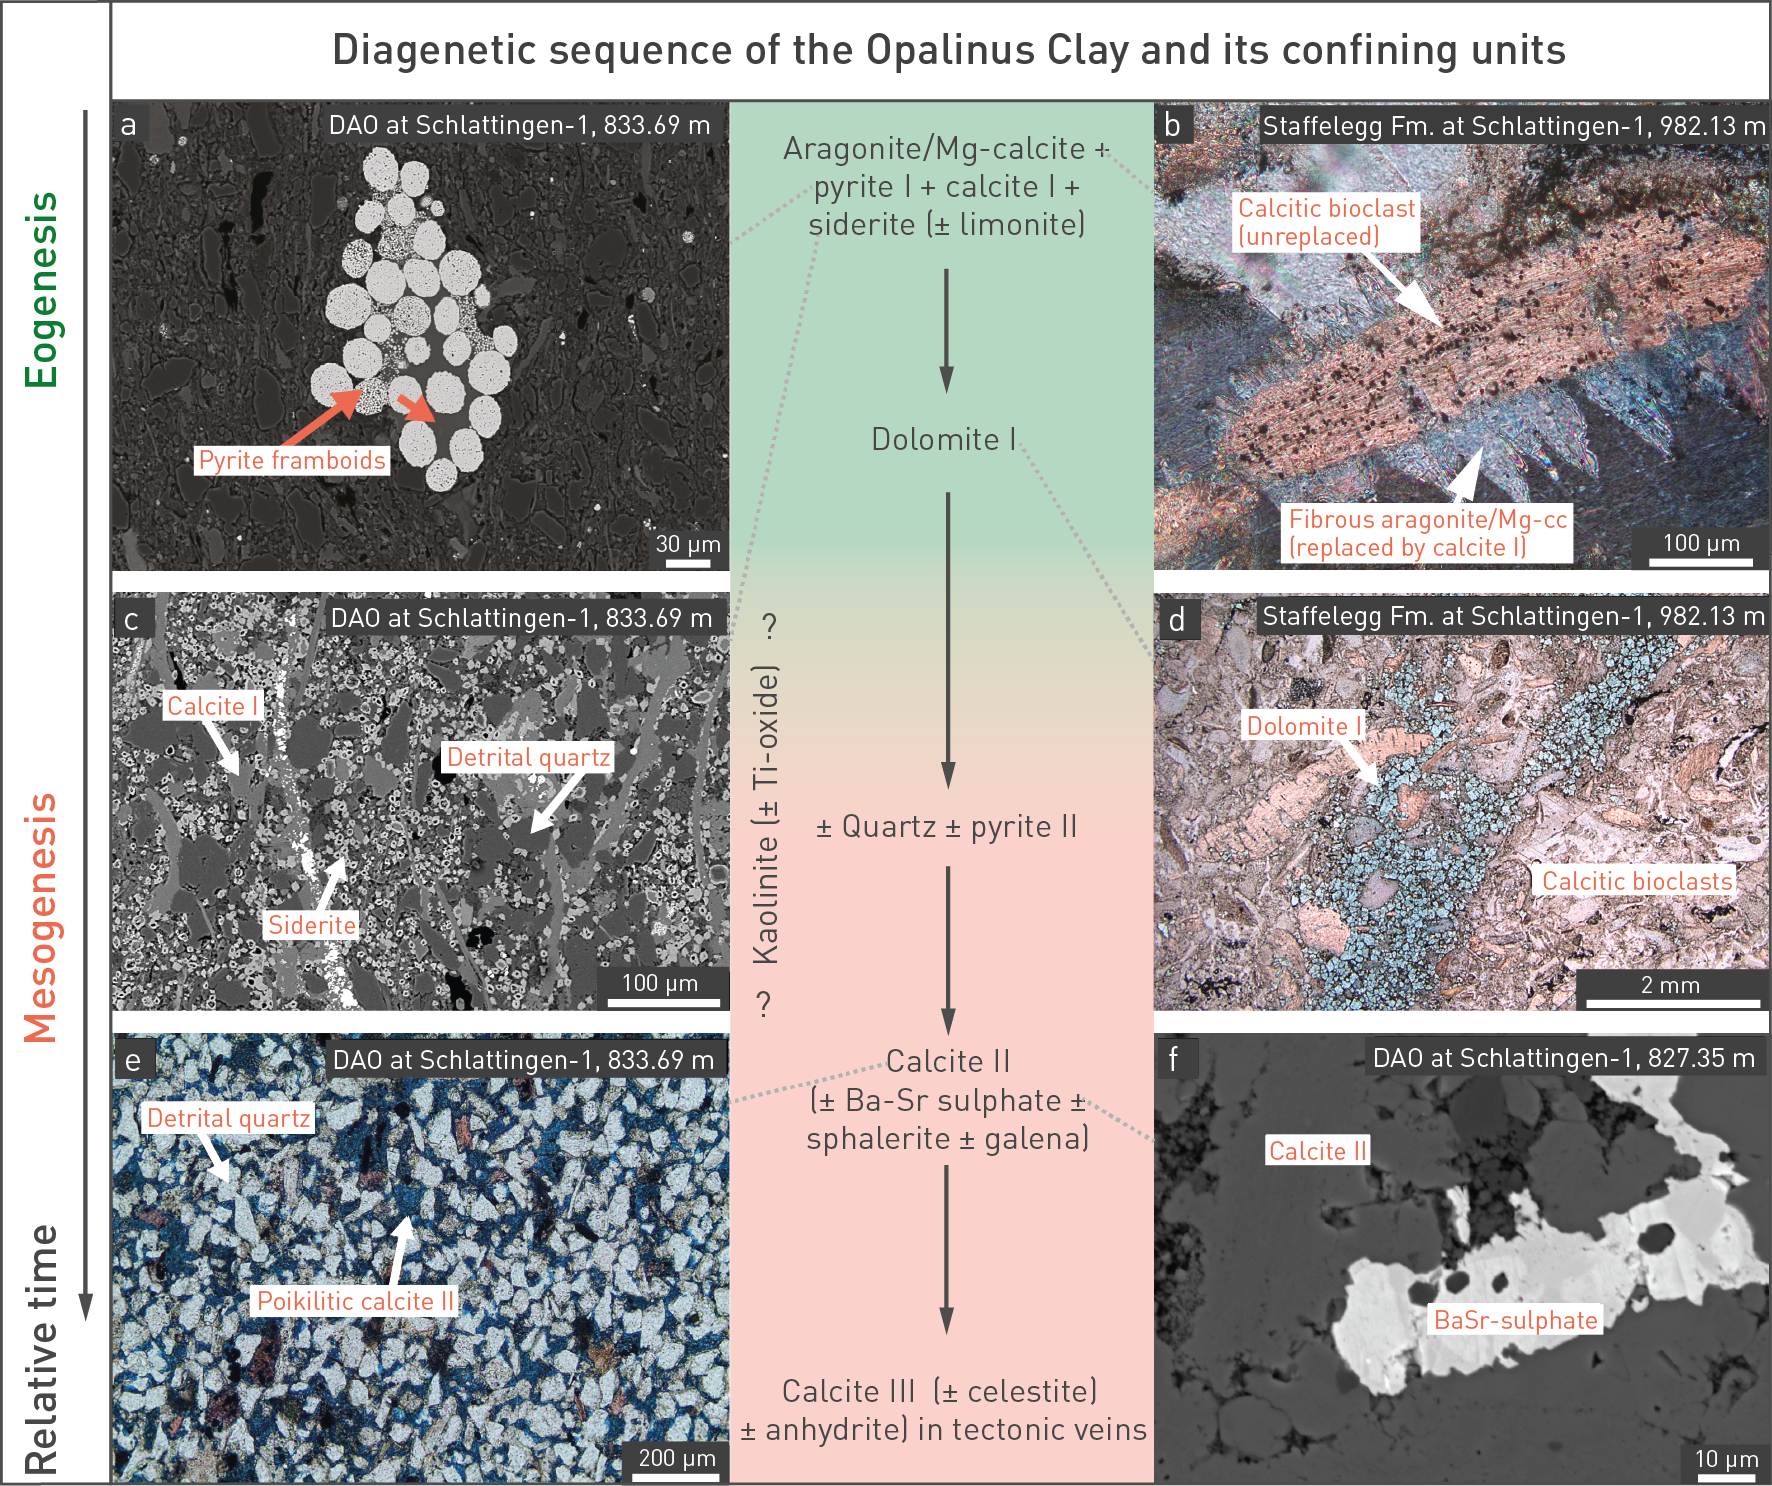
Fig. 5‑7:Diagenetic minerals and their relative temporal sequence of precipitation in the Opalinus Clay and its confining units in Northern Switzerland
Modified after Mazurek & Aschwanden (2020): (a) Agglomerated framboids of pyrite. (b) Blocky (Fe-)calcite I replacing early fibrous aragonite/Mg-calcite cements in bioclast-rich zones. (c) Siderite concretion in a silty lens cemented with calcite II. (d) Dolomite I in a bioclast-rich zone. (e) Poikilitic calcite II cementing a silty lens. (f) Ba-Sr sulphate filling residual intergrain pore space after cementation by calcite II (a), (c), (f): Scanning electron microscope backscattered electron image (SEM-BSE); (b), (d), €: transmitted light microscopy). All photos from Mazurek & Aschwanden (2020) and Wersin et al. (2013). DAO: Dogger Group above Opalinus Clay.
There are no major systematic differences in the diagenetic cements and their relative timing over the study area, and no evident distinctions between the Opalinus Clay and the confining units can be made except for the fact that diagenetic effects are quantitatively more strongly expressed in the latter.
Implications for porosity and pore-size distribution in the Opalinus Clay: Based on the spatial homogeneity of diagenetic effects and the regionally consistent occurrence of different subunits, porosity and pore-size distribution can be considered to depend mainly on the maximum burial depth and on the current depth (i.e. the degree of uplift and decompaction). This implies that corresponding data are transferrable among sites with comparable burial and uplift histories.
Implications for porewater chemistry of the Opalinus Clay: As the inventory of detrital and diagenetic minerals present in the Opalinus Clay does not vary over the study area, it can be concluded that the mechanisms by which the rock controls the chemical composition of the porewater are regionally constant and can be treated in one single porewater model.
The combination of numerous laboratory analyses and calibrated data from geophysical borehole logs provides detailed, unbiased and highly resolved information on the mineralogical composition of the Opalinus Clay and its confining units.
The mineralogical composition of the Opalinus Clay shows no systematic variability laterally, i.e. the three siting regions are equivalent in this respect. Vertically, a slight upward decrease in the clay-mineral content and a slight increase in the illite/kaolinite ratio can be observed consistently throughout the study area. Overall, the mineralogy of the Opalinus Clay is homogeneous and predictable in the study area.
Large parts of the confining units are also clay-mineral-rich but show higher variability. The underlying Staffelegg Formation (Lias Group) shows little heterogeneity horizontally but consists of several members with distinct properties vertically, including subordinate limestones and silt-/sandstones. The Dogger Group above Opalinus Clay shows heterogeneity both vertically and horizontally and, apart from clay-rich lithologies, also includes limestones, silt-/sandstones and iron-rich oolites.
Diagenetic effects on the Opalinus Clay include some degree of cementation by calcite, mainly localised in silty, calcareous and bioclastic beds and lenses. Siderite occurs in cm-sized lenses or disseminated in the rock. The clay-rich matrix is very weakly cemented, which is a favourable feature from the perspective of self-sealing potential.
Diagenetic mineralisation in the rock matrix is more strongly developed in the confining units. Various diagenetic trace phases were formed, some of which are relevant as controls of the porewater composition (e.g. Ba-Sr sulphate and celestite).
The inventory of detrital and diagenetic minerals present in the Opalinus Clay does not markedly vary over the study area. The mechanisms by which the rock controls the chemical composition of the porewater are thus regionally constant and can be treated in one single porewater model.
Key points:
- The Opalinus Clay in the siting regions is characterised by a porosity of 10 – 13 vol.‑% with low variability and only minor differences with depth.
- The mean pore size of the Opalinus Clay is in the range of a few nanometres.
- A general increase of porosity with increasing clay-mineral content is observed for most clayrocks.
- Clay-mineral-poor sections of the confining units are typically characterised by low porosity and larger pore sizes than in the Opalinus Clay.
Porosity and pore-size distribution are relevant determining factors for a number of rock properties and states, such as permeability (Section 5.6), porewater chemistry (Section 5.4), diffusion coefficients (Section 5.8), and various geomechanical parameters (Section 5.5). The three-dimensional architecture and connectivity of different pore types also determine the anisotropy of many rock properties. Clay-rich rocks in general, and the Opalinus Clay in particular, are characterised by a relatively large porosity but, at the same time, extremely small pore apertures (the average value for the Opalinus Clay is around 2 – 3 nm).
Several laboratory methods were used to quantify porosity, including the measurement of water content upon heating to 105 °C (yielding water-loss porosity), density measurements (yielding pycnometer porosity), or based on diffusive isotope exchange experiments (yielding porosity from isotope exchange). The methodologies are documented in Waber (2020). While the physical basis for the porosity determination differs substantially between these methods, the results converge, despite small method-specific differences. In addition to laboratory-based methods, porosity was also quantified from borehole logs (Becker & Marnat 2024).
Along the investigated profiles (Fig. 5‑8), porosity is mostly below 0.15 (expressed as the fraction of pore space relative to bulk rock volume). The Opalinus Clay shows little variation in the continuous log-derived porosity profiles. Porosities are generally very low in the Malm Group section (< 0.05), pointing to well cemented rock. Particularly low porosities are also observed at the base of the Bänkerjoch Formation, in the zone where typically massive anhydrite occurs. A substantial variation is seen within the Muschelkalk aquifer, with higher values in the upper, dolostone-dominated part (Sections 4.2.2 and 4.5.3.12).
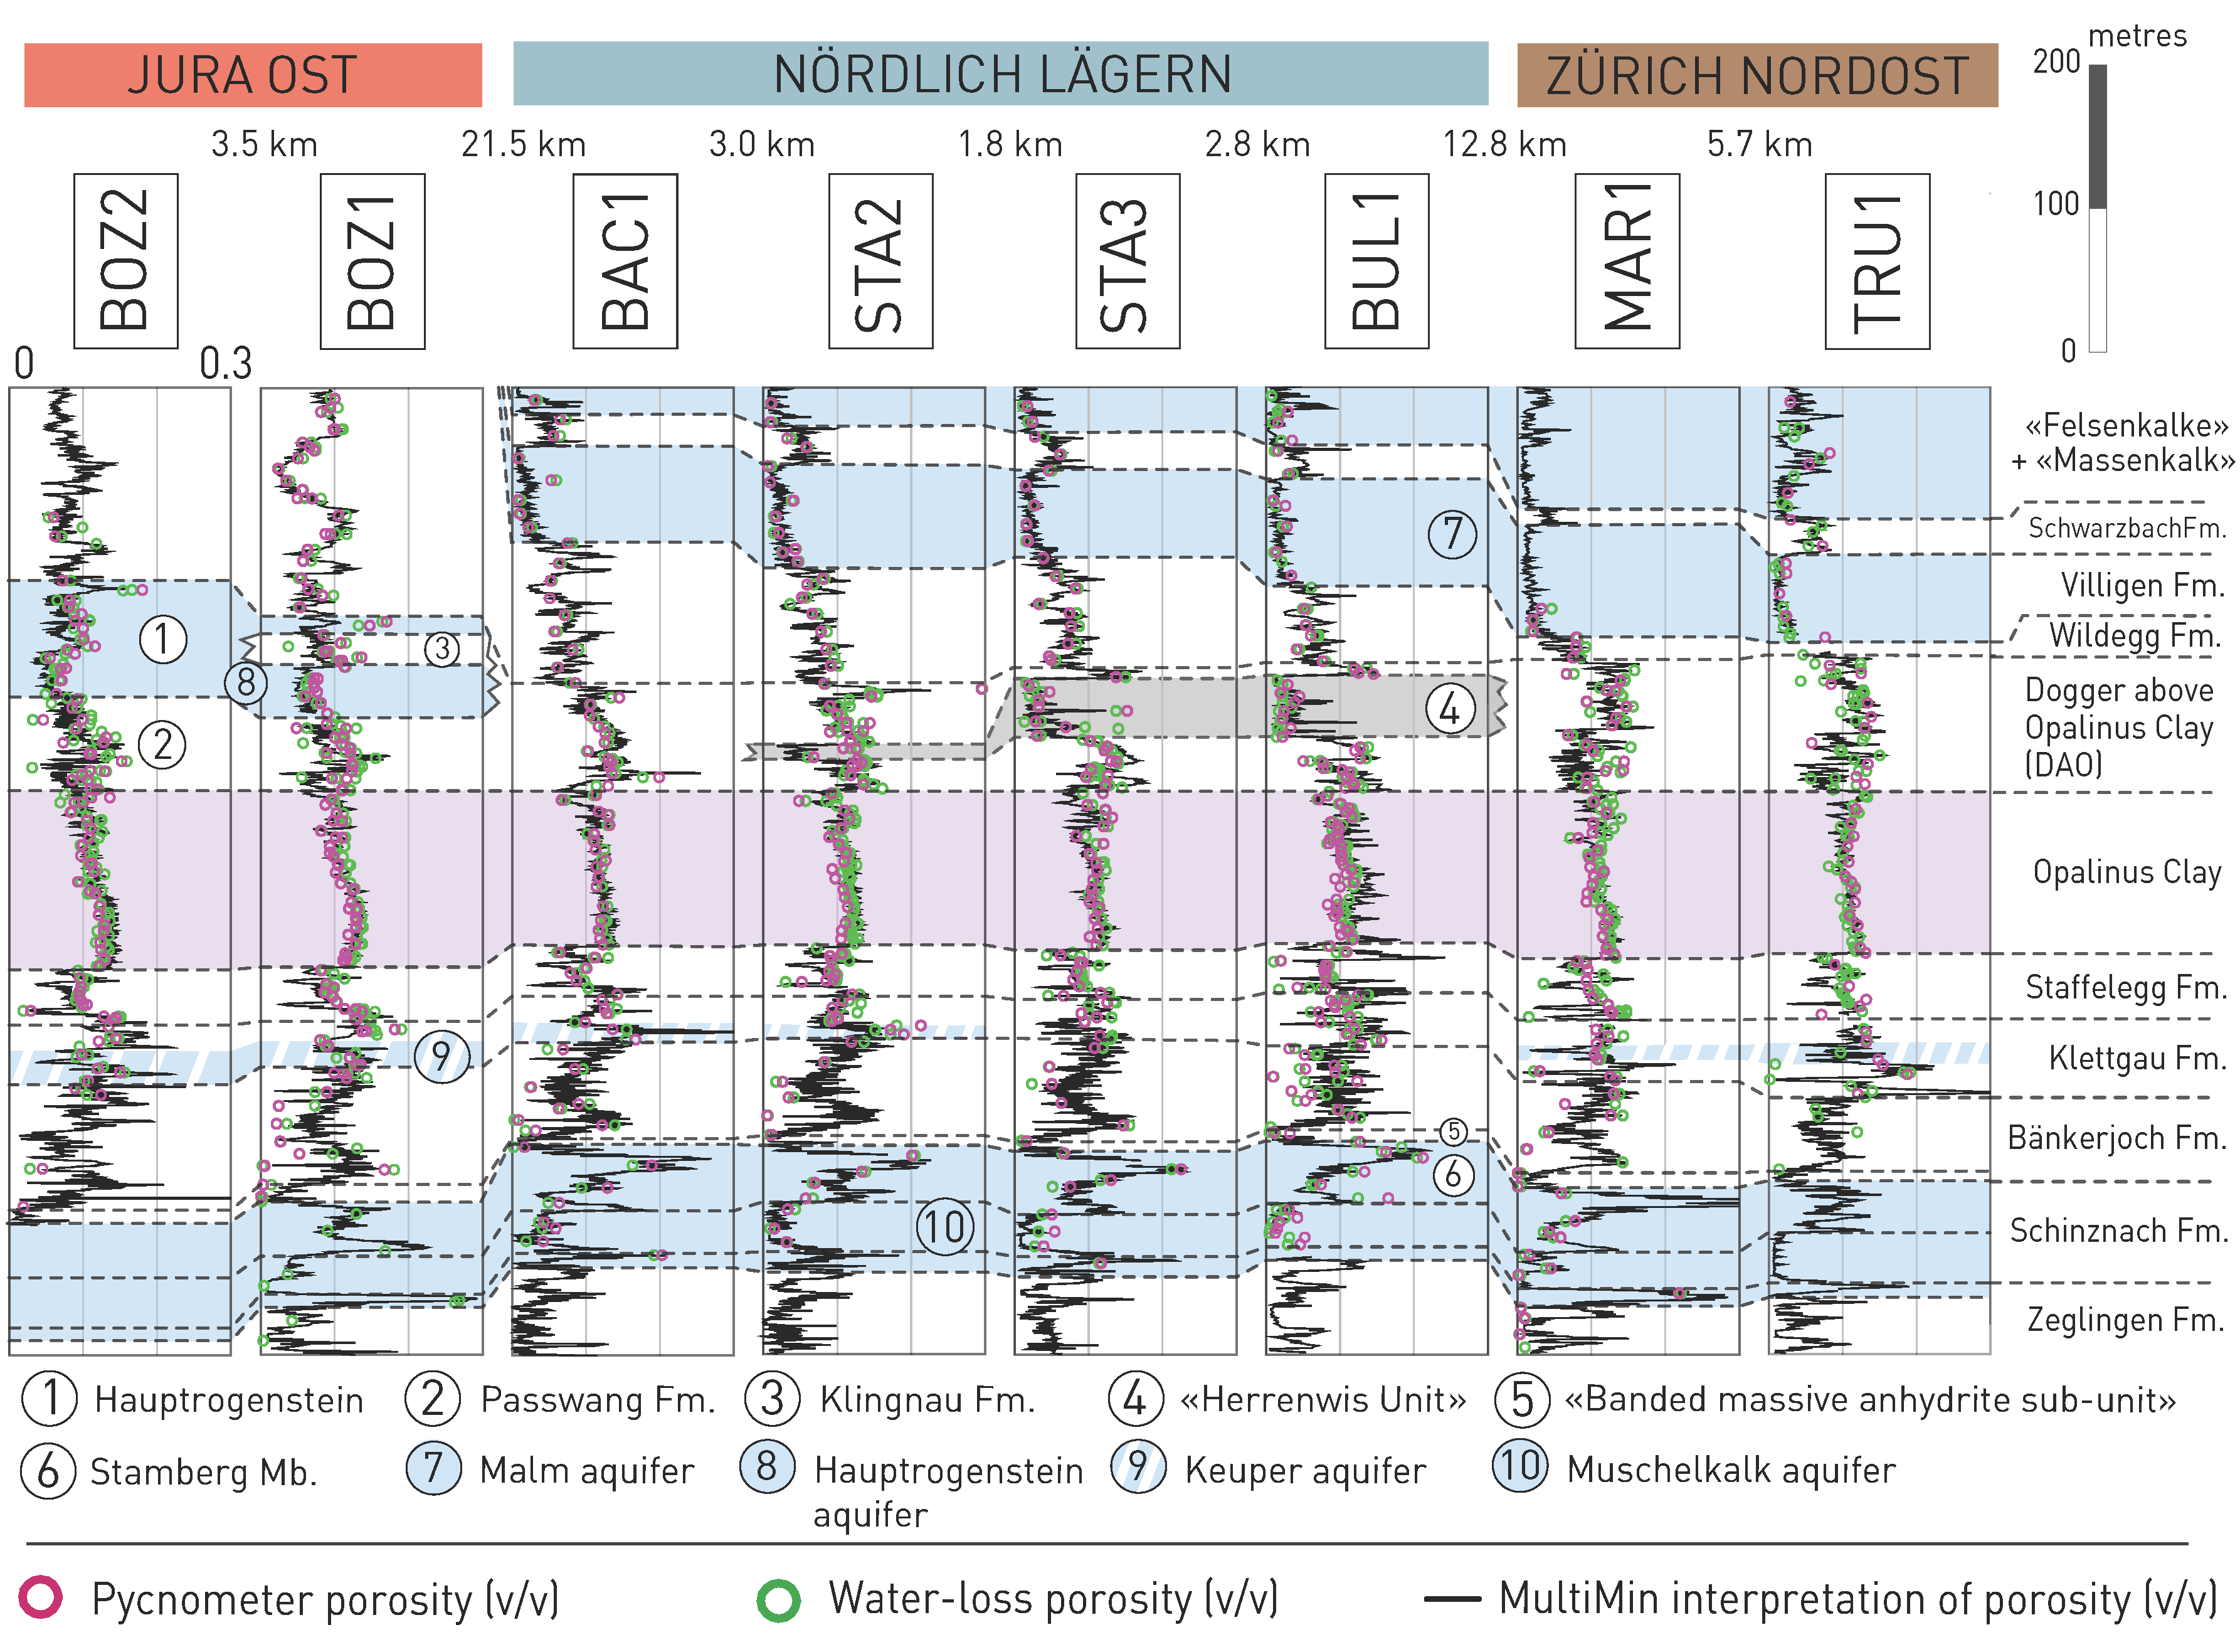
Fig. 5‑8:Porosity profiles from selected boreholes in the siting regions
Blueish shading depicts the regional and local aquifers while the purple shading depicts the Opalinus Clay. The continuous MultiMin-porosity profiles (Becker & Marnat 2024) are computed from geophysical logging data and are calibrated with drill-core analyses.
The typical range for porosity in the Opalinus Clay in the siting regions is 0.10 – 0.13 (Fig. 5‑9). At the Mont Terri rock laboratory (Fig. 5‑10), the porosity is somewhat higher (0.12 – 0.15), which can be explained by the external position relative to the Alpine front and therefore shallower Miocene burial and compaction (details in Mazurek et al. 2006). There is a moderate correlation between the current depth of the Opalinus Clay and its porosity (Fig. 5‑10). The median porosity is around 0.11 for the BUL1 and TRU1 boreholes, where the Opalinus Clay occurs at 820 – 1'000 m depth, while it is around 0.12 at shallower depth in boreholes BOZ1 and BOZ2 (450 – 650 m depth). The porosity increase associated with unloading from 1'000 m to 400 m depth can be estimated from oedometric test results (Section 5.5.2). This yields an approximately 0.002 to 0.007 increase in porosity. It is therefore conceivable that other factors in the burial history contributed to the slightly different porosities observed at the different depth intervals, for example a lower maximum burial depth during Miocene times, where Molasse sediments are mostly absent in the JO siting region (Section 3.4.3).
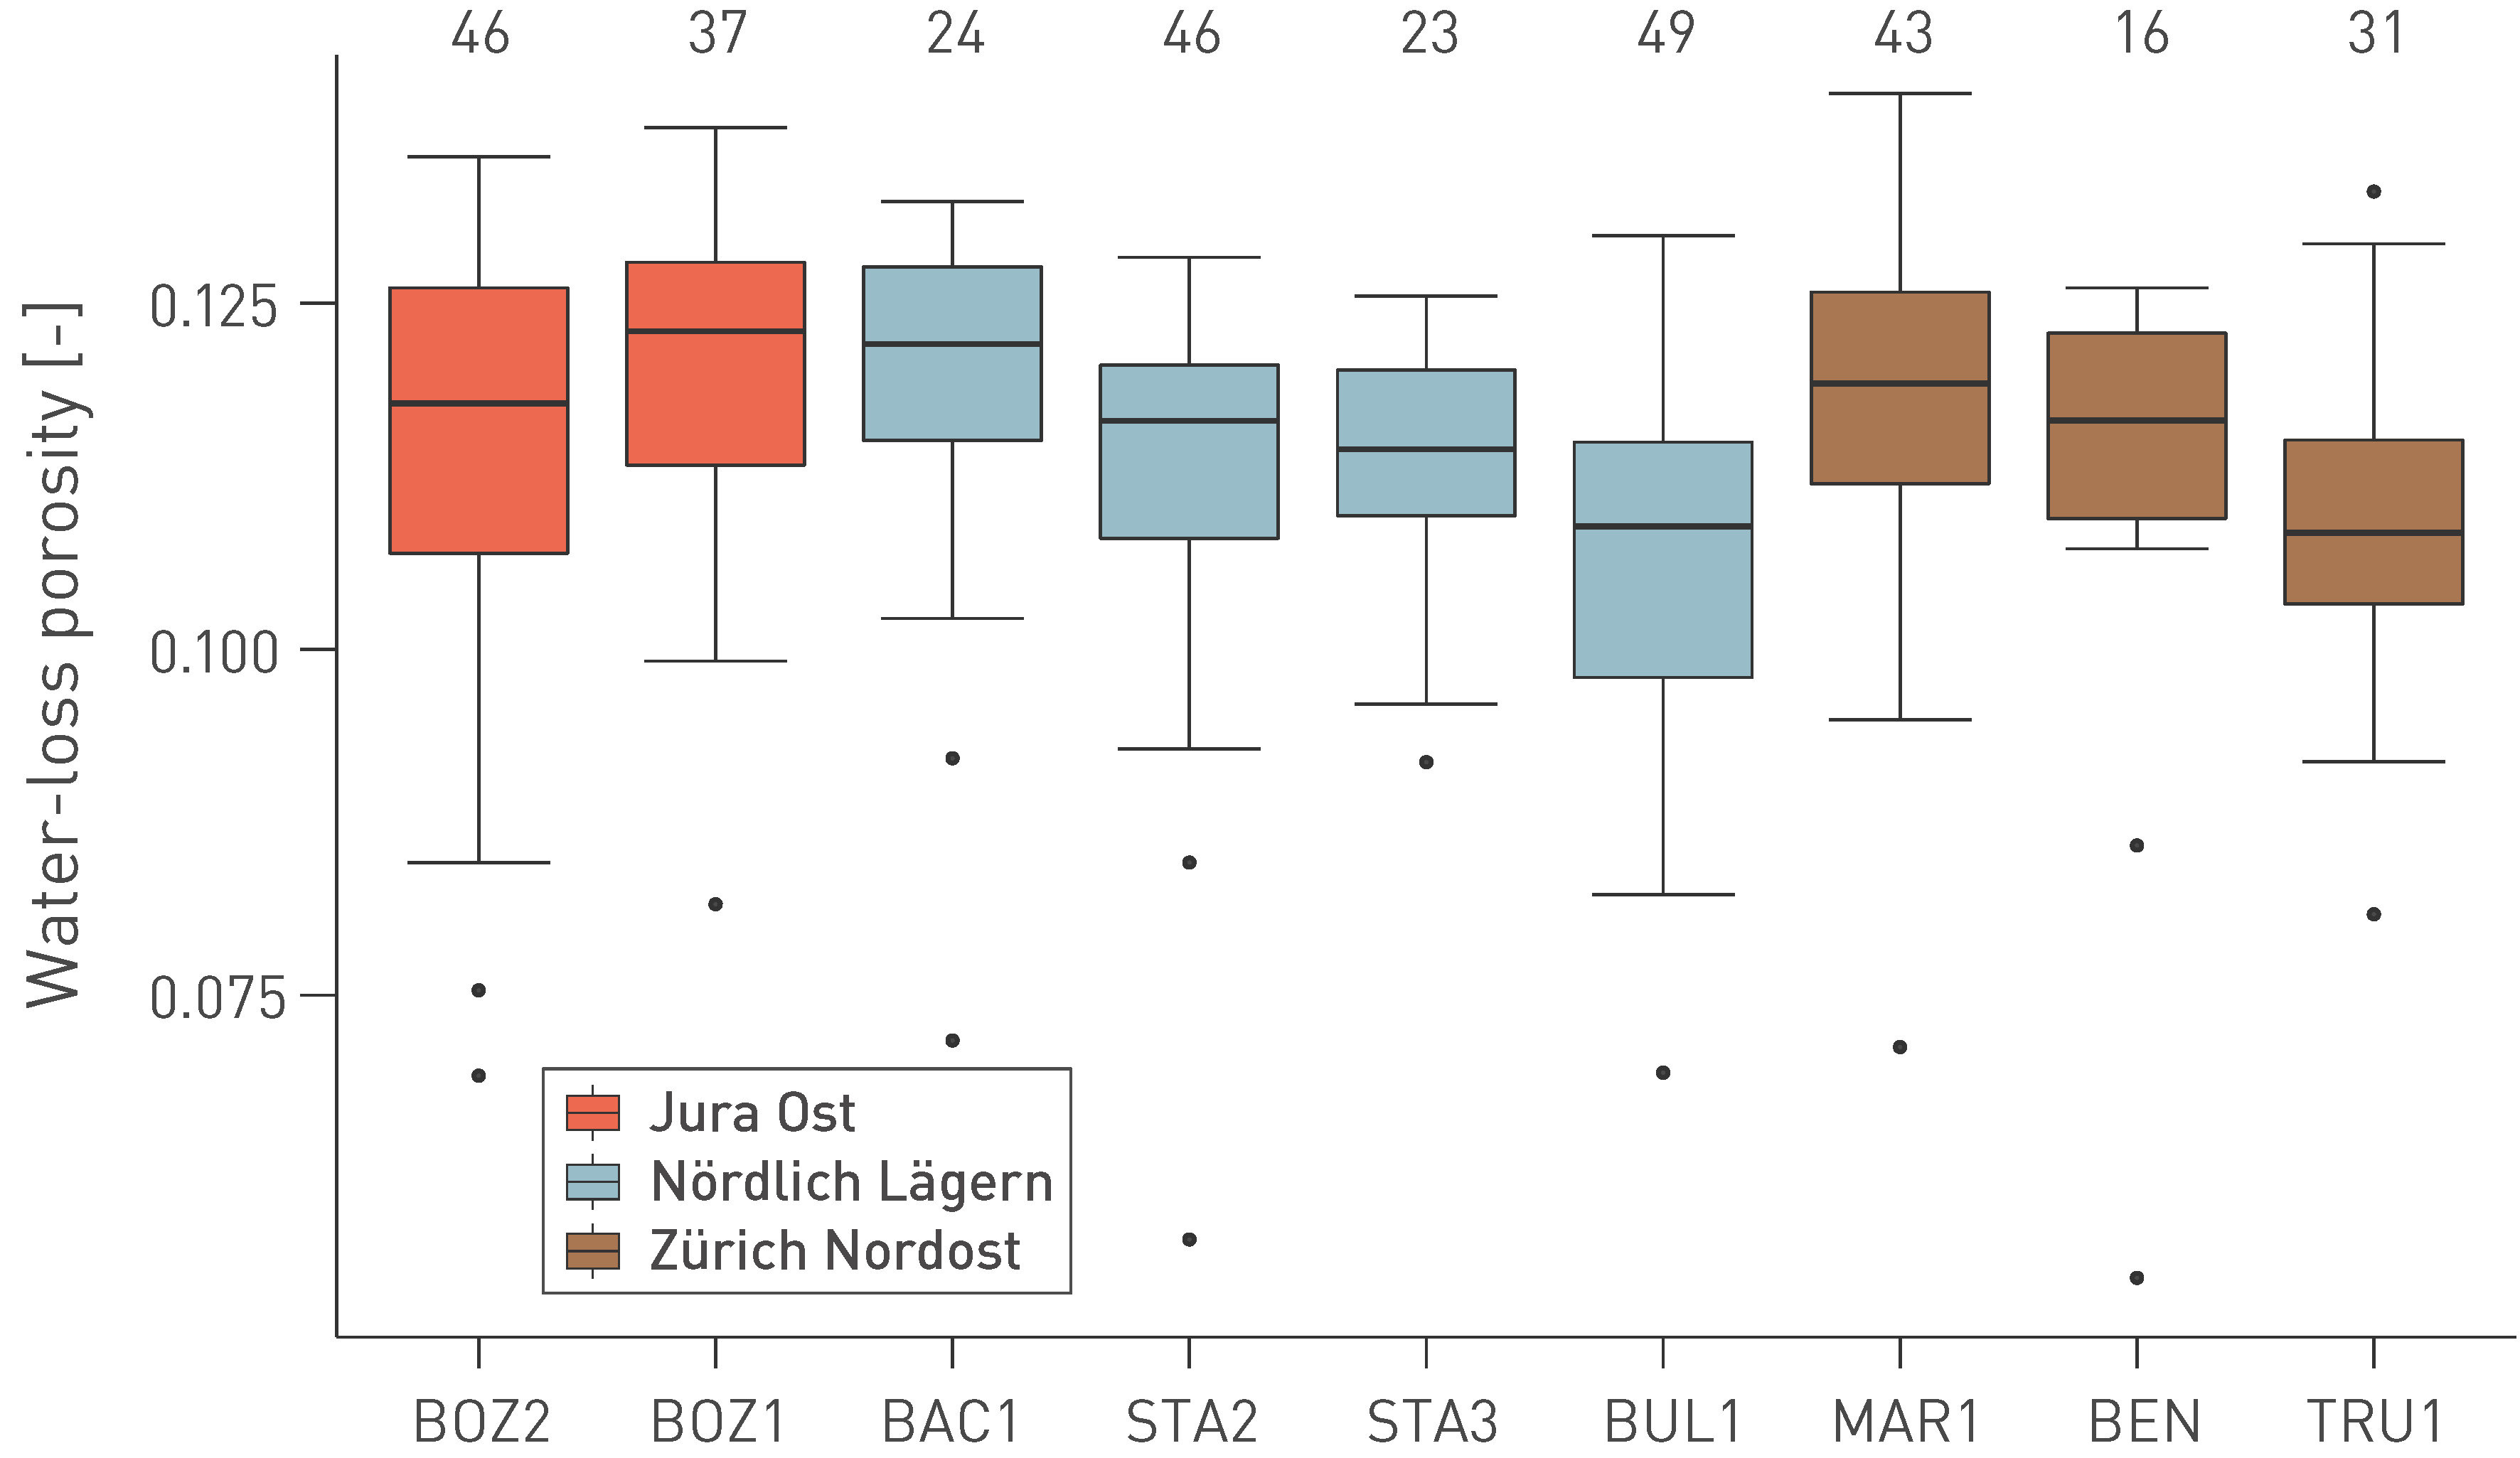
Fig. 5‑9:Water-loss porosity of the Opalinus Clay
Each box encloses 50% of all measured values. The horizontal line in the box indicates the median, and the whiskers (error bars) the minimum and maximum values (min: 25th percentile – (1.5 × interquartile range); max: 75th percentile + (1.5 × interquartile range)). The black circles indicate outliers. The values above the boxplots denote the number of samples.
The scatter of porosity is remarkably low (1s deviations are 0.010 – 0.016) within the Opalinus Clay. Outliers towards lower porosity are related to clay-poor, often well cemented beds in the upper part of the formation (Fig. 5‑10). At Mont Terri, the most prominent outliers occur in the «Carbonate-rich silty sub-unit», which is not observed in the siting regions in Northern Switzerland.
The increased variability of porosity in the Dogger Group above Opalinus Clay reflects the higher lithological heterogeneity of this sequence both vertically and laterally (Fig. 5‑8). Particularly low matrix porosities are found in the limestones of the «Herrenwis Unit» of STA3 and BUL1, and in the Hauptrogenstein of BOZ1 and BOZ2. Nevertheless, the average porosity is relatively high (0.10), given the generally clay-rich lithologies present in the Dogger Group above Opalinus Clay.
Porosity in the Staffelegg Formation also varies over a wide range, but the variability shows a systematic vertical pattern over the area of the siting regions, reflecting variation in clay-mineral contents (Mazurek et al. 2023a). The lowest porosity values are found in the limestones of the Beggingen and the Grünschholz, Breitenmatt and Rickenbach Members, whereas all other members yield averages of 0.08 – 0.11.
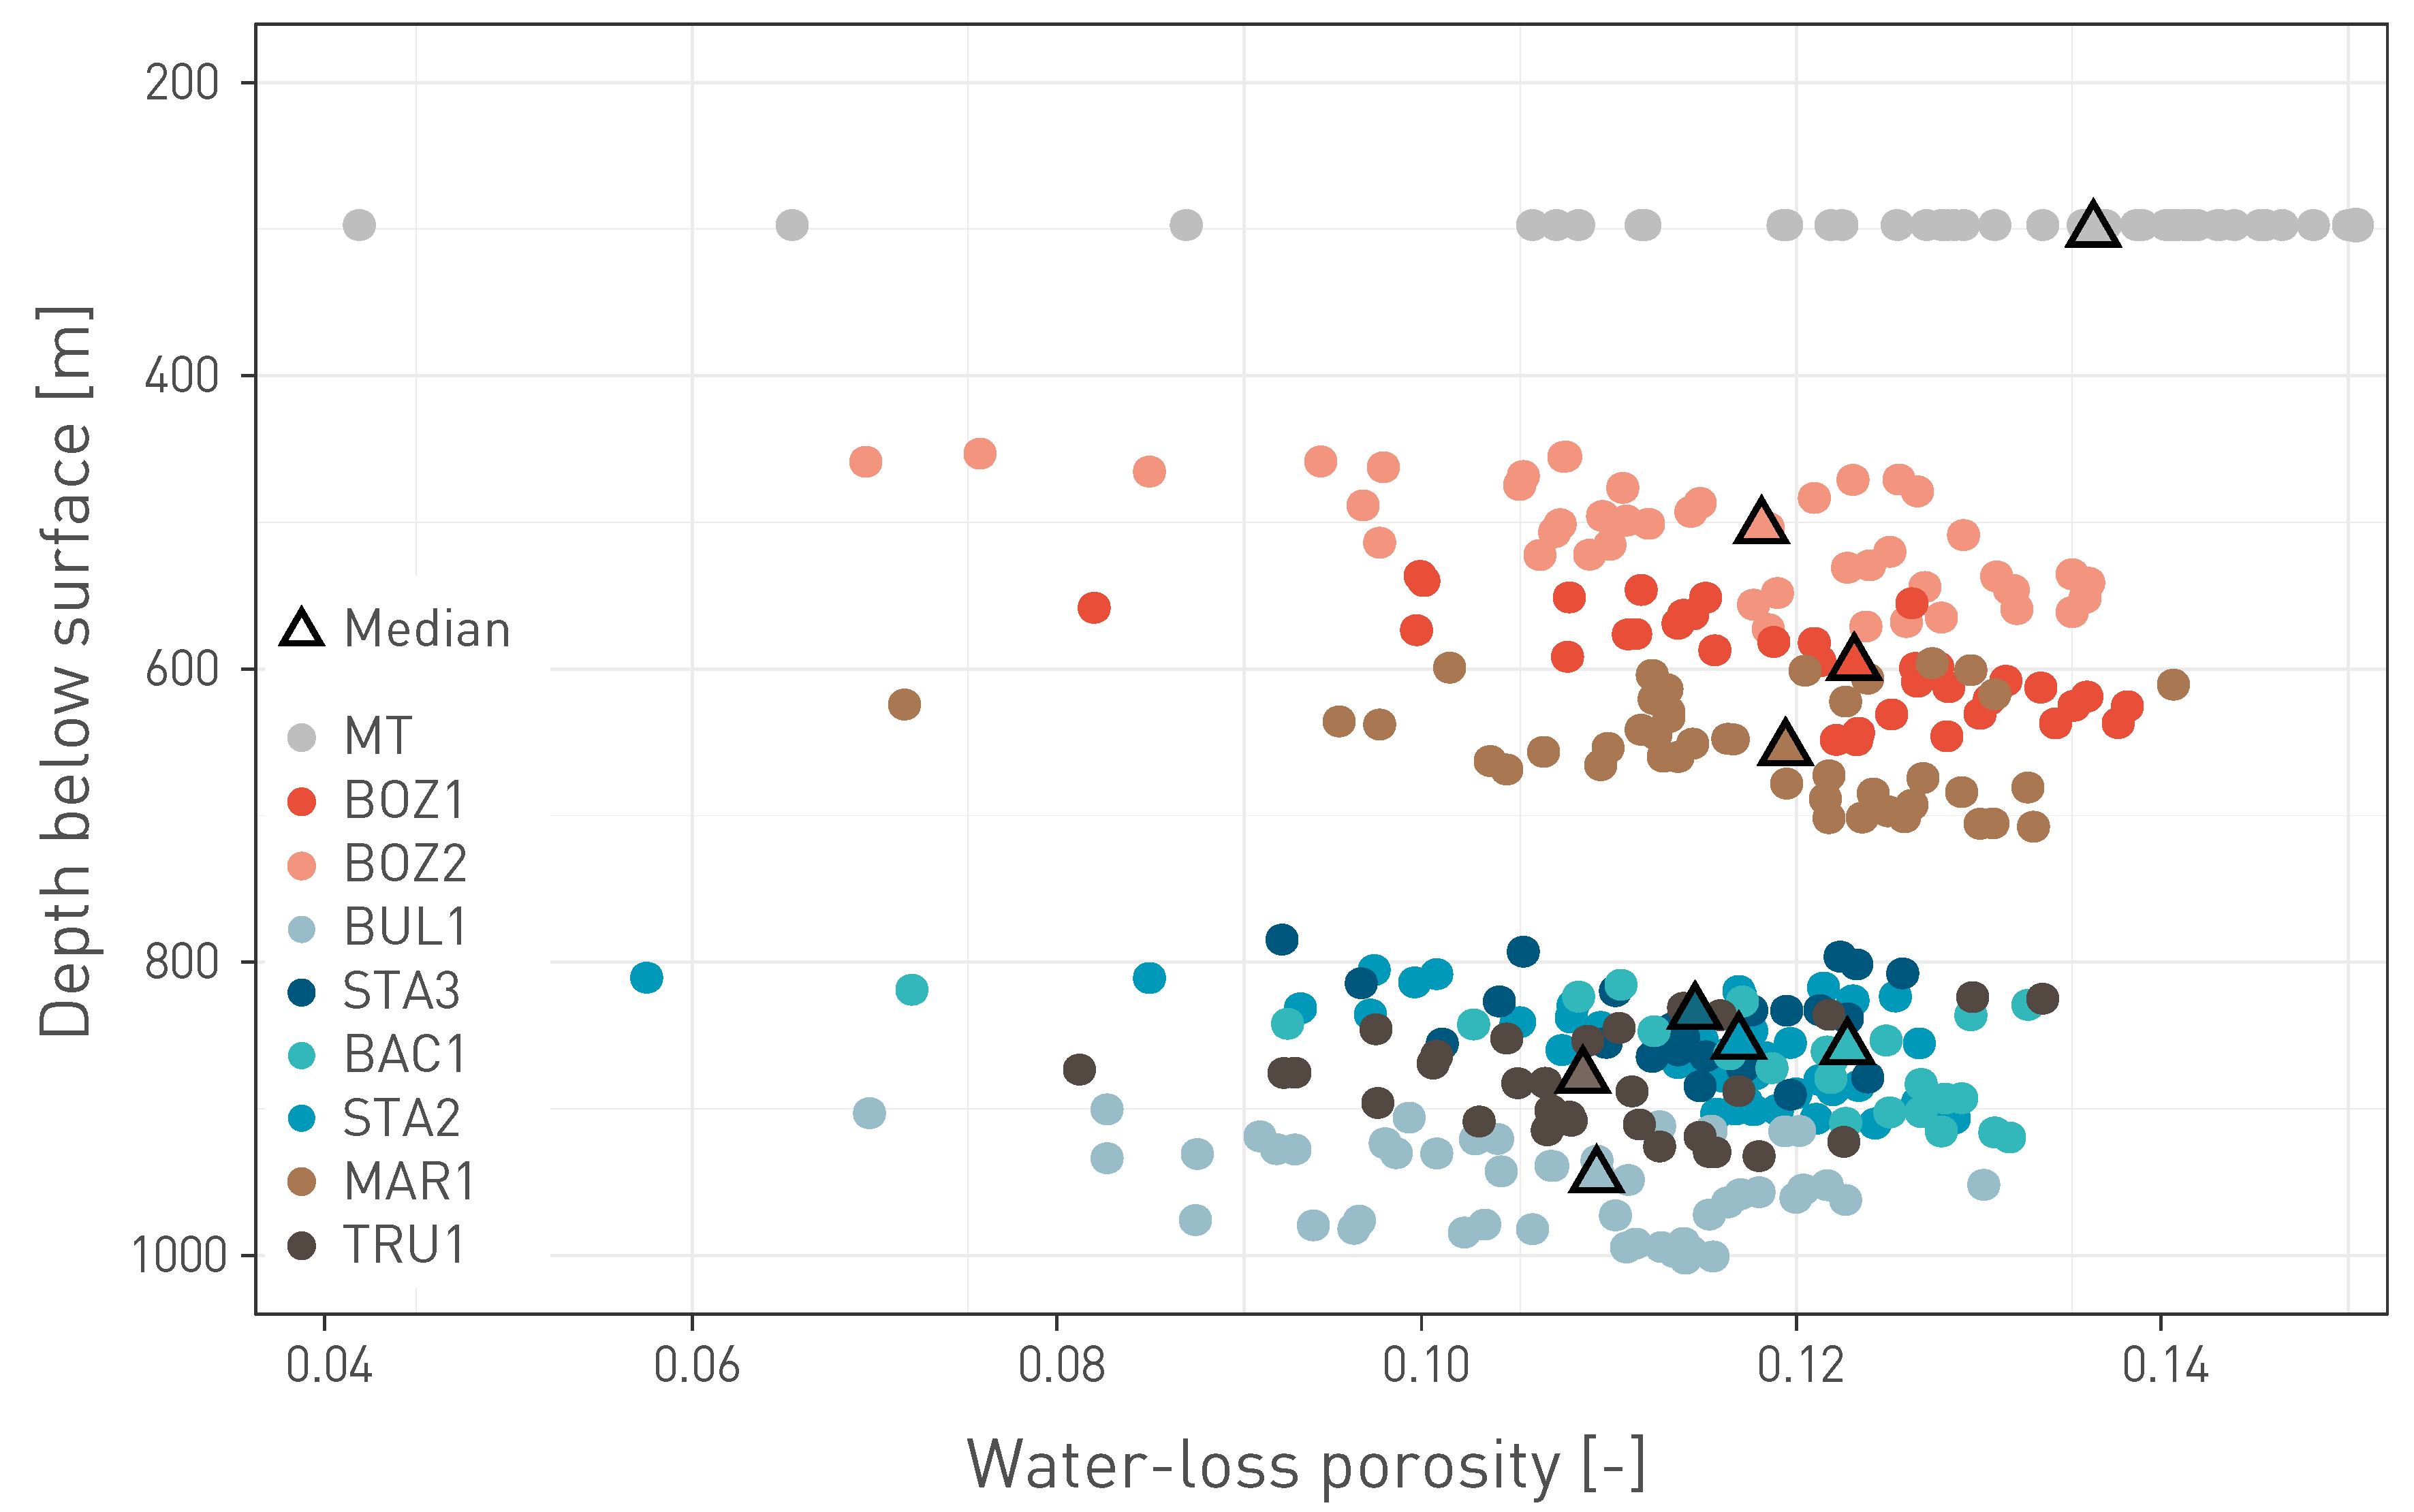
Fig. 5‑10:Water-loss porosity of the Opalinus Clay in different boreholes as a function of current depth
Triangles indicate the borehole-specific median values (plotted at mid formation depth).
Mont Terri (MT) data refer to the BDB1 borehole (complete profile) and are shown at a nominal depth of 300 m.
In the Jurassic profile, a good correlation is found between clay-mineral content and porosity, even though several outliers towards higher porosity can be identified (Fig. 5‑11). These originate from Fe-rich oolites (e.g. Wutach Formation, «Humphriesioolith Formation», «Murchisonae-Oolith Formation»), from the Hauptrogenstein (oolitic limestone) and from the reef facies of the «Herrenwis Unit». All samples from these units are shown with open symbols in Fig. 5‑11, together with sandstones (but not the more clay-mineral-rich lithologies) of the Wedelsandstein Formation. All these units have in common that, at the time of deposition, they contained large mechanically competent grains, such as ooids, abundant quartz in the sand fraction and coarse-grained calcite from the reef. As suggested by Mazurek et al. (2023a) and following earlier work (e.g. Revil & Cathles 1999), it is conceivable that the compaction of such grain-supported lithologies led to less reduction of porosity when compared with the other, in general matrix-supported units (clay and micrite). When these outliers are screened out, a power-law function provides a good fit of the measured data (Fig. 5‑11). The slope of the fit curve is 0.010 – 0.016 at low clay-mineral contents but flattens out to < 0.0015 at contents > 40 wt.-%. As discussed in more detail in Mazurek et al. (2023a), considering pore-size distributions based on N2 ad‑/ desorption isotherms (see below), the porosity data shown in Fig. 5‑11 can be considered to consist of two contributions: 1) Clay porosity between clay aggregates, with sizes of a few nm, and 2) porosity related to geometric incompatibilities between platy and granular minerals, with sizes in the range of tens of nm (Fig. 5‑12). Clay porosity can be assumed to be proportional to the clay-mineral content, whereas porosity due to incompatibilities is present in clay – carbonate mixtures but not in pure clay or carbonate. Extrapolating the trend line fitting the measured data in Fig. 5‑11 to pure clay leads to a porosity of 0.17. The red line then reflects the clay porosity, considering proportionality with the clay-mineral content. The curvature in the fit line reflects the additional pore type that occurs in lithologies in which platy clay minerals occur together with more isometric grains of calcite. The contribution of this pore type is at a maximum when both mineral types occur in comparable proportions and is of lesser relevance towards the pure clay and non-clay compositions.
The scatter that remains in the correlation between clay-mineral content and porosity even after screening out lithologies with grain-supported fabrics indicates that clay-mineral content is not the only parameter that controls porosity. The following additional factors probably play a role:
-
While the studied Jurassic sequence is dominated by mixtures of clay minerals and carbonates (i.e. claystones, marls and limestones), silty/sandy lithologies also occur but are less frequent. The decrease in porosity from claystone towards the quartz/feldspar corner as shown in Fig. 5‑13 is less strong compared to that towards the carbonate corner, indicating that the compaction behaviour of clay-mineral – quartz mixtures differ from that of clay-mineral-carbonate mixtures.
-
It can also be seen in Fig. 5‑11 that, even at the same clay-mineral content, systematic differences in porosity exist between different geological units. For example, the Opalinus Clay has a lower porosity than the overlying Dogger units of comparable clay-mineral content, a finding that cannot be explained by the only marginally different maximum burial depths. Rock fabric and porosity thus depend on other parameters as well, such as the rate of sediment deposition as this is related to the time available for early diagenesis. A low deposition rate means that the time over which early diagenesis acted on the unconsolidated sediment was longer, potentially leading to more extensive mineral reactions, such as dissolution and cementation, with consequences for the rock fabric and its compactional behaviour during later burial. The Opalinus Clay was deposited at a rate of about 50 – 60 m/Myr (referring to the current thickness in the compacted state), which is more than for any of the other Dogger units (see Section 4.2). The rapid burial is consistent with the observation that the Opalinus Clay is only weakly cemented and disaggregates when immersed in pure water, except in silty lenses in which sparitic calcite fills the pore space. In comparison, the average deposition rates for the underlying Staffelegg Formation and the Dogger Group above Opalinus Clay were 1.3 – 1.6 and 10 – 14 m/Myr, respectively, thus leaving more time for early diagenetic cementation and leading to a stiffer behaviour during compaction.
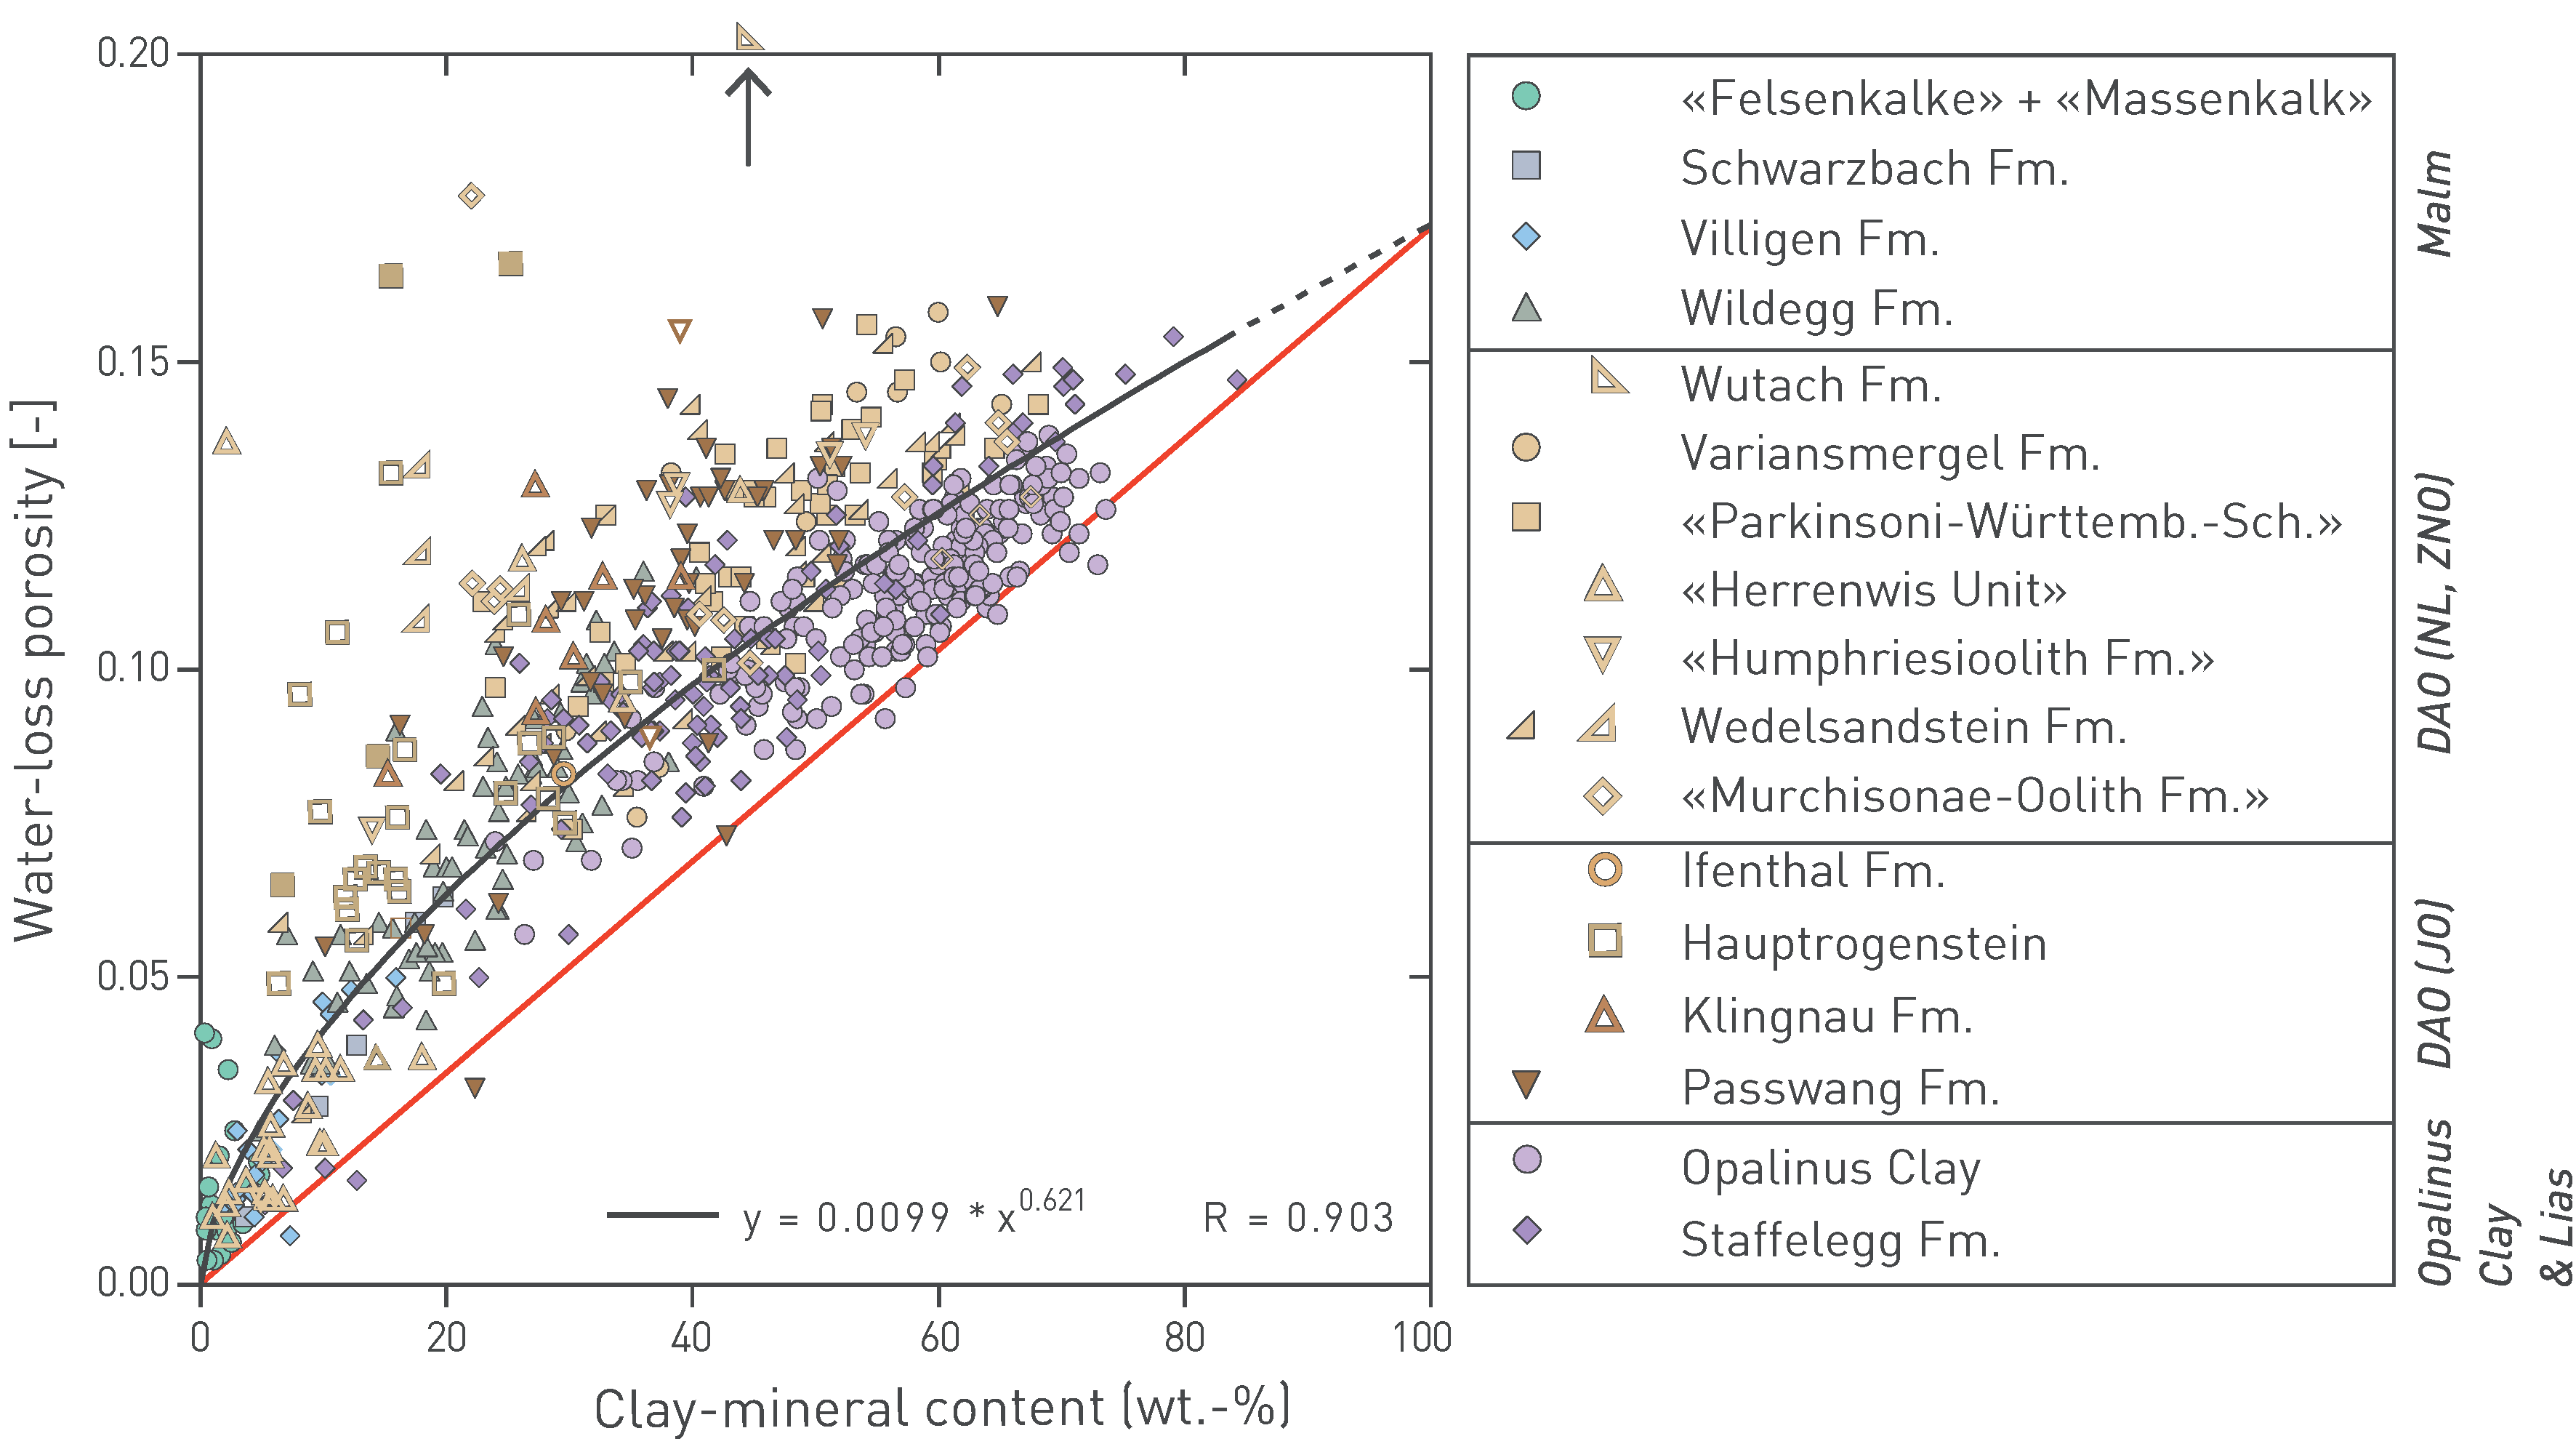
Fig. 5‑11:Relationship between clay-mineral content and porosity in the Jurassic section
Redrawn from Mazurek et al. (2023a). Points with open symbols were not considered for the calculation of the black fit curve (see text). The red line reflects the clay porosity, considering proportionality with the clay-mineral content. Arrow points to a sample with a porosity of 0.30. DAO: Dogger Group above Opalinus Clay, Fm.: Formation.
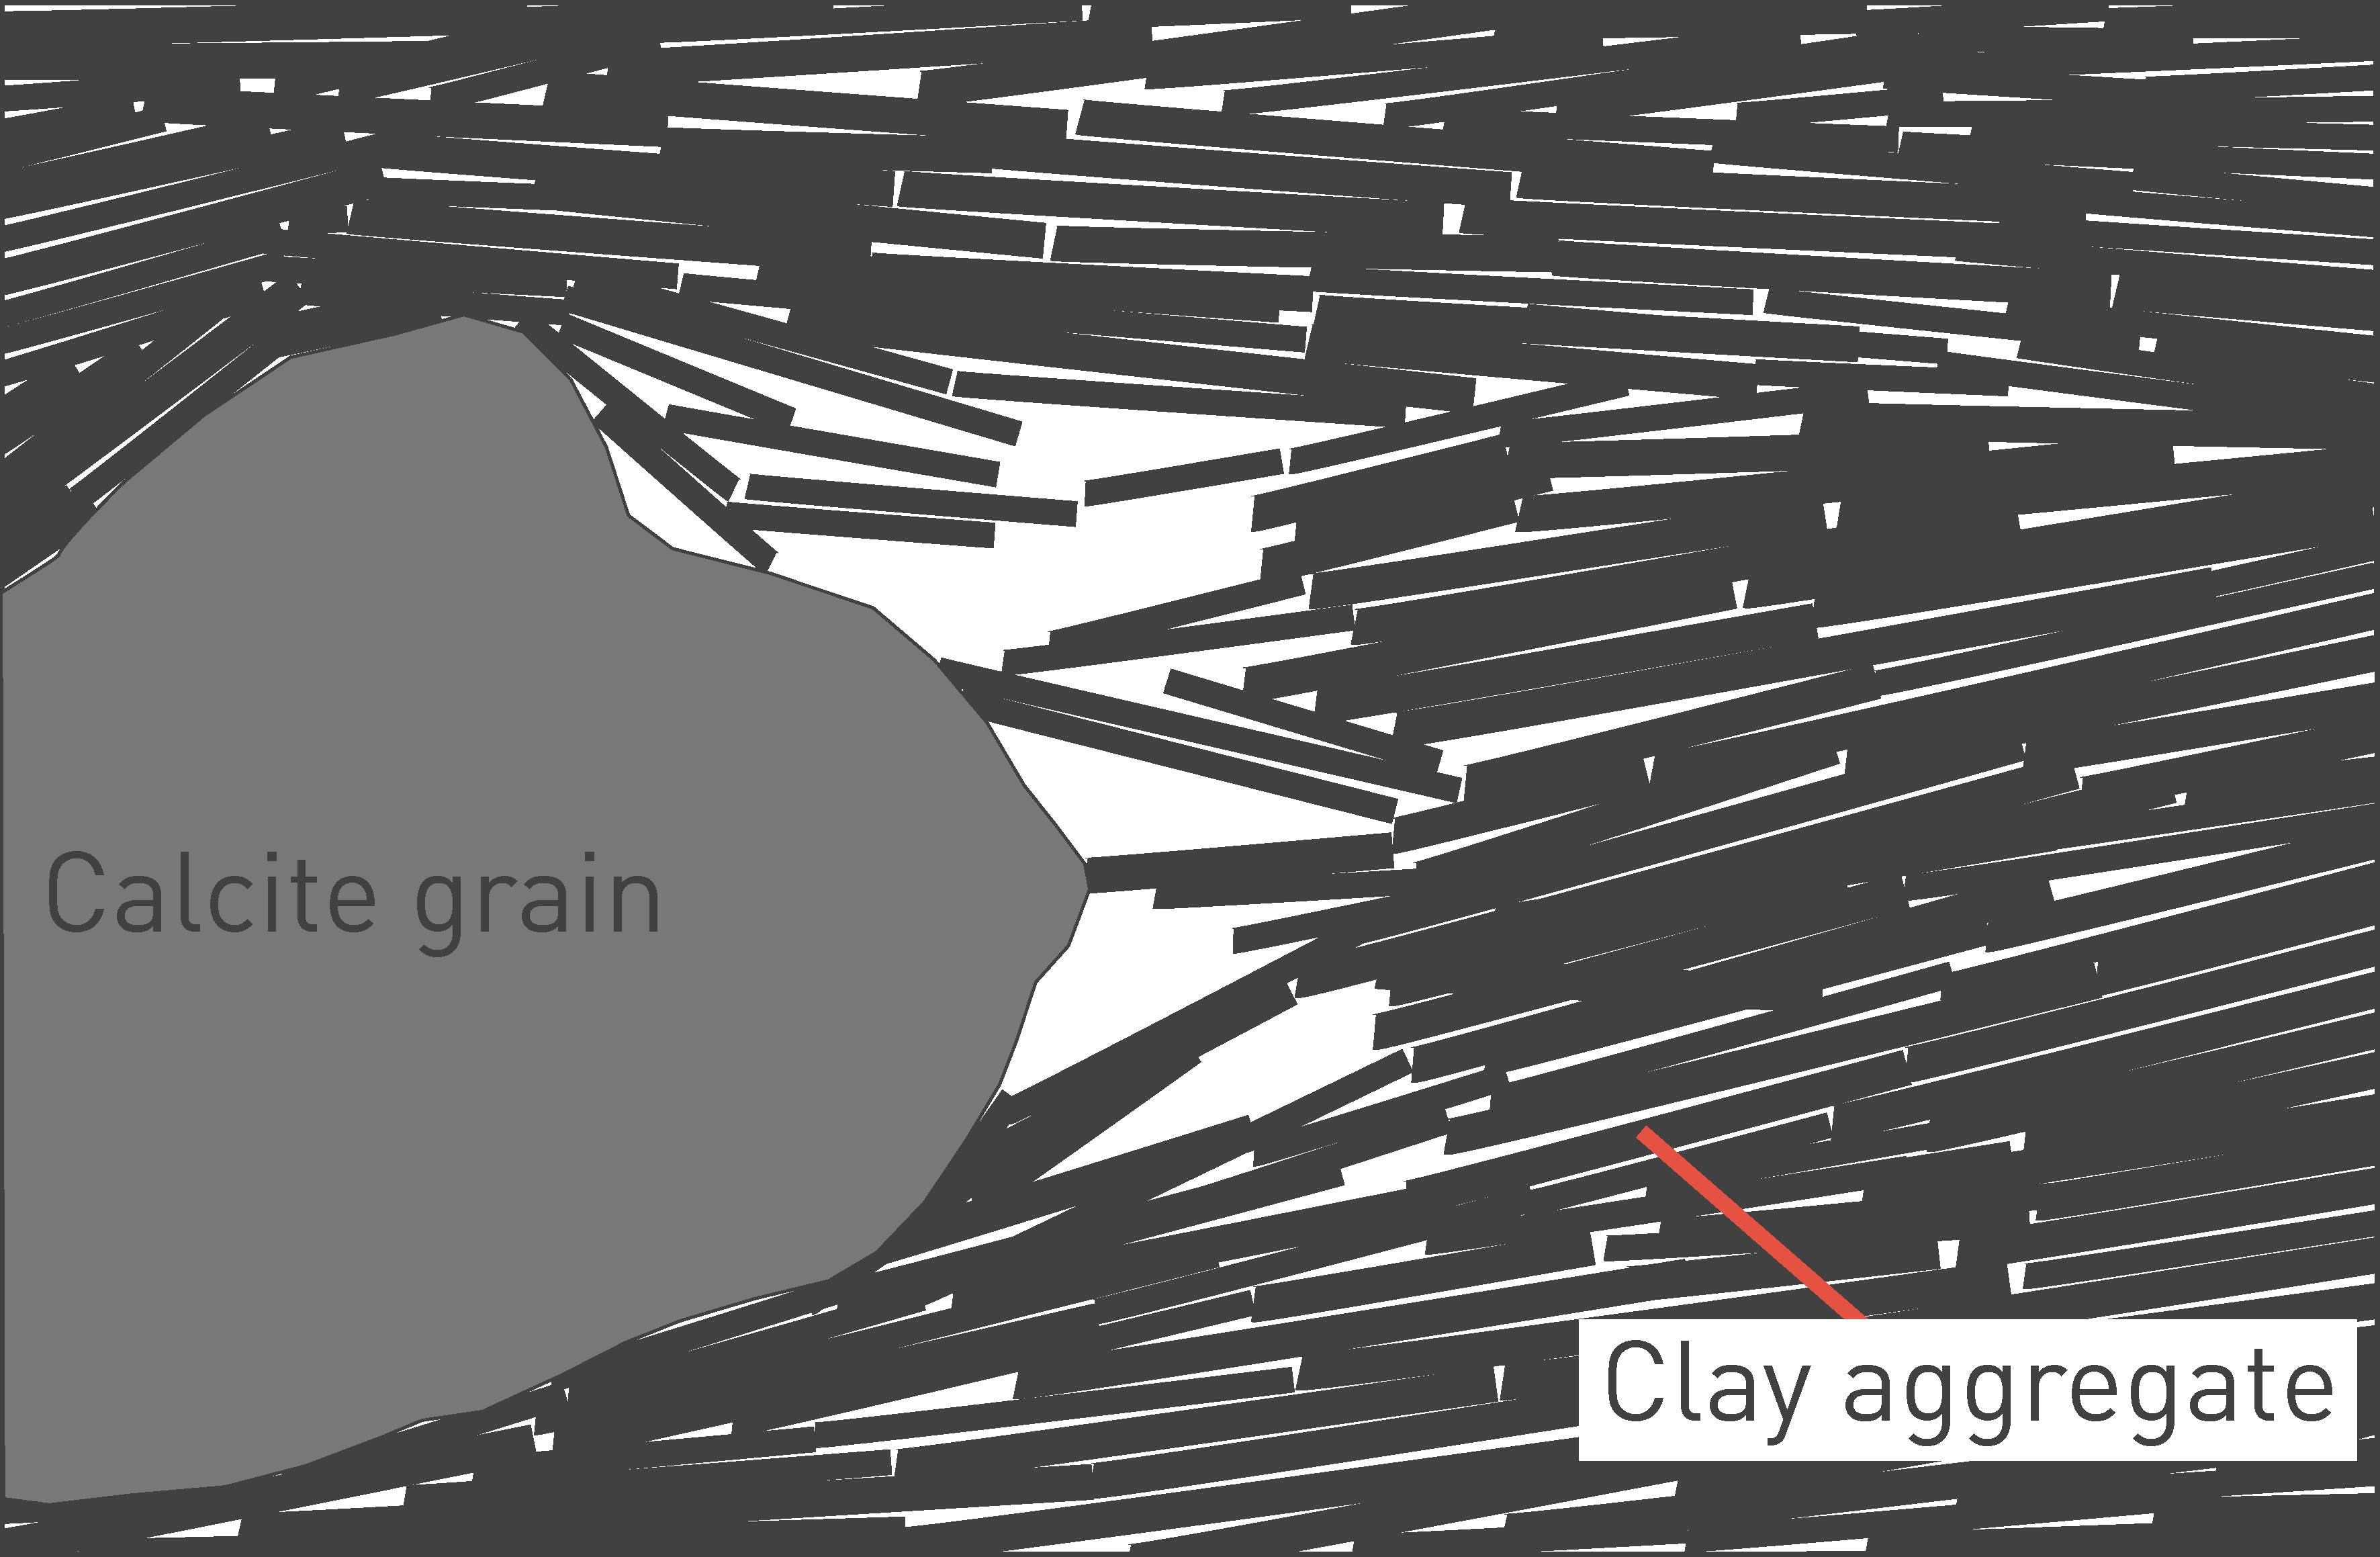
Fig. 5‑12:Conceptual view of the porosity types (white) in clay-carbonate mixtures
Redrawn from Mazurek et al. (2023a). Sketch width is ~ 1 µm.
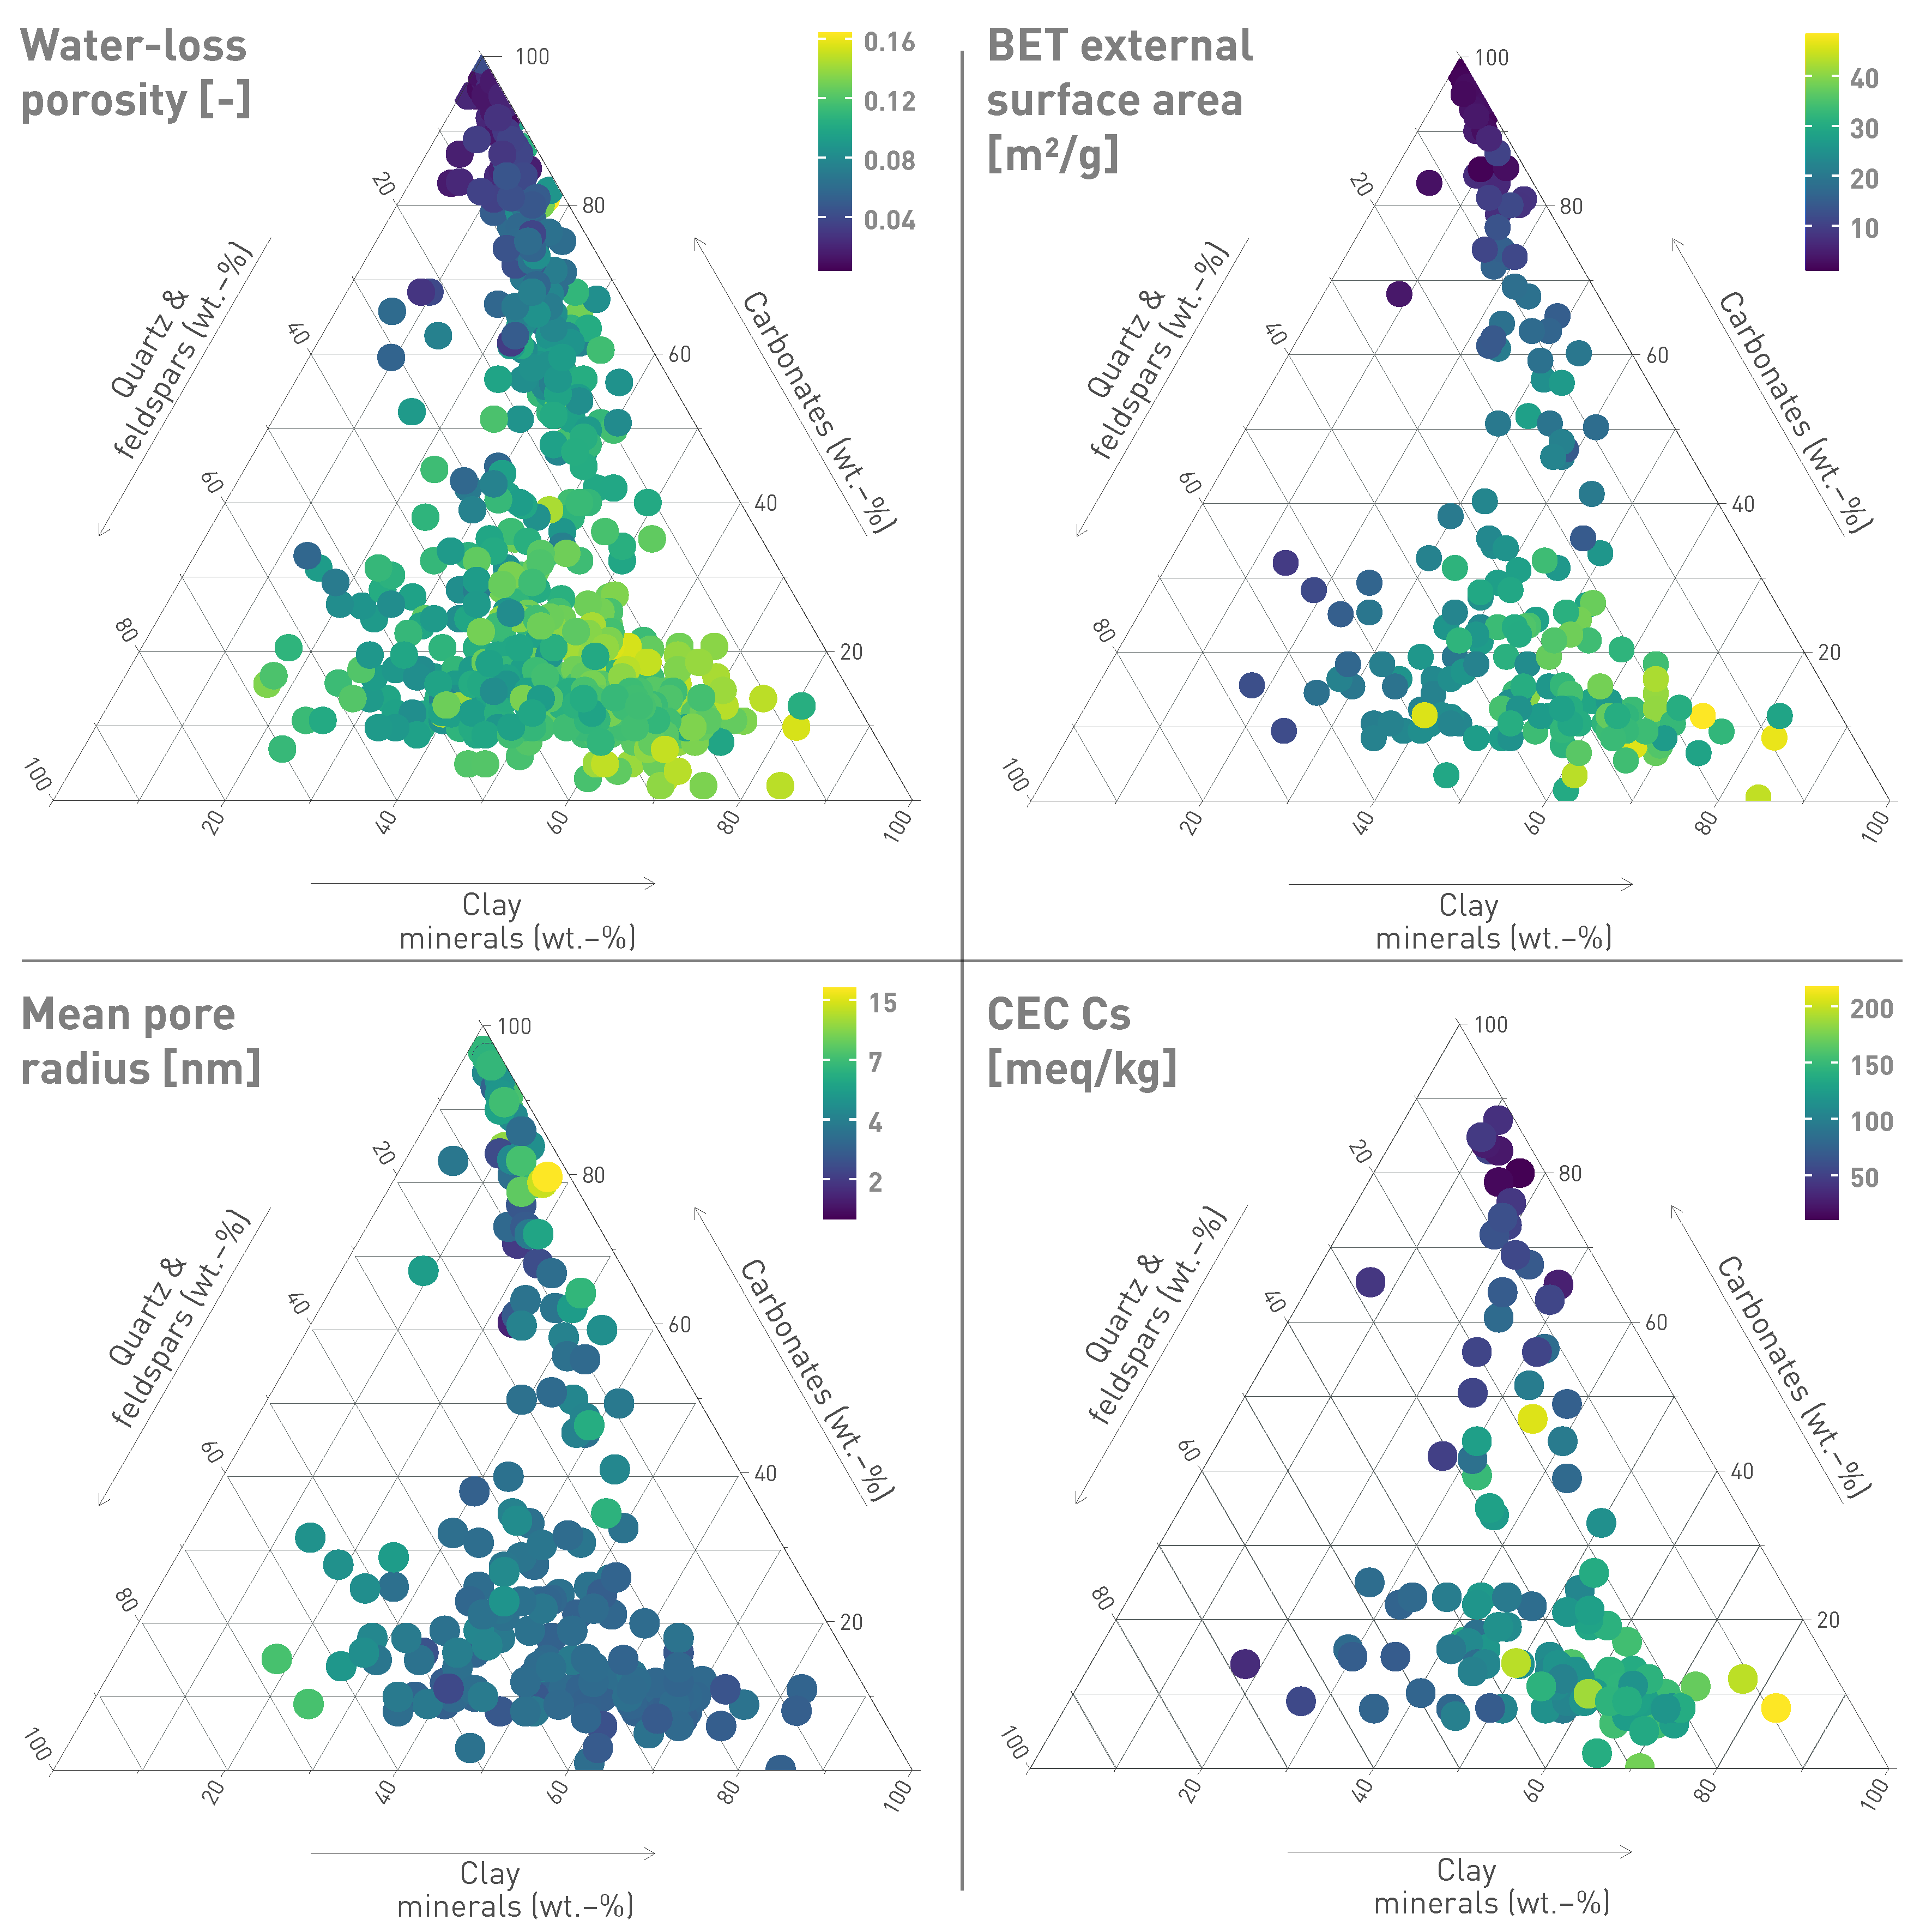
Fig. 5‑13:Key rock data for Jurassic samples from TBO boreholes shown in the Füchtbauer triangle
Axes are in wt.-%. Samples with > 10 wt.-% minerals other than those represented by the triangle are excluded. After Füchtbauer (1988).
Fig. 5‑14 shows the relationship between clay-mineral content and porosity for a number of formations under investigation in the context of radioactive waste disposal (OECD/NEA 2022). The Opalinus Clay is among the units richest in clay minerals and exhibits some of the lowest porosities of the clay-rich rocks shown. The absence of a correlation between clay-mineral content and porosity is because the maximum burial depth and therefore degree of compaction varies widely among the different units (e.g. < 500 m for the Belgian clays, 4'000 m for the Boda Claystone Formation in Hungary).
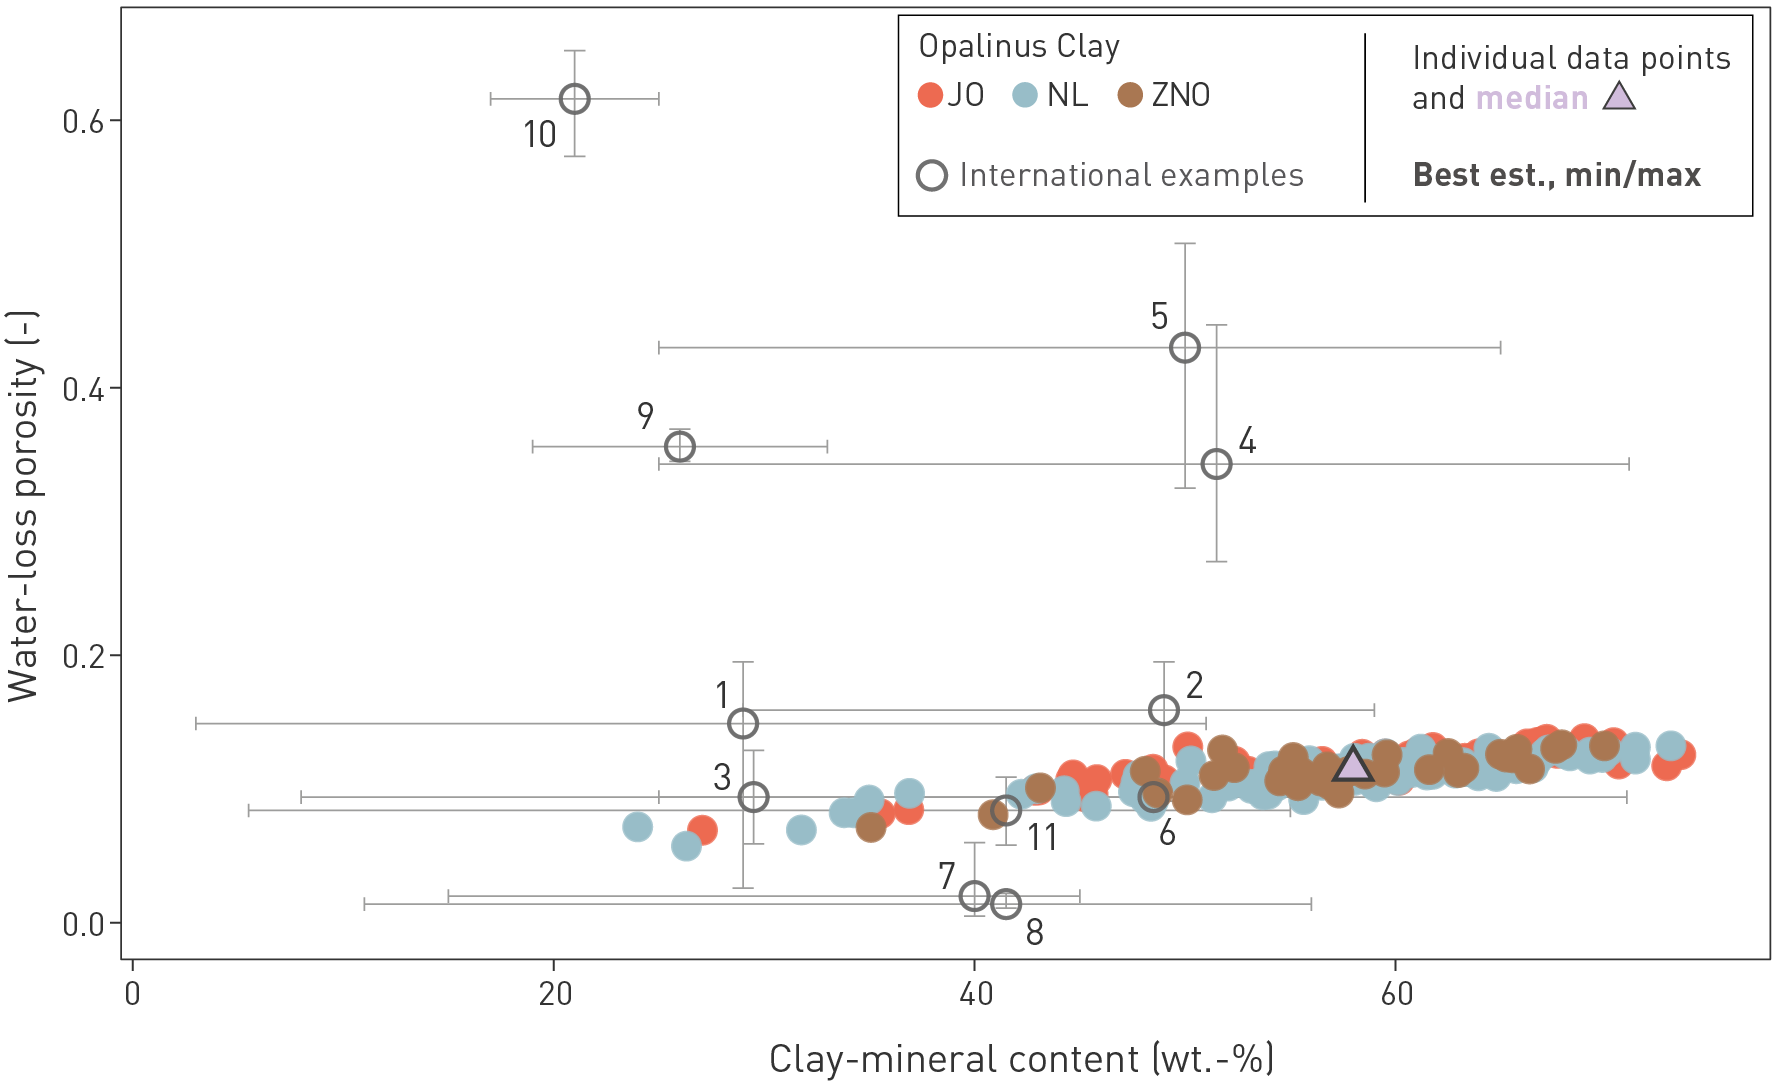
Fig. 5‑14:Water-loss porosity of the Opalinus Clay as a function of clay-mineral content and comparison to other clay-rich rocks
The figure shows drill-core analyses of the Opalinus Clay from the TBO boreholes and the related median value. International data are from the Clay Club Catalogue (OECD/NEA 2022). 1: Callovo-Oxfordian at Meuse/Haute Marne, silty-calc. unit (F); 2: Callovo-Oxfordian at Meuse/Haute Marne, clay-rich unit (F); 3: Toarcian-Domerian at Tournemire (F); 4: Boom Clay at Mol (B); 5: Ypresian Clay at Kallo/Doel (B); 6: Georgian Bay Formation at Bruce nuclear site (CDN); 7: Boda Claystone Formation, Gorica block (H); 8: Boda Claystone Formation, Boda block (H); 9: Wakkanai Formation at Horonobe (JP), 10: Koetoi Formation at Horonobe (JP), 11: Queenston Formation (CDN). est.: estimate.
Together with porosity, the surface area of minerals and the distribution of pore sizes are key parameters that affect numerous rock properties. Clay-mineral-rich lithologies are known to have small pore apertures and large mineral surface areas, with major consequences for solute transport (low permeability, substantial cation-exchange capacity and sorption on clay surfaces etc.). N2 ad-/desorption tests provide the basis for obtaining the external surface area of minerals (i.e. not considering clay interlayers that are not accessed by N2; Brunauer et al. 1938), as well as the pore-size distribution in the range 2 – 200 nm (Barrett et al. 1951). More detail on methodology and results is provided in Mazurek et al. (2023a).
As expected, the external surface area shows a good correlation with the clay-mineral content (Fig. 5‑15a), illustrating the fact that clay minerals are by far the most relevant contributors to surface area. The average value for the Opalinus Clay is 30 m2/g. The trends for all lithologies represented in the Füchtbauer triangle are shown in Fig. 5‑13. Mean radii of external pores (assuming cylindrical geometry) can be estimated by dividing the water content relative to dry weight by the external surface area and the water density. The data trends are shown in Fig. 5‑13, and all data from the Jurassic profile are shown as a function of the clay-mineral content in Fig. 5‑15b. For lithologies with > 50 wt.-% clay minerals, the mean pore radius is remarkably constant at 3 nm. More scatter is found for clay-mineral-poor rocks, illustrating the textural heterogeneity of limestones in particular. While the oolitic Hauptrogenstein (and all Fe-rich oolites) have large mean pore apertures, other limestones with often micritic fabrics (such as the Wildegg Formation) may have mean apertures even smaller than clay-mineral-rich lithologies.
Examples of the full pore-size distributions for different lithologies are illustrated in Fig. 5‑15c. In clay-mineral-rich lithologies, the size distribution based on the adsorption branch shows a prominent peak at 2 – 3 nm, which can be associated with clay minerals as its amplitude decreases with decreasing clay-mineral content. In carbonate-rich lithologies (most of which still contain a small proportion of clay minerals), a broad peak in the range of 40 – 100 nm dominates. Bimodal distributions with both peaks at comparable amplitude are found for intermediate, more quartz-rich lithologies, while silt-/sandstones towards the quartz corner show a broad plateau over a wide range of pore sizes. Thus, pore-size distributions vary systematically between lithologies, and clay-mineral-rich lithologies tend to be dominated by the smallest pore diameters in the range of a few nm.
N2 adsorption is insensitive to pore radii larger than about 200 nm. Samples from the Opalinus Clay were also studied using NMR cryoporometry (Fleury et al. 2022, Mazurek et al. 2023a), a method that can capture even larger pores. As shown in Fig. 5‑15d, such pores were not identified by this method and probably do not exist. Another advantage of the cryoporometry technique is the fact that samples are tested in their natural state, i.e. no drying is needed prior to or during analysis, in contrast to most other methods (e.g. Hg intrusion porosimetry, H2O ad-/desorption). It is concluded that many, if not most, pores resolvable in the clay-mineral-rich matrix under the SEM are not present in the formation but are artefacts of drying and sample preparation.
As already noted in previous studies (e.g. Mazurek 2011), an excellent correlation can be found between the external surface area and the cation-exchange capacity (Fig. 5‑16). This is also shown in Fig. 5‑13.
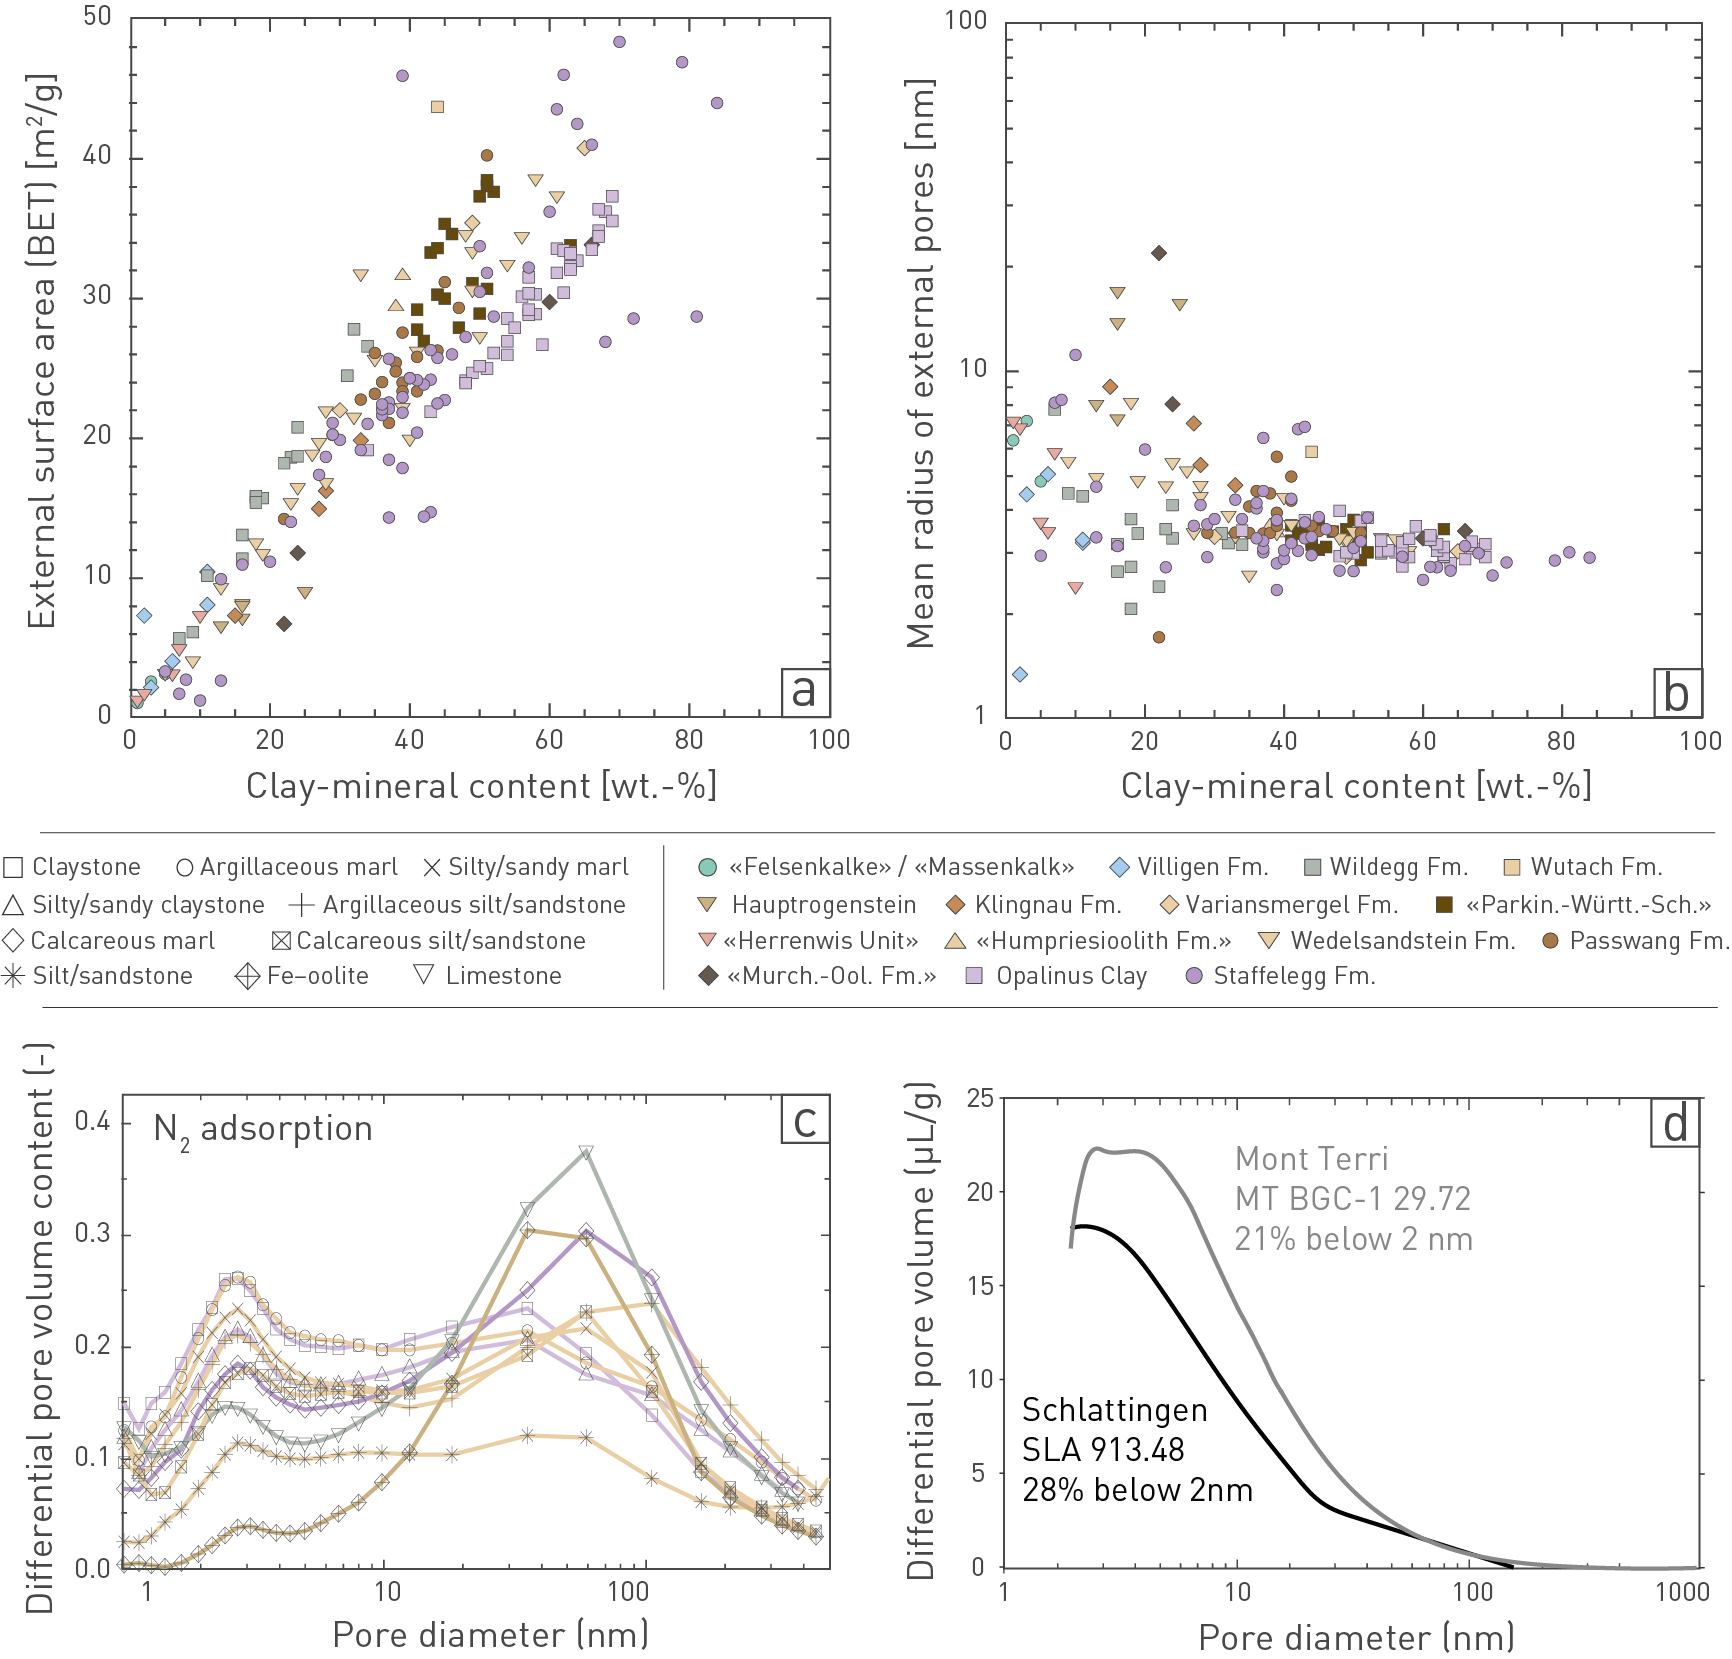
Fig. 5‑15:Mineral surface areas and pore-size distributions in the Jurassic profile
(a) External (BET*) surface area as a function of clay-mineral content.
(b) Mean radius of external pores as a function of clay-mineral content.
(c) Examples of pore-size distributions based on the N2 adsorption branches, normalised to the water content of the samples (BJH** algorithm). Claystone = TRU1 923.34, Opalinus Clay, «Clay-rich sub-unit»; Argillaceous marl = BUL1 808.92, «Parkinsoni-Württembergica-Schichten»; Silty/sandy claystone = BUL1 965.46, Opalinus Clay, «Mixed clay-silt-carbonate sub-unit»; Argillaceous silt/sandstone = TRU1 788.76, Wedelsandstein Formation; Silty/sandy marl = STA3 748.38, Wedelsandstein Formation; Calcareous marl = MAR1 717.76, Staffelegg Formation, Rietheim Member; Limestone = BOZ1 323.16, Wildegg Formation, Effingen Member; Calcareous silt/sandstone = MAR1 588.40, Wedelsandstein Formation; Silt-/sandstone = TRU1 812.24, Wedelsandstein Formation; Fe-rich oolite BOZ2 313.13, Hauptrogenstein, Spatkalk.
(d) Pore-size distribution for two samples of the Opalinus Clay obtained from NMR cryo-porometry. Adapted from Fleury et al. (2022).
* Method to derive the (external) surface area of solid materials based on gas adsorption (typically N2). BET stands for the names of the developers of the method (Brunauer, Emmet, Teller).
** Barrett – Joyner – Halenda algorithm (a procedure for calculating pore volumes and pore-size distributions from experimental isotherms, using the Kelvin equation).
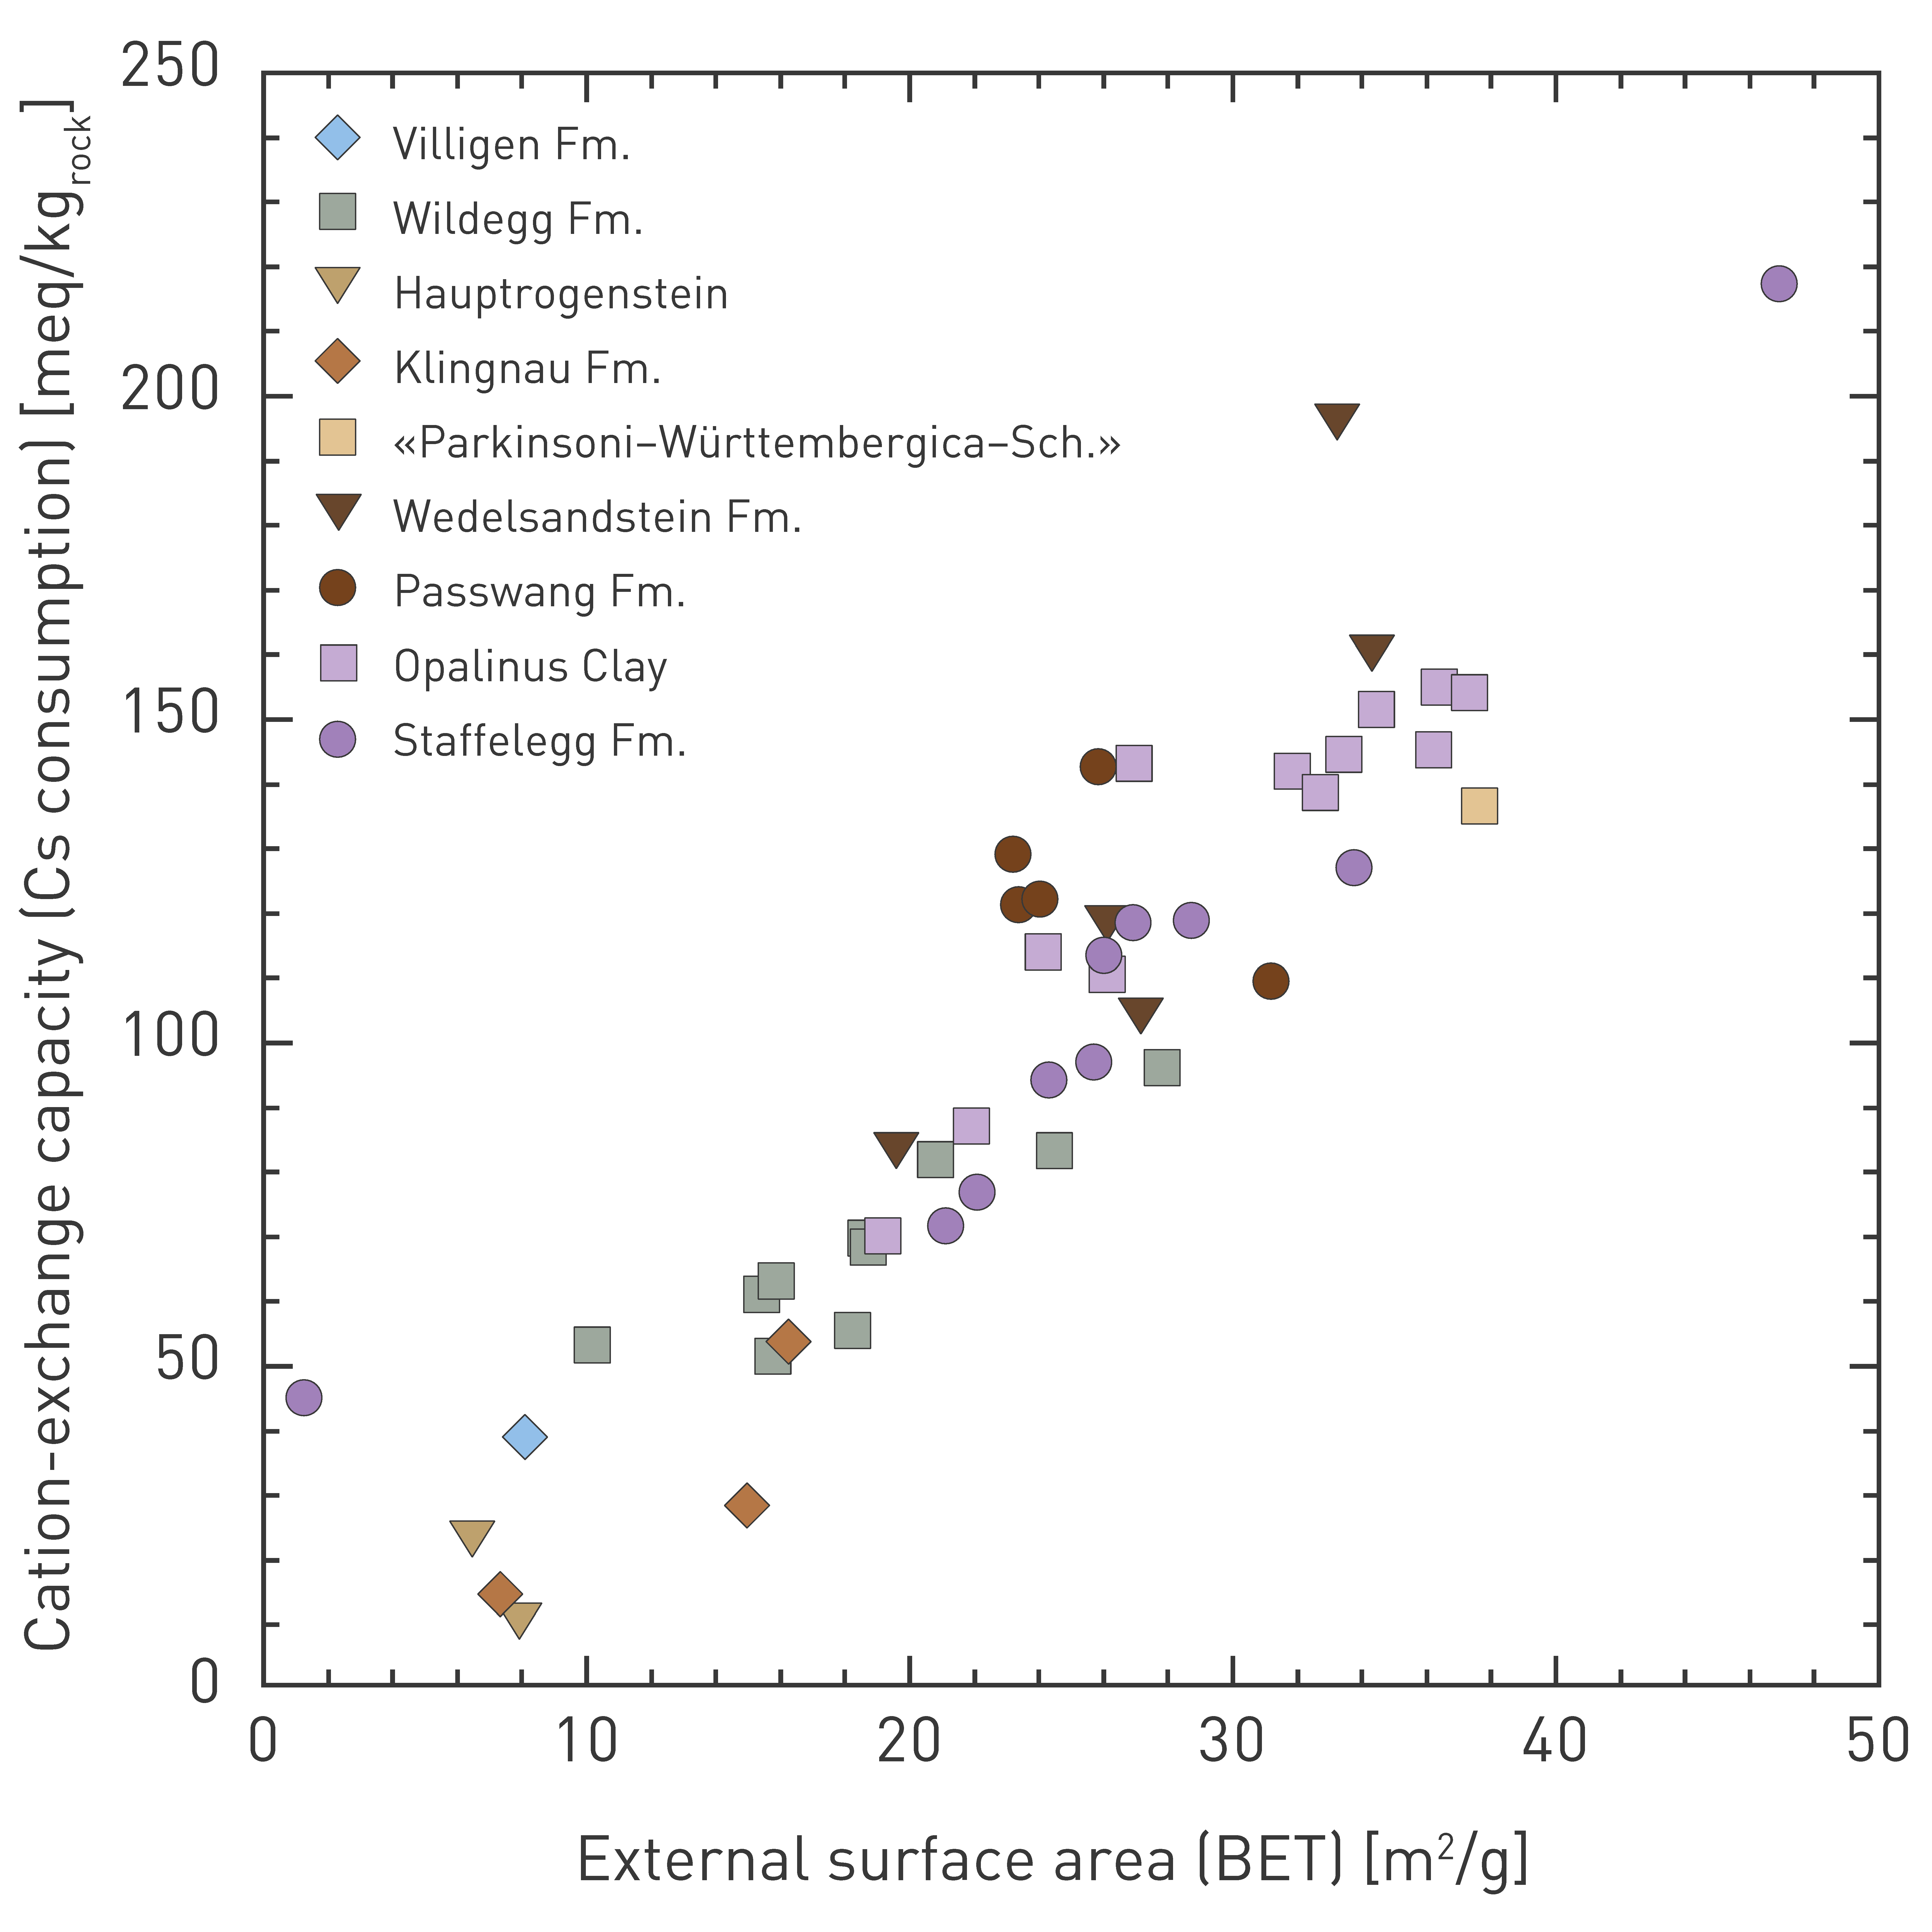
Fig. 5‑16:Correlation between external surface area and cation-exchange capacity based on Cs consumption
Only data for the Jurassic profile are shown. Cs data from Baeyens & Fernandes (2022). BET: see explanations in Fig. 5‑15.
Porosity and pore-size distribution are relevant determining factors for a number of rock properties and states. The presented data contribute to the interpretation of permeability, porewater chemistry, diffusion coefficients and various geomechanical parameters and moduli.
Porosity of the Opalinus Clay was quantified by laboratory methods and geophysical log analyses and the results show consistent values in the range 0.10 to 0.13, with only a low correlation with current burial depth. Local excursions to lower porosities occur mainly in the upper part of the formation.
In the Jurassic section, a good correlation exists between clay-mineral content and porosity. Exceptions include (Fe-)oolitic lithologies, reef limestones of the «Herrenwis Unit» and silty/sandy beds in the Wedelsandstein Formation.
Apart from the clay-mineral content, the nature of the other constituents (e.g. carbonate/quartz ratio) also affects porosity, and the degree of cementation affects compaction behaviour and therefore porosity. The Opalinus Clay has a lower porosity than other units of comparable clay-mineral content in the confining units, which is probably because of its high deposition rate and therefore much shorter time over which early diagenetic cementation could occur.
The pore-size distribution in clay-rich rocks such as the Opalinus Clay shows a peak at pore radii in the range of only a few nm. In contrast, the pore-size distribution of limestones shows a broad peak in the range of 40 – 100 nm. Marls, i.e. mixtures between clay and carbonate minerals, show bimodal distributions. Thus, the mean pore size is negatively correlated with the clay-mineral content.
The external surface area correlates linearly with the clay-mineral content and cation-exchange capacity.
Key points:
- In the Opalinus Clay, the anion-accessible porosity fraction relevant for the transport of negatively charged species is well constrained and depends on porewater ionic strength. In JO it is about 30%, in NL and ZNO in the range of 40 – 50% of the total porosity.
- In the confining units, the anion-accessible porosity fraction is partly larger. This is explained by the partly lower clay-mineral contents and larger pore sizes.
- Opalinus Clay porewater chemistry can be robustly constrained based on complementary datasets and approaches. The porewater of the general Na-Cl type is of moderate ionic strength (0.15 – 0.37 molal), the pH is in the near-neutral range and the redox conditions are buffered by mineral equilibria in the reducing range.
- Porewater ionic strength is lowest in JO because of the different palaeo-hydrogeological evolution. For ZNO and NL, the similar data allow the same reference porewater model to be used to evaluate radionuclide mobility and the stability of the engineered barriers.
The mobility of radionuclides (sorption, solubility, diffusion) and the long-term stability of the engineered barriers strongly depend on the geochemical conditions in the host rock, notably the porewater chemical composition, pH and redox state. In addition, porewater chemistry can be used as independent evidence for the hydraulic barrier effect; this topic is addressed in Section 4.6.
There is a strong interaction between the mineral surfaces and the porewater in the nanometric pore space of clay-rich rocks. The section on solute distribution in the pore space (Section 5.4.2) introduces relevant concepts needed for the interpretation of porewater data and the pertinent dataset. Porewater cannot be directly sampled because of the very low hydraulic conductivities but requires laborious, dedicated experiments. The section on porewater chemistry (Section 5.4.3) presents the modelling approach used to integrate the available data and illustrates sensitivities of the model with respect to temperature and the choice of equilibrium phases.
The pore space of clay-rich rocks has a nanometric architecture (see also Mazurek et al. 2023a), with clay-mineral grain and interlayer surfaces representing a substantial part of the water – mineral contact (Fig. 5‑17). These surfaces interact with the solutes of the porewater. Most of these clay-mineral surfaces are negatively charged, which leads to the repulsion of anions and to the attraction of cations that balance the surface charge. In contrast, the electrostatic force does not affect neutral species. Generally, the concentration of anions increases with increasing distance to the negatively charged surface until, at a certain distance, a charge-balanced electrolyte solution persists, which is often termed free porewater (Bresler 1973, Tournassat & Steefel 2021) (white in Fig. 5‑17). The spatial distribution of the ions in the remaining fraction of the porewater affected by charged surfaces (blue in Fig. 5‑17) is complex and depends on various parameters, such as the charge of the ion itself, the charge density of the clay surfaces (electrostatic potential), the ionic strength of the free porewater and the microstructure (e.g. Tournassat & Steefel 2019, 2021, Wigger 2017, Appelo et al. 2010). This anion-depleted porosity may constitute a large fraction of the total porosity, such that a significant portion of the pore space is barely accessible to anions (Pearson 1999).
Fig. 5‑17:Conceptual model of anion-accessible porosity (white), anion-depleted porosity (blue), cations, anions, neutral species (+, -, 0, in dark blue) and the negative charge on clay mineral surfaces (red)
Model is not to scale. To illustrate the effect on transport, the dashed line indicates a hypothetical diffusion path of an anion and the dotted line for a neutral species, respectively. Note that the schematic abstraction covers a range of scales, given the fact that the bound, anion-depleted water layer has a thickness in the order of 1 nm, while the grain size of calcite and quartz is more likely in the range of µm to mm.
Diffusive transport is further explained in Section 5.8.
Profiles of anion concentrations across clay-rich lithologies contribute to the understanding and quantification of diffusive transport between clay-rich formations and the bounding aquifers (Section 4.6.3) but require the concentrations in the free porewater for obtaining local concentration gradient and the computation of solute-mineral equilibria. In order to scale the concentrations of anionic tracers determined for the bulk porewater (blue and white zones in Fig. 5‑17) to the free porewater concentration, a scaling factor termed anion-accessible porosity fraction (fa) is required. This factor accounts for the overall anion depletion present in the rock. It can be approximated as the ratio of the anion concentration in the bulk porewater determined by aqueous extraction divided by the concentration in the free porewater obtained by advective displacement (AD), high pressure squeezing (SQ) or borehole sampling (Zwahlen et al. 2024, Wersin et al. 2020). Alternatively, fa can be inferred from species-specific porosities obtained from through-diffusion experiments, e.g. for 36Cl and HTO (Van Loon et al. 2023).
Zwahlen et al. (2024) compiled a large dataset of experimentally derived chloride-accessible porosity fractions (fCl) for the sedimentary sequence in the three siting regions. Two empirical models for extrapolating the experimental fCl values of the entire profiles were tested. The first model is based on the clay-mineral content of the rock (e.g. Wersin et al. 2013, 2016, Mäder & Wersin 2023) while the second model considers formation-specific averages of the experimental data. In heterogeneous formations, several formation-specific averages are calculated based on mineralogical constraints. Both models present two different sets of fCl values, one for JO and one for ZNO & NL, because of the differences in ionic strength of the free porewater (Fig. 5‑18a). The second model was found to be more suitable because of the impact of the rock texture on the extent of anion exclusion, in particular evident for lithologies with a low clay-mineral content. The comparison of these models underlines that clay-mineral content is an important, but not the only, factor that determines anion accessibility in the pore space. For the Opalinus Clay, the recommended fCl values in JO range from 0.28 to 0.34 and in NL and ZNO from 0.42 to 0.52. Examples of scaled Cl profiles as obtained from measured bulk Cl concentrations and the formation-specific fCl values are detailed in Fig. 5‑18b.
Fig. 5‑18:Chloride-accessible porosity fraction (fCl)
a) Mineralogical composition and fCl values of samples from JO (BOZ1), NL (STA2) and ZNO (TRU1) in the left and right triangle, respectively. b) Formation-specific fCl values (black lines) used to scale bulk Cl concentrations (filled circles) derived by aqueous extraction to free porewater Cl concentrations (hollow circles).
Given the physico-chemical complexity of the pore space, different extraction methods are used to sample different fractions of the porewater. Comprehensive porewater compositions that are considered to be close to the free porewater composition are obtained by direct sampling methods such as advective displacement and high-pressure squeezing of rock samples (Kiczka et al. 2023, Mazurek et al. 2015, Mäder 2018).
The specific characteristic porewater compositions in JO, NL and ZNO are consistently reflected in the porewaters obtained by advective displacement and high-pressure squeezing (Fig. 5‑19). Porewaters of the Opalinus Clay and the confining units (Dogger Group above Opalinus Clay and Lias Group) in NL and ZNO are of Na-Cl type, whereas the porewaters in JO are more dilute and of Na-Cl-(SO4) type. Cl concentrations in the Opalinus Clay are in the range of ~ 7 – 14 g/L in NL and ZNO but significantly lower in JO (~ 2 – 3 g/L). The different salinities reflect the local hydrogeological controls, for example the larger influence of a younger meteoric groundwater component in the comparably shallower JO siting region (Section 4.6). The difference between the Opalinus Clay porewaters in JO and NL and ZNO is also manifested in the distinctly higher SO4/Cl ratios in the former region. Within the Opalinus Clay, vertical chemical gradients are small, but in some profiles (e.g. in ZNO and JO) a slight decrease in Cl concentrations with depth in the lower part of this unit is manifested due to the influence of the underlying Keuper aquifer (Section 4.6.3).
Fig. 5‑19:Schoeller plots visualising the chemical composition of porewater in the Opalinus Clay and in the adjacent confining units in the three siting regions
Data from advective displacement (AD) and high-pressure squeezing (SQ) are shown (Kiczka et al. 2023) and compared to the respective reference porewater for the Opalinus Clay as defined in Mäder & Wersin (2023). DAO: Dogger Group above Opalinus Clay, Fm.: Formation.
Reference porewaters constitute an abstraction of the ensemble of the experimentally derived data, constraints from other data (e.g. mineralogy, aqueous extraction, cation exchange experiments) and modelling (Mäder & Wersin 2023).
A consistent thermodynamic porewater model is an important component in the derivation of the reference porewaters (Mäder & Wersin 2023) and, generally speaking, in the derivation of the in-situ porewater compositions of the Opalinus Clay and its confining units in the different siting regions (Kiczka et al. 2023). The model takes into account the "free" solutes (conservative species, such as Cl, not affected by mineral reactions), dissolved gases, cation exchange reactions and equilibria with relevant rock-forming minerals (Kiczka et al. 2023, Mäder & Wersin 2023). Such calculations, commonly carried out with a geochemical code like PHREEQC, have been shown to yield consistent results with regard to squeezing and advective displacement data (Wersin et al. 2016, Mäder & Wersin 2023, Kiczka et al. 2023), thus providing an independent measure for the robustness of the experimentally obtained data. Uncertainties with respect to key parameters (e.g. pH – pCO2 – alkalinity, or sulphate) were addressed by defining model variants for the reference porewater that are also thermodynamically consistent in the same way as the reference porewater (Mäder & Wersin 2023).
An integral part of the model is the phase rule in which – at constant temperature and pressure – each component is constrained by fixed concentrations, mineral or cation exchange equilibria, respectively. The constraints used for the calculation of the reference porewater and for an alternative model approach are illustrated in Tab. 5‑1. The purpose of the alternative model is related to the uncertainty in pCO2 and pH. In fact, the experimental determination of pH and partial pressure of CO2 is generally difficult and prone to experimental artefacts and changes between in-situ and laboratory conditions, such as temperature and pressure (Kiczka et al. 2023) (outlined below). The two models constrain pH and the partial pressure of CO2 (pCO2) in different ways, i.e. (i) fixing pCO2 according to expert judgement based on earlier work or (ii) assuming a pair of equilibria of clay minerals (Kiczka et al. 2023, Mäder & Wersin 2023). The latter approach does not require an a priori assumption on pCO2 but requires a judgement on the selected mineral pair and the thermodynamic data for such phases (illite, illite/smectite, chlorite) that are still uncertain as e.g. discussed in Wersin et al. (2020). The two models show similar results for calculations at 25 °C for most underlying mineral pairs and databases (Fig. 5‑20).
Tab. 5‑1: Constraints on major component concentrations used for modelling of reference porewaters (Mäder & Wersin 2023)
|
Component |
Constraint |
|
|
Reference porewater fixed pCO2 |
Alternative model clay-mineral equilibria |
|
|
pH |
calcite eq. |
pair of clay-mineral eq. f) |
|
CO3,t |
fixed pCO2 = 10-2.2 bar a) |
calcite eq. |
|
Cl |
fixed b) |
fixed b) |
|
SO4 |
fixed SO4/Cl b) |
fixed SO4/Cl b) |
|
Sr |
celestite eq. |
celestite eq. |
|
Na |
fixed exchanger c, d) |
fixed exchanger c) |
|
K |
fixed exchanger c, d) |
fixed exchanger c) |
|
Ca |
fixed exchanger c, d) |
fixed exchanger c) |
|
Mg |
dolomite eq. |
dolomite eq. |
|
Si |
quartz eq. |
quartz eq. |
|
Al |
kaolinite eq. |
clay-mineral pair eq. f) |
|
Fe |
siderite eq. |
siderite eq. |
|
Eh |
pyrite-siderite eq. e) |
pyrite-siderite eq. e) |
a) best estimate expert judgement based on available data
b) based on data obtained from squeezing and advective displacement experiments
c) based on data obtained from cation exchange experiments
d) only initial estimate, later adjusted slightly by model simultaneously to mineral equilibria
e) S(VI)/pyrite redox couple assumed to be active
f) kaolinite/chlorite or kaolinite/illite or illite/chlorite equilibrium
Reference porewaters used for safety assessment are commonly defined at standard temperature and pressure conditions (i.e. 25 °C, 1 bar). Thus, porewater chemistry data obtained from laboratory experiments at room temperature closely reflect such conditions. In-situ temperatures and hydrostatic pressures of the Opalinus Clay porewater, however, are higher, and may reach up to 50 °C and 90 bar, depending on the location and depth of the repository.
Thermodynamic equilibria are rather insensitive to temperature in the range of interest (in-situ temperature 30 – 50 °C) as indicated by both experimental and modelling studies from the French programme (Beaucaire et al. 2012, Gailhanou et al. 2017) and modelling of the Opalinus Clay porewaters (Wersin et al. 2020, Mäder & Wersin 2023). An example of a modelling exercise is illustrated in Fig. 5‑20 in which the effect of temperature on the reference porewater composition (Mäder & Wersin 2023) is shown in the range of 25 – 80 °C. The main aqueous components Na, Ca, Mg, Cl and SO4 show very little change within this temperature range. The largest change is indicated for pH and pCO2, which is because of the change in CO2 solubility and the dissociation constant of H2O with temperature. Thus, pH is shifted to about 0.5 units lower values when passing from 25 to 50 °C.
The effect of pressure on the Opalinus Clay porewater composition has also been evaluated by thermodynamic modelling (Wersin et al. 2020). In these calculations, it was shown that an increase in pressure up to 90 bars results in only very minor changes in the composition in spite of the higher solubility ofCO2.
Fig. 5‑20:Modelled concentrations of main porewater components (upper panel) as well as log(pCO2) (bar) and pH (lower panel) as a function of temperature using an alternative porewater model including clay mineral phases (curves)
Squares allow comparison to the reference model (25 °C, fixed pCO2 = 10-2.2 bar; Mäder & Wersin 2023).
Model runs performed for three different sets of clay-mineral equilibria: kaolinite/chlorite, kaolinite/illite, chlorite/illite. Solid lines: The PSI Thermodynamic Database (Hummel & Thoenen 2023), dashed lines: ThermoChimie (Giffaut et al. 2014, Rodriguez et al. 2022). Both databases indicate very similar results in ion composition but some differences regarding simulated pH/pCO2. The latter point is related to different thermodynamic data of clay minerals used in the two databases.
The Opalinus Clay acts as an effective chemical buffer because of its mineralogical-chemical properties (Wersin et al. 2020). Thus, the very large cation exchange capacity (in the range of 100 meq/kg) compared to the porewater inventory helps to keep the exchanger composition nearly constant and thus also the dissolved cation ratios over a wide range of salinities. The buffering of pH to near-neutral values is provided by rapid calcite dissolution/precipitation and surface protonation/de-protonation reactions. Silicate weathering reactions occur at much lower rates but may be effective in buffering pH over timescales of years and longer (Wersin et al. 2020). It should be noted that, under alkaline conditions (e.g. induced by cementitious materials in the repository), silicate reaction rates are enhanced and the contribution of these minerals to buffering becomes more important.
The Opalinus Clay has a large reducing capacity because of its ferrous- and sulphide-bearing minerals (siderite, ankerite, pyrite) and organic matter. The reducing character of the porewater was confirmed by earlier measurements (Wersin et al. 2020, Mäder & Wersin 2023).
The Opalinus Clay provides a stable geochemical environment for hosting a repository for radioactive waste.
In clay-rich rocks, only part of the porosity is accessible to anions. In the Opalinus Clay, the accessible fraction is well constrained and depends primarily on porewater salinity. For JO the accessible fraction is ca. 30% and for NL and ZNO it is in the range of 40 to 50% of the porosity. This fraction is partly larger in the confining units: This is explained by the partly lower clay-mineral contents and larger pore sizes.
The Opalinus Clay porewater chemistry can be robustly constrained based on complementary datasets and approaches. The model includes mineral and cation exchange equilibria and concentrations of free solutes such as chloride. The porewater of the general Na-Cl type is of moderate ionic strength (0.15 – 0.37 molal), pH is in the near-neutral range and the redox conditions are buffered by pyrite and siderite equilibria to the reducing range.
The porewater ionic strength of the Opalinus Clay is lowest in JO because of its different palaeohydrogeological evolution. The equivalent data from ZNO and NL allow the same reference porewater model to be used.
Key points:
- Geomechanical properties of the Opalinus Clay are comparable in all three siting regions. The high clay-mineral content in combination with deep maximum burial and significant overburden today (> 400 m) contribute to the low variability in mechanical properties (e.g. compared to Mont Terri).
- The relatively low stiffness and low «brittleness» of the Opalinus Clay and clay-mineral-rich confining units is consistent with more distributed deformation compared to more competent Mesozoic units.
- Localised fault-related flow is generally impeded by this type of deformation and is further counteracted by the expansive volumetric behaviour of clay-rich rocks when unloaded.
The position of larger seismically mappable faults will be taken into account when planning the location of the disposal areas. However, subseismic faults (small-scale and/or micro faults, Tab. 4‑1) may also occur in areas free of seismically mappable faults. The effects of tectonic overprinting on the Opalinus Clay and the confining units are less pronounced than in the more competent over- and underlying formations (Section 4.3), which can be related to the mechanical layering (Section 4.6) at larger scale.
Here the focus is on the deformation behaviour and typical fault geometries of the Opalinus Clay and clay-mineral-rich confining units. It is emphasised that these are favourable to maintaining barrier integrity over longer timescales, consistent with hydraulic packer test results (Section 4.5). Compaction and moderate diagenesis of the Opalinus Clay in the siting regions has led to overall higher strength than at the Mont Terri rock laboratory (Section 5.5.3), whilst still maintaining good swelling capacity (Section 5.5.2).
The understanding of the detailed constitutive behaviour of the Opalinus Clay (e.g. Nagra 2014h, Marschall & Giger 2016) has not changed significantly with the recent exploration campaign. However, the mechanical database in the siting regions is now substantially improved, much more robust and demonstrates a relatively small variation in mechanical properties for the Opalinus Clay. Numerical modelling of the constitutive behaviour was further advanced to integrate both anisotropic stiffness and strength (Section 5.5.3).
In Section 5.5.4, the low tectonic overprint in the Opalinus Clay is discussed. Only small-scale or micro-scale faults were encountered in the deep boreholes. Analyses of outcrops and 3D seismic reflection data and comparison with similar rocks shows that deformation in clay-rich rocks is generally soft-linked, and fractures poorly interconnected. The expansive volumetric behaviour of the Opalinus Clay and clay-mineral-rich confining units as elaborated in Section 5.5.2 further counteracts fracture-dominated flow, as will be emphasised in Section 5.7 (self-sealing).
Geomaterials subjected to load change experience deformation, either volumetric and/or distortional. When compressed, the Opalinus Clay experiences both irreversible and reversible volumetric deformation. After loading and unloading, a part of the deformation is recovered in an elastic rebound (Fig. 5‑21 in Section 5.5.3). The amount of plastic (irreversible) and elastic (reversible) deformation can be investigated in oedometric tests: a cylindrical sample is loaded in the axial direction, while radial strains are prevented (i.e. the specimen can only experience deformation in the loading direction) and porewater pressure is maintained.
Two curves obtained from oedometric tests in saturated conditions are reported in Fig. 5‑21, one for the Opalinus Clay from the Mont Terri rock laboratory, and one from the BUL1 borehole. Both samples have a similar clay-mineral content (ca. 60 wt.-%), and the main difference between the two is the depth of extraction and porosity at the start of the tests. Initially, the sample is saturated in constant volume conditions (total stress is increased to constrain the swelling and keep deformation close to zero). Afterwards, samples are always kept saturated. The porosity evolutions with the load/unload increments are shown as a function of applied axial effective stress. Effective stress is defined here as the difference between the total stress (because of external loads) and the porewater pressure.
Each point corresponds to a loading (or unloading) step, where load is applied (or removed), and the evolution of axial displacement is measured. The evolution of the displacement is related to the porewater pressure build-up or reduction (depending on whether a load is applied or removed) and its dissipation in time. The response of a material is related to its hydromechanical properties, particularly the hydraulic conductivity, and its rigidity (through the oedometric modulus); these two properties combined define the consolidation coefficient. At the end of the porewater overpressure dissipation, the sample is consolidated, and the corresponding porosity is assigned to that stress level (i.e. the points on the curve represent drained states). If the load is maintained beyond the time needed for the sample to consolidate, viscous deformation at constant load can be observed, referred to as secondary compression ("creep"). During the experiments, the extent of the creep deformation is usually minor compared to the amount of deformation due to changes in effective stresses.
While the overall response is similar, it is noted that the Opalinus Clay at Mont Terri shows generally higher porosity and higher compressibility (expressed by the slope of the curve upon loading at high stresses) within the investigated range of stress.
The unloading paths (highlighted in Fig. 5‑21) allow calculation of the swelling index, Cs. It is worth highlighting that "swelling index" is a geotechnical term that indicates the slope of the unloading branch in oedometric conditions in the semi-logarithmic void-ratio (equivalent to porosity used in Fig. 5‑21) versus vertical effective stress plane. This is related to the elastic properties of the saturated material upon unloading, and it is not to be confused with the swelling related to the saturation process. The higher the swelling index, the steeper the curve in the plot. A high swelling index corresponds to low stiffness and vice versa.
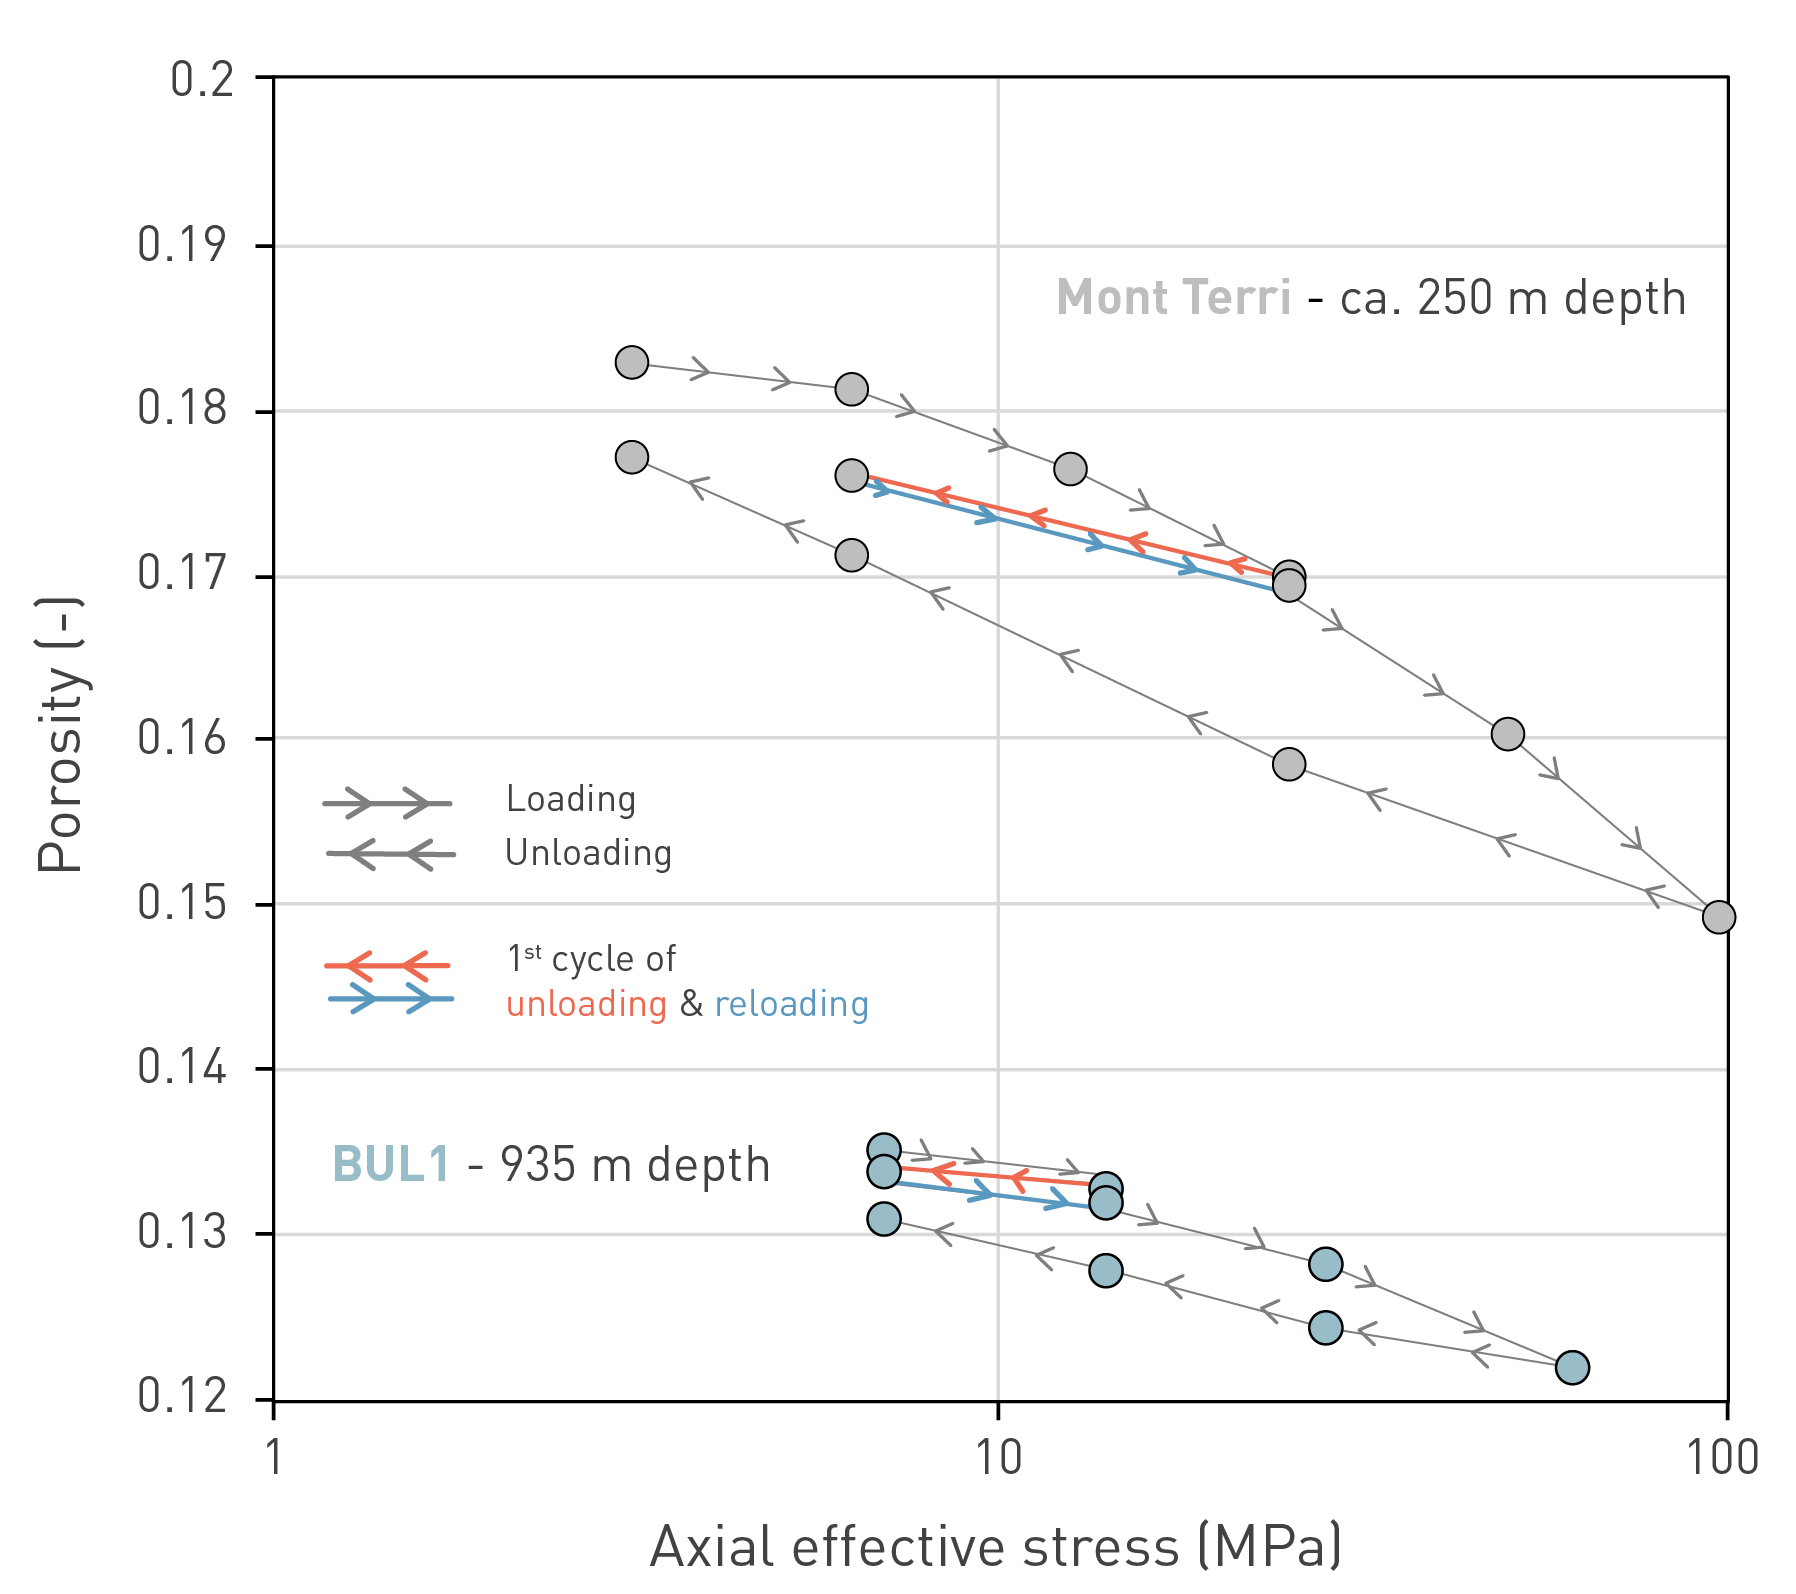
5‑21: Comparison of oedometric curves of the Opalinus Clay from Mont Terri and BUL1
Note that both samples have a similar clay-mineral content of approximately 60 wt.-% but a different initial porosity. The unloading path (adopted to calculate the swelling index Cs) is highlighted.
For geomaterials with a comparable range of porosity, a high Cs (i.e. low stiffness) is obtained for a high clay-mineral content. On the other hand, for low clay-mineral content material (< 40 wt.‑%), the effect of the composition on the stiffness is limited, and additional aspects such as the porosity play a major role for the observed stiffness.
Obtained swelling indices from testing Opalinus Clay and confining units are summarised in Fig. 5‑22 as a function of the clay-mineral content. The Cs are computed for unloading from stress levels of 20 – 15 MPa, down to a few MPa, and show a positive correlation with clay-mineral content. The upper limit of the stress range adopted for Cs calculation was chosen to be comparable with the expected maximum stress experienced by the formation.
In conventional unconstrained swelling tests (ISRM 1989, VSS 2019), axial swelling is measured on samples which are initially not fully saturated with water. Due to this partial saturation, such samples can experience a considerable amount of suction (equivalent to negative porewater pressure), resulting in strong hydraulic head gradients when the samples are exposed to water, and increased effective stress compared to fully saturated samples with positive porewater pressures under similar confining stress. Total expansion in such tests may therefore be greater than that measured in the unloading tests. For comparison of the two methods, a number of swelling tests were also done by starting from unsaturated conditions and a specified controlled load to assess the expansion over the low effective stress range (Fig. 5‑23).
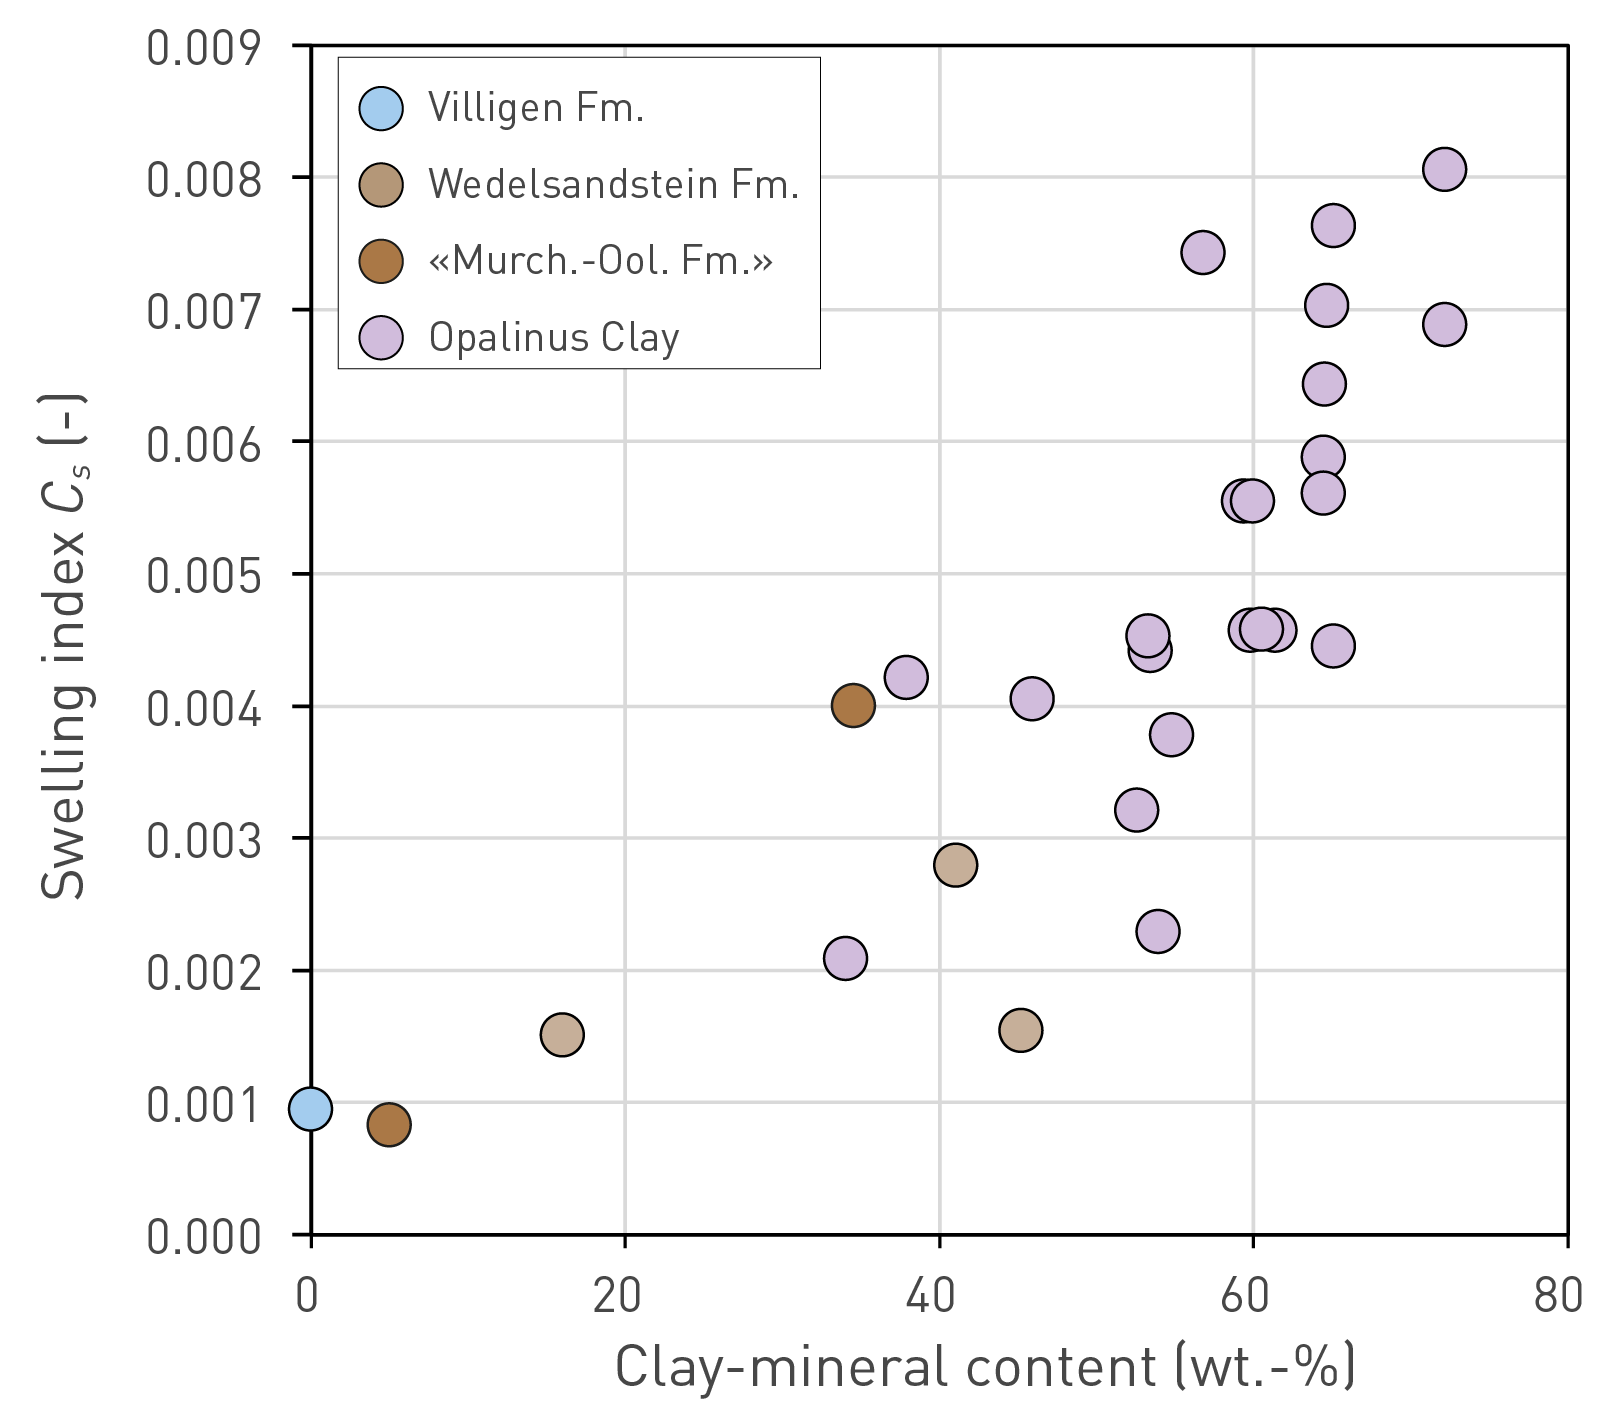
Fig. 5‑22:Swelling index (Cs) as a function of the clay-mineral content
Values obtained from the unloading paths from 20 – 15 MPa, down to a few MPa (drained, saturated conditions). Fm.: Formation.
In such swelling tests under constant load, the following procedure was adopted. The initial sample saturation is "as prepared". A constant stress level was then applied to samples and, afterwards, the sample was put in contact with balanced porewater and allowed to swell under constant load.
The specimens first may undergo a compression because of the load applied, then an expansion because of the saturation (i.e. effective stress reduction). The stresses shown in Fig. 5‑23 are those achieved at the end of the swelling phase, and the strains reflect the difference from the maximum compression (initial load) to the maximum expansion at the end of the test. At an axial effective stress of approximately 5 to 10 MPa, the swelling under constant load did not result in any relevant net swelling strain. Swelling under constant load was also examined under triaxial conditions (Crisci et al. 2024a) and resulted in similar slopes (swelling strain vs. logarithmic axial effective stress) as in oedometric conditions (Fig. 5‑23).
The 10 MPa axial effective stress can be considered equivalent to a depth of approximately 700 m (in situ). Assuming the range of determined Cs values of Opalinus Clay (Fig. 5‑22), typical unloading paths from saturated conditions are also plotted in Fig. 5‑23. These indicate the amount of swelling strain for a specific axial effective stress starting from the assumed 10 MPa in-situ vertical (axial) effective stress.
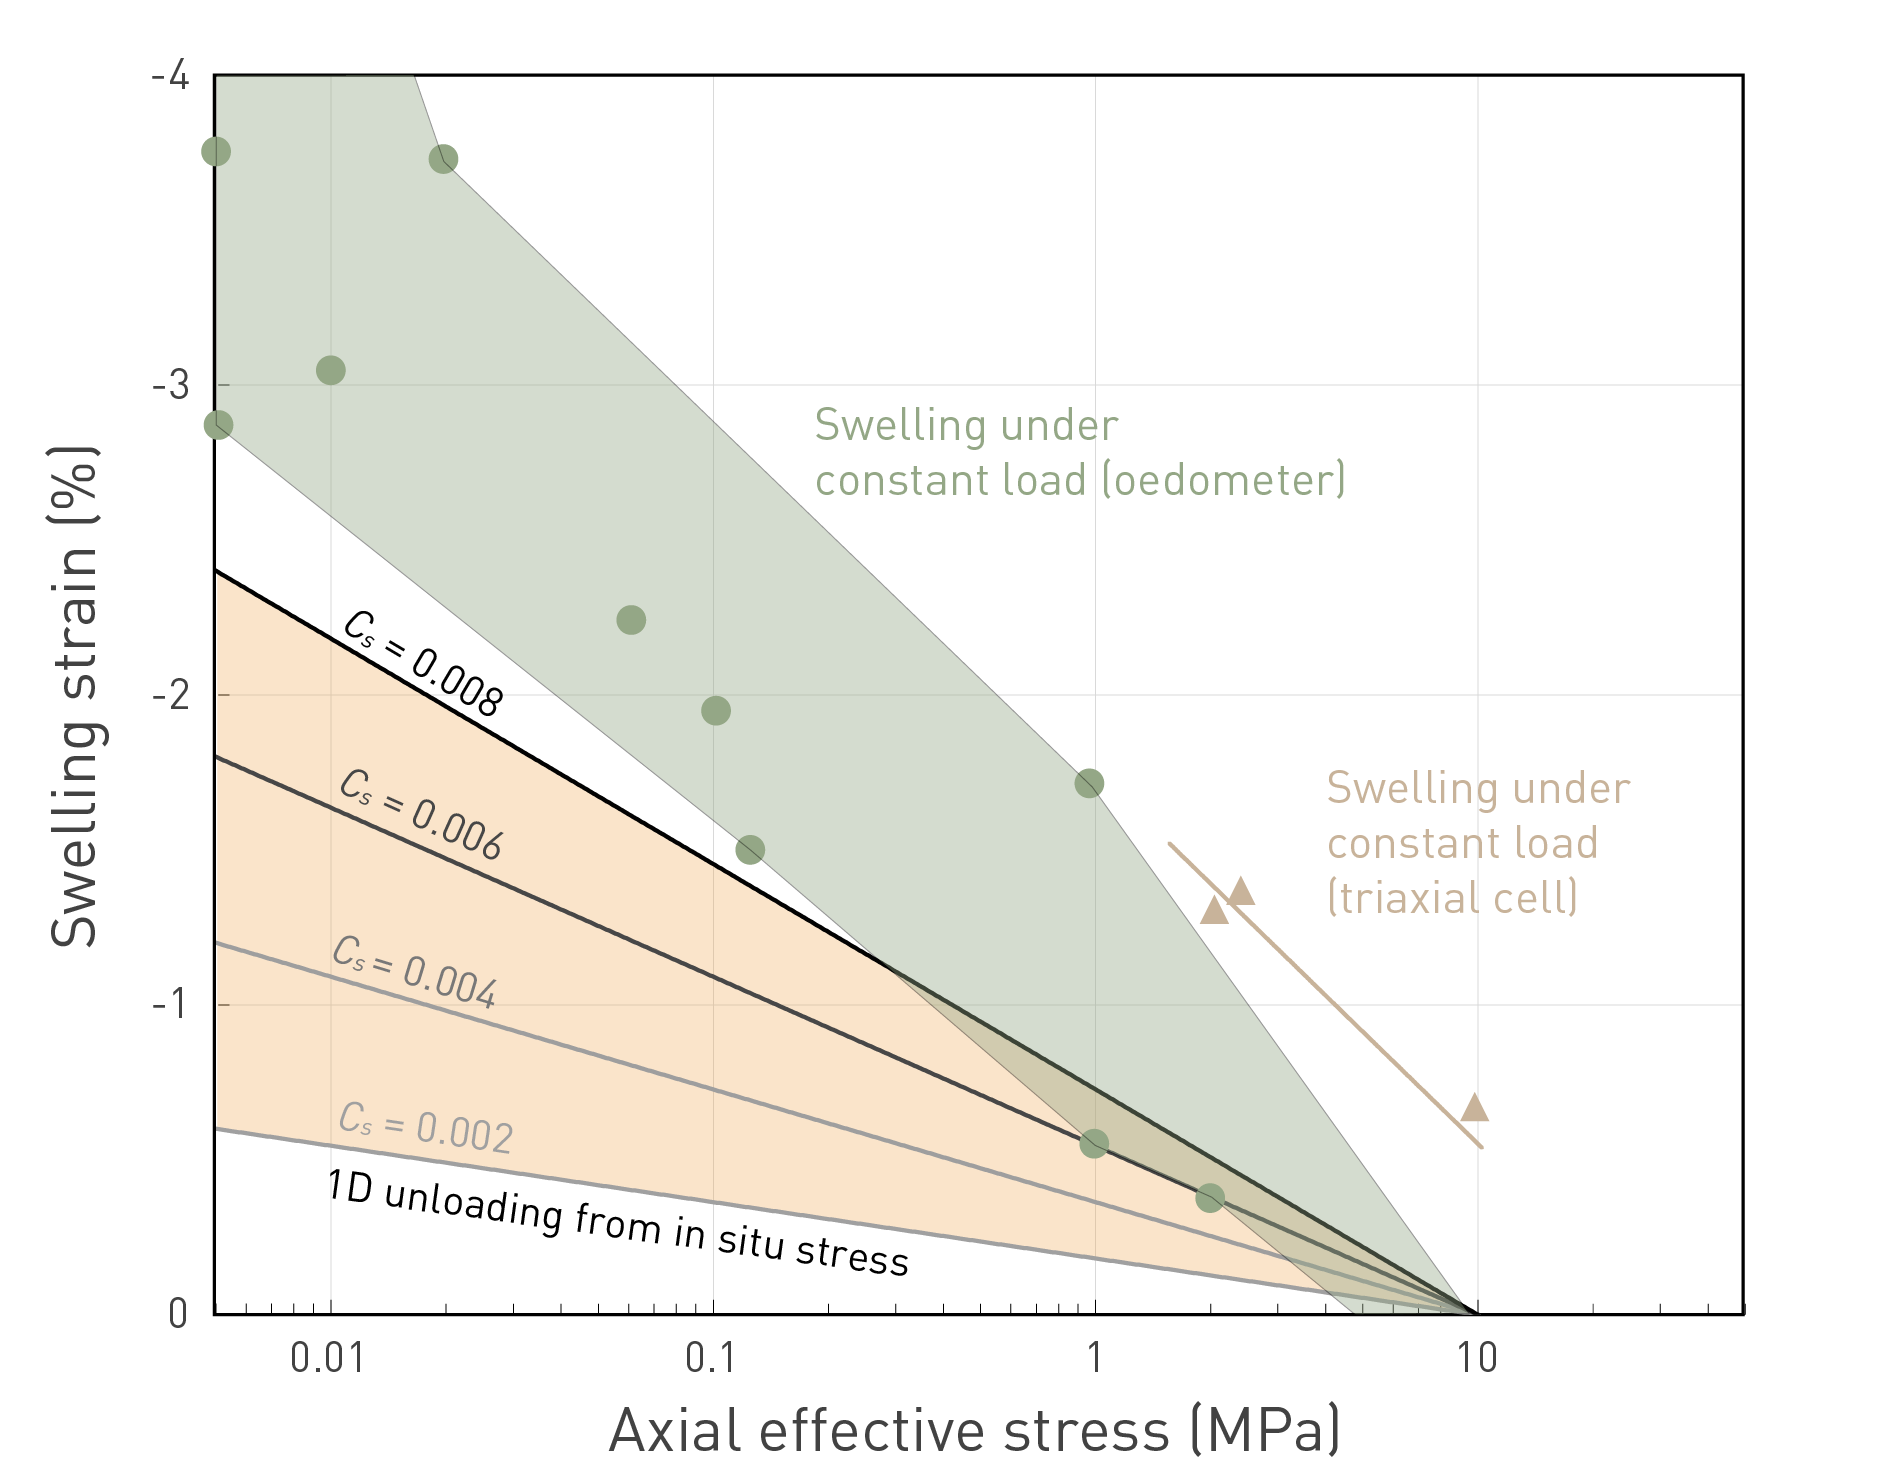
Fig. 5‑23:Axial swelling strain in the Opalinus Clay constrained by different methods
Orange surface indicates range of swelling strains (negative values for expansion) from saturated conditions at an assumed in-situ axial effective stress of 10 MPa (equivalent to approximately 700 m depth), with Cs (swelling index) values from Fig. 5‑22). Swelling from initially unsaturated conditions at constant load are also shown for comparison (both from oedometric tests and also trends from triaxial tests), with each data point reflecting a separate test. Note the even larger expansion for swelling tests at constant load.
Swelling under constant load shows greater overall swelling strains than unloading from saturated conditions, with one data point even plotting outside the limits of the graph (swelling strain of 5.6% at 0.05 MPa axial effective stress). Previous results of unconstrained swelling tests (also starting from unsaturated conditions) from the Benken (Nagra 2002) and Schlattingen boreholes (Ferrari et al. 2012) are also consistent with the new results, with swelling heaves up to 11%. For the very low effective stress range (< 1 – 3 MPa), swelling may induce microfissuring, i.e. enhancing the expansion (for the mechanism, see Section 5.7.3), compared to the saturated unloading.
In summary, the swelling capacity of the Opalinus Clay was assessed using different methods, and under various conditions and hydromechanical stress paths. All the methods highlight significant expansion, with most of that expansion occurring at very low or negligible effective confinement.
A schematic of the mechanical response of the Opalinus Clay depending on effective stress paths is presented in Fig. 5‑24, in the plane deviator stress versus mean effective stress. Deviator stress is intended here as the maximum minus the minimum principal stress applied, while mean effective stress is the average of the three principal effective stress components.
If the change in stress remains in the elastic domain, the deformation is reversible. Once the stress applied exceeds the elastic domain, part of the deformation will be reversible (elastic), and part will be irreversible (plastic and the elastic domain will expand).
The failure envelope defines the strength of the material, which is dependent on the mean effective stress. Along the failure envelope, the material is not able to sustain further stress increments without the formation of fractures.
Along the curved part of the envelope in the tensile strength domain, low deviator and mean effective stress provide conditions for the initiation of mode I tensile fractures, which might be induced by, e.g., pore pressure increments at low confining stress. For intermediate confinement levels and high deviator stress, shear fractures can be induced. Along the right-hand side of Fig. 5‑24, compaction occurs for high mean and relatively low deviator stress. Some material compaction might be localised (as in a compaction band), while in plastic materials compaction results in a more irreversible volume decrease associated with porosity reduction. Combinations and arrangements between shear and dilation fractures (mixed mode I and II) and compaction structures will occur under intermediate stress conditions.
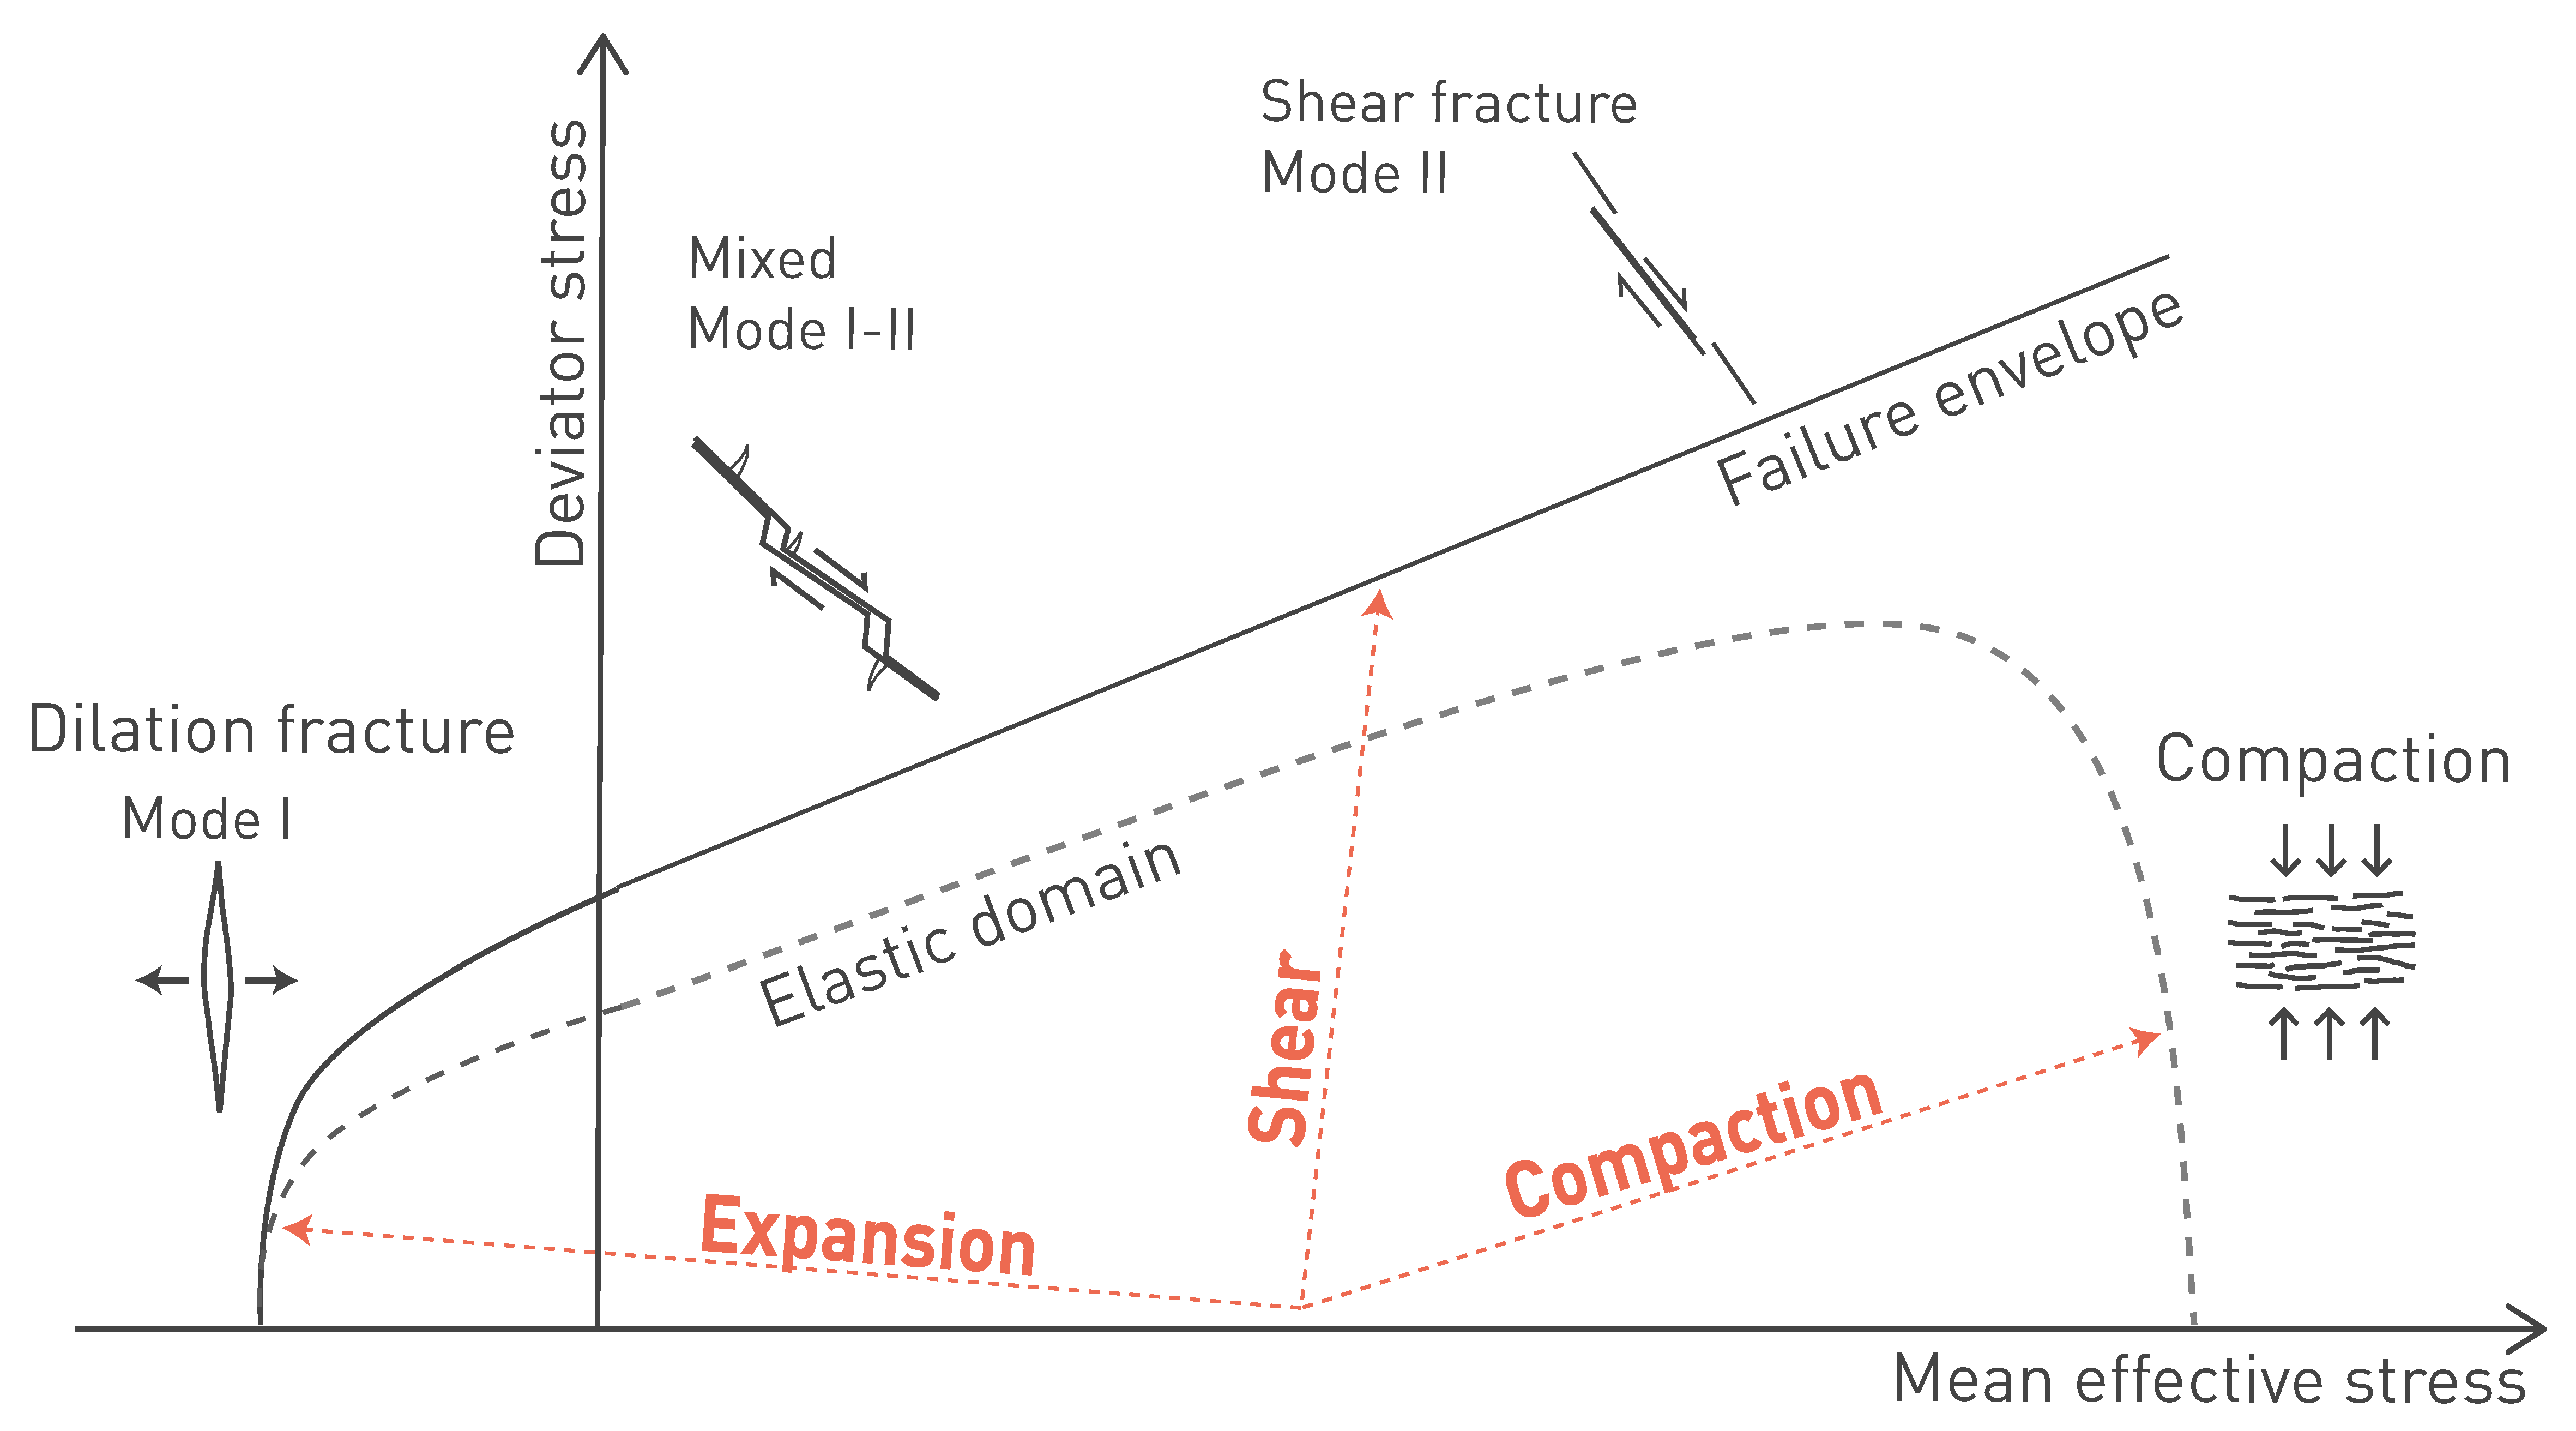
Fig. 5‑24:Schematic of the mechanical response of the Opalinus Clay for different stress paths
Dilation is associated with extensional fractures (mode I) and shear fractures at low effective mean stress (mixed mode I and II). At higher mean effective stress, compactional shear dominates.
During fast loading (and unloading), the pore fluid contained in the pore space is subject to over- (or under-) pressure that dissipates over time. The dissipation of the pore pressure variation is strictly related to the formation permeability. To study the mechanical response of low-porosity geomaterial, it is necessary to analyse both the pore pressure and stress changes through the evolution of the effective stress.
The Opalinus Clay has a low stiffness compared to most other rocks, and high strain to failure. In contrast to other rocks, once the stress to which the material is subjected exceeds the elastic realm, the material can continue to sustain increased loading and accommodate deformation (hardening) before reaching the maximum deviator stress (strength). With further loading after reaching the strength value, the material does not dramatically lose its capacity to sustain load (as brittle response typical of rocks) but can still accommodate a significant deviator stress of approximately 50 to 70% of the strength value. This is commonly referred to as quasi-brittle behaviour.
Over 150 laboratory triaxial tests were conducted on the Opalinus Clay and confining units to characterise the hydromechanical response of these geomaterials in detail, and to explore material variability. Dedicated and benchmarked testing protocols (Minardi et al. 2021) were adopted. These testing protocols are also in accordance with new procedures suggested for triaxial testing of shales currently being finalised by the International Society of Rock Mechanics. The dedicated protocols ensure sufficient pore fluid pressure equilibration to derive effective material parameters, but also avoid damage to the specimens by swelling during the early saturation phase (Crisci et al. 2024a).
Examples of stress paths and stress-strain evolutions during triaxial testing of three contrasting Mesozoic sediments are shown in Fig. 5‑25. For specimens of the Opalinus Clay and the Wedelsandstein Formation, the initial linear elastic stress – strain response transitions into non-linear up to peak (strength). After peak, softening occurs, i.e. progressive reduction of the sustained stress as strain increases until reaching a relatively stable value (usually referred to as post-peak strength). At this point, a clear failure surface has been created within the sample, and further shearing will develop as movement along the surface.
Rocks such as the limestones of the Villigen Formation exhibit a much stronger increase in stress because of their high stiffness when shortening is applied and the elastic domain extends close to the failure envelope (Fig. 5‑24). This is then followed by a more brittle response with a stronger reduction in sustained stress after peak. The differences in stiffness and plastic response between the Opalinus Clay and such competent rocks have implications for the stress concentration (Section 4.4) and the tectonic overprint (Sections 4.3.5 and 5.5.4).
The stress paths shown in Fig. 5‑25 correspond to undrained tests, i.e. the pore fluid volume in the sample remains constant during loading. An increase (or decrease) in pore pressure is related to the specimen’s attempt to reduce (or increase) its volume. Since water cannot escape (or enter) the sample in undrained conditions, pore pressure increases (or decreases). As loading progresses, pore pressure is increased until reaching a maximum value, then decreases. It is noted that, given the low permeability of the Opalinus Clay and the confining units, a slow shear rate needs to be used to ensure that the measured pore pressure is representative of the entire sample volume.
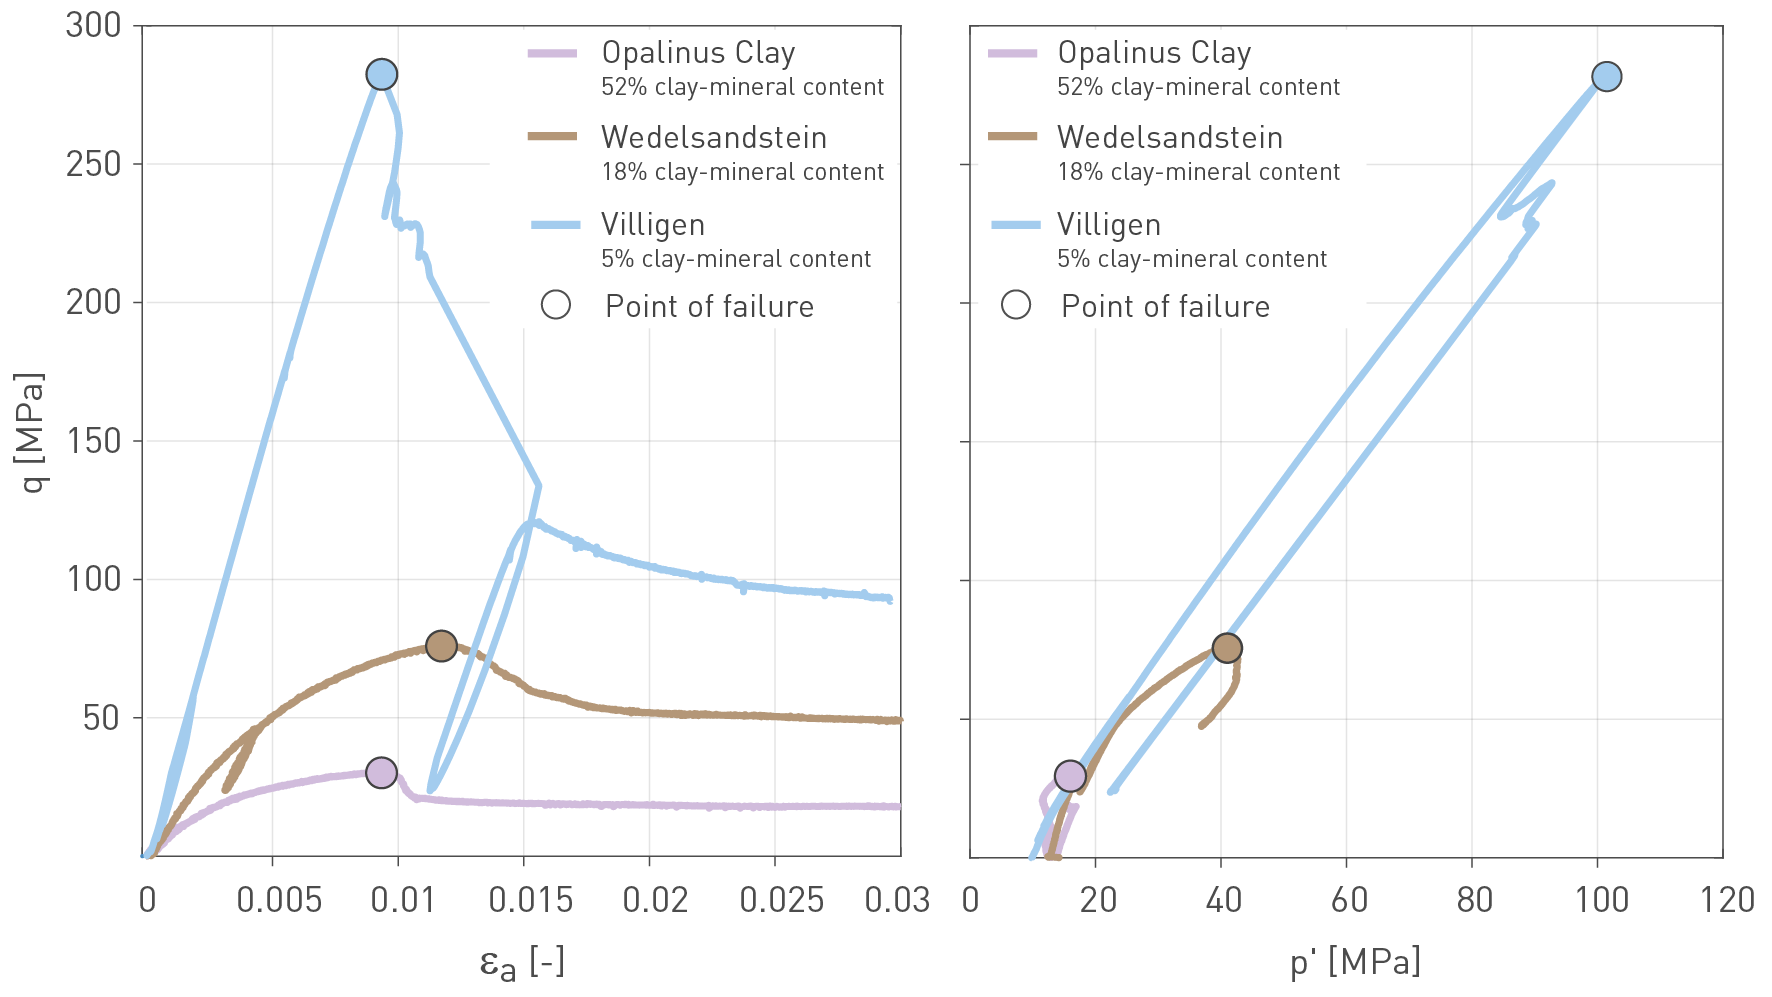
Fig. 5‑25:Different mechanical response of Mesozoic sedimentary rocks with contrasting clay-mineral contents
Left side: deviator stress (q) vs. axial strain (εa). Right side: Deviator stress (q) vs. mean effective stress (p'). Data from Dossier IX of TBO reports in Tab. 2‑1.
The Opalinus Clay shows a cross-anisotropic (or transversely isotropic) behaviour (Section 5.5.5), i.e. the response in the direction orthogonal to the bedding plane is different from the response in the bedding plane direction. Despite the heterogeneity of the formation, the shear strength shows limited variability in all the tested directions with respect to bedding (Crisci et al. 2024b).
The shear strength of all triaxial tests loaded perpendicular to the bedding direction (S-specimens) of the Opalinus Clay tested in the TBO campaign is reported in Fig. 5‑26 by borehole, in terms of axial versus radial effective stress. Results are colour-coded by sample bulk density. Bulk density is adopted because it depends on both the effect of the mineralogical composition and the porosity of the sample. Despite the range of sourcing depth in the 7 boreholes (450 m – 1'000 m), the range of mineralogy (35% to 70% clay-mineral content) and porosity (0.10 to 0.14) tested, only minor strength differences emerge. The same observation was also made in the other testing directions (parallel and at an angle to bedding).
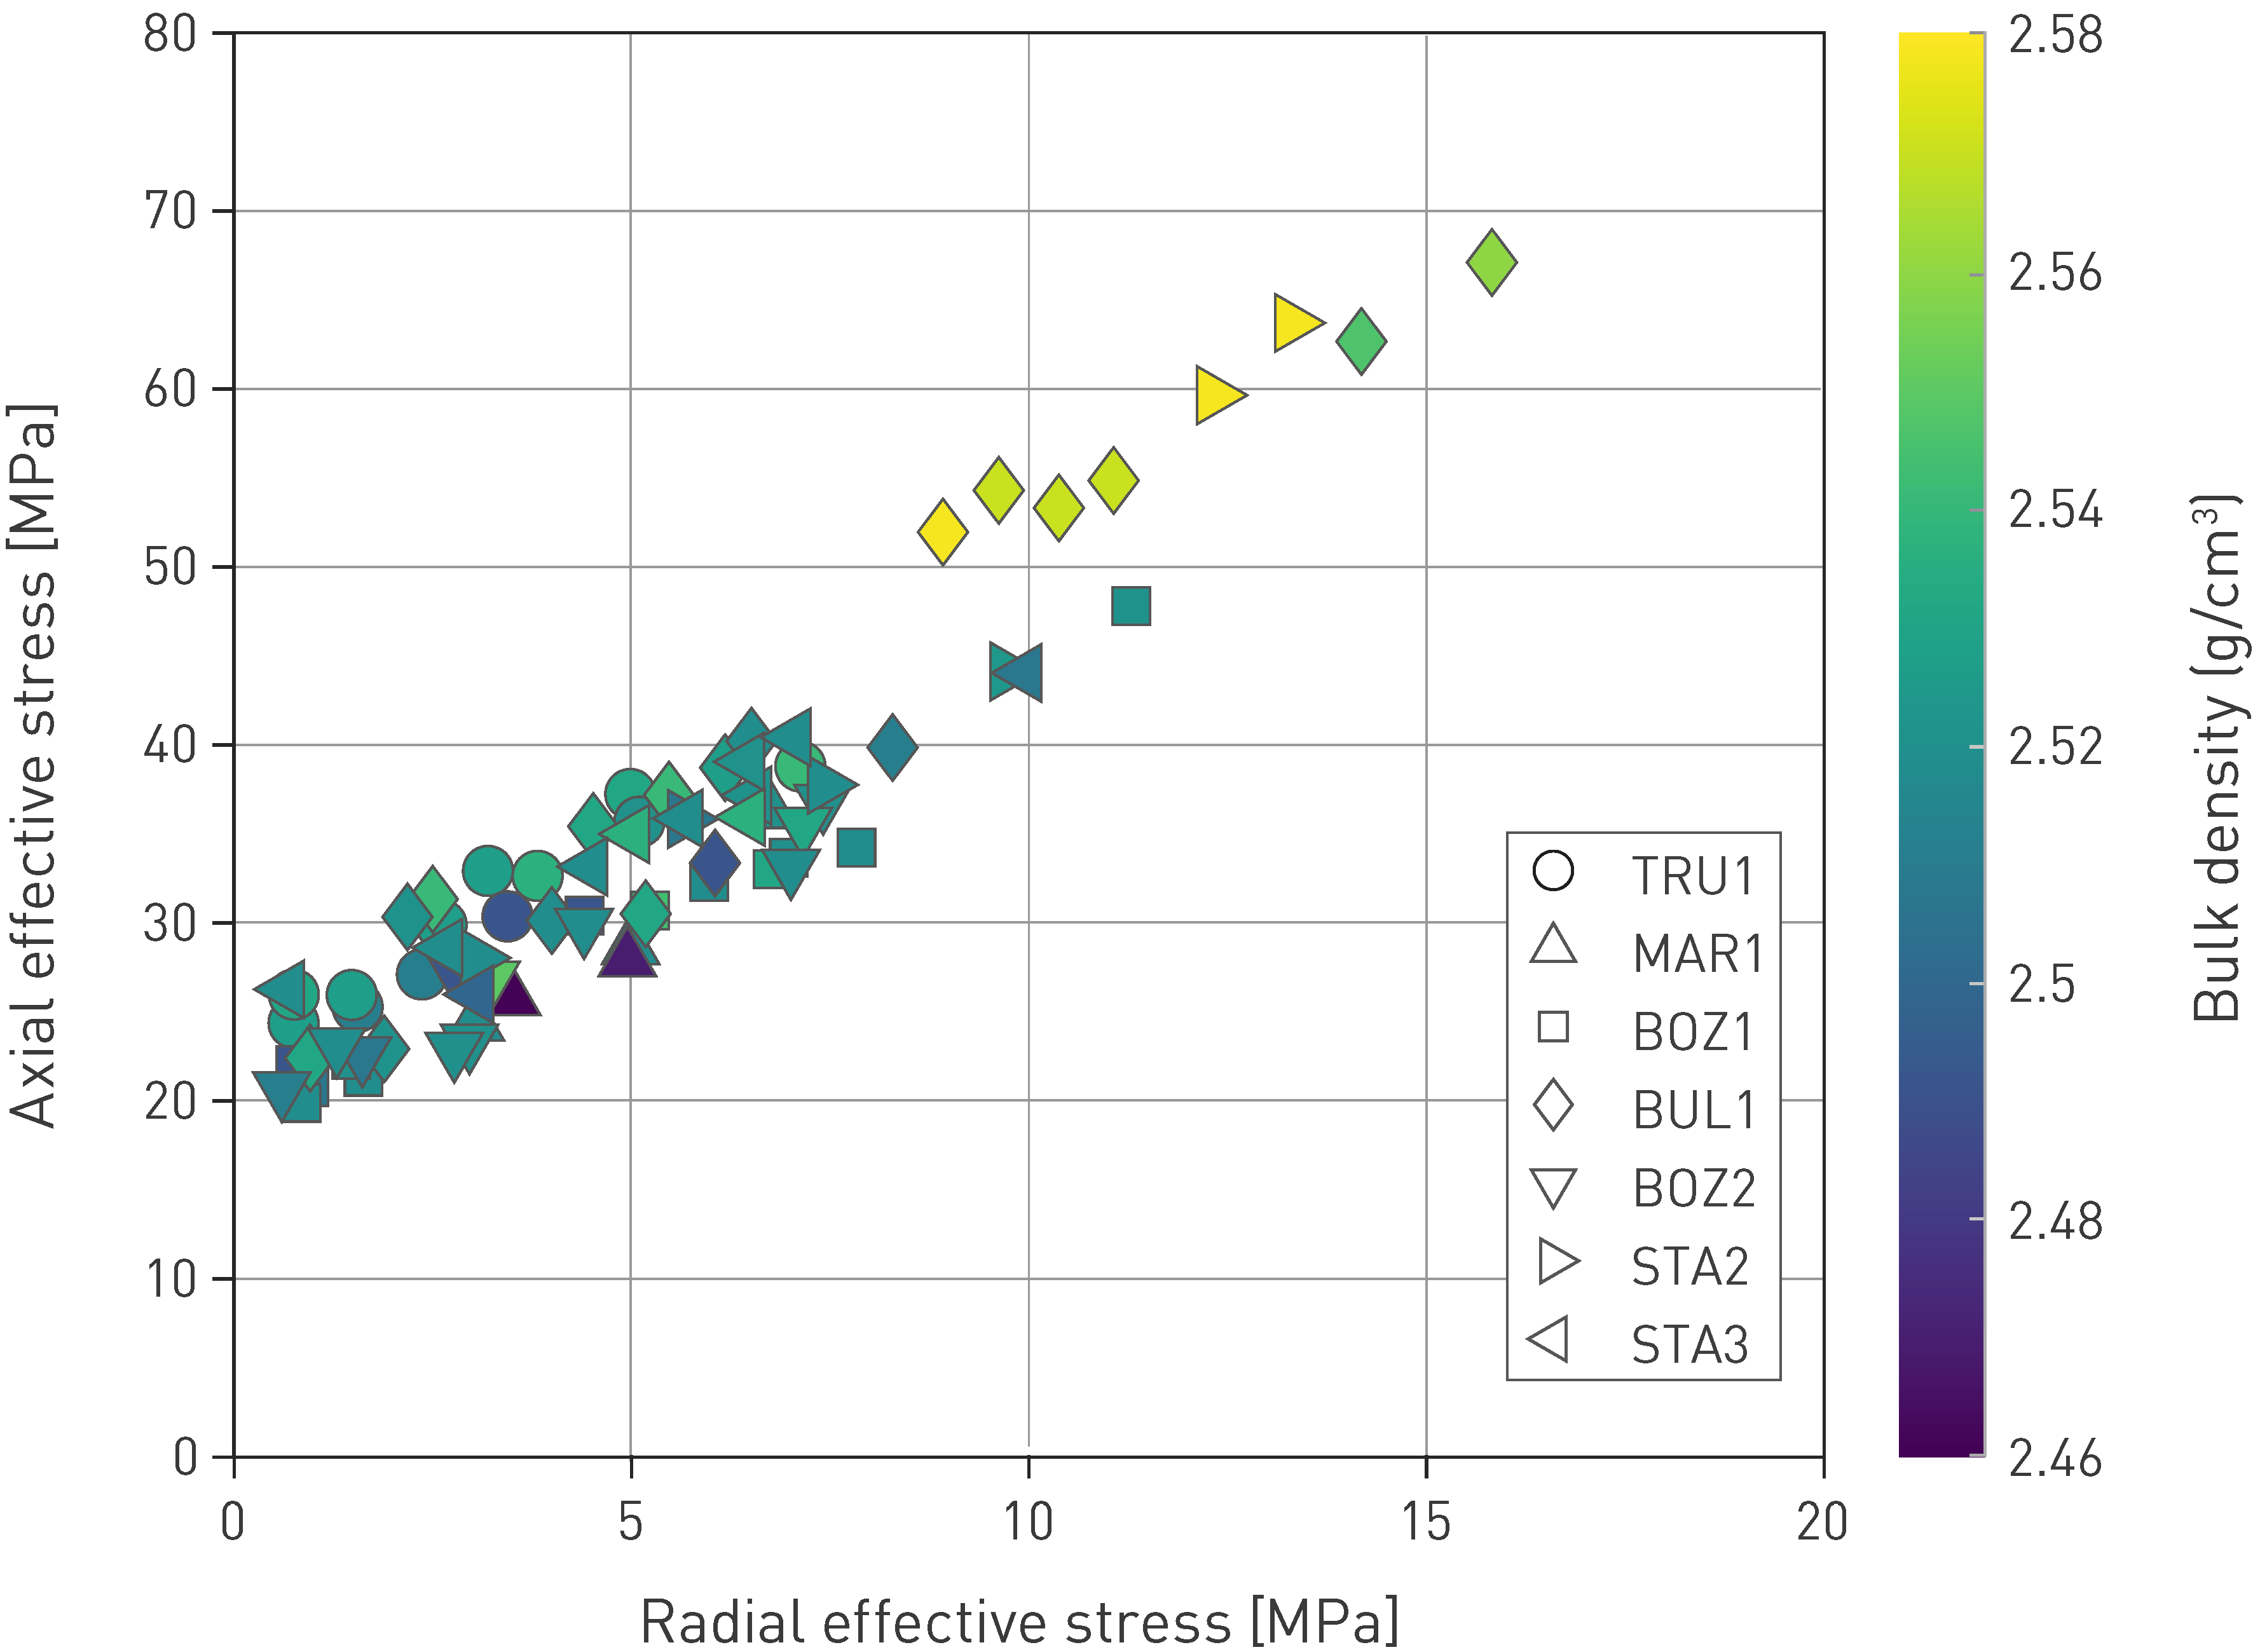
Fig. 5‑26:Shear strength of the Opalinus Clay from the siting regions
Loading of the cylindrical specimens was in axial direction, prependicular to bedding. Note: The intersection of the regression line (not shown) with the y-axis would correspond to the calculated effective unconfined compressive strength (approximately 21 ± 5 MPa). Detailed data analysis can be found in Crisci et al. (2024b).
The shear strength values of the Opalinus Clay from the siting regions (TBO campaign) contrast with results obtained from the Mont Terri rock laboratory (FMT), particularly for samples with high clay-mineral contents (shaly facies; Fig. 5‑27). This is related to the difference in porosity, especially between shaly facies and TBO results (approximately 0.12 to 0.17 vs. 0.10 to 0.13; Crisci et al. 2024b). Therefore, the different burial history and difference in current depth between TBO (400 to 1'000 m) and FMT (220 to 320 m) clearly influences the strength of the clay-mineral-rich endmember of the Opalinus Clay.
In contrast to shear strength of the intact material, no major discrepancy is seen for test results of TBO and FMT samples for post-peak strengths (Fig. 5‑27 right), but differences appear to be related to facies type (mineralogy). In summary, where intact strength values are homogenised across the facies with greater burial, i.e. controlled by the burial history, post-peak strength seems to be controlled by mineralogy (Crisci et al. 2024b).
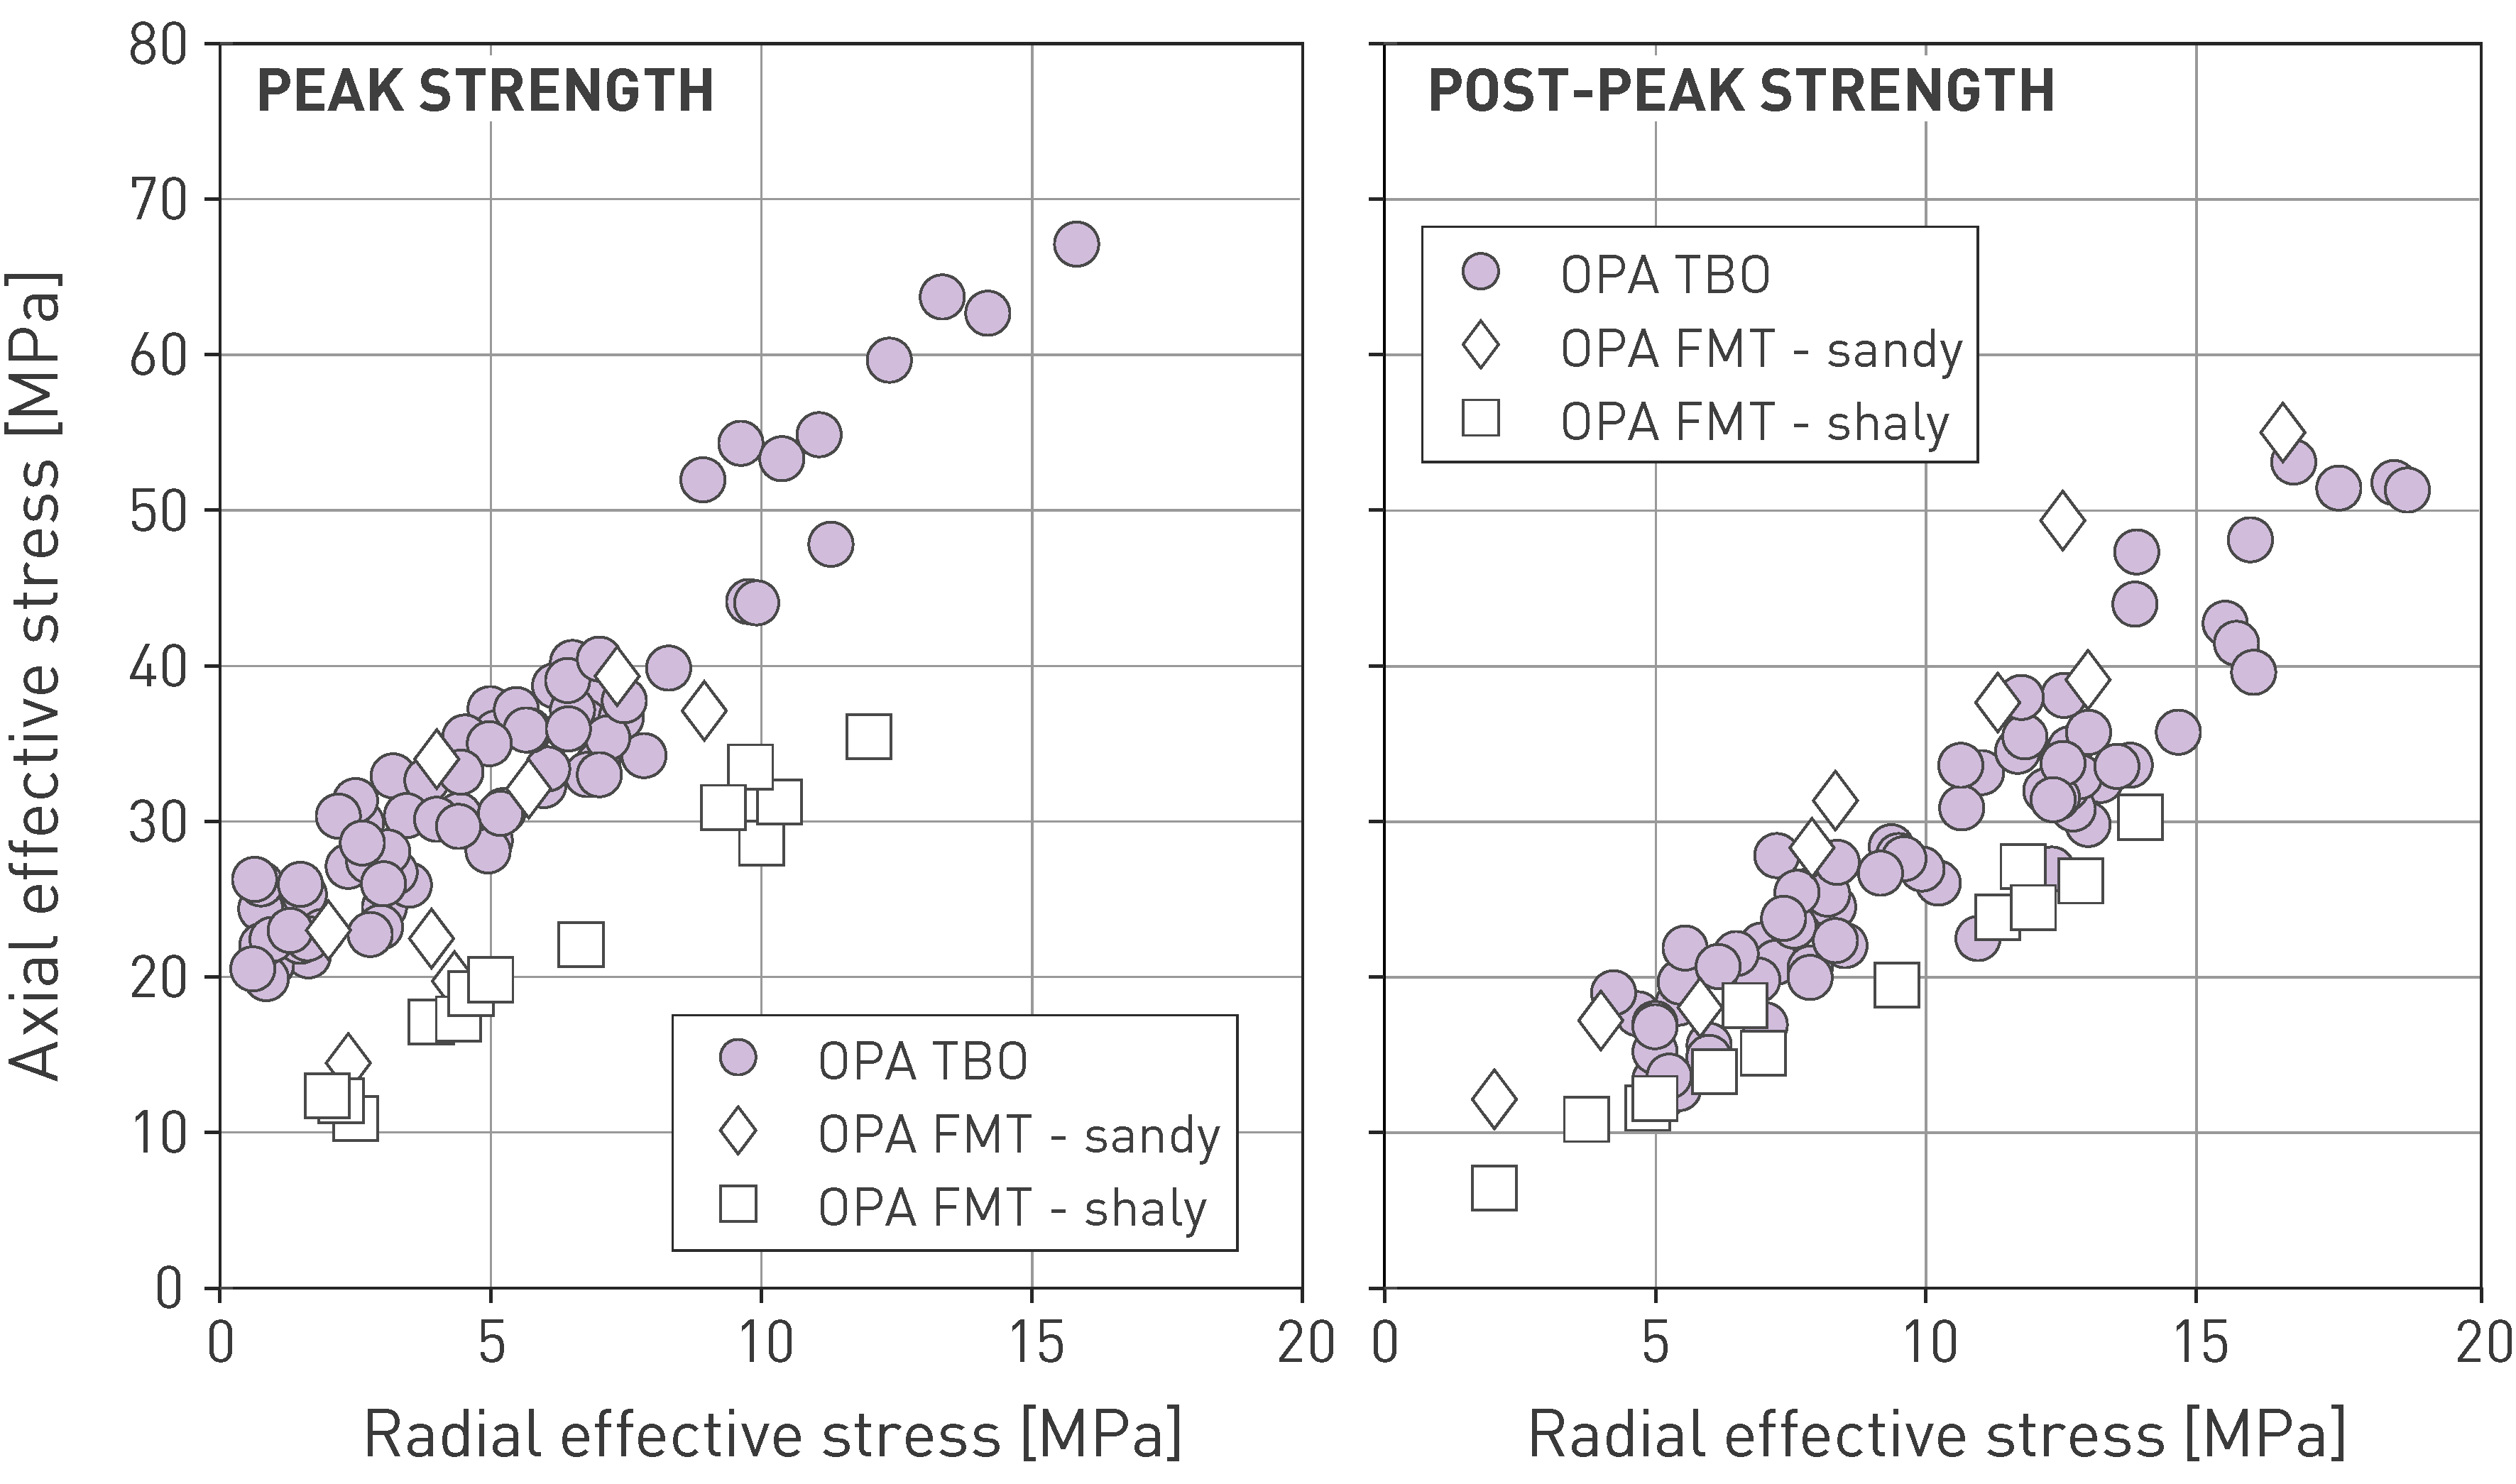
Fig. 5‑27:Peak and post-peak strength of the Opalinus Clay in the siting regions in comparison to Mont Terri
All test results are for specimens loaded perpendicular to bedding, and each data point reflects stresses at point of failure (peak strength) or after development of deformation band (post-peak strength). TBO data are from Crisci et al. (2024b). Mont Terri rock laboratory (FMT) data are from Crisci et al. (2021), Favero et al. (2018) and Minardi et al. (2019).
No significant differences in shear strength were observed with depth or between siting regions. Fig. 5‑26 and Fig. 5‑27 also indirectly illustrate the strength differences of the Opalinus Clay compared to estimates prior to the TBO campaign. The estimation of the shear strength of the Opalinus Clay in Stage 2 of the Sectoral Plan (SGT) was mainly based on experience from Mont Terri (Marschall & Giger 2016) because of the small size of the database for the siting regions. This led to a relatively low reference value for the unconfined compressive strength (~ 10 MPa). In contrast, the unconfined compressive strength of the new TBO data varies between approximately 16 and 26 MPa. This is clearly greater than the reference value and partly even greater than the upper bound of SGT Stage 2 (20 to 22 MPa). The range of strengths of Opalinus Clay from the TBO results are also very similar to the Callovo-Oxfordian clay-rocks at Meuse / Haute Marne (OECD/NEA 2022).
Besides laboratory testing, elastic properties of the Opalinus Clay and confining units were also assessed through direct field measurements at larger scale, via pressure meter tests (Elkhoury et al. 2022, Elkhoury et al. in press). Pressure meter testing (PMT) is a formation test that consists of inflating a cylindrical packer inside a borehole, while measuring the radial deformation as a function of packer pressure. Measurement of fluid volume injected into the packer serves as a measure of borehole deformation, therefore changes in packer pressure associated with changes in injected fluid volume provide a direct measurement of formation stiffness. Results from five pressure meter stations allow a direct comparison between the laboratory and field determination of the shear modulus in the direction of the bedding plane (G//). The impact of the difference in scales (a few cm in the laboratory, a few decimetres in the field) was investigated via dedicated numerical analysis and was found to be negligible. Field moduli compare well with moduli derived from laboratory testing but were approximately 10 – 30% higher than the latter (Elkhoury et al. in press, Nagra 2024m). The main cause of the difference is identified in the strain dependency of the elastic moduli determination, in agreement with findings in similar investigations at Mont Terri (Liu et al. 2022).
Overall, there is an excellent database on the geomechanical properties of the Opalinus Clay from both laboratory and field measurements. The good understanding of the deformation behaviour of the Opalinus Clay is also reflected in detailed constitutive laws, which have been further improved over recent years (e.g. Parisio & Laloui 2017, Khaledi et al. 2023). An advanced elasto-plastic damage model was developed (Madaschi et al. 2023), accounting for the anisotropy in strength and stiffness. The good agreement of modelled evolution of stresses and pore pressure compared with laboratory test results is shown in Fig. 5‑28.
Depending on the purpose of the investigation, somewhat simpler constitutive models have also been developed and calibrated on the new Opalinus Clay database (e.g. Nordas et al. 2024).
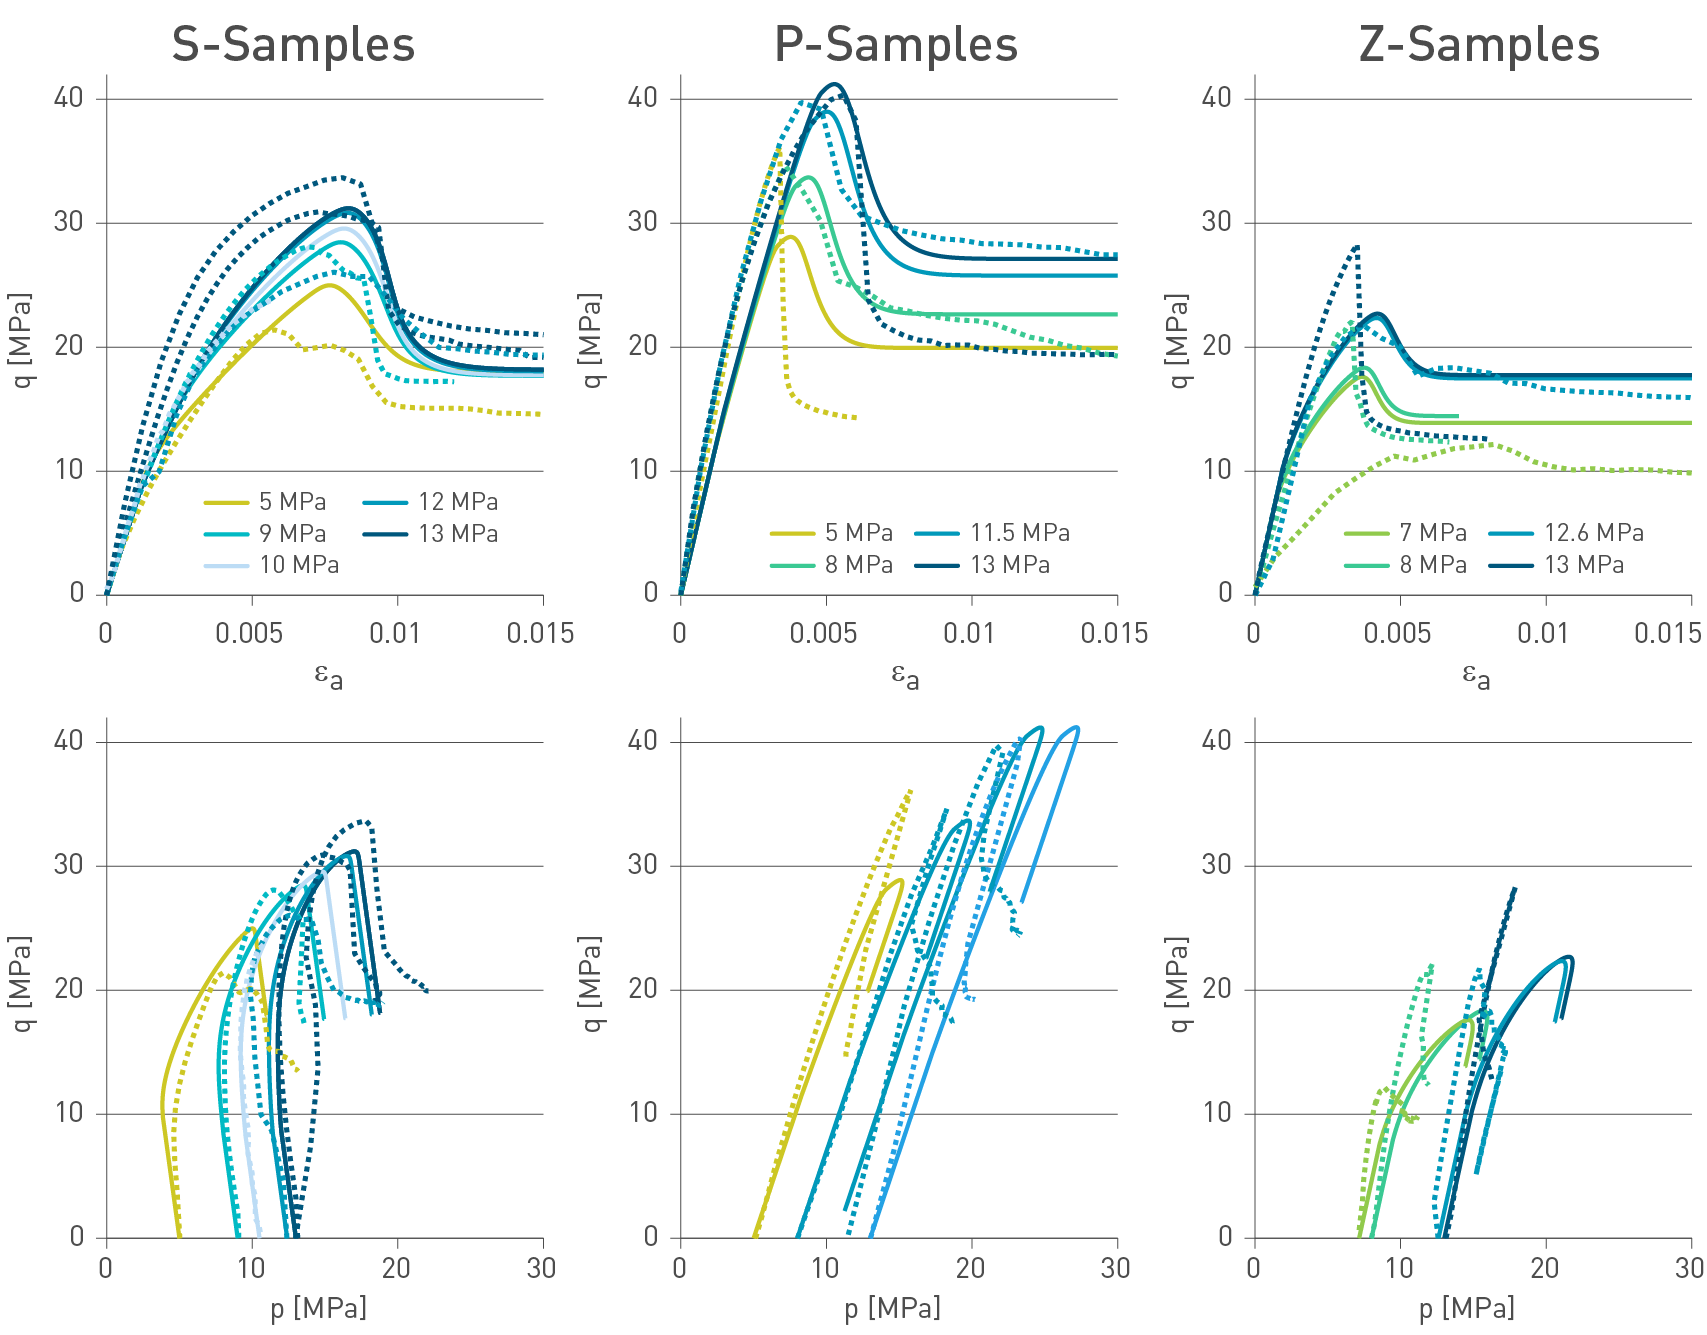
Fig. 5‑28:Comparison of mechanical behaviour in numerical (bold lines) and laboratory test results (dashed lines)
Plots above show deviator stress q as a function of axial strain εa, and plots below show stress paths, i.e. q as a function of the mean effective stress p'. Results are grouped by loading direction with respect to bedding: S = 90º, P = 0º, Z = 30º. After Madaschi et al. (2023).
Transitioning from the peak to the post-peak phase in laboratory tests of the Opalinus Clay is associated with the formation and evolution of slip surfaces and linkage structures between them. A light microscope image showing the deformation feature of a laboratory-deformed specimen is shown in Fig. 5‑29. This specimen contains mm-wide layers which are largely free of clay minerals and was loaded in the direction perpendicular to bedding. Deformation between the hanging wall cylinder and footwall cylinder is accommodated along several shear bands which form an anastomosing network of variable thickness and enclosing relatively undeformed rocks as lenses. The shear band can also be seen to deflect at mineralogical boundaries where dark grey shows clay-mineral-rich intervals and the white bands are quartz- and carbonate-rich layers. The following section relates this microstructural example to the rare field examples of faults in the Opalinus Clay.
The unconfined compressive strength (UCS) of the sedimentary rocks encountered in the deep boreholes varies strongly depending on the rock mineralogical composition. Low clay-mineral content formations generally show higher strength, while strength progressively reduces as the clay-mineral content increases and cementation decreases. The largest decrease in strength is observed for a clay-mineral content from 0 wt.-% to 20 wt.-%, while the decrease is moderate between 20 wt.-% and 40 wt.-%. The UCS remains relatively constant for clay-mineral content values above 40 wt.-%, i.e. in the range of the composition of the Opalinus Clay and many of its confining units (Fig. 5‑30).
For the Opalinus Clay, the range of UCS values in Fig. 5‑30 is extrapolated from triaxial tests (y‑axis intercept in Fig. 5‑26). For the other rock formations, UCS was measured via uniaxial compressive tests in the rock-mechanical testing programme.
Mineralogical composition was measured on the Opalinus Clay samples, while for the other rock samples it was constrained from the core-calibrated logs (Becker & Marnat 2024) for the location where the samples were sourced.
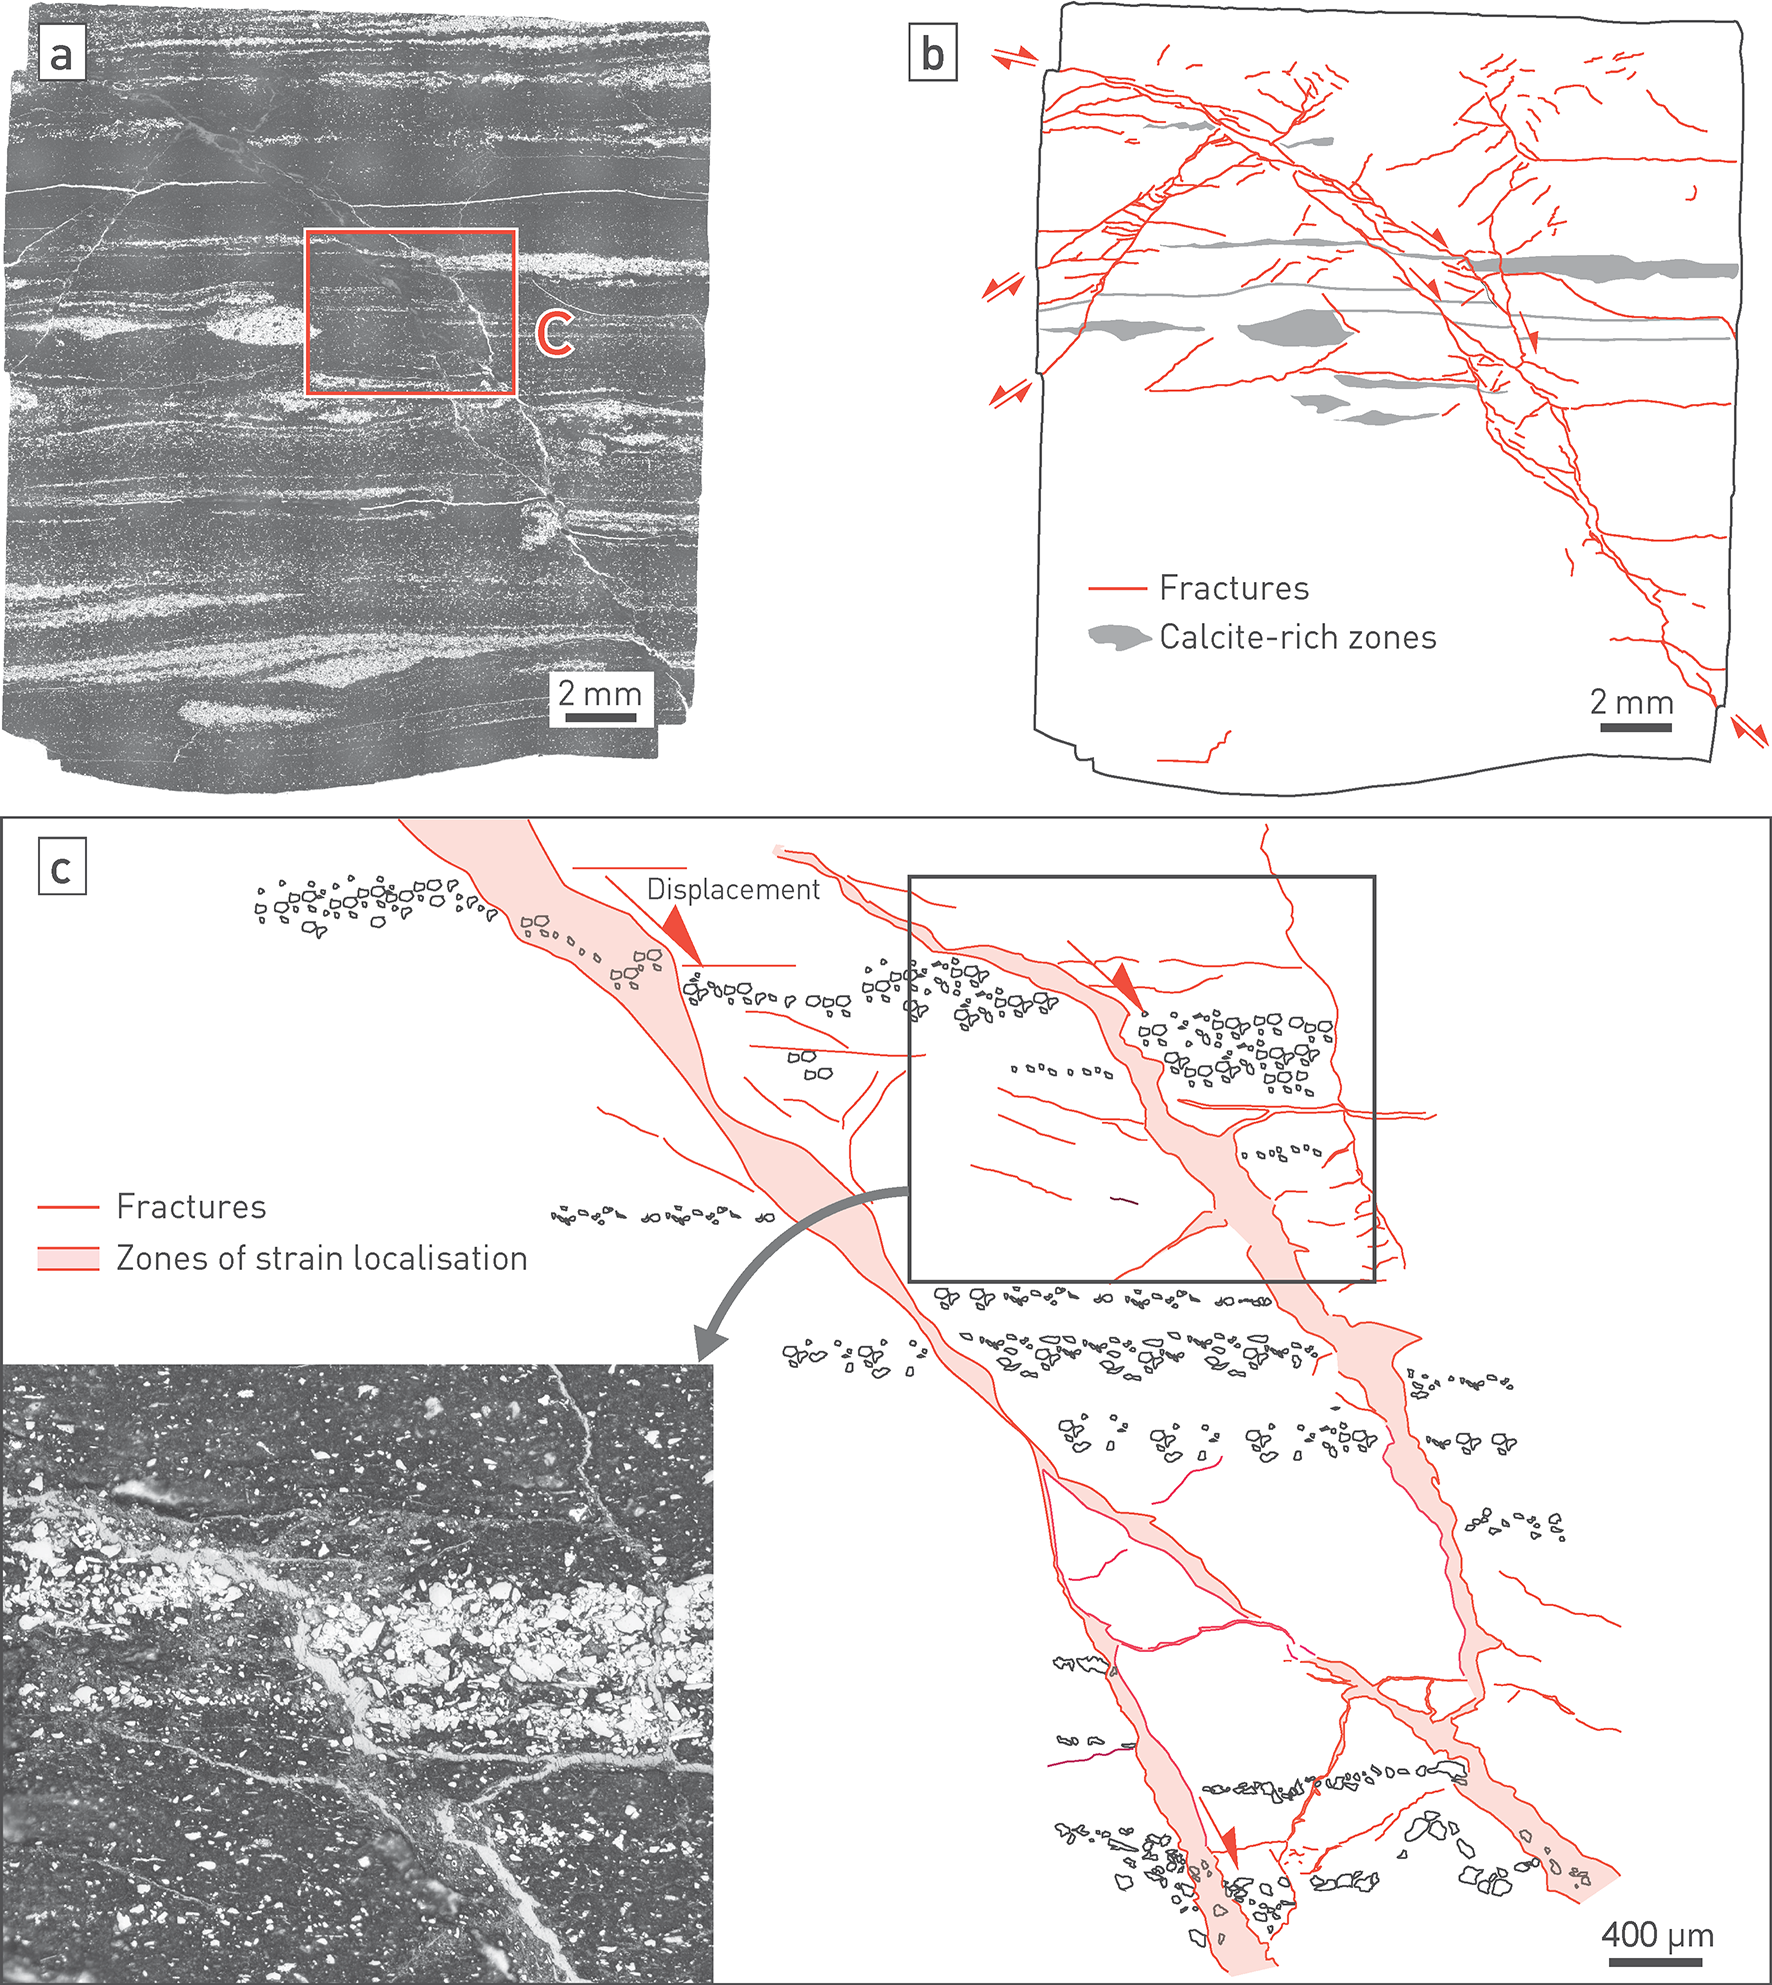
Fig. 5‑29:Typical fault microstructure of the Opalinus Clay obtained in triaxial testing
Example of the Opalinus Clay from borehole BOZ2 (test C5_BOZ2_1_504.78S8CTCU).
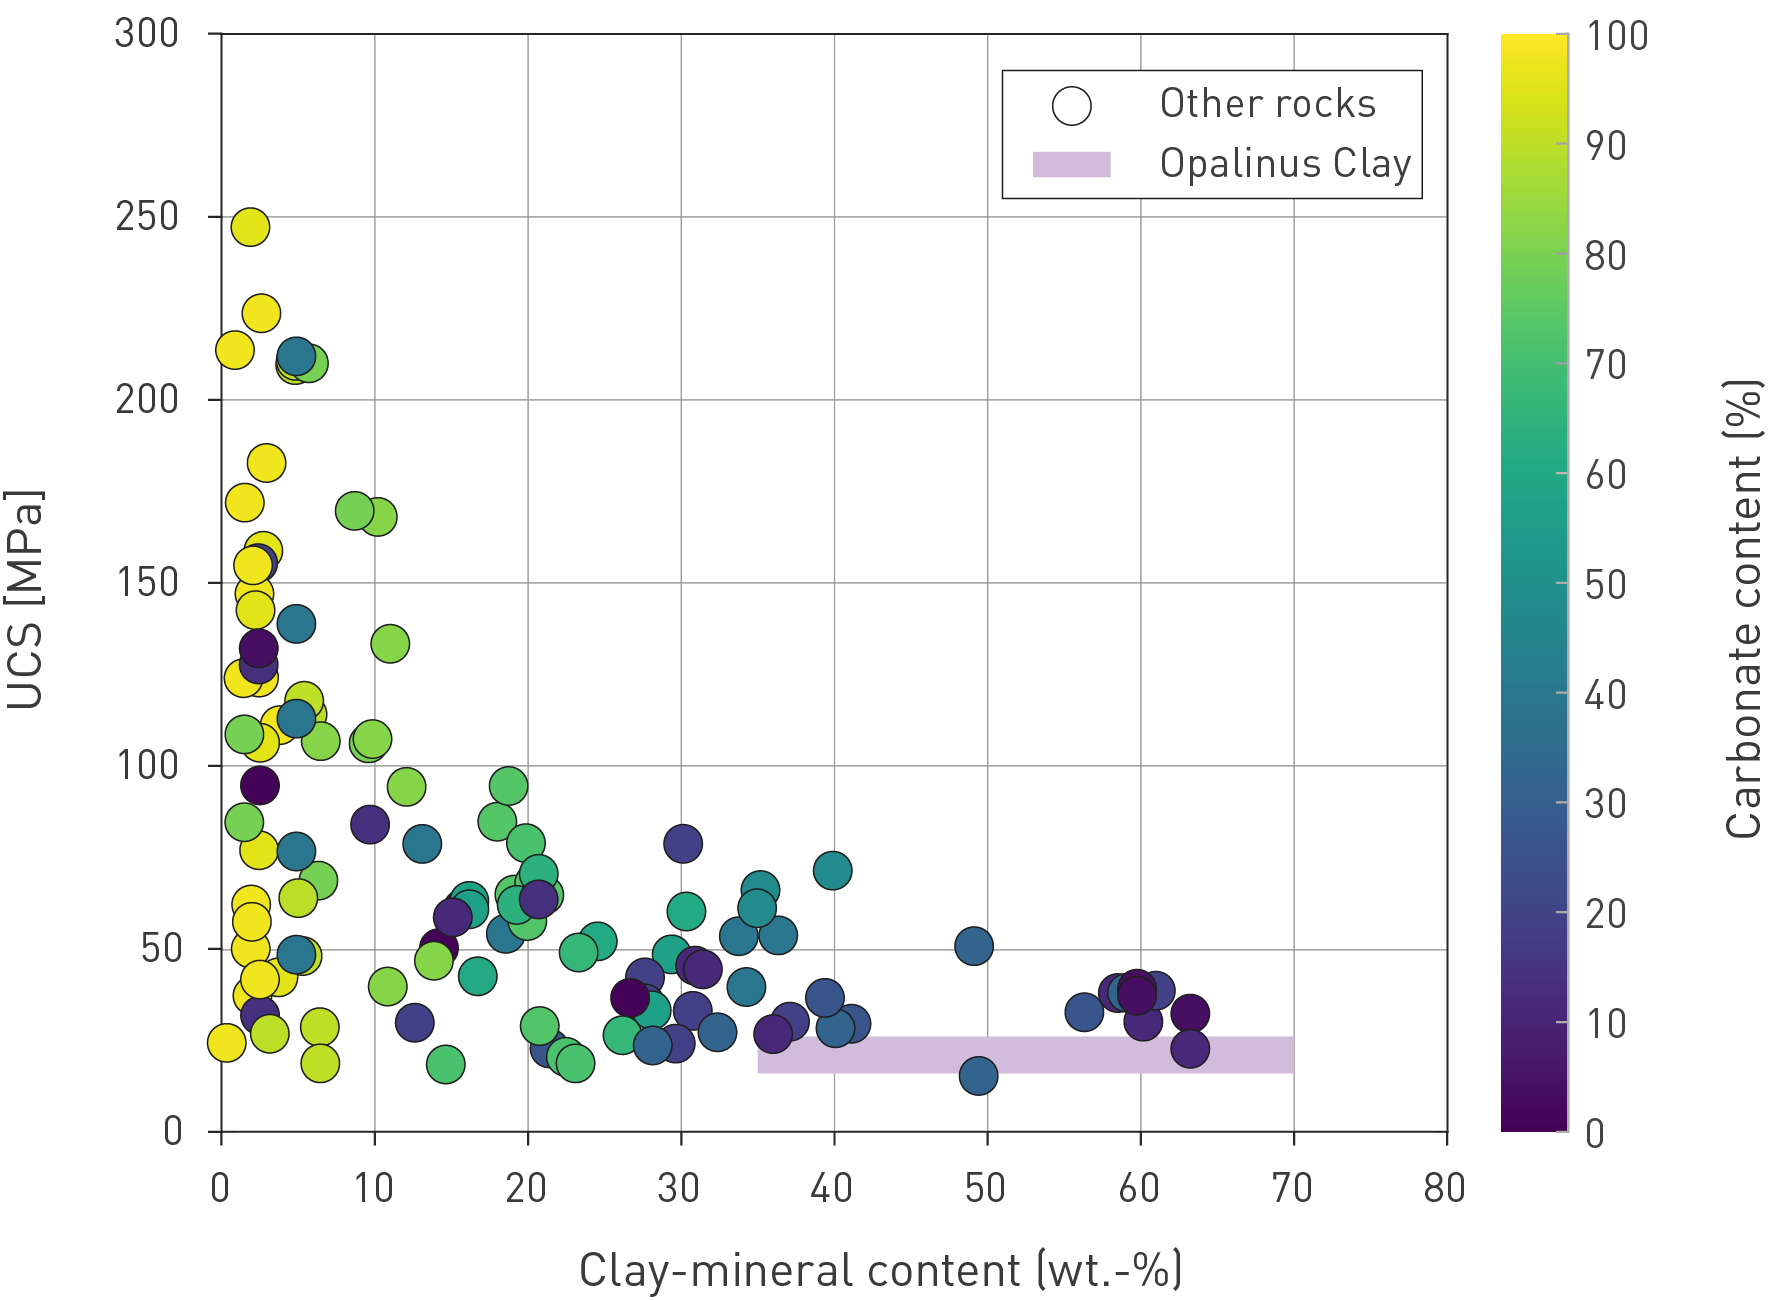
Fig. 5‑30:Unconfined compressive strength (UCS) as a function of the clay-mineral content
Note the strong reduction in strength from 0 to approximately 20 wt.-% clay-mineral content. At higher clay-mineral contents, the changes are moderate, and almost negligible within the Opalinus Clay.
The degree of tectonic deformation in the Opalinus Clay is small compared to the more competent units of the Malm Group and Triassic units (Section 4.3.4). Geomechanically stiffer units are more affected by tectonic loading (Section 4.4), i.e. the stress increase per increment of shortening is higher for limestones than for the Opalinus Clay (Fig. 4‑79 and Fig. 5‑25).
Most drill cores recovered from the Opalinus Clay during the TBO campaign were free of any fractures (Fig. 5‑24). Nevertheless, some veins and smaller faults (below the seismically mappable scale) were encountered (Dossier V of TBOs, see Tab. 2‑1). Based on borehole image analysis, all fractures are considered macroscopically closed in situ. A representative selection of encountered fractures is provided in Fig. 5‑31 (see Tab. 4‑1 for terminology).
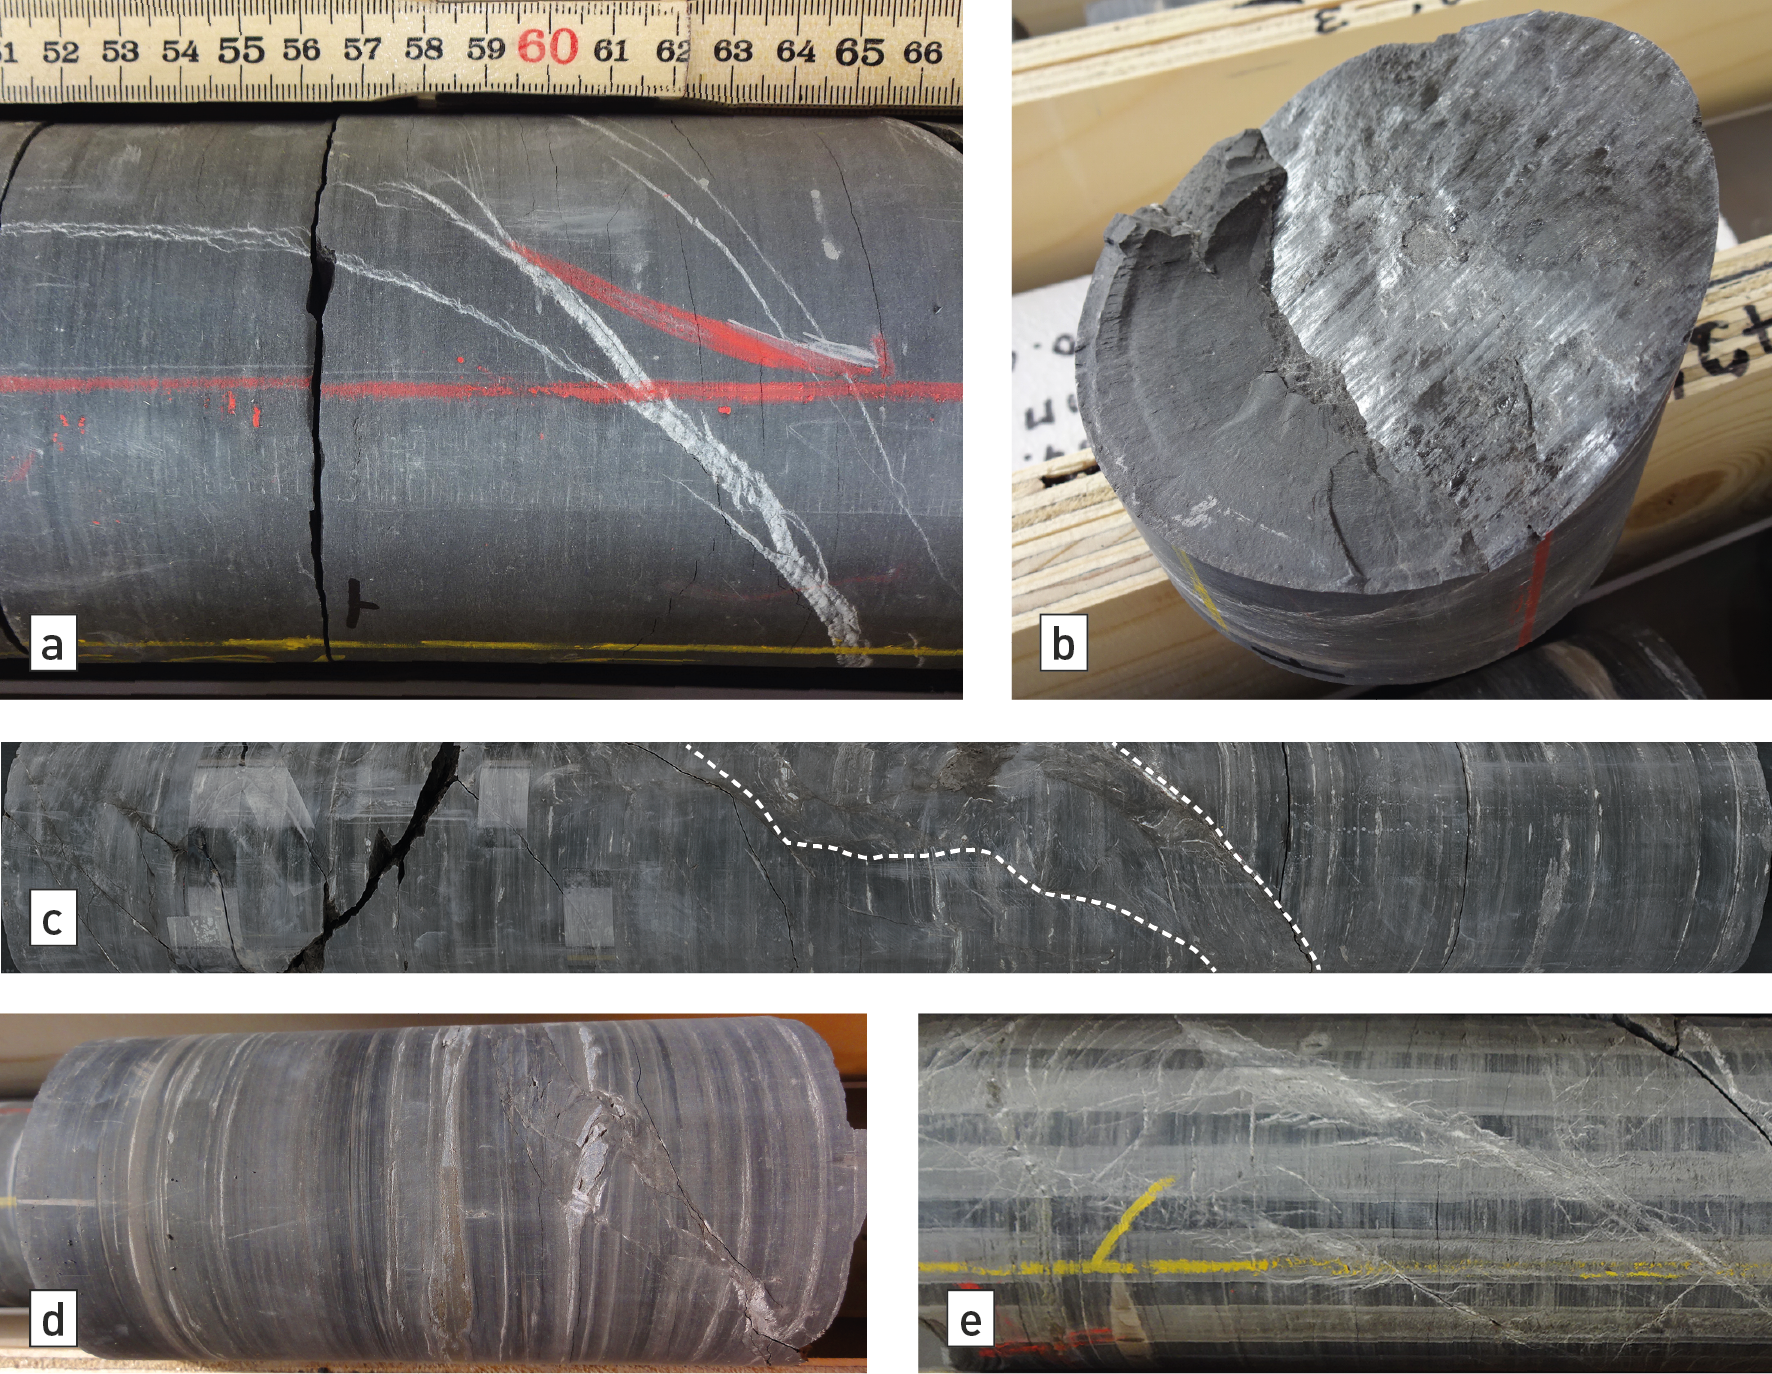
Fig. 5‑31:Examples of tectonic deformation accommodated in the Opalinus Clay from the recent deep boreholes
(a) Vein or mineralised fracture (STA2, 821.86 – 822.15 m MD log depth). (b) Example of micro fault (shear fracture) with calcite slickenfibres (STA2, 855.61 m MD log depth). (c) Small-scale fault resulting in tilting of bedding (BOZ2, 510.02 – 510.70 m MD log depth). (d) Micro- to small-scale fault (BOZ2, 507.90 – 508.15 m MD log depth) with tilting of bedding and onset of fault breccia. Initial normal faulting was followed by a strike-slip-dominated faulting. (e) Multi-stranded veins (STA2, 885.93 – 886.33 m MD log depth).
Small-scale faults (i.e. faults below seismically mappable scale, but larger than an individual surface) consist of tilted and disturbed bedding and fault rock (Fig. 5‑31c), or in some cases of a cluster of micro faults (i.e. individual surface with evidence for movement) including mineralisation of variable thickness (Fig. 5‑31d) and were referred to as fault zones in Dossier V of the deep borehole reports (Tab. 2‑1). Here, major clusters of micro faults are also included; these were highlighted and discussed in the respective reports in the total count of small-scale faults. Typically, one to a maximum of three small-scale faults are identified within each of the newly drilled boreholes in the Opalinus Clay section (Fig. 5‑32a). No cohesionless fault rocks (e.g. gouges) were observed in any of these small-scale faults.
Micro faults (Tab. 4‑1) are more common in the Opalinus Clay. In Dossier V of the deep borehole reports (Tab. 2‑1), micro faults are either termed fault planes, mirror-like fault planes or stylolitic fault planes. Offsets constrained on the micro faults are typically very small, in the order of sub-mm to mm for examples of mirror-like fault planes.
These are typically only 1 – 2 mm thick and cannot be drawn to scale in Fig. 5‑32a (i.e. the stroke width exaggerates the actual width of the micro fault). They are characterised by a single shear surface with striations (i.e. slickensides) and partly slickenfibres indicating sense of shear (Fig. 5‑31b). The number of micro faults encountered in the boreholes varies between 162 micro faults in 122 m of the Opalinus Clay in BOZ2 (i.e. 1.3 micro faults per m) and 37 micro faults in 106 m of the Opalinus Clay in STA2 (0.4 micro faults per m). Overall, the micro faults show shallow dips below 30° (74% of the measured dips are below 30°, 91% are below a dip of 45°). The deviated borehole RHE1 (ca 30° from vertical) shows very similar dip values for the micro faults (71% of the micro faults have measured dips below 30° and 86% have dips below 45°). This comparability of dip angle between the deviated RHE1 borehole and the vertical boreholes can be interpreted in the sense that no systematic sampling bias by vertical boreholes was observed: if vertical micro faults were systematically undersampled in the vertical boreholes, a different dip distribution of micro faults in RHE1 would have been expected.
Veins (mineralised fractures) (Fig. 5‑31a) are mostly very thin, with thicknesses of 1 – 2 mm (> 90% of all mapped veins have a thickness below 2 mm). These veins were further analysed regarding their microstructural and geochemical characteristics (Section 4.7). Detailed microstructural analyses highlighted several phases of vein growth from early compaction to Miocene shortening and extension related to the formation of the Jura Fold-and-Thrust Belt and the Hegau-Bodensee Graben (Akker et al. 2023). Mechanisms of formation and relevance of veins for the barrier integrity are further discussed in Section 5.7.6.
The overall fracture frequency (i.e. including veins) was statistically evaluated by the fracture area per unit volume (P32 value) in Section 4.3, and a detailed analysis for the Opalinus Clay is provided in Fig. 5‑32b. The whisker plots in the figure are explained for the example of borehole BOZ2: the median P32 is 0.6 m2/m3, the average P32 is 1.9 m2/m3, with 75% of the 15 cm sampling intervals having a P32 lower than 2.1 m2/m3 and 95% of the 15 cm intervals lower than 5.3 m2/m3.
Comparing the analyses across all new boreholes shows generally very low P32 values; only for BOZ2 is the median value above 0 m2/m3. This means that the vast majority of the 15 cm sampling intervals in the Opalinus Clay are devoid of any fracture (excluding drilling-induced). For STA3, STA2, BUL1, MAR1 and TRU1, 95% of all sampling intervals have a P32 value of zero (i.e. box and whisker plots are located at zero in Fig. 5‑32b). Larger continuous intervals free of any fracture (excluding drilling-induced) were encountered in each borehole. The longest intervals free of fractures for each borehole vary between 12.1 m in BOZ2 and 32.1 m in BUL1.
Furthermore, the whisker plots allow differentiation of the degree of clustering between the boreholes (Fig. 5‑32b). For the boreholes STA3, STA2, BUL1, MAR1 and TRU1, the average P32 values are above the 95% interval of data, indicating a strong clustering with very few 15 cm intervals characterised by relatively high P32 values. In the boreholes BOZ2, BOZ1 and BAC1, this difference is less but the average values are still above the median values, indicating some degree of clustering. Generally, the boreholes BOZ2, BOZ1 and BAC1 are characterised by a more pervasive tectonic deformation and generally higher P32 values. The RHE1 borehole also has elevated P32 values, which might be associated with the seismically mappable Rheinau Fault located in the vicinity (Nagra 2024c). The more acute angle between the micro faults and the borehole path also leads to higher P32 for geometric reasons because dip distribution in RHE1 is comparable to that in the vertical boreholes (TBO reports in Tab. 2‑1).
Outcrop-scale faults within the Opalinus Clay are known from quarries in Siblingen and Holderbank (Fig. 5‑33), and the "Main Fault" in the Mont Terri rock laboratory (Fig. 5‑34). These faults can be considered as transitional small-scale to local faults according to Tab. 4‑1, and accordingly are at an intermediate scale between the structures encountered in the cores and the seismically mappable faults (Nagra 2024a, 2024b, 2024c).
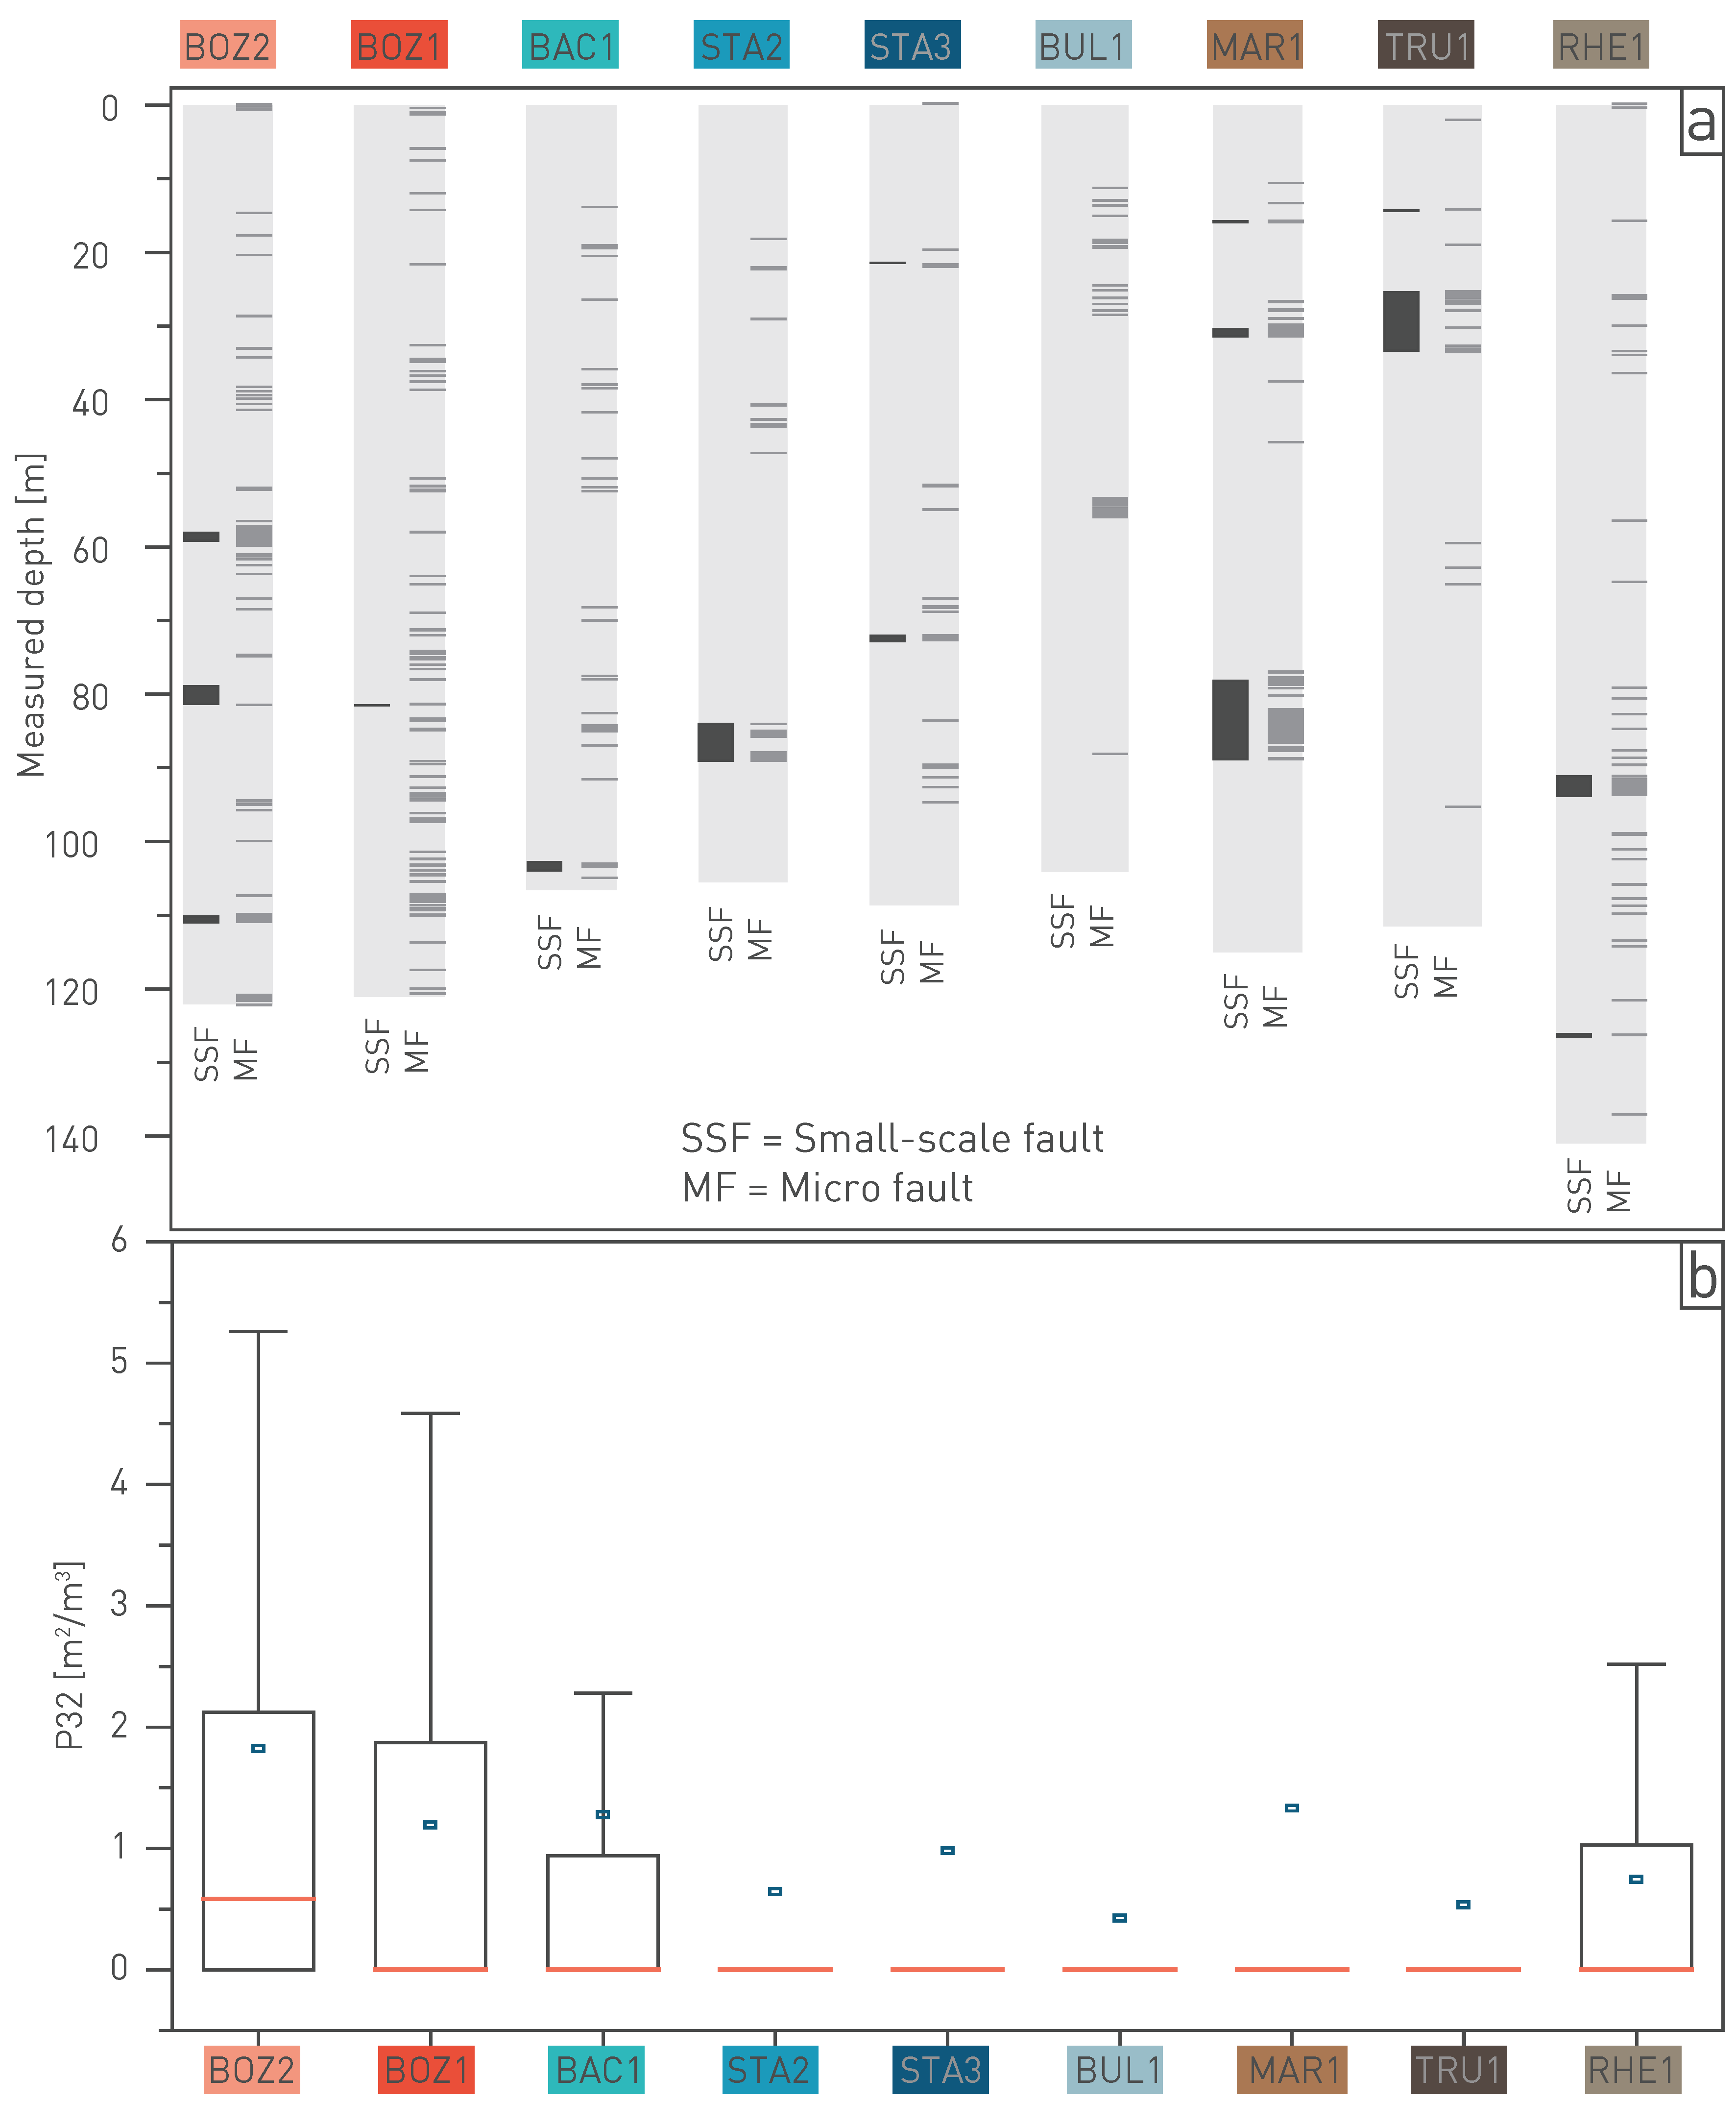
Fig. 5‑32:Distribution of small-scale fault and micro fault frequency in the Opalinus Clay from new boreholes and overall fracture frequency
(a) Depth plot showing the distribution of small-scale faults and micro faults. Boreholes are arranged from W to E. Note that vertical extent is only to scale for the small-scale faults, but stroke width exaggerated the width of micro faults. (b) Whisker plots for fracture frequency in the Opalinus Clay (P32 values, see Section 4.3). Boreholes are arranged from W to E. Note that no box or whisker plots are shown for boreholes STA3, STA2, BUL1, MAR1 and TRU1, indicating that at least 95% of the sampling intervals (15 cm length) are devoid of any fractures (excl. drilling-induced fractures). The box extents to the 5% and 95% percentiles and the red line represents the median, while the blue marker depicts the mean of the distributions.
The outcrop-scale faults are characterised by strong heterogeneity, both in terms of width but also in terms of disturbance and accommodated deformation. Multiple micro faults often form an anastomosing network, also containing less deformed rock volumes. Similar fault geometries are also observed in the fairly wide deformation zones observed in triaxial testing at low strain (Fig. 5‑32), with increasing strain leading to stronger rotation of bedding, fragmentation of the rock and potentially scaly clay and fault gouge along several slip surfaces (e.g. Laurich et al. 2014, 2018, Winhausen et al. 2022).
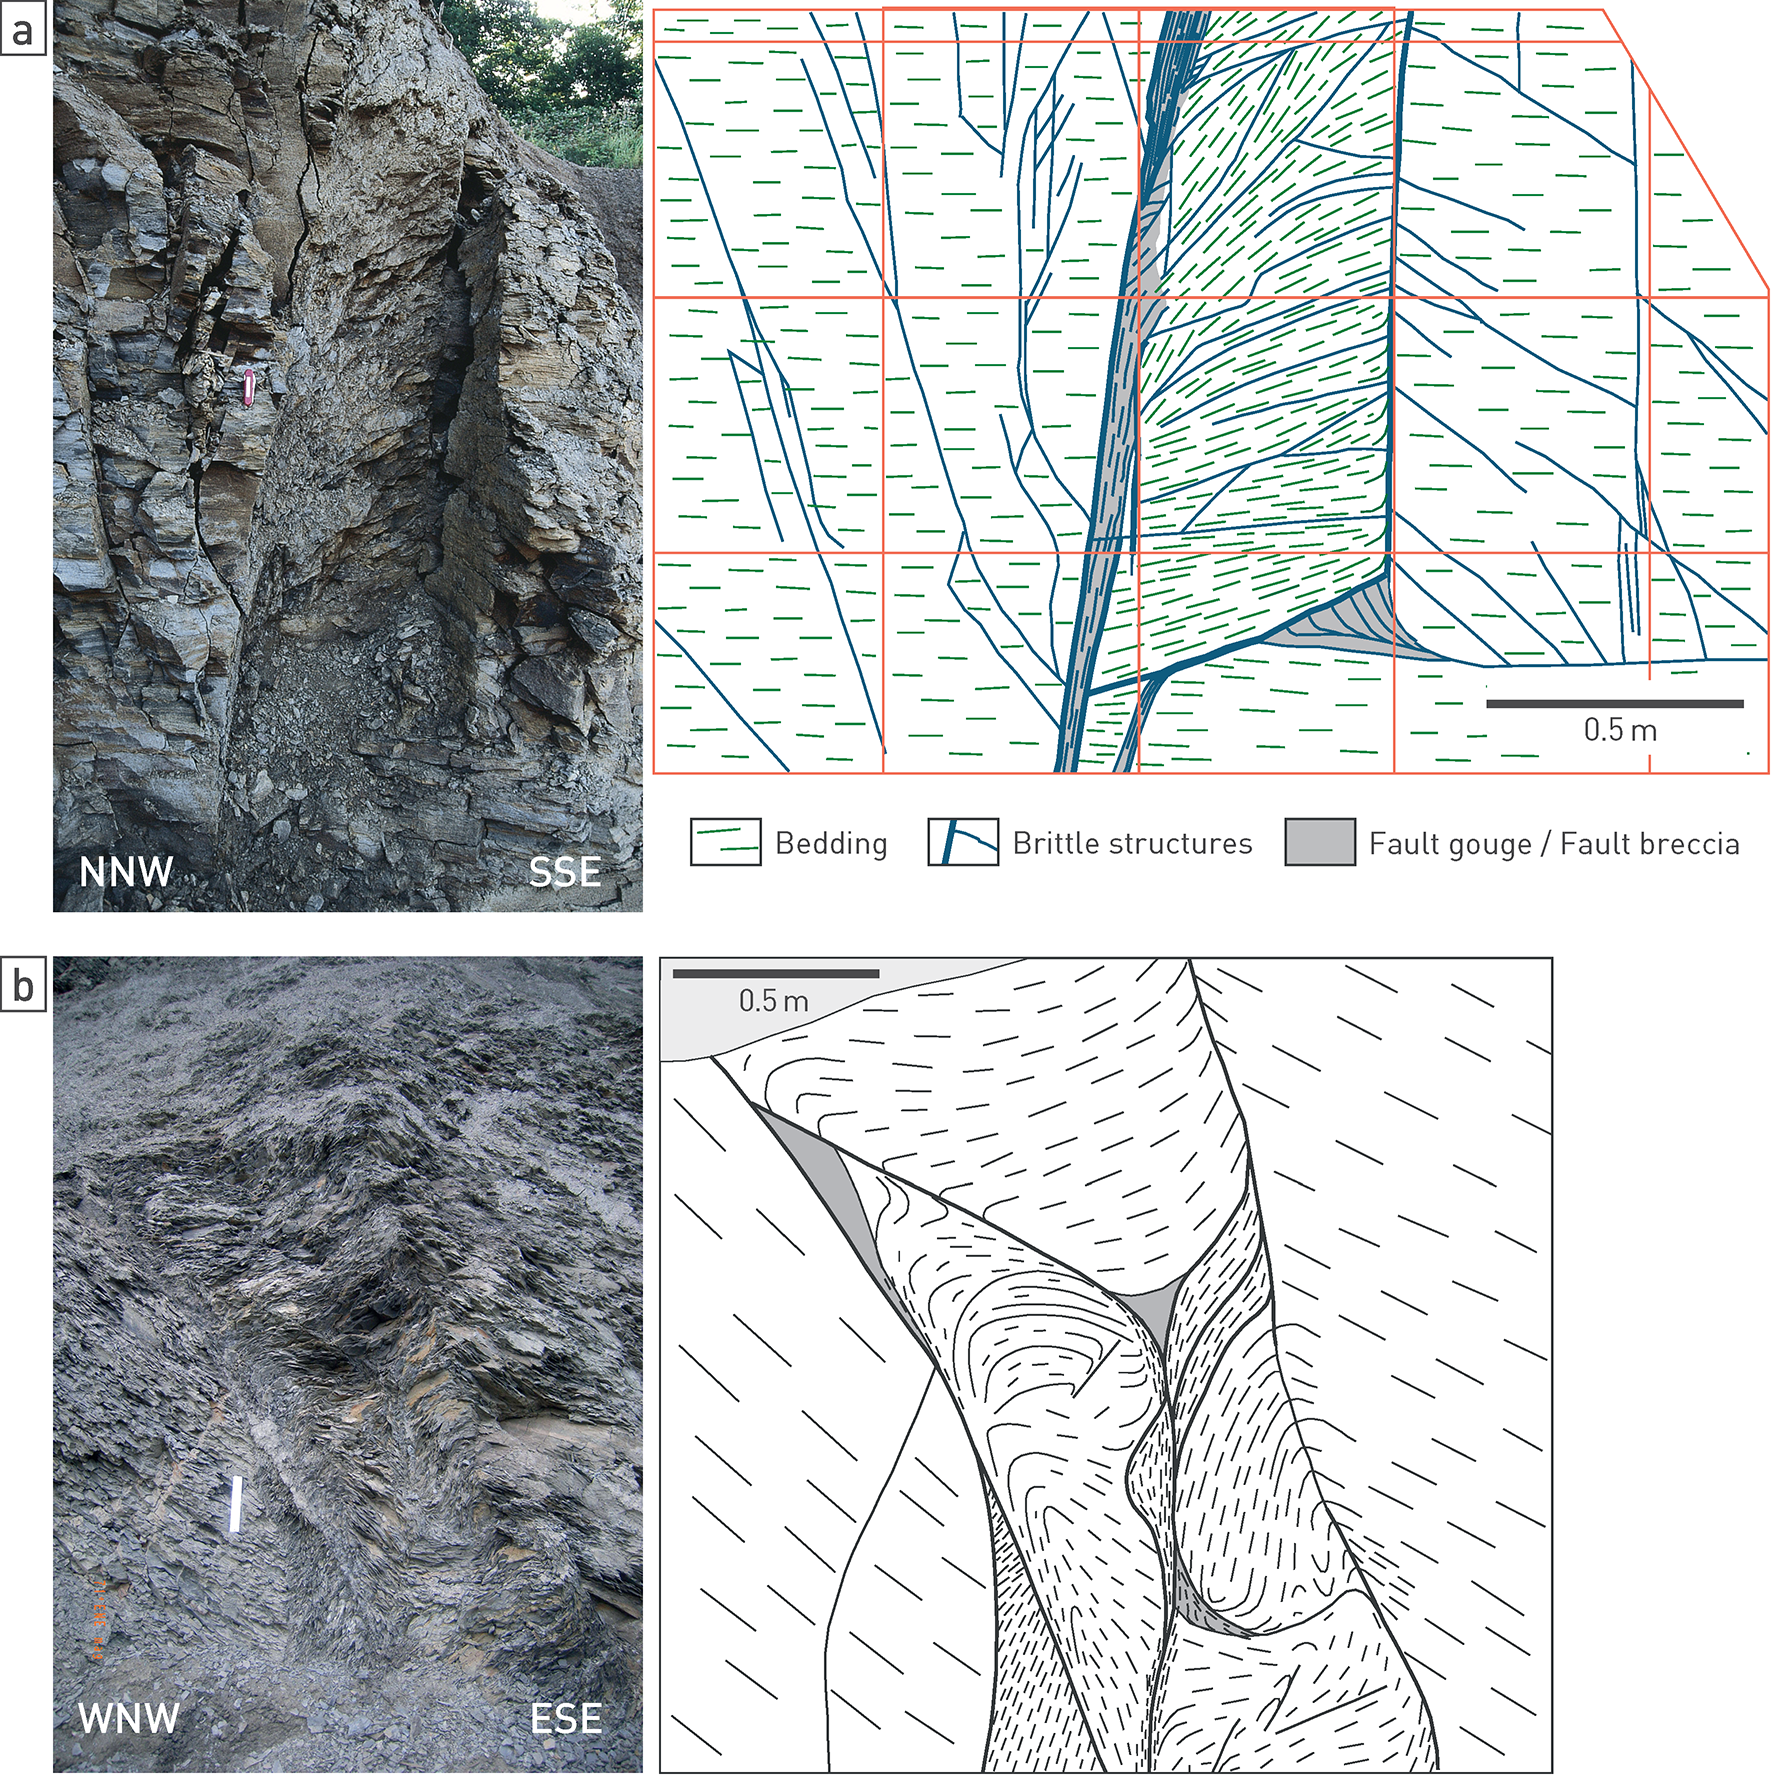
Fig. 5‑33:Outcrop examples of fault structures in the Opalinus Clay
(a) Normal fault in a quarry near Siblingen, close to ZNO (Nagra 2002). (b) Thrust fault in a quarry near Holderbank, close to JO (Giger & Marschall 2014). Note: friable rock structure is affected by surface effects (swelling, drying, weathering) and not representative of in-situ conditions.
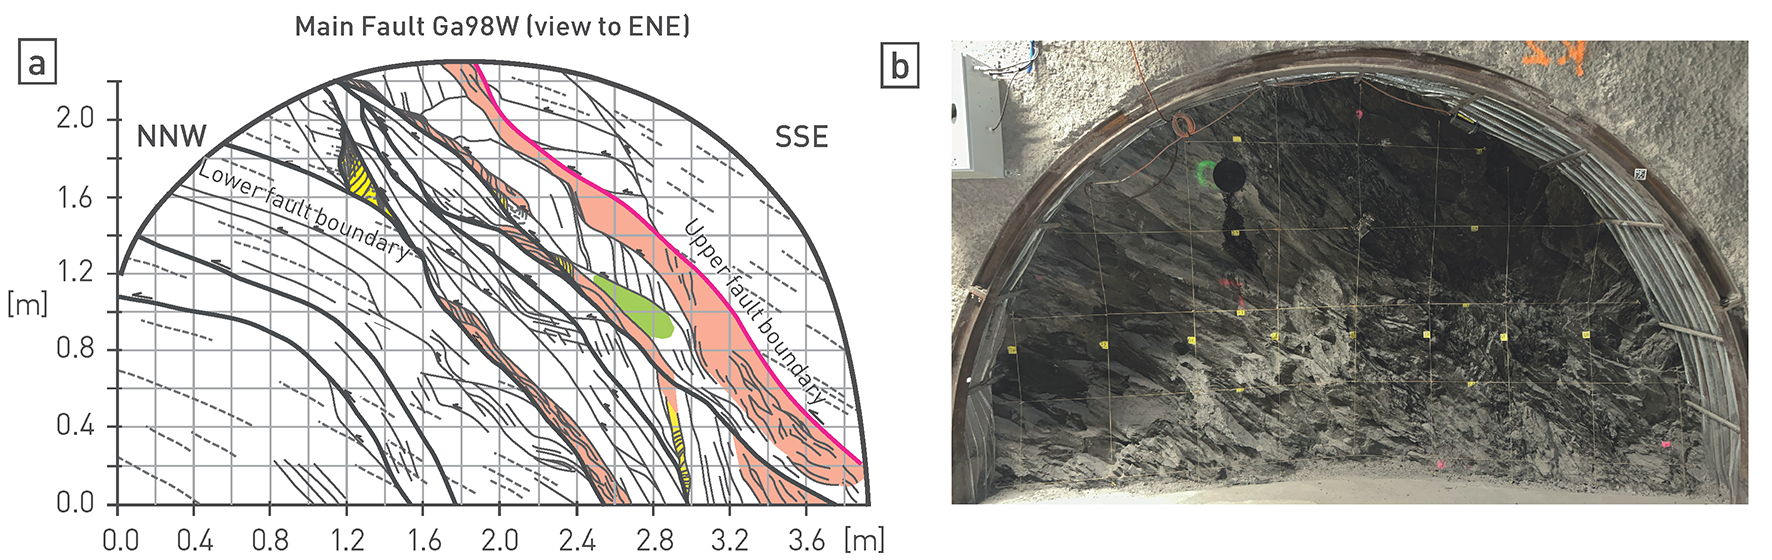
Fig. 5‑34:Example of the "Main Fault" in the Opalinus Clay at the Mont Terri rock laboratory
a) Interpretation according to Jaeggi et al. (2017). b) Photograph.
The strong variability in the degree of deformation in the Opalinus Clay is typical for so-called soft-linked sediments (e.g. Dahlstrom 1969, Walsh et al. 1999, Fossen & Rotevatn 2016). Based on vintage 3D seismic reflection data from ZNO, Roche et al. (2020) interpreted fault segmentation not only along strike, but also vertically across the Opalinus Clay in the Wildensbuch Flexure (Fig. 5‑35 and Section 4.3.4). Localised deformation was found to be more partitioned across the Opalinus Clay, partly accommodated by folding. Similar observations are made from the Mont Terri rock laboratory (Fig. 5‑34), where the "Main Fault" is segmented along strike (e.g. Jaeggi et al. 2017) and also in a vertical direction, as drilling experience in various experiments has shown. Partitioning of deformation by segmentation and soft-linkage thus reduces offsets along individual fault segments and affects the vertical connectivity of the segments. Overall, the segmentation hinders fault continuity and connectivity, and consequently also fault-related flow.
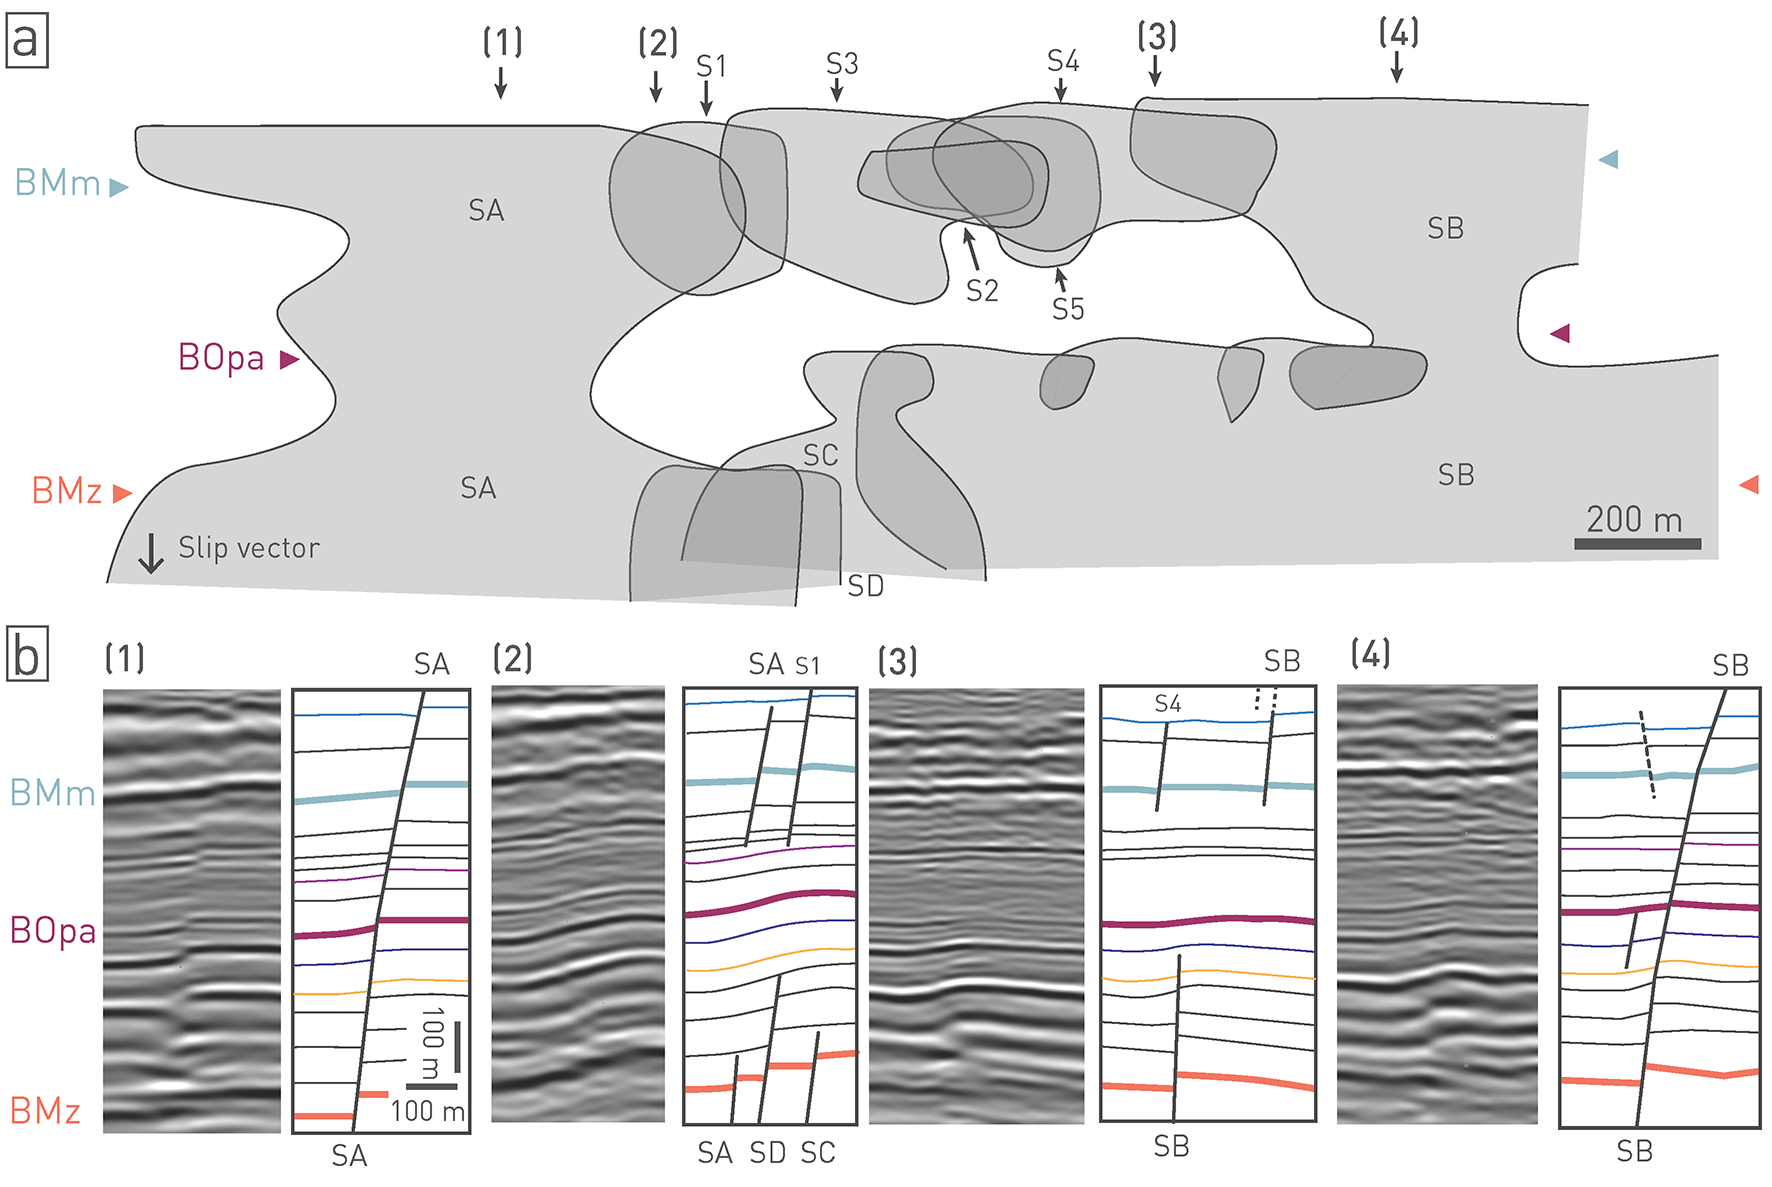
Fig. 5‑35:Fault architecture of a seismically mappable fault (Wildensbuch Flexure in ZNO)
(a) Strike projection of the Wildensbuch Flexure (see also Section 4.3.4) with fault surfaces represented in grey. (b) Four seismic sections and their interpretations at the locations indicated in (a). BMm: Base Malm Group, Bopa: Base Opalinus Clay, BMz: Base Mesozoic unconformity. SA-SD and S1 to S5 indicate distinct fault segments. In sections (1) and (4) faults are continuous across the Opalinus Clay, whereas in sections (3) and (4) they are interpreted to be discontinuous at the seismic scale. Slightly modified after Roche et al. (2020).
Recent trenching and outcrop mapping around Frick (JO siting region) focused first on the Opalinus Clay in the Cheesleten quarry, but no tectonic fault could be mapped. However, in the nearby Gruhalde quarry, a normal fault in the underlying Staffelegg Formation was exposed. An offset between 1.5 to 2.5 m in two mechanically contrasting lithologies (the Beggingen Member and the Frick Member) is interpreted (Fig. 5‑36, see also Fig. 4‑25). In the fossiliferous limestones of the Beggingen Member, the fault is discrete, but then splays off into the mechanically softer and weaker clay-rich rocks of the Frick Member. The trench mapping highlighted that as the fault propagates into softer rock, the strain becomes more distributed. Softer rocks deform more easily and can accommodate strain over a larger area. The Frick Member is considered here as an analogue of the Opalinus Clay, where similar dispersion of strain accommodation is also indicated at the seismic scale in the siting regions (Nagra 2024a, 2024b, 2024c).
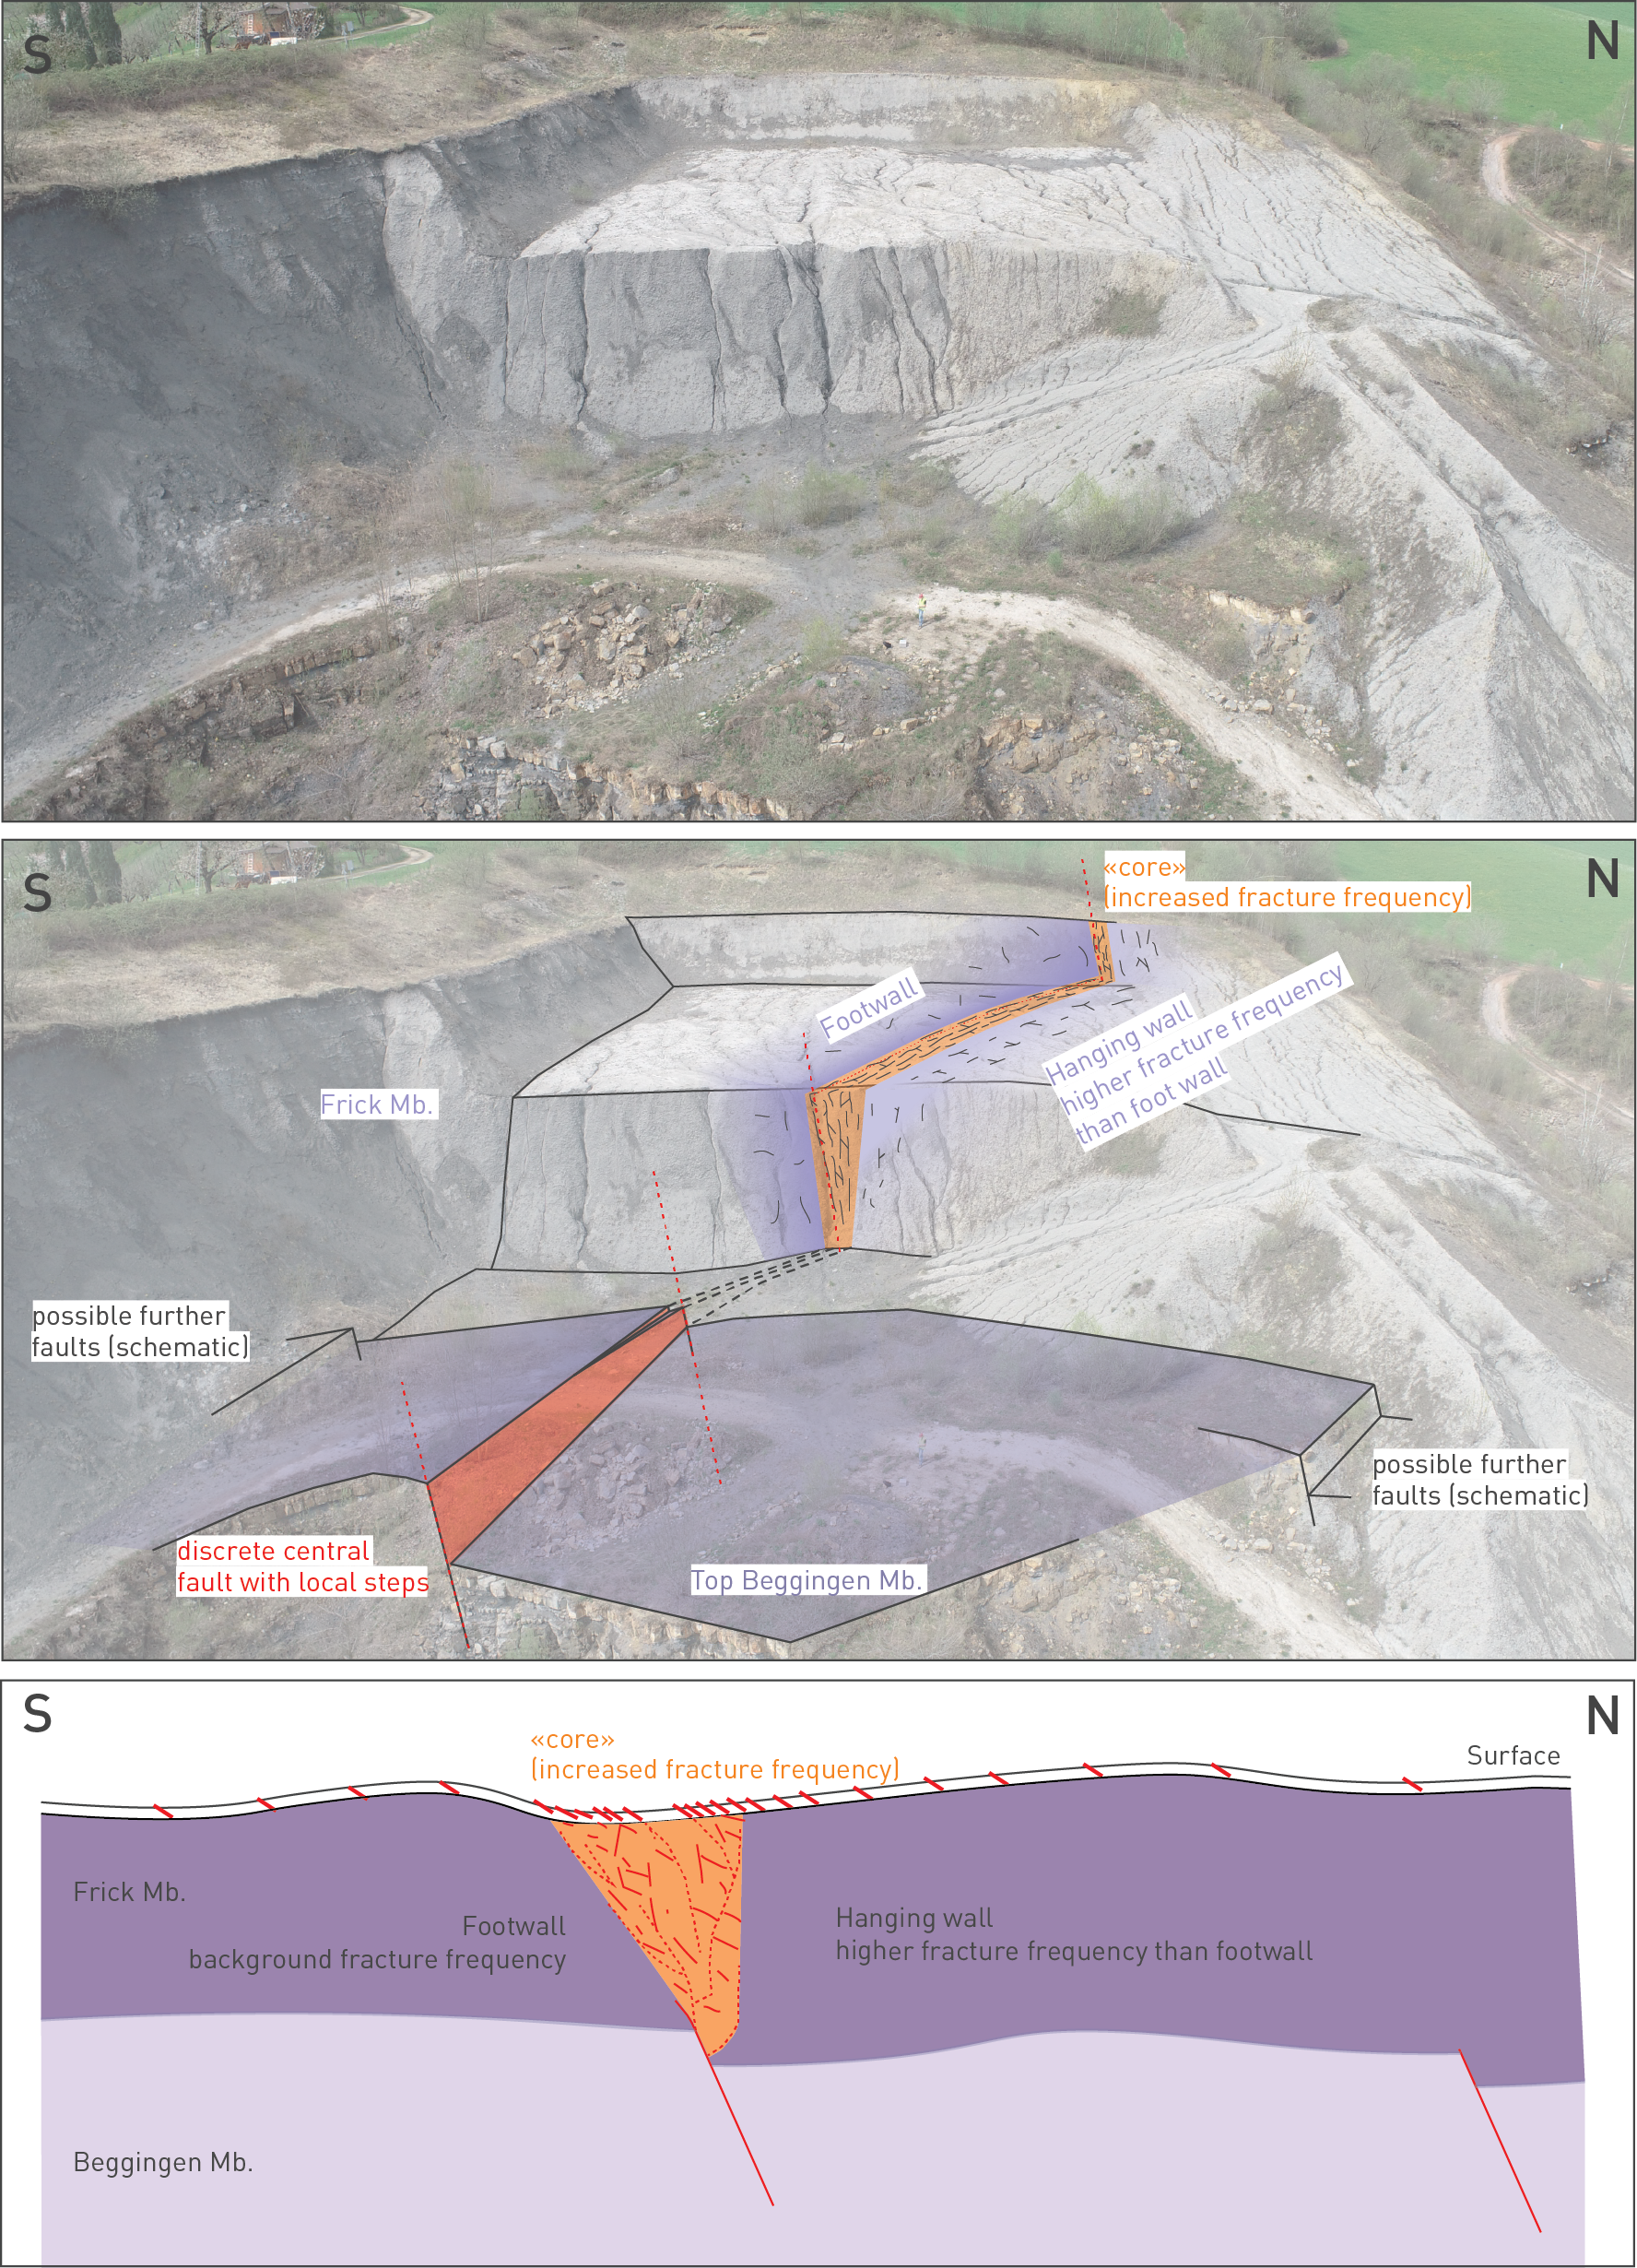
Fig. 5‑36:Synthesis of trench mapping exposing fault propagation across mechanical layering
Highlighting the difference in strain accommodation between the Beggingen Member and the clay-mineral-rich Frick Member (Gruhalde quarry near Frick, Canton Aargau).
The constitutive behaviour of the Opalinus Clay is well understood. Geomechanical properties and volumetric ("swelling") behaviour are particularly favourable for self-sealing (Section 5.7).
The Opalinus Clay exhibits comparable mechanical properties in the three siting regions, but peak strengths are clearly different from the shaly facies of the Mont Terri rock laboratory. The different burial history (greater burial depth and lower tectonic overprint) has led not only to higher overall strength than in Mont Terri, but also to a lower variability.
Deformation tests with the Opalinus Clay and confining units, as well as aquifer limestones, are consistent with observed effects of mechanical layering (Sections 4.3 and 4.4) and highlight that fracturing has a much greater effect on the more competent rocks than for the Opalinus Clay.
Deformation in clay-rich rocks is typically expressed by more distributed strain and step-overs in contrast to more localised discrete strain accommodation in stiffer units.
Segmentation of fault structures in the Opalinus Clay is expected to hinder fault-related flow.
Key points:
- Hydraulic conductivity of the Opalinus Clay is very low and shows only little scatter. There is no relevant difference between the siting regions related to the different depth.
- The Opalinus Clay hydraulic conductivities from in-situ packer testing are in the same range as lab-tests on drill cores. That is, the tested faults do not act as preferential flow paths.
- The highest observed fault transmissivity at relevant depth in Northern Switzerland of
1 × 10-11 m2/s is from a prominent thrust zone in the Schafisheim borehole outside the siting regions. - Hydraulic conductivity in the confining units is also low but can be several orders of magnitude higher than in the Opalinus Clay. There is no indication of elevated matrix conductivities related to hard beds in the Lias Group – Dogger Group section.
- Formation hydraulic heads in the Opalinus Clay are affected by transient processes which are indicative of very low hydraulic conductivities.
The hydraulic barrier is ensured by low hydraulic conductivities, resulting in small water fluxes and low advective velocities. Very low hydraulic conductivities indicate mass transport dominated by molecular diffusion.
This section presents direct evidence on hydraulic properties. This includes laboratory tests on drill core samples (cm – dm scale) and in-situ hydraulic packer tests (metre to decametre scale). These are discussed in relation to rock mineralogy, porosity and structural inventory, and are complemented by observations from underground laboratories and tunnels.
Note that independent evidence on the hydraulic barrier effect such as natural tracers in porewater is presented in Section 4.6.
Hydraulic tests on core samples have the advantage that effective stresses can be controlled, and the matrix properties can be related to a measurable mineralogy or porosity. A variety of methods such as constant head tests, consolidation theory (oedometer) and advective displacement with sample dimensions in the range of 1 to 10 cm were applied and provide an overall consistent picture (see Dossier IX of TBO reports in Tab. 2‑1 and Waber 2020).
The matrix hydraulic conductivities perpendicular to bedding scatter over a relatively narrow range around 10-13 m/s (Fig. 5‑37). There is no obvious correlation between hydraulic conductivity and mineralogy or porosity. Given the substantial lithological variability, this can be taken as an indication that diagenetic cementation of clay-poor samples is the cause for the low hydraulic conductivities. Note that a similar trend is observed by an in-depth interpretation of the in-situ hydraulic packer test dataset, for example the existence of a negative correlation between the measured bulk hydraulic conductivities with the carbonate content in the Passwang Formation in JO and the Wedelsandstein Formation in ZNO and NL (Nagra 2024m). The hydraulic packer test results in the latter formations also indicate that quartz and feldspar-rich layers that are poor in carbonates could show slightly enhanced matrix hydraulic conductivities (Nagra 2024m).
The systematic comparison of tests parallel and perpendicular to bedding on the centimetre-scale samples did not show a meaningful hydraulic anisotropy of the Opalinus Clay. Anisotropy depends on the scale of observation and the centimetre-scale samples are too small to directly derive formation-scale anisotropy. However, the dataset can be used for a geostatistical evaluation of equivalent horizontal and vertical hydraulic conductivities. The result indicates an anisotropy (Kh/Kv) ratio of ca. 5 (best estimate; Nagra 2024m).
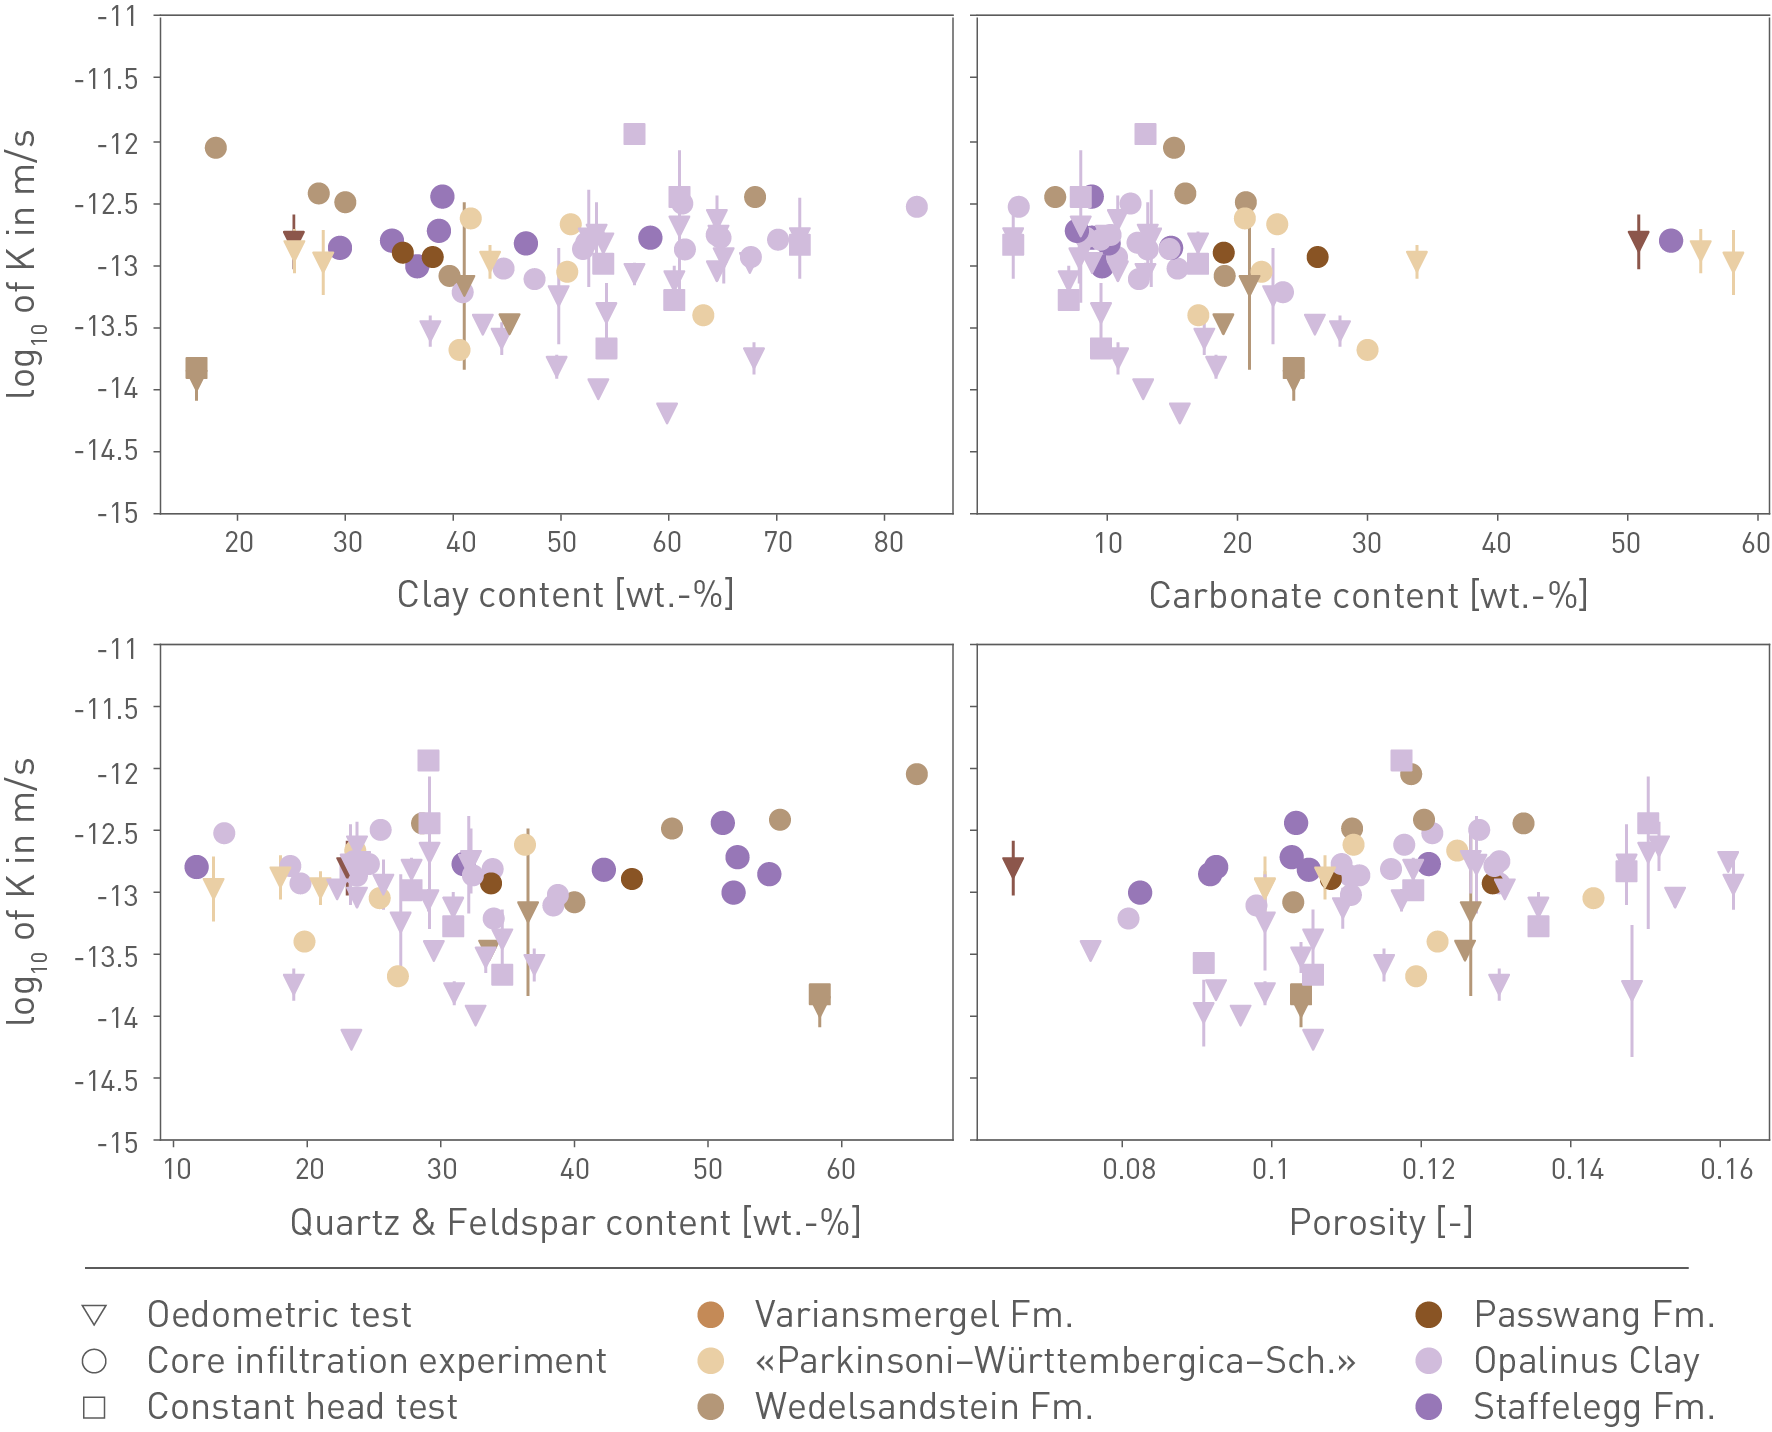
Fig. 5‑37:Matrix hydraulic conductivity of the Opalinus Clay and clay-mineral-rich confining units as a function of mineral composition and porosity
All measurements were done with flow perpendicular to bedding. The figure displays the results of different test types. For the oedometric tests, the error bars show the range of measured hydraulic conductivities over a spectrum of effective stress representative for in-situ conditions (Dossier IX of TBO reports, see Tab. 2‑1). The data shown are from the TBO boreholes plus Benken and Schlattingen-1 boreholes. The few drill core samples tested perpendicular to bedding, whose mineralogy and porosity are not available, show hydraulic conductivities scattering between 1 × 10-15 and 2 × 10-13 m/s.
In-situ hydraulic packer tests provide the transmissivity of the tested interval (length: several metres to a few decametres). This includes the contribution of the matrix and all discontinuities such as faults and joints in the test interval. The test data can be recalculated to average horizontal hydraulic conductivities.
A comprehensive and robust database for the hydraulic properties is available from Nagra’s investigations in the siting regions as well as from earlier investigation programmes, from the Mont Terri rock laboratory and from third party investigations.
Hydraulic properties are known to depend on overburden (stress). In the case of the overconsolidated Opalinus Clay, high values up to ca. 10-4 m/s are observed only in the uppermost decametres (Fig. 5‑38) because of rock weathering and decompaction, as evidenced by the Lausen case study (Vogt et al. 2016, Mazurek et al. 2017) or the study of Hekel (1994). With increasing depth, the values decrease by several orders of magnitude, e.g. in the Mont Terri rock laboratory typical values are in the range of 1 × 10-12 to 1 × 10-13 m/s (see also Nagra 2014f). The best estimates of the hydraulic conductivities from hydraulic packer tests carried out in the JO, NL and ZNO boreholes plot in a narrow range, namely from 1 × 10-13 to 1 × 10-14 m/s. With this overburden thickness, no depth dependence is apparent (Fig. 5‑38), i.e. the hydraulic properties of the Opalinus Clay are considered to be identical among the siting regions.
The hydraulic conductivities from the in-situ tests agree with the properties derived from the tests on drill core samples (see Section 5.6.2). In addition, there is a trend of a linear increase of the interval transmissivity with increasing test interval length, despite the possible presence of faults (Fig. 5‑39). This indicates comparably homogeneous behaviour and shows that lithological variability, and in particular faults, have no major impact on hydraulic conductivity.
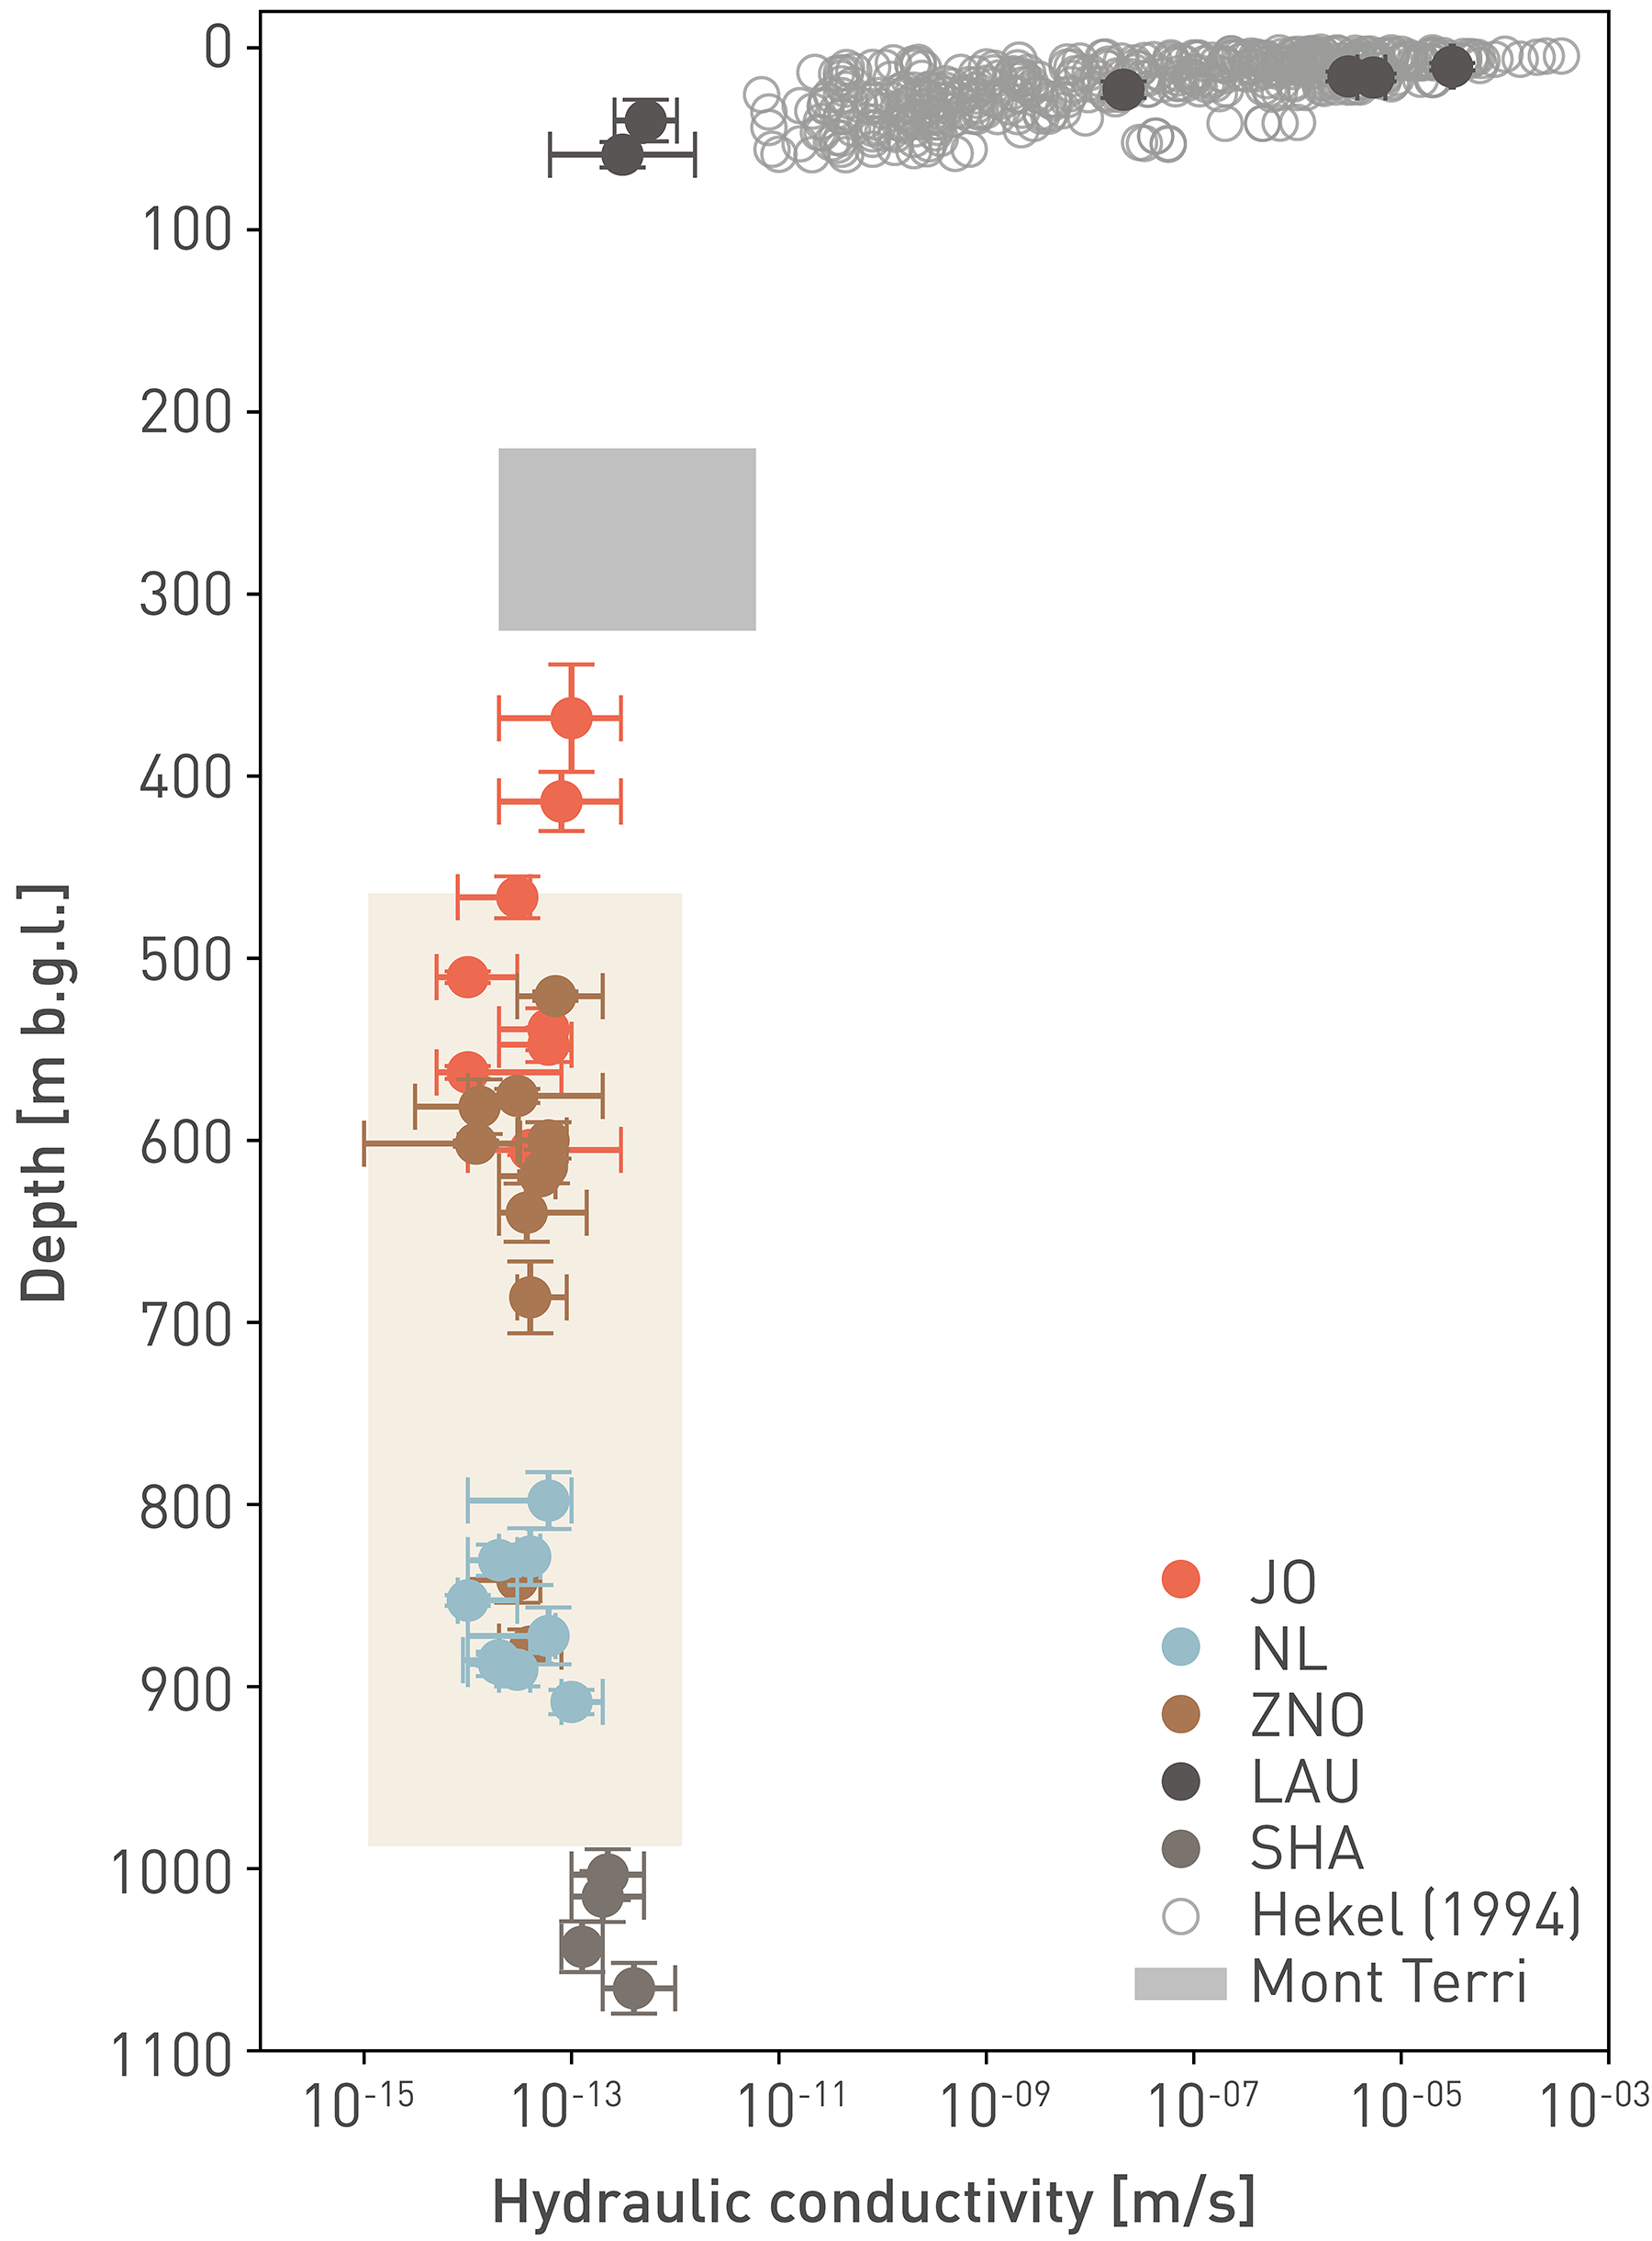
Fig. 5‑38:Hydraulic conductivities of the Opalinus Clay as a function of depth
The beige zone indicates the range of hydraulic conductivities from lab tests on drill core samples performed parallel and perpendicular to bedding. The data range from Mont Terri is from Gautschi (2017). Fig. 6‑46 illustrates the dataset at small overburden thickness in detail.
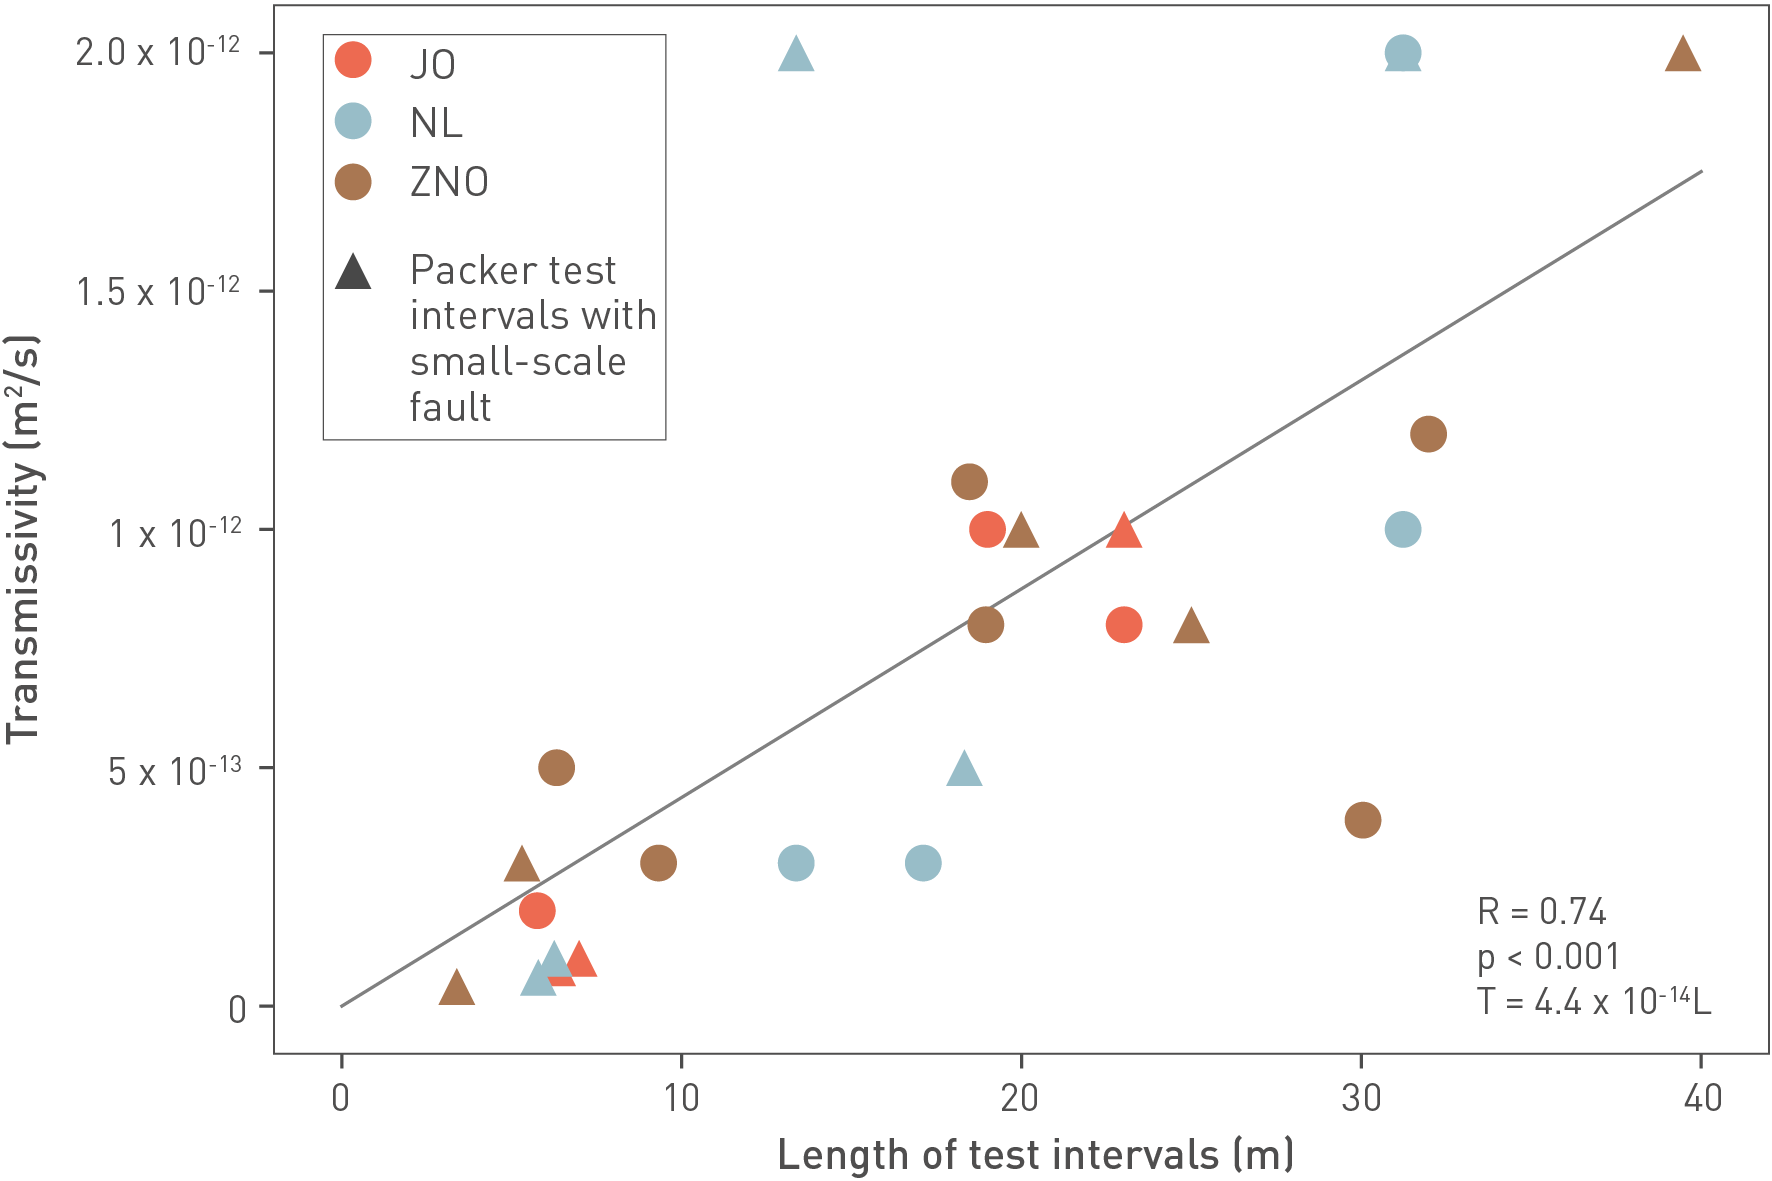
Fig. 5‑39:In-situ test best estimate transmissivities of the Opalinus Clay derived from hydraulic packer tests as a function of the length of the test intervals
The figure shows data from the TBO boreholes plus the Benken borehole, which were tested using a similar state-of-the-art approach. "R" refers to the Pearson correlation coefficient of the regression line, "p" refers to the p value, "T" refers to the transmissivity, and "L" refers to the length of the test interval. The low calculated p value (< 0.001) indicates there is a statistically significant linear relationship between the transmissivity and the length of the test intervals. The bandwidth of the transmissivities is typically within an order of magnitude around the best estimate.
During the TBO campaign, hydraulic testing of fractures (faults, joints) was a primary target in all boreholes. The maximum transmissivities of the fractures can be estimated from the test results assuming one such discontinuity per interval. The histogram of the transmissivities shows generally low values of approximately 1 × 10-12 m2/s ± one order of magnitude (Fig. 5‑40). The maximum value of 10-11 m2/s is from a long test interval at the base of the Opalinus Clay in the Schafisheim (SHA) borehole. This interval includes a major fault zone related to the folding and thrusting of the Jura mountains – such structures are absent in the siting regions. In the BAC1 borehole, a test on a small-scale fault indicated 2 × 10-12 m2/s (Fig. 5‑39). To summarise, fractures in the Opalinus Clay in the siting regions under present-day stress conditions have low transmissivity and are not considered to be preferential flow paths. This can be explained with the deformation and self-sealing behaviour (Sections 5.5 and 5.7).
The low hydraulic conductivity of the Opalinus Clay can also be well justified by comparison with international examples (Fig. 5‑41). The values are of the same order of magnitude as in other clay-rich rocks of comparable porosity. The Opalinus Clay hydraulic conductivity is lower than in the high-porosity soft clays and lower than in highly indurated brittle clays.
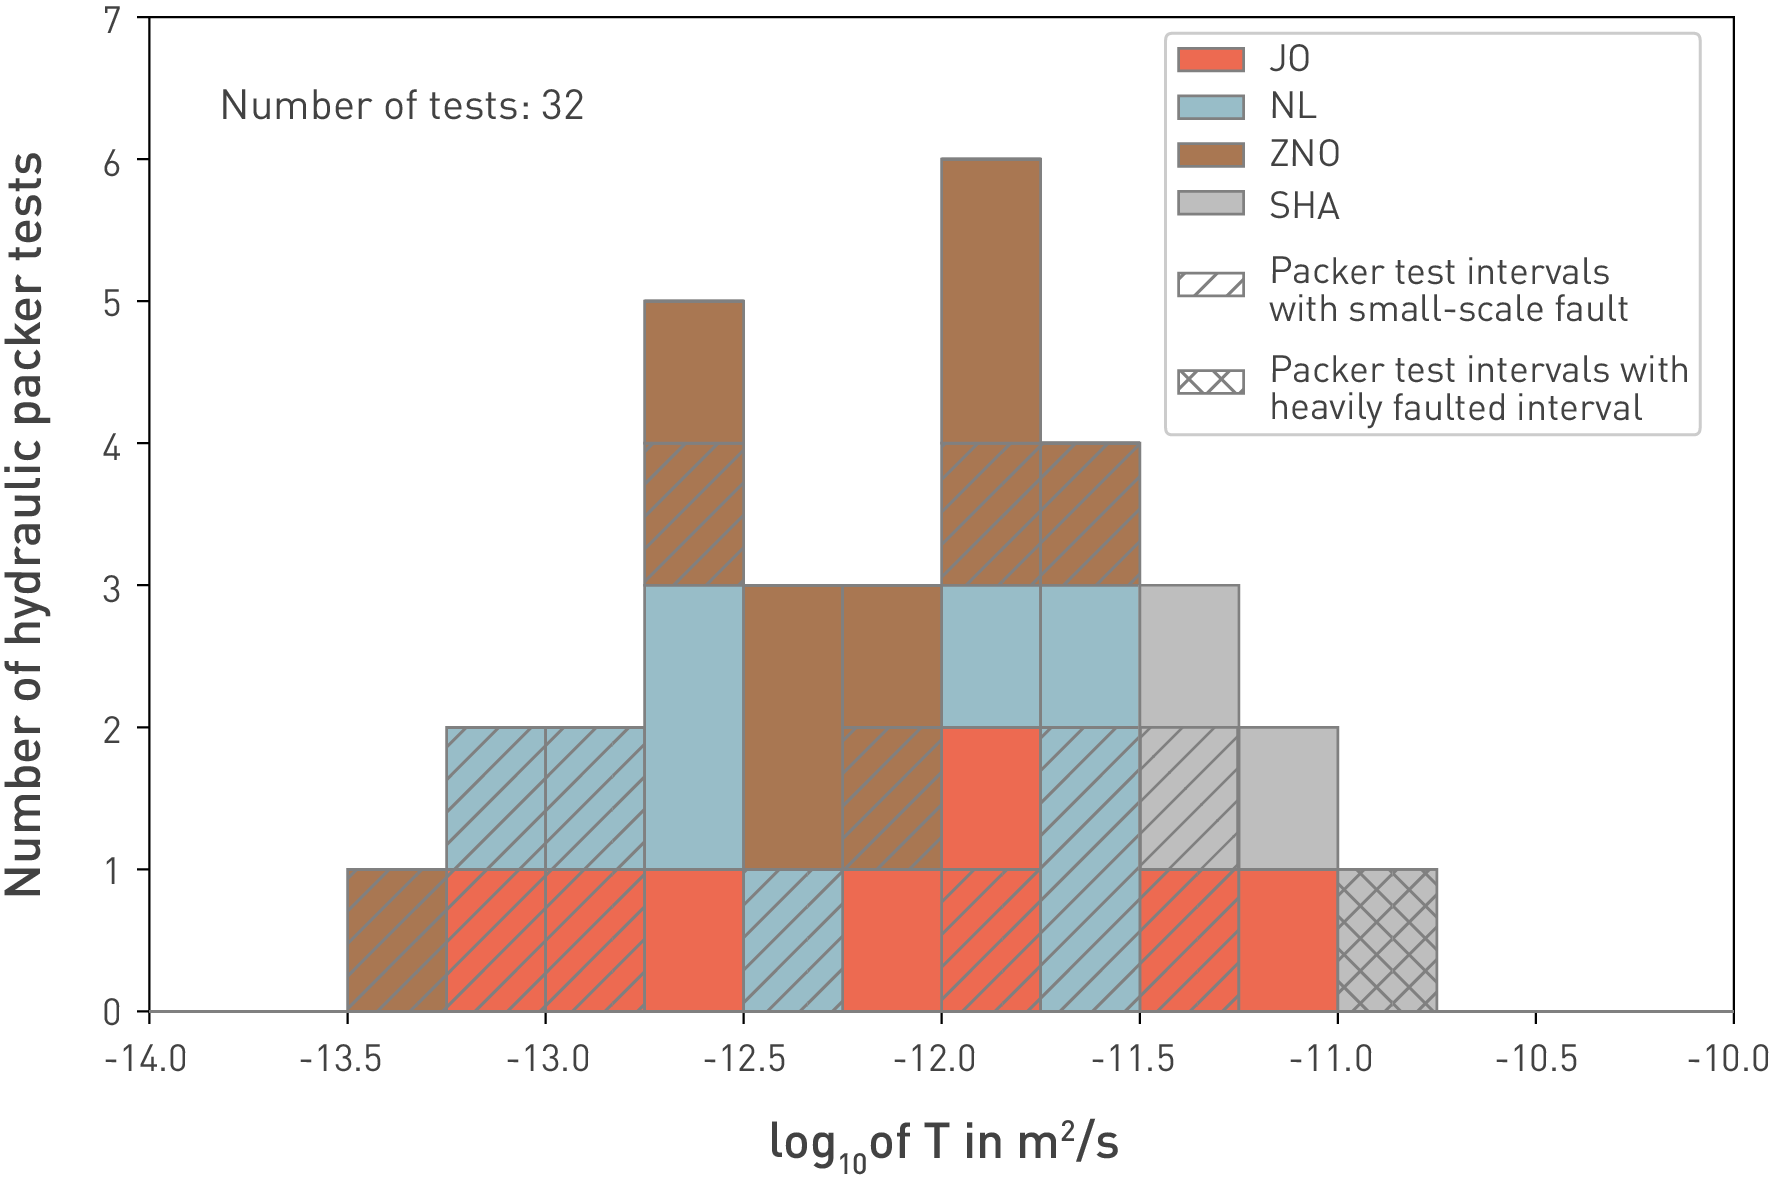
Fig. 5‑40:Distribution of the logarithm of the best estimate of the in-situ hydraulic packer test transmissivities in the Opalinus Clay
The figure includes tests performed in the TBO boreholes plus the Benken (BEN) and Riniken (RIN) boreholes of the JO, NL and ZNO siting regions, and the tests in the Schafisheim borehole (SHA). Interval length of displayed tests varies between < 5 m and 60 m. Structural inventory of the BEN, RIN and SHA boreholes from Ebert (2014).
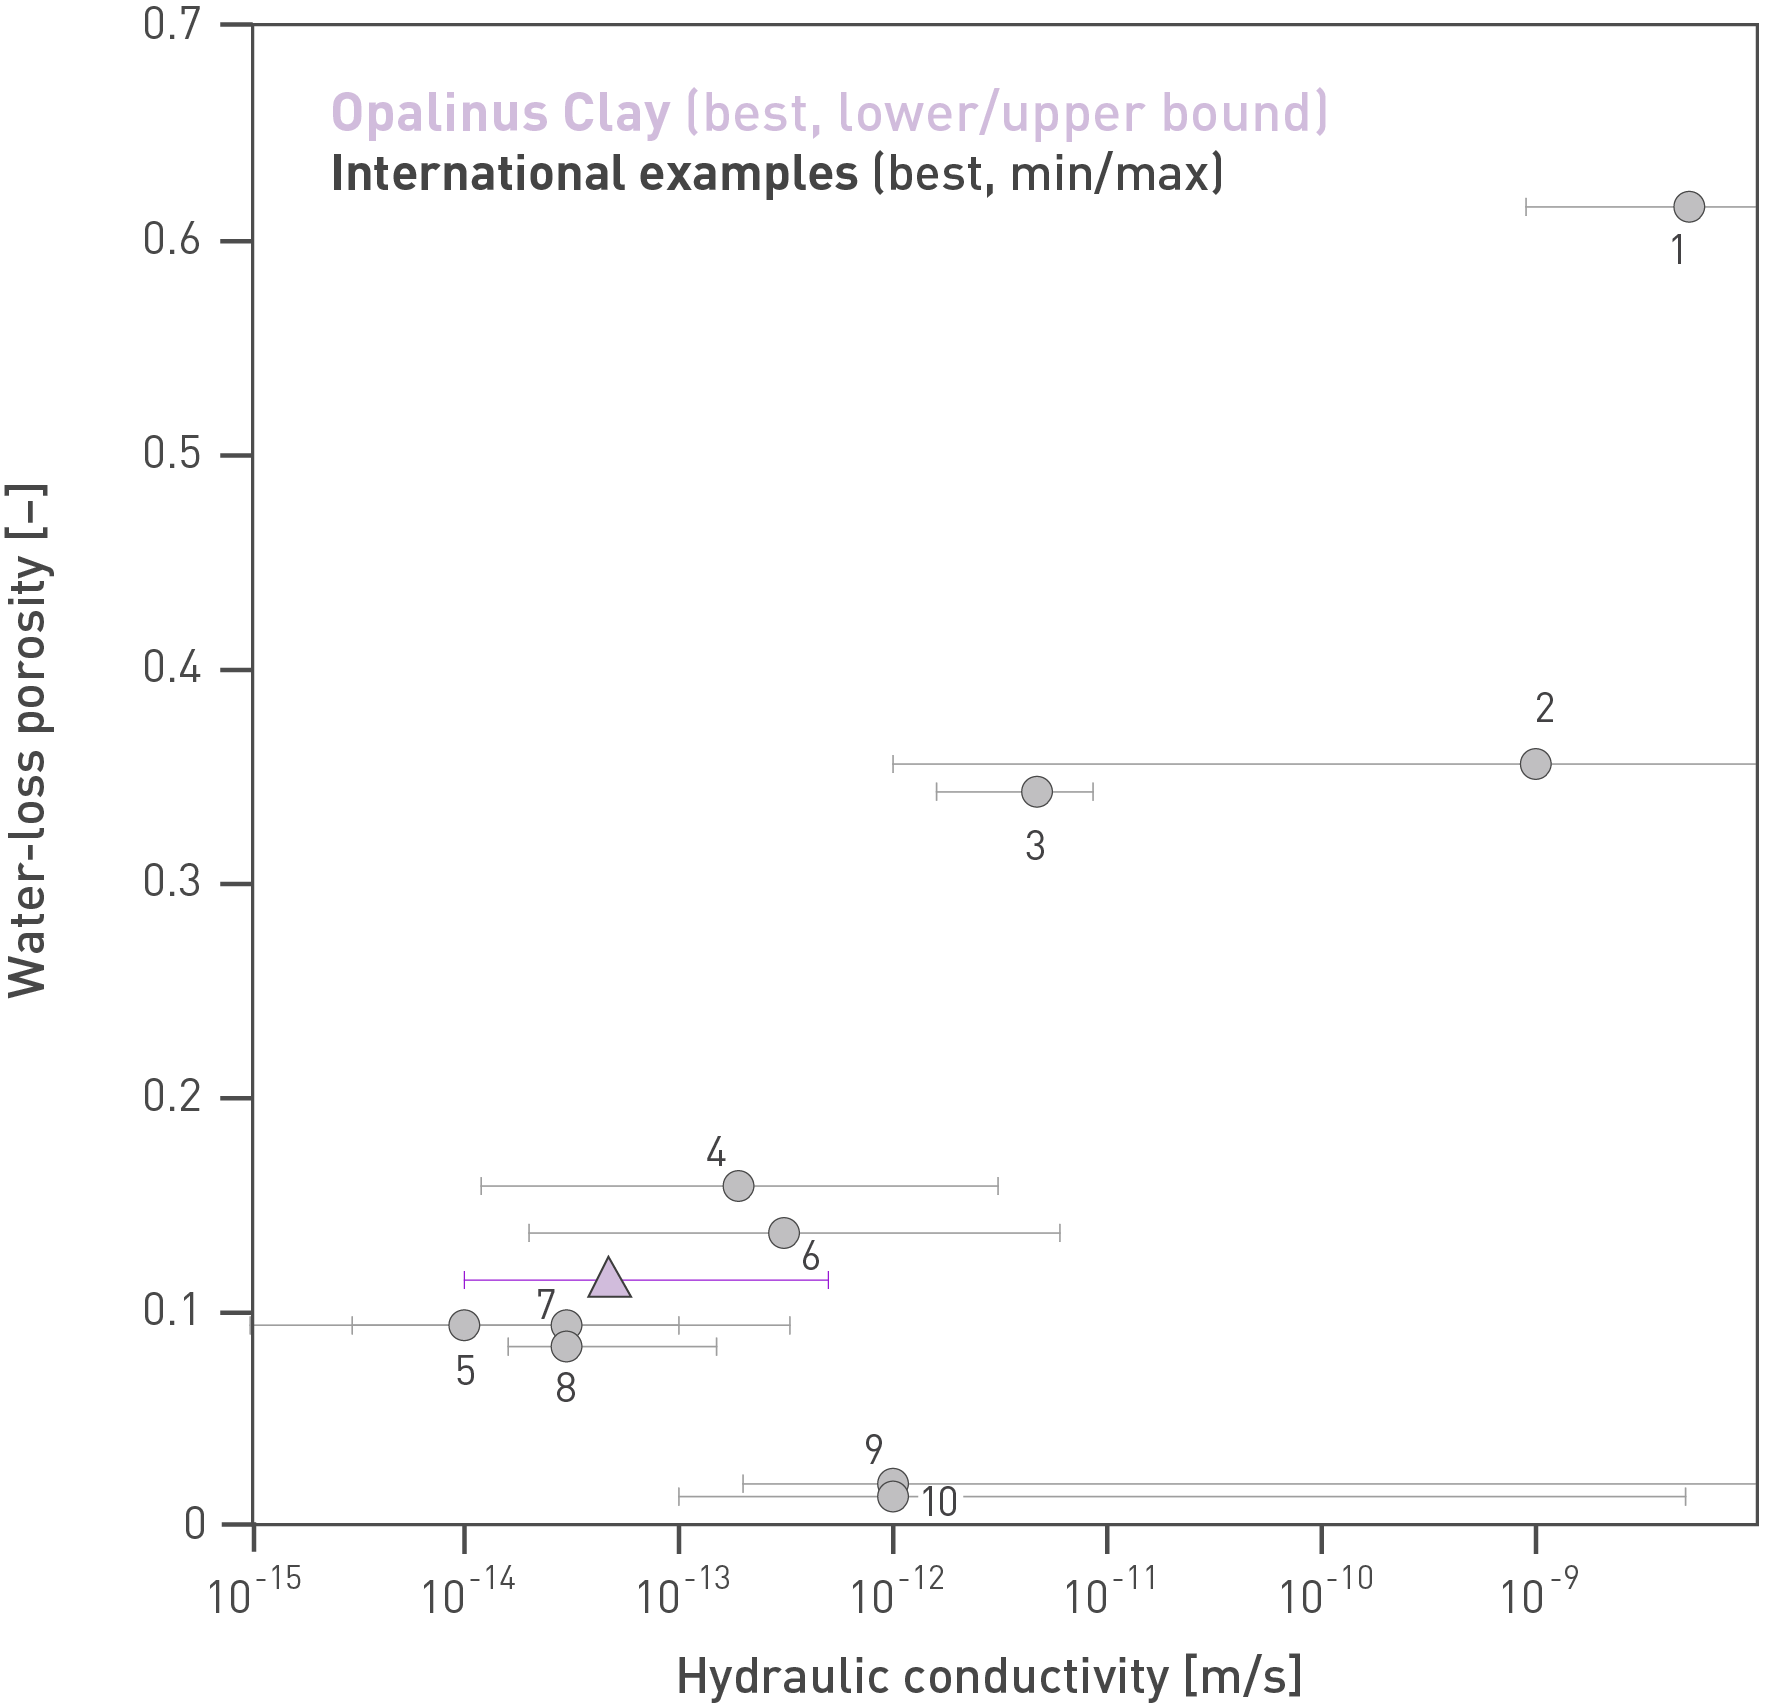
Fig. 5‑41:Comparison of the horizontal hydraulic conductivity of the Opalinus Clay with examples of clay-rich rocks worldwide
Opalinus Clay data based on Nagra (2024m). Values are plotted at best estimate water-loss porosity. International data are from the Clay Club Catalogue (OECD/NEA 2022). Points indicate best estimates, bars represent minimum and maximum values. 1: Koetoi Formation at Horonobe (JP, max. burial: 1'000 m), 2: Wakkanai Formation at Horonobe (JP, 1'200 m), 3: Boom Clay at Mol (B, 215 m), 4: Callovo-Oxfordian at Meuse/Haute Marne (F, porosity UA unit, 850 m), 5: Toarcian-Domerian at Tournemire (F, 1'300 m), 6: Opalinus Clay Mont Terri (CH, upper bound K from Gautschi 2017, 1'350 m), 7: Georgian Bay Formation at Bruce nuclear site (CDN, 1520 m); 8: Queenston Formation (CDN, 1'450 m), 9: Boda Claystone Formation, Gorica block (H, 4000 m); 10: Boda Claystone Formation, Boda block (H, 4'000 m). Max. burial depths as indication for consolidation (best estimates or average values).
A major effort was invested in the hydraulic characterisation of the confining units (see also Section 4.5.3). The in-situ hydraulic packer tests generally indicate hydraulic conductivities below 10-11 m/s and typical values around 10-13 m/s. The investigations do not provide evidence of significantly elevated matrix hydraulic conductivities in the confining units adjacent to the Opalinus Clay (Fig. 5‑37, Nagra 2024m). Therefore, the focus is on constraining the impact of fractures for different lithologies. As in previous reports (e.g. Nagra 2014f), the clay-mineral content of the units is used as a proxy for brittle behaviour and self-sealing potential and thus as an additional argument to constrain the hydraulic properties. This is done in two empirical approaches:
-
Evaluation of the hydraulic conductivity as a function of the clay-mineral content of the test interval: Given the lithological variability within the typical test intervals in the confining units, the data are displayed as a function of the lowest average clay-mineral content calculated over a 5 m window in the test intervals (Fig. 5‑42).
-
Evaluation of the hydraulic properties as a function of the thickness of the brittle, clay-poor units (i.e. clay-mineral content < 20 wt.-%; Fig. 5‑43).
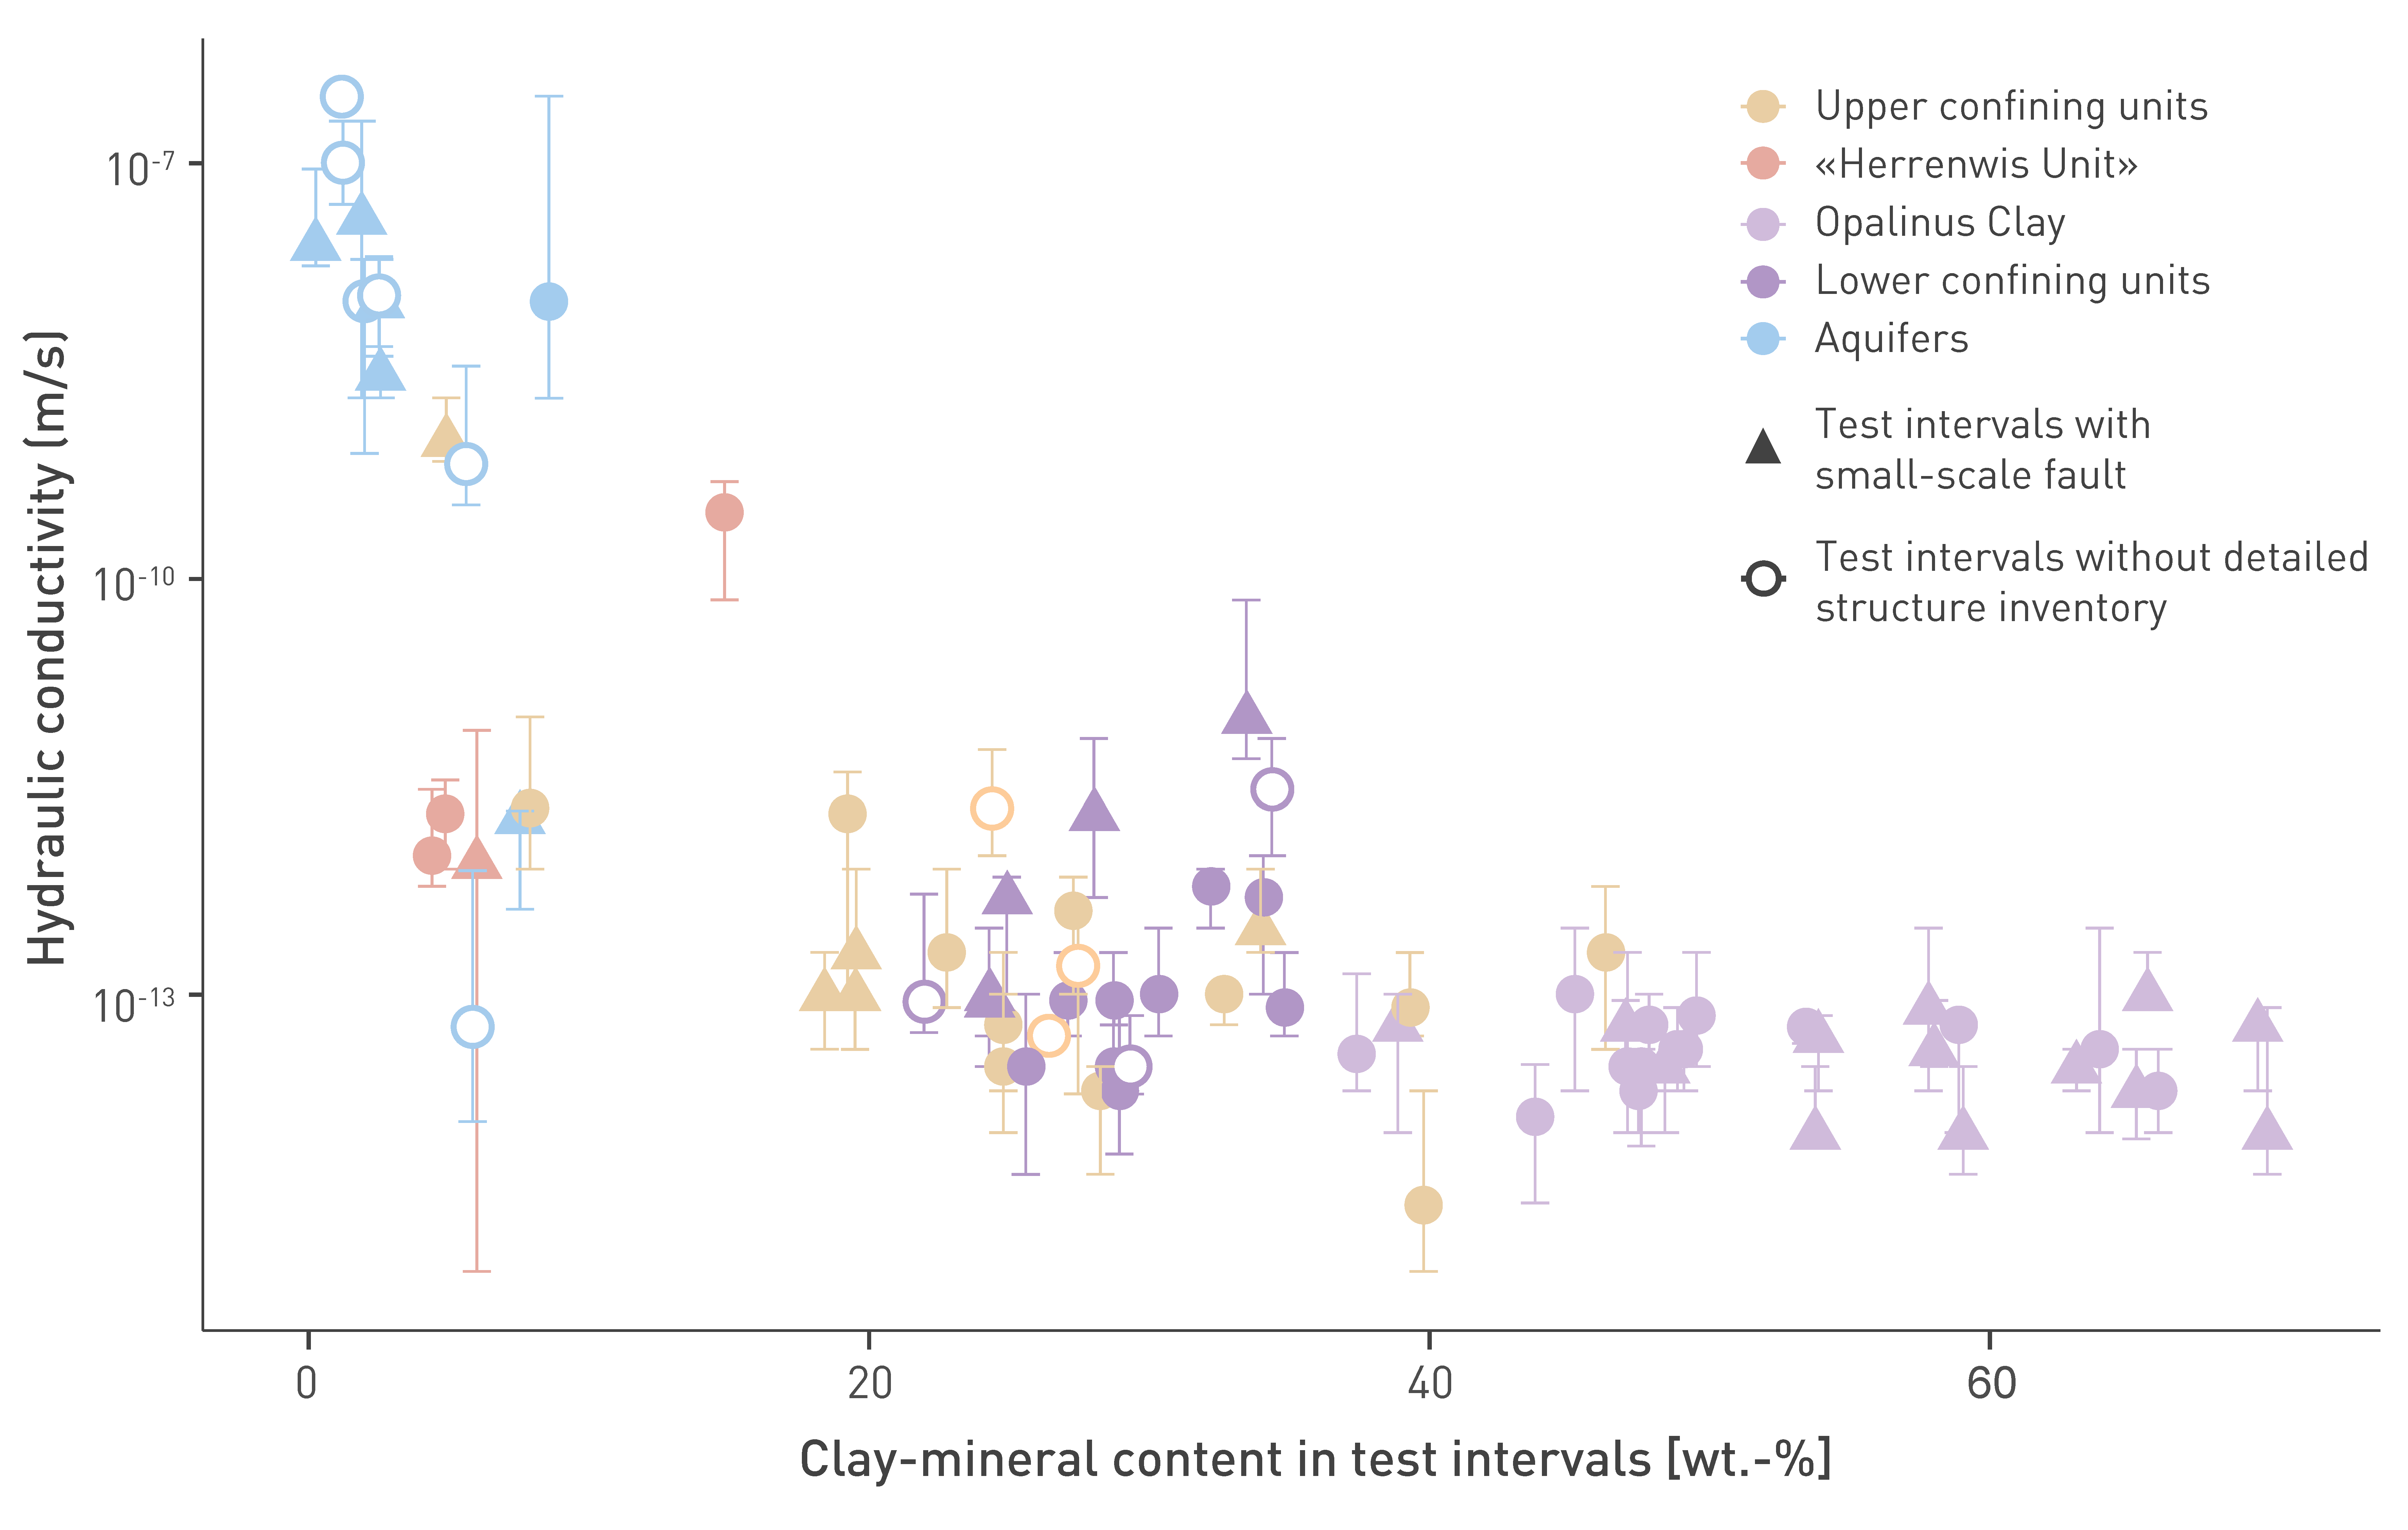
Fig. 5‑42:Hydraulic conductivity of the in-situ hydraulic packer tests as a function of the clay-mineral content of the test interval
The dataset includes packer tests from the base of the Lias Group to the top of the Malm Group in the TBO boreholes plus RIN, WEI and BEN. The dataset for the confining units is supplemented by data from the Malm and Hauptrogenstein aquifers. See text regarding calculation of clay-mineral content.
The highest hydraulic conductivity (1 × 10⁻⁹ m/s) encountered in the upper confining units was measured in the Wildegg Formation of the BOZ1 borehole. This test interval includes the Gerstenhübel Bed. A hydraulic conductivity of 3 × 10⁻¹⁰ m/s was measured in the «Herrenwis Unit» of the STA2 borehole in association with a subvertical joint.
The hydraulic test results show a good correlation with the clay-mineral content (Fig. 5‑42):
-
Intervals with clay-mineral contents above about 35 – 40 wt.-% have consistently low hydraulic conductivities – similar to the Opalinus Clay – of < 10-13 m/s, demonstrating that the variable tectonic overprint is not associated with elevated transmissivities. This group corresponds not only to the Opalinus Clay but also to clay-rich formations in the upper confining units such as the «Parkinsoni-Württembergica-Schichten» or the clay-rich facies of the Wedelsandstein Formation in NL.
-
Intervals with a minimum average clay-mineral content in the range of ca. 20 – 40 wt.-% are characterised by a somewhat larger scatter, while hydraulic conductivities remain in majority below 10-11 m/s, even for tests with tectonic overprint. This indicates a reduced but relevant self-sealing potential. The presence of thin hard beds in some test intervals has no visible impact on the measured transmissivities (Fig. 5‑43), reflecting their small fracture inventory and low porosities. In summary, units corresponding to this group with a minimum clay-mineral content of 20 wt.-% contribute significantly to the hydraulic barrier effect. This group comprises the majority of packer test intervals of the upper confining units (with the exception of the «Herrenwis Unit» and the Wildegg Formation) and all the tests in the lower confining units.
-
The group with minimum average clay-mineral contents below 20 wt.-% shows a broad range of hydraulic conductivities. Values greater than ca. 10-9 m/s refer to tests with a thickness of the clay-poor section of more than ca. 8 m (Fig. 5‑43). This latter group includes the Malm and Hauptrogenstein aquifers, fractured intervals of the «Herrenwis Unit» and the Wildegg Formation (e.g. Gerstenhübel Bed). In contrast, test intervals with thinner clay-poor layers display average hydraulic conductivities below 10-11 m/s (Fig. 5‑43) even in the presence of small-scale faults.
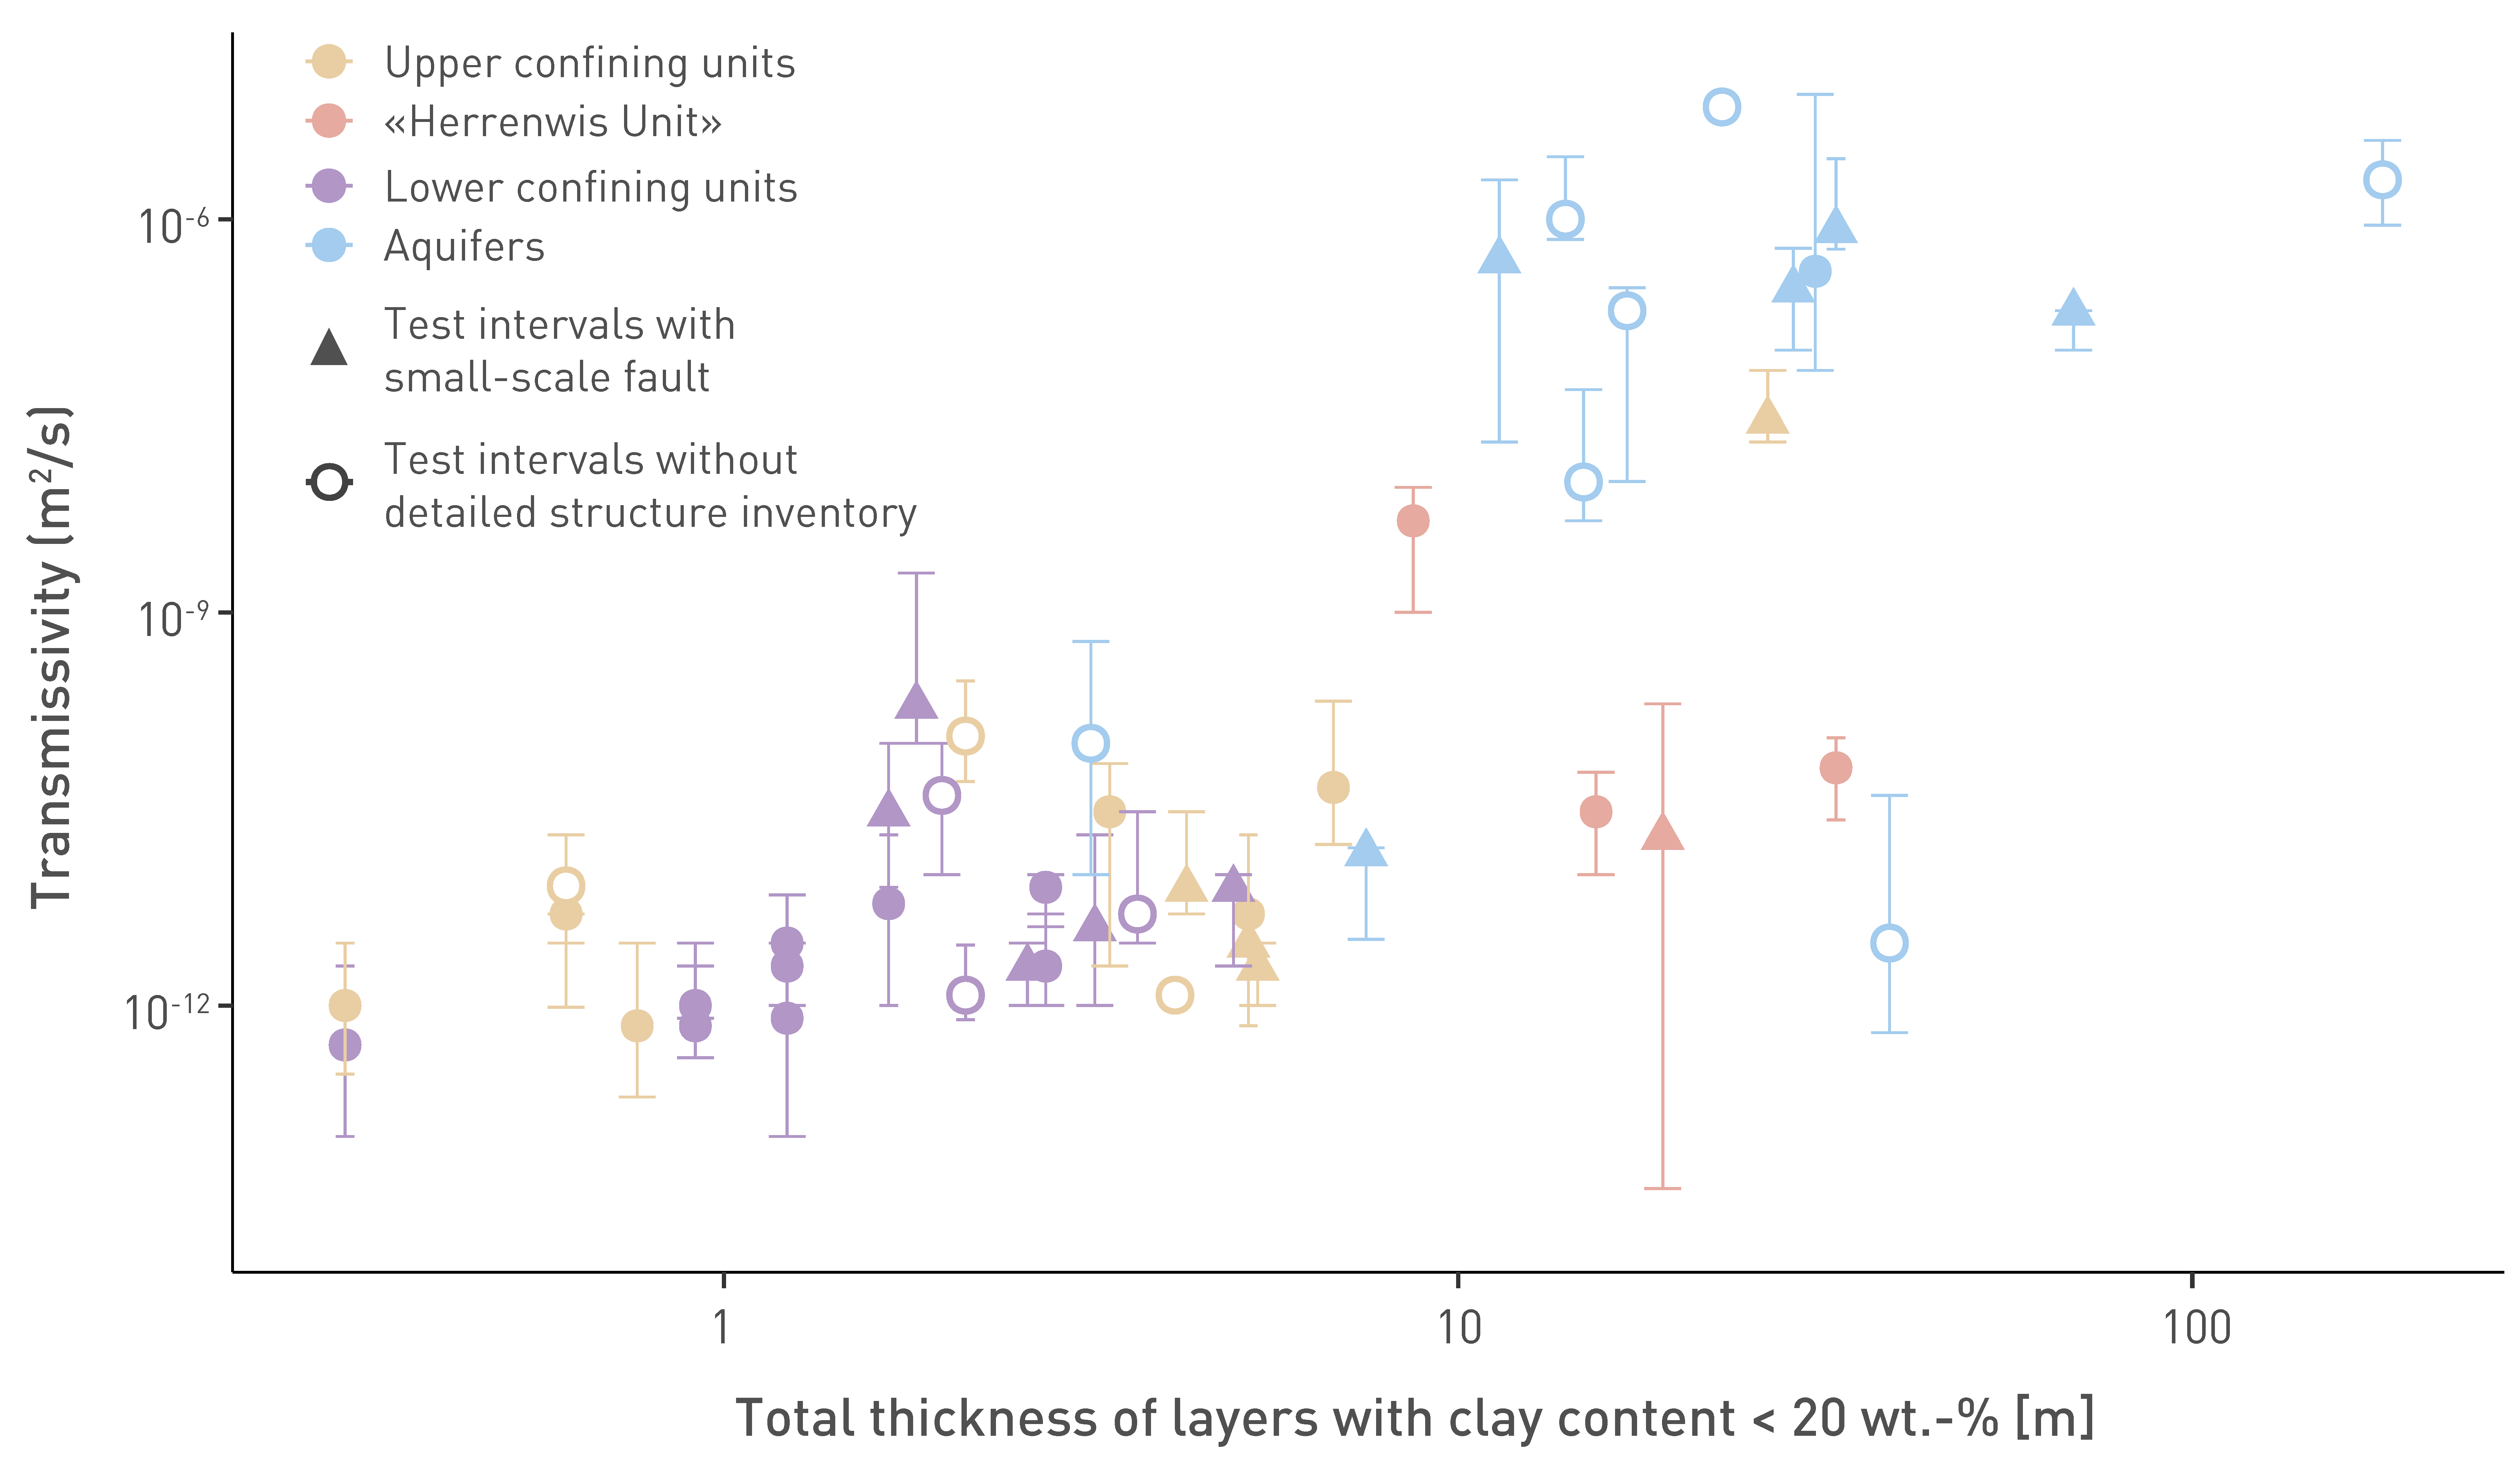
Fig. 5‑43:Transmissivity as a function of the total thickness of a layer with clay-mineral content < 20 wt.-%
The dataset considered includes packer tests from the base of the Lias Group to the top of the Malm Group (except the Opalinus Clay) in the TBO boreholes plus RIN, WEI and BEN. The dataset of the confining units is supplemented with data from the Malm and Hauptrogenstein aquifers.
The highest transmissivity (3 × 10⁻⁸ m2/s) encountered in the upper confining units was measured in the Wildegg Formation of the BOZ1 borehole. The test interval includes the Gerstenhübel Bed. A transmissivity of 5 × 10⁻⁹ m2/s was measured in the «Herrenwis Unit» of the STA2 borehole in association with a subvertical joint.
Tunnels and underground rock laboratories offer the opportunity to study the properties of the rocks of interest at larger scale compared to the deep boreholes. It is emphasised that the tunnels studied are constructed in areas of much stronger tectonic overprint than in the siting regions for the deep geological repository. This applies also to the Mont Terri rock laboratory, situated in the Folded Jura in Western Switzerland.
Gautschi (2001) and earlier literature cited therein screened the hydrogeological observations in the Opalinus Clay in five railway tunnels and five motorway tunnels. The overburden thickness at the locations in the Folded Jura ranges from 100 to 800 m. The level of mapped details in the available documentation is variable. Despite the complex tectonics, comprising numerous faults in a water-saturated environment, only two damp patches and three measurable water inflows are reported for a total of 6'600 m of tunnel length. All these indications of water flow are from sections with low overburden thickness (less than 200 m) and are either associated with a calcareous – sandy facies not observed in the siting regions in Northern Switzerland or with faults. The detection limit for visual identification of damp patches along faults in ventilated tunnels is estimated to a transmissivity of 10-9 m2/s.
In the framework of the construction of the new Belchen motorway tunnel in the Folded Jura, pulse tests in two boreholes indicated rock mass transmissivities ranging from 1.3 × 10⁻⁹ to 4.3 × 10⁻¹¹ m2/s (Renz et al. 2019, Ziegler et al. 2022). These data refer to intervals with tectonic faults and are probably affected by the excavation damage zone of the large tunnel diameter.
Becker & Vogt (2020) studied the occurrence of so-called 'wet spots' in the Mont Terri rock laboratory, where overburden thickness above the tunnels in the Opalinus Clay ranges between 220 and 320 m. The term wet spot is used for damp patches observed on tunnel walls, dripping points or water inflows (also termed seepage waters). The study of Becker & Vogt (2020) focused on the BBB-3 borehole and provided evidence of localised flow along features with a maximum thickness of a few centimetres and local hydraulic conductivities in the range of 10-9 – 10-11 m/s. Hydraulic cross-borehole connections were observed over distances of 0.8 – 1.0 m, suggesting that the wet spots are a spatially limited phenomenon. The authors consider small-scale variations of lithological properties in the transition zone from the carbonate-rich to the sandy facies in conjunction with stress redistributions due to the extensive tunnelling activities in the URL as the probable cause. Whether fracture planes, e.g. originating from the excavation damage zone, in these low clay-mineral content layers also contribute to preferential flow paths could not be clarified. Overall, the occurrence of wet spots can be (at least partly) explained in the context of small-scale variation in hydraulic conductivity and the activation of these systems by the tunnel construction (high hydraulic gradients, possibly disadvantageous stress situation). The profiles of natural tracers provide evidence against large flow systems active over long periods of time. Both at Mont Terri and at the neighbouring Mont Russelin, the profiles of the natural tracers can be explained by diffusion as the dominant transport process, despite the stronger tectonic overprint compared to the siting regions in Northern Switzerland (e.g. Wersin et al. 2020, Waber & Rufer 2017, Mazurek et al. 2009).
Hydraulic head profiles along boreholes can support the identification of potential release paths and are used to estimate vertical hydraulic gradients between the host rock and the confining units, and the local and regional aquifers (Nagra 2024m). In addition, the values recalculated to pore pressures feed into geomechanical interpretation.
In principle, formation hydraulic heads can be estimated in two ways: From the analyses of the hydraulic packer tests, and from the hydrogeological long-term monitoring systems, directly measured in selected boreholes and intervals.
Regarding the hydraulic packer tests, the test strategies and test design were optimised notably for testing low-permeability clay-mineral-rich rocks based on earlier experience (Nagra 2001, Nagra 2002, Marschall et al. 2004, Reinicke & Frieg 2021). The hydraulic packer test analyses provide reliable and well constrained estimates of the transmissivity and hydraulic conductivity. The formation hydraulic head in the units with low clay-mineral content, particularly in the Malm, Keuper and Muschelkalk aquifers, is also well defined by the hydraulic test results. Despite the improved testing strategy, the estimated hydraulic heads in test intervals located in low-permeability clay-mineral-rich rock are considered to be strongly biased by artefacts (see also Nagra 2002, Beauheim 2013) and are therefore termed 'apparent heads'. They are not representative of formation hydraulic heads and are therefore not further discussed here.
As in other investigation programmes of low-permeability clay-rich rocks (e.g. Distinguin & Lavanchy 2007, NWMO 2011), hydrogeological long-term-monitoring (LTM) systems are used instead of short-term hydraulic tests to derive representative hydraulic heads or formation pore pressures. In addition to the pre-existing LTM system in the Benken (BEN) borehole, three additional boreholes were equipped (MAR1, STA3, BOZ1), that is one per siting region. The LTM systems are intended to measure the undisturbed formation hydraulic heads and their temporal fluctuations in the Opalinus Clay, the confining units and the deep aquifers. Measurements with the new LTM systems started in late spring 2022. While the pressures in many intervals are still evolving, the following conclusions can be formulated for the moment (with the focus on host rock and confining units):
-
The monitoring system in the BEN borehole records the hydraulic heads since 2009 (installation of the Baker-Hughes system). After 15 years of operation, the values in the Opalinus Clay are still slowly declining and are the lowest in the monitored units. Currently (Longridge et al. 2024), the measured hydraulic head in the Opalinus Clay is ca. 335 m a.s.l., that is 69 m below hydrostatic and ca. 56 m lower than in the Malm aquifer.
-
The hydraulic heads measured in the new boreholes seem to evolve like those measured in the BEN borehole. That is, the formation hydraulic heads in the Opalinus Clay are below hydrostatic (Fig. 5‑44) and lower than in the adjacent aquifers.
-
The hydraulic head in the «Herrenwis Unit» of the STA3 borehole is also subhydrostatic and lower than the discharge level of the Malm aquifer along the Rhine River (Fig. 4‑91).
In the scientific literature, values of hydraulic heads that cannot be explained solely by gravity-driven flow are termed 'anomalous heads' or 'anomalous pore pressures' (e.g. Neuzil 1995, Birchall et al. 2022). Many examples worldwide have been reported. They are believed to arise when processes cause sufficiently large changes in pore volume or fluid volume that cannot be dissipated by flow in the low-permeability formation (Horseman et al. 1996). Typical processes invoked to cause underpressures are stress release either because of erosion or after melting of Pleistocene ice cover (e.g. Beauheim 2013, Normani et al. 2017). These anomalous heads are an indication of very low hydraulic conductivity.
The hydraulic diffusivity is the measure of the ability of a porous medium to dissipate pressure. For the Opalinus Clay it is estimated at ca. 10-8 s-1 (K ~ 10-14 m/s, Ss ~ 10-6 m-1) and is well within the range of examples worldwide with observed anomalous pressures (literature overview in Vinard 1998, Neuzil 2015).
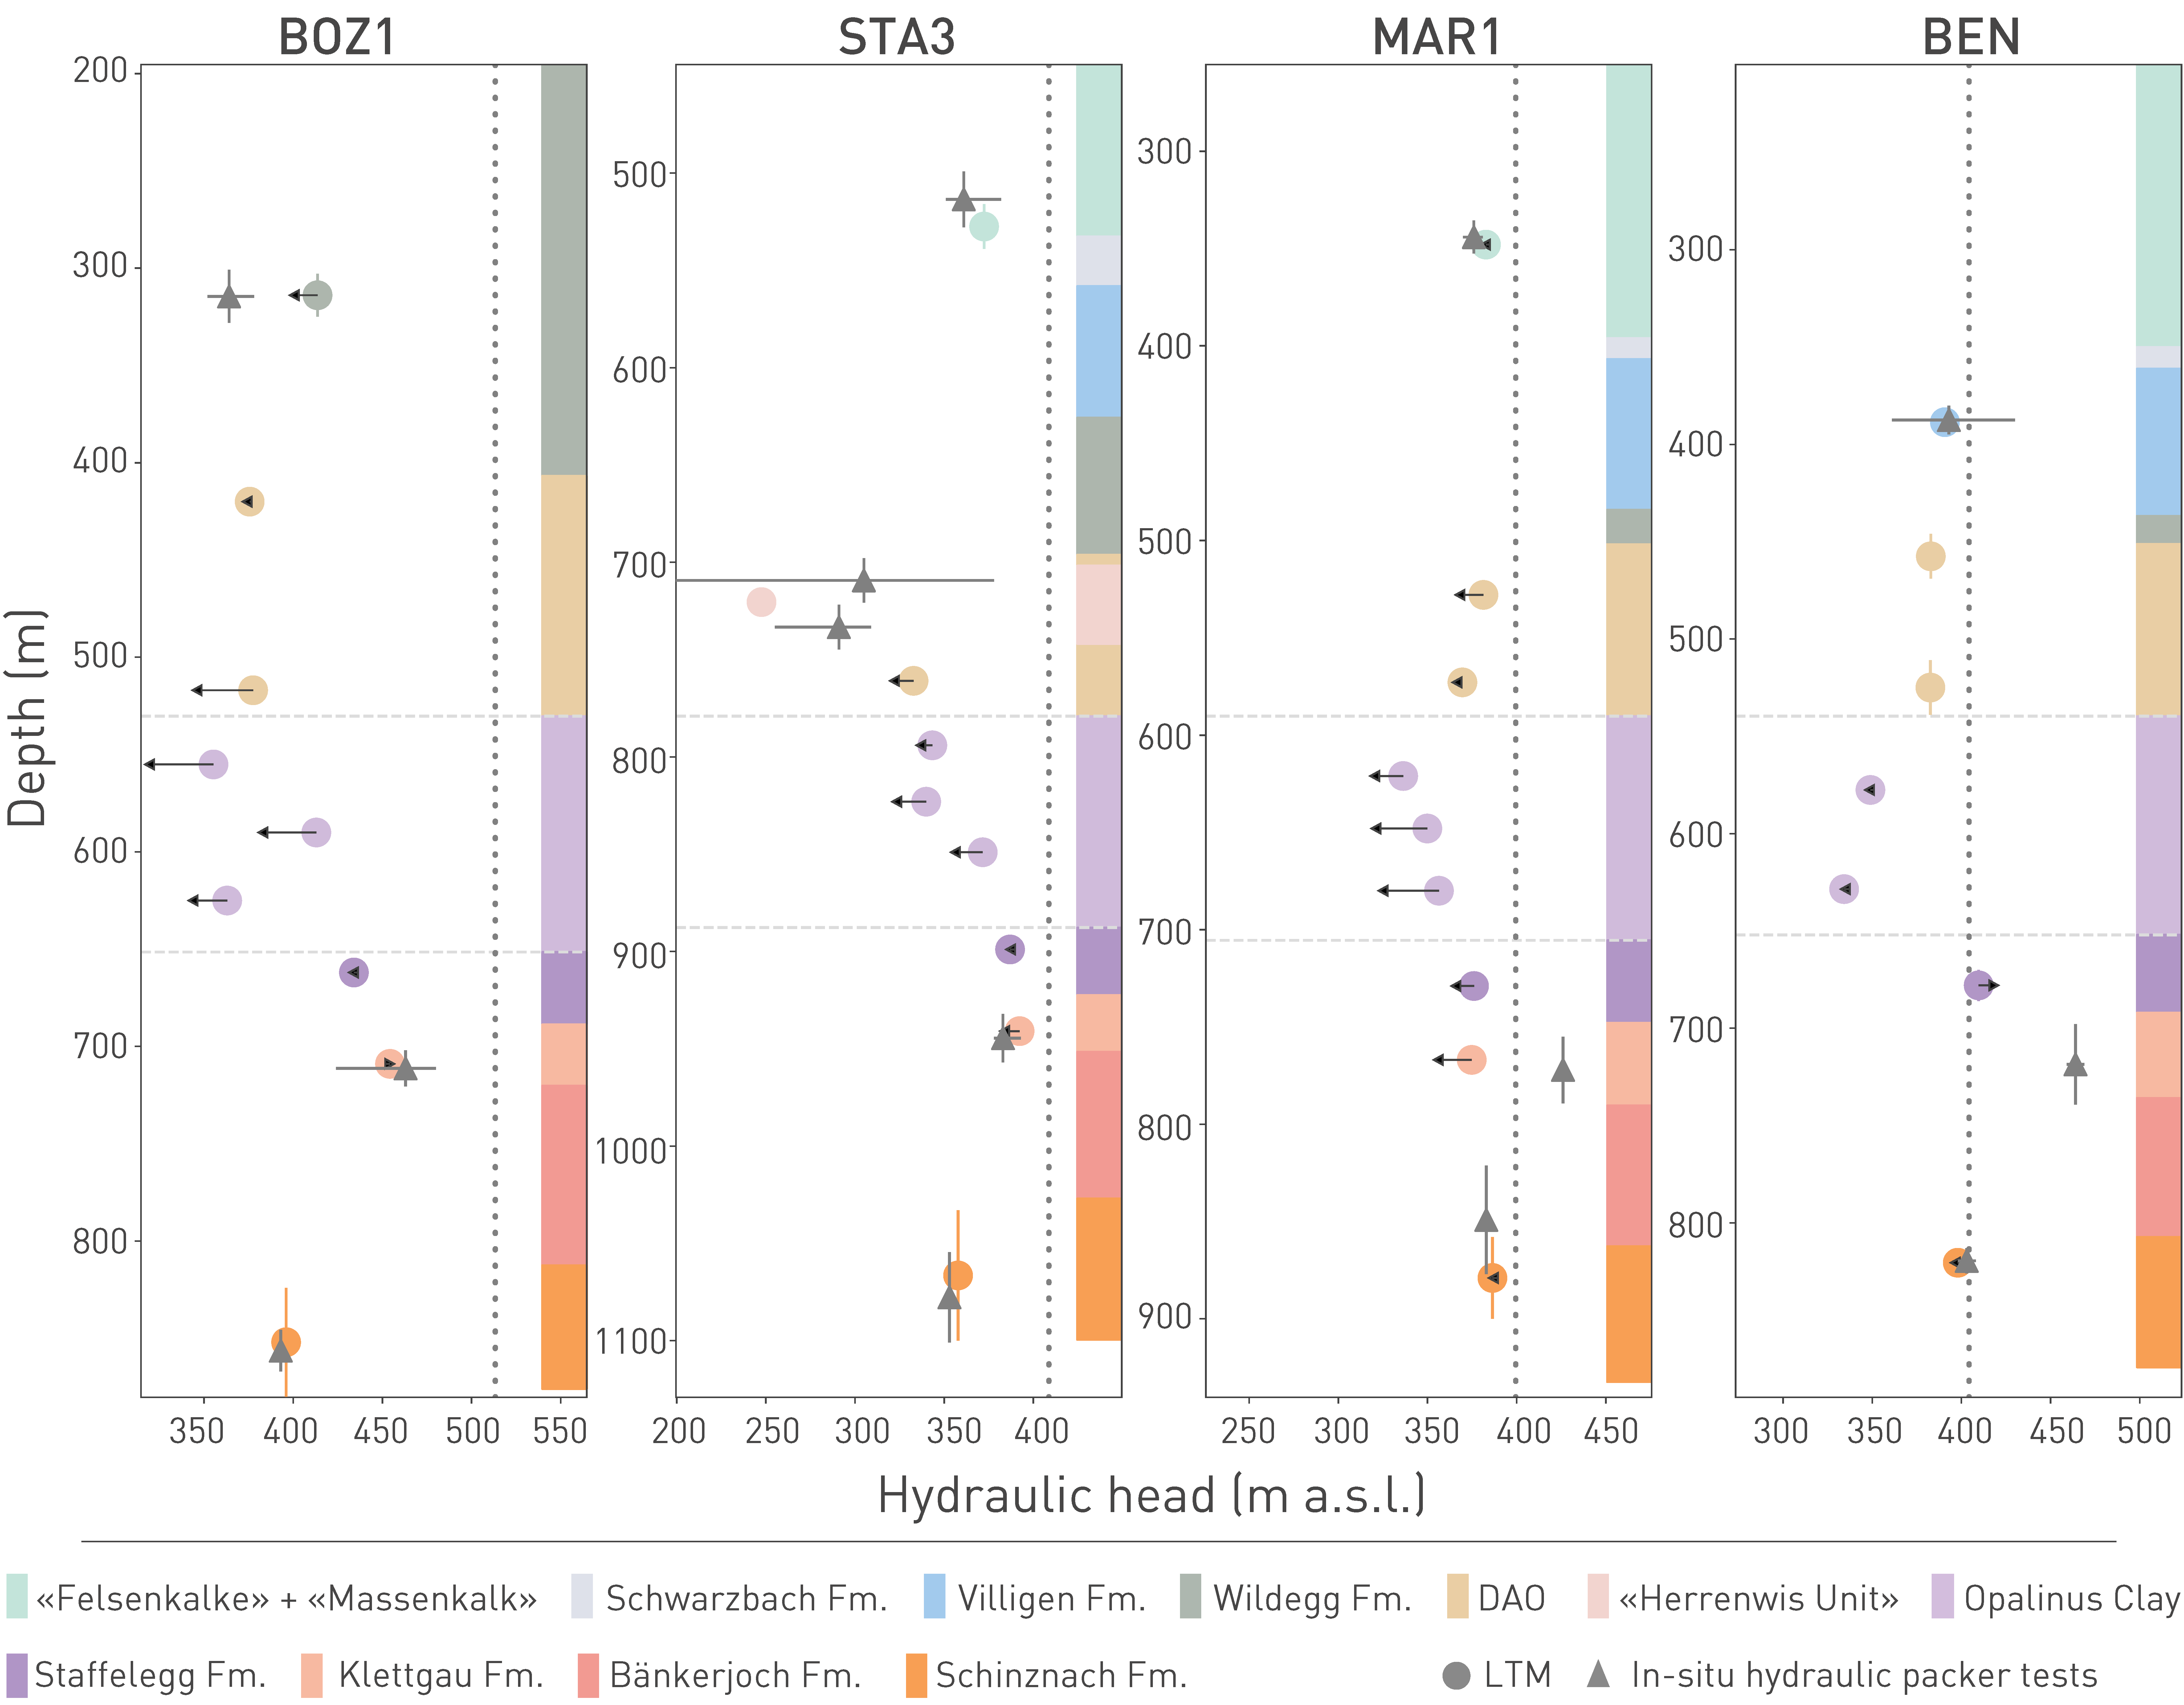
Fig. 5‑44:Hydraulic head profiles based on hydrogeological long-term monitoring and in-situ hydraulic packer test data in the BOZ1, STA3, MAR1 and BEN boreholes
Status of the long-term monitoring data is 01.05.2024. Hydraulic heads of the long-term monitoring systems are displayed using full circles. The extent of the intervals in contact with the formation is shown with a vertical line (in many cases the interval is smaller than the size of the data points). Left-pointing and right-pointing arrows respectively indicate decreasing and increasing hydraulic head with time (i.e. not yet stabilised). The length of the arrows is proportional to the magnitude of the rate of change of the hydraulic head with respect to time. No arrows are displayed for intervals with an absolute rate of change smaller than approximately 3 mm/day (about 1 m/yr). Hydraulic heads estimated from hydraulic packer tests are displayed with grey triangles. The associated horizontal and vertical lines show the uncertainty range of the hydraulic head value and the extent of the tested interval respectively. Hydraulic head estimates from hydraulic packer tests in low-permeability clay-rich units are affected by artefacts and are not shown (see text). Vertical dotted lines indicate the ground level. DAO: Dogger Group above Opalinus Clay, Fm.: Formation.
The hydraulic conductivities of the Opalinus Clay are uniformly low and comparable among the studied sites. The low values are supported by independent evidence such as natural tracers in porewater (Section 4.6) and are the reason for diffusion being the dominant transport process (Section 5.9).
The Opalinus Clay fracture hydraulic properties as observed in in-situ tests in boreholes in Northern Switzerland are consistent with the range of values of the intact matrix. That is, fractures do not represent preferential flow paths. This is explained by self-sealing (Section 5.7).
Hydraulic conductivities in the confining units are low and will contribute to the retardation of radionuclides. Tectonic overprint on clay-poor lithologies may result in locally elevated transmissivities – but it remains a hypothetical assumption that such units may provide a continuous release path.
Hydraulic heads in the Opalinus Clay are lower than in the adjacent aquifers. This is probably caused by transient hydromechanical processes related to loading and unloading of the rock column. Such processes underpin the very low hydraulic conductivity.
Key points:
- High self-sealing potential of the Opalinus Clay ensures that fractures, when and where formed, do not remain permeable and thus would not jeopardise the barrier integrity over relevant timescales.
- Clay-mineral content is a very good indicator for the self-sealing potential of the host rock and confining units, with values greater than approximately 40 wt.-% (e.g. the Opalinus Clay) exhibiting very high self-sealing and values less than approximately 20 wt.-% exhibiting low or negligible capacity.
- Besides clay-mineral content, sufficient effective stress (or equivalent depth) is required for robust self-sealing. This is achieved in the Opalinus Clay in all the siting regions.
- In view of the long-term development of the repository and related concerns about erosion, a residual overburden of 200 m can be considered as sufficient for robust self-sealing in the Opalinus Clay.
The term "self-sealing" broadly encompasses all hydromechanical, hydrogeochemical and hydro-biochemical processes that lead to a reduction in transmissivity of a fractured rock mass (Tsang et al. 2005). The term "sealing" implies that the reduction in hydraulic conductivity is so significant that transport properties are again comparable to the intact rock mass or simply so low that transport becomes diffusion-dominated (Section 5.8). The prefix "self" implies that the sealing processes occur spontaneously if access to water or brine is granted. Self-sealing can be considered as the key factor for the barrier integrity of the Opalinus Clay and other clay-rich rocks even in tectonically disturbed areas, which is a critical difference to other low-permeability rocks with lower clay-mineral content.
Section 5.7.2 first summarises selected empirical and phenomenological evidence for self-sealing in the Opalinus Clay. The key processes and mechanisms responsible for self-sealing are then explained in Section 5.7.3.
It was highlighted previously that hydraulic conductivity in the Opalinus Clay is low even in fractured and faulted intervals (Section 5.6). The most relevant evidence is results from the hydraulic packer tests in the new deep boreholes, which are consistent with matrix values of unfractured laboratory samples (Fig. 5‑38). Besides the standard packer tests in deep boreholes, relevant new data were also acquired from dedicated special hydraulic tests in the deviated RHE1 borehole, which are discussed in Section 5.7.4.
Self-sealing potential correlates mainly with material properties such as clay-mineral content and bulk density or porosity but depends also on the effective stress field (see Section 5.7.3 for the mechanisms). This stress dependence explains why a landfill in the Opalinus Clay at a few tens of metres depth cannot rely on similar self-sealing potential as can a facility at repository depth. Effective stresses in all the siting regions currently ensure robust self-sealing (Section 5.7.4) for the Opalinus Clay at the level of a future repository. Self-sealing may be limited when the overburden thickness decreases to values < 200 m. This is not expected for the period under consideration (Sections 6.4 and 6.5).
Other factors affecting self-sealing are discussed in Section 5.7.5, and the relevance of mineralised fractures ("veins") for the self-sealing potential in the Opalinus Clay is addressed separately in Section 5.7.6.
A comprehensive summary of evidence for self-sealing in argillaceous formations in the context of geological disposal of radioactive waste was provided by Bock et al. (2010).
Specific to the Opalinus Clay, there is both phenomenological and direct evidence from active testing for self-sealing (Tab. 5‑2). The phenomenological evidence stems from observations in tunnels and boreholes (see also Sections 5.6.3 and 5.6.4) that tectonic structures in the Opalinus Clay do not show significant changes in hydraulic properties in situ. In addition, experiments at the Mont Terri rock laboratory and in the RHE1 borehole in the ZNO siting region at potential repository depth provide direct evidence for self-sealing, as fissures are either generated or faults reactivated. These experiments have demonstrated that faulting or fault re-opening at low effective stress is associated with an increase in transmissivity by several orders of magnitude and followed by fault closure and a strong decrease in transmissivity over time and with an increase in effective stress.
The empirical findings are complemented by numerous laboratory experiments under controlled conditions, which describe the self-sealing behaviour in the Opalinus Clay phenomenologically and quantitatively:
-
Small-scale tests with artificially induced cracks in core material show closure of the cracks within hours to days in the presence of water and confining stress of a few MPa (e.g. Seiphoori 2019a, Wenning et al. 2021a, Voltolini & Ajo-Franklin 2020; see Fig. 5‑45).
-
Direct shear and triaxial tests with measurements of hydraulic properties exhibit rapid disaggregation of the rock in the vicinity of fractures (e.g. Zhang et al. 2008, Cuss et al. 2011, Monfared et al. 2012, Zhang 2013, Seiphoori 2019a), and eventually their closure, with a significant reduction in conductivity (several orders of magnitude) reaching values close to (or slightly higher than) the intact material.
-
Detailed studies of volumetric behaviour such as consolidation and swelling tests (Section 5.5.2) quantify the volumetric expansion or compaction due to effective stress changes as well as hydration.
Tab. 5‑2:Empirical findings and key experiments on self-sealing in the Opalinus Clay
EDZ: Excavation damage zone.
|
Locality / Area |
Findings |
Conclusion |
References |
|---|---|---|---|
|
Indirect evidence for self-sealing (phenomenological evidence) |
|||
|
Internal Jura |
Geological gallery surveys in railroad and road tunnels: no dripping water or damp spots where overburden thickness greater than a few hundred metres (e.g. Mont Russelin with 300 – 400 m overburden). |
Transmissivity of brittle structures at larger overburden thickness is very low, even in heavily faulted sections. |
|
|
Autochthonouscover, Alpine Foreland |
At Lausen, Opalinus Clay outcrops beneath Quaternary. Drastic decrease in hydraulic conductivity within uppermost 30 m depth from the surface. |
Low depth / stress sufficient to have a significant sealing effect. |
Vogt et al. (2017) and Section 6.5.2 |
|
Central Molasse Basin |
Strong tectonic overprint at Base Opalinus Clay in the Schafisheim borehole: no increased hydraulic conductivity. |
Brittle structures do not differ significantly hydraulically from the rock matrix. |
|
|
Siting regions |
Diverse brittle structures of different sizes in numerous deep boreholes: no significantly increased hydraulic conductivity in packer tests. |
Brittle structures do not differ significantly hydraulically from the rock matrix. |
|
|
Whole of Northern Switzerland |
In the Opalinus Clay, vein fillings are rare and volumetrically not relevant. |
No significant water – rock interaction associated with advective water flow. |
|
|
Mont Terri rock laboratory |
"Main Fault": no increased hydraulic conductivity in packer tests prior to fault reactivation. |
Under undisturbed effective stress conditions, the "Main Fault" is not hydraulically effective. |
|
|
In-situ experiments with direct evidence for self-sealing |
|||
|
Mont Terri rock laboratory |
GS experiment: significant crack transmissivity is observed only at low effective normal stress (< 2 MPa). |
Only low normal stress required for mechanical self-sealing of discrete deformation structures. |
|
|
Mont Terri rock laboratory |
In the Selfrac experiment, the hydraulic conductivity of the EDZ decreased by about 2 orders of magnitude over a period of 2 years. At loads of up to 5 MPa, an additional decrease by 2 orders of magnitude is observed within 6 months. Various other experiments confirm the findings (HG-A, MB etc.). |
Open fractures in the EDZ seal by contact with water (swelling) and by increasing the normal effective stress. |
|
|
Mont Terri rock laboratory |
FS experiment: rapid reduction of transmissivity by 2 orders of magnitude after stimulation (pressure pulse) at the "Main Fault", followed by a slow reduction and closure at sustained rate over a period of approximately 1 year. |
Confirmation of the findings from the Selfrac experiment. Empirical evidence from EDZ can be transferred to larger fault zone. |
|
|
RHE1 deep borehole, 580 m depth |
Head injection test: Increase in transmissivity by approx. 3 orders of magnitude by increasing pore pressure until reactivation of an existing disturbance. After reduction of the pore pressure, the transmissivity drops back to the level before stimulation (see Section 5.7.4). |
Transmissivity only elevated near fracture opening pressure. High transmissivity only maintained at high pore pressure. |
Dossier VII of Nagra (ed.) (2023b) and Section 5.7.4 of this report |
The knowledge base is further supplemented by analogue studies of similar rocks:
-
In particular, the Callovo-Oxfordian Claystone from the French investigation programme (e.g. OECD/NEA 2022, Wang et al. 2022, Zhang & Talandier 2023) with very similar hydromechanical properties to the Opalinus Clay.
-
Experiments in the Tournemire rock laboratory with Toarcian-Domerian claystones (OECD/NEA 2022, Donzé et al. 2023).
-
Very broad literature documenting clay-rich rocks (shales) with similar mineralogy and basic properties as to the Opalinus Clay acting as top seals or cap rocks of conventional hydrocarbon reservoirs over geological timescales (e.g. Fisher et al. 2013, 2023).
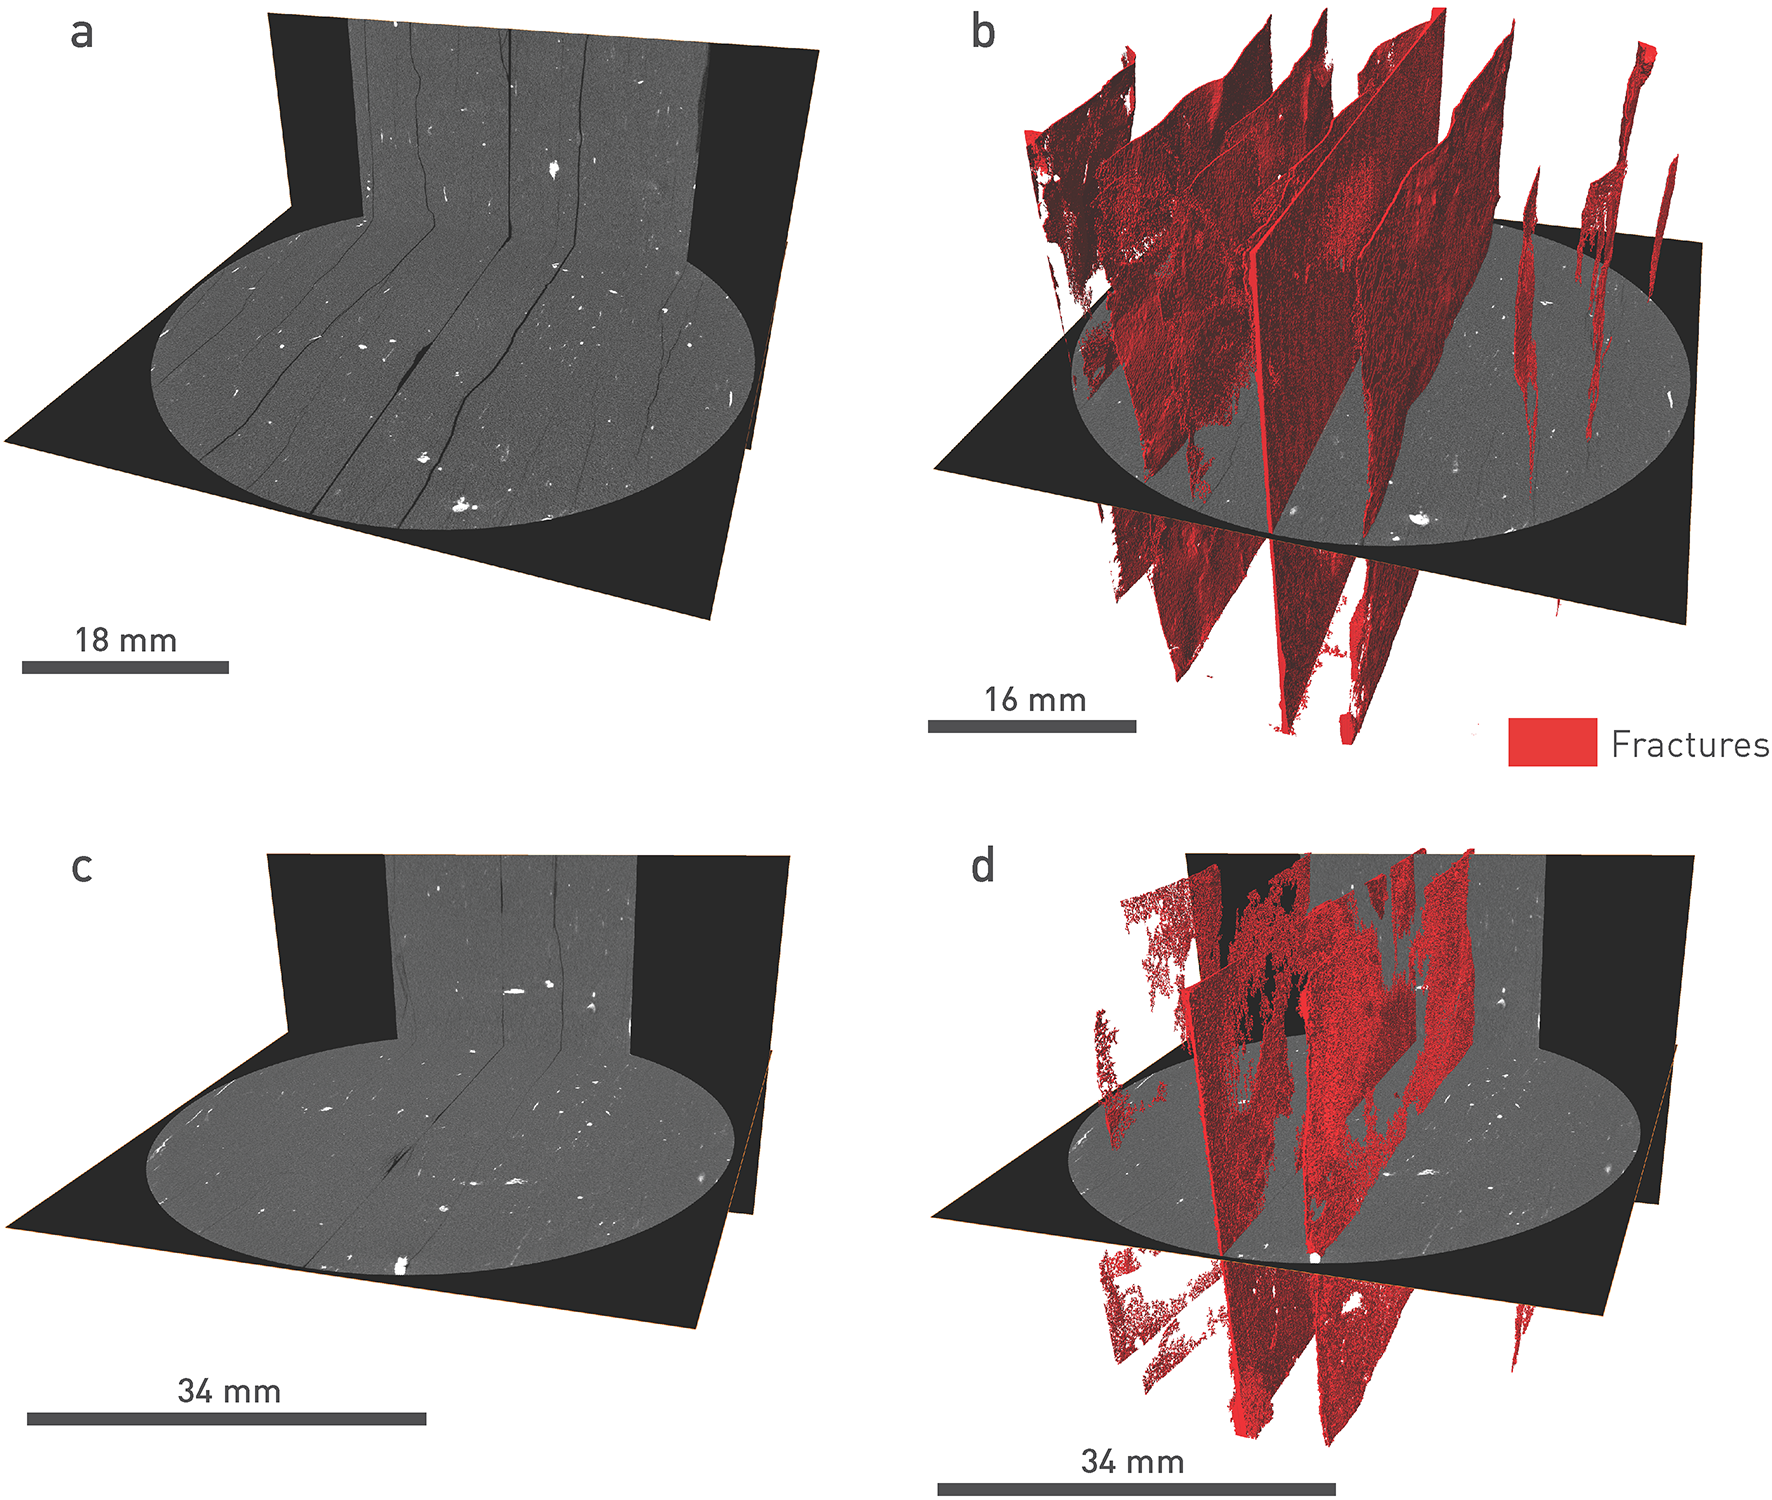
Fig. 5‑45:Experimental evidence of self-sealing in laboratory experiments
X-ray images at the beginning (a), (b) and about 2 days after water injection (c), (d), with (b) and (d) illustrating the reconstructed 3D image of the fractures in red. The apertures of the original fractures (up to 200 mm) in (b) reduce partly to below the imaging resolution of about 30 mm in (d). Experimental details can be found in Seiphoori (2019a).
In contrast to cap rocks, the clay-mineral content and porosity in gas resource shales is much lower, and deformation response more brittle. However, successful production of gas from resource shales generally relies on injection of proppants to maintain flow after fracturing, demonstrating relatively rapid closure even in shales with low self-sealing potential (Fisher et al. 2013, 2023).
The mechanisms contributing to self-sealing are of both physicochemical and hydromechanical nature. Bock et al. (2010) provides an empirical basis and some conceptual background for self-sealing in clay-rich rocks considered as host rocks for a deep geological repository.
For the Opalinus Clay, self-sealing processes were described in an earlier report by Nagra (2002). Since then, the understanding has been enhanced significantly, particularly at the Mont Terri rock laboratory, and using core material from the Schlattingen-1 (SLA1) deep borehole, drilled near the ZNO siting region. The summary of process understanding presented hereafter is based on the above-cited works, as well as on Mitchell & Soga (2005) and Laird (2006).
The fundamental pre-condition for self-sealing to occur is the generation of dilatant fractures (mode I or mixed mode I and II fractures, see Fig. 5‑24) in a preceding deformation event. Development of these fractures is locally associated with a change in the fluid pressure and the stress state. Phenomenologically, self-sealing leads to progressive reduction of the fracture aperture, but the underlying processes involve a volumetric expansion of the rock mass in the vicinity of the fracture (or system of fractures). These key processes are of hydromechanical and physicochemical nature and act either (i) mainly at the fracture surface, or (ii) in the (intact) rock behind the fracture wall. In both cases, the main factors controlling the changes to fracture aperture are the changes in total stress, and the changes in fluid pressure in the fracture and the pore pressure in the rock matrix.
Along the fracture surface, changes in fluid pressure can equilibrate rapidly compared to the pore pressure in the rock matrix, especially at very low effective stress. In the case of fluid injection (e.g. injection tests, Section 5.7.4), the fluid pressure acts orthogonally to the fracture surface (i.e. the normal stress) and forces the opening of the fracture. However, in the absence of active injection, pore pressure in the fracture and behind the fracture wall will decrease with dilation associated with fracturing because of the low compressibility of water. Negative pore pressure (suction) could also develop.
At the end of active injection, once fluid pressure decreases, an increase in the effective stress along the fracture occurs and generally results in rapid closure. The response to the effective stress changes depends on the hydromechanical properties of the rock. Clay-rich rocks, and the Opalinus Clay in particular, have a relatively low stiffness and a capacity to deform plastically. The compliance of the material leads to the deformation of asperities along the fracture surface (e.g. contact points), which further favours the decrease in fracture transmissivity. In contrast, the rough surfaces of more competent rocks can sustain much higher stresses without a significant reduction in transmissivity.
In contrast, pore pressure in the adjacent rock behind the fracture wall changes slowly because of the low conductivity (low pressure diffusivity) of the intact Opalinus Clay. A reduction in fluid pressure (or suction increase) in the dilatant fracture generates a gradient in the fluid pressure from the adjacent rock (higher pore pressure) towards the fracture, enhancing the effective stress reduction and therefore the volumetric expansion (Section 5.5.2). At the particle level, mechanisms typical of expansive geomaterials such as clays in contact with water and brine occur. These are the crystalline swelling between clay-particle stacks (water hydration) and double-layer
swelling because of the repulsive electrostatic forces within the quasi-crystals (Laird 2006, Bourg & Ajo-Franklin 2017). These mechanisms also affect the clay minerals of the asperities at the fracture wall, and further contribute to fracture closure (Fang et al. 2017).
Swelling is considered the key process of fault transmissivity reduction over longer timescales of in-situ tests (months to years, e.g. Marschall et al. 2017, Soom et al. 2021). As emphasised in Fig. 5‑23, the expansion is enhanced at low effective stress. Osmotic pressure gradients can further contribute to water movement. In partly saturated conditions, e.g. in the excavation damage zone (EDZ) of the tunnel, suction can also be an important driver from higher saturation rocks (the undisturbed rock mass) to those of lower saturation (the EDZ). Saturation increase also causes effective stress reduction and therefore volumetric expansion of the rock.
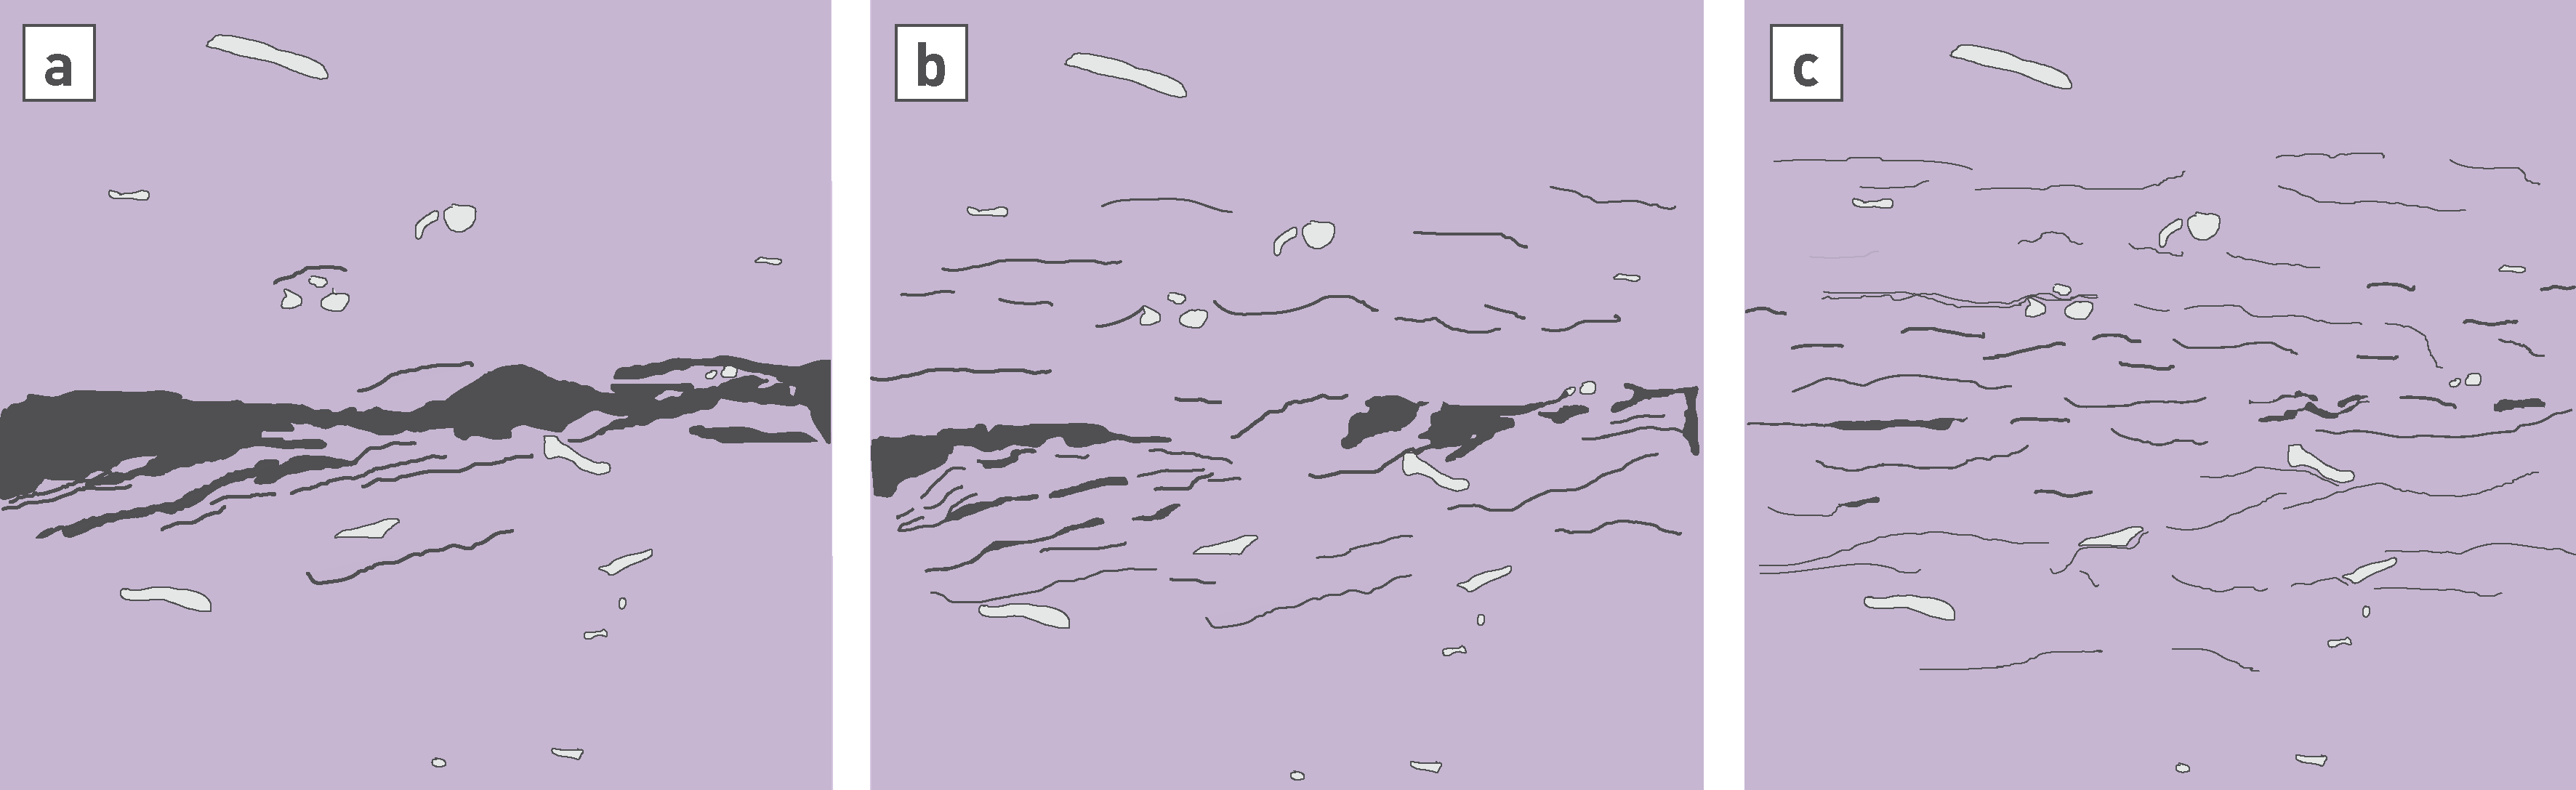
Fig. 5‑46:Concept of self-sealing sequence in the Opalinus Clay
Fracture aperture in black, larger clastic grains in white, clay matrix in light grey: (a) Initial condition with existing large fracture in the centre. (b) Fracture closing comes at the expense of material expansion in the vicinity of the fracture where effective stresses can be particularly low (locally "unstressed fracture surface"). This creates new fissures and leads to material disintegration. (c) Further closure can lead to fissuring deeper into the initially undamaged rock, but this will be closed in a similar fashion. Drawing based on a synchrotron X-ray micro-tomography study of Voltolini & Ajo-Franklin (2020).
Self-sealing of faults and joints is typically accompanied by the formation of smaller subsidiary fractures in the intact rock (e.g. Seiphoori 2019a, Wenning et al. 2021b, Voltolini & Ajo-Franklin 2020, Di Donna et al. 2019, Crisci 2019) to compensate for the initial fracture porosity (Fig. 5‑46). This is because of the locally unconstrained surfaces along the fracture, which can lead to swelling beyond the elastic limit and induce new fractures. Hence, the main fracture closes, but the fractured zone grows into the intact rock. Smaller fractures then close in similar fashion and self-sealing is complete when a hydromechanical and hydrochemical equilibrium is achieved in the near-field of the fracture. Hence, the initial fracture aperture is compensated by disintegration of the rock in a wider zone, and finally a homogenisation and local increase in "matrix" porosity compared to the undisturbed porosity. However, a local increase in matrix porosity equates to only very small or negligible changes in the overall transport properties (Section 5.7.5).
Additional mechanisms can further contribute to the sealing of fractures, but their contribution is subordinate to those described above. These involve "creep" defined as secondary compression (i.e. volumetric deformation with time at constant effective stress; Favero et al. 2016, Crisci et al. 2021) or the precipitation of secondary minerals ("veins", Section 5.7.6).
Whereas the clay-mineral content exerts strong control on the swelling capacity of the Opalinus Clay (Section 5.5.2), a sufficient overburden thickness (Section 5.6.3) or critical effective normal stress is also required for robust self-sealing.
Experiments at Mont Terri and the Tournemire rock laboratories have shown that a relevant increase in fracture transmissivity is only obtained at very low effective normal stress on the fracture surface (Marschall et al. 2017, Donzé et al. 2023, Guglielmi et al. 2020) (Fig. 5‑47). This "threshold" is referred to as fracture opening pressure (FOP) and was constrained at approximately 1 – 2 MPa. In Fig. 5‑47, FOP is indicated in terms of the corresponding effective stress level.
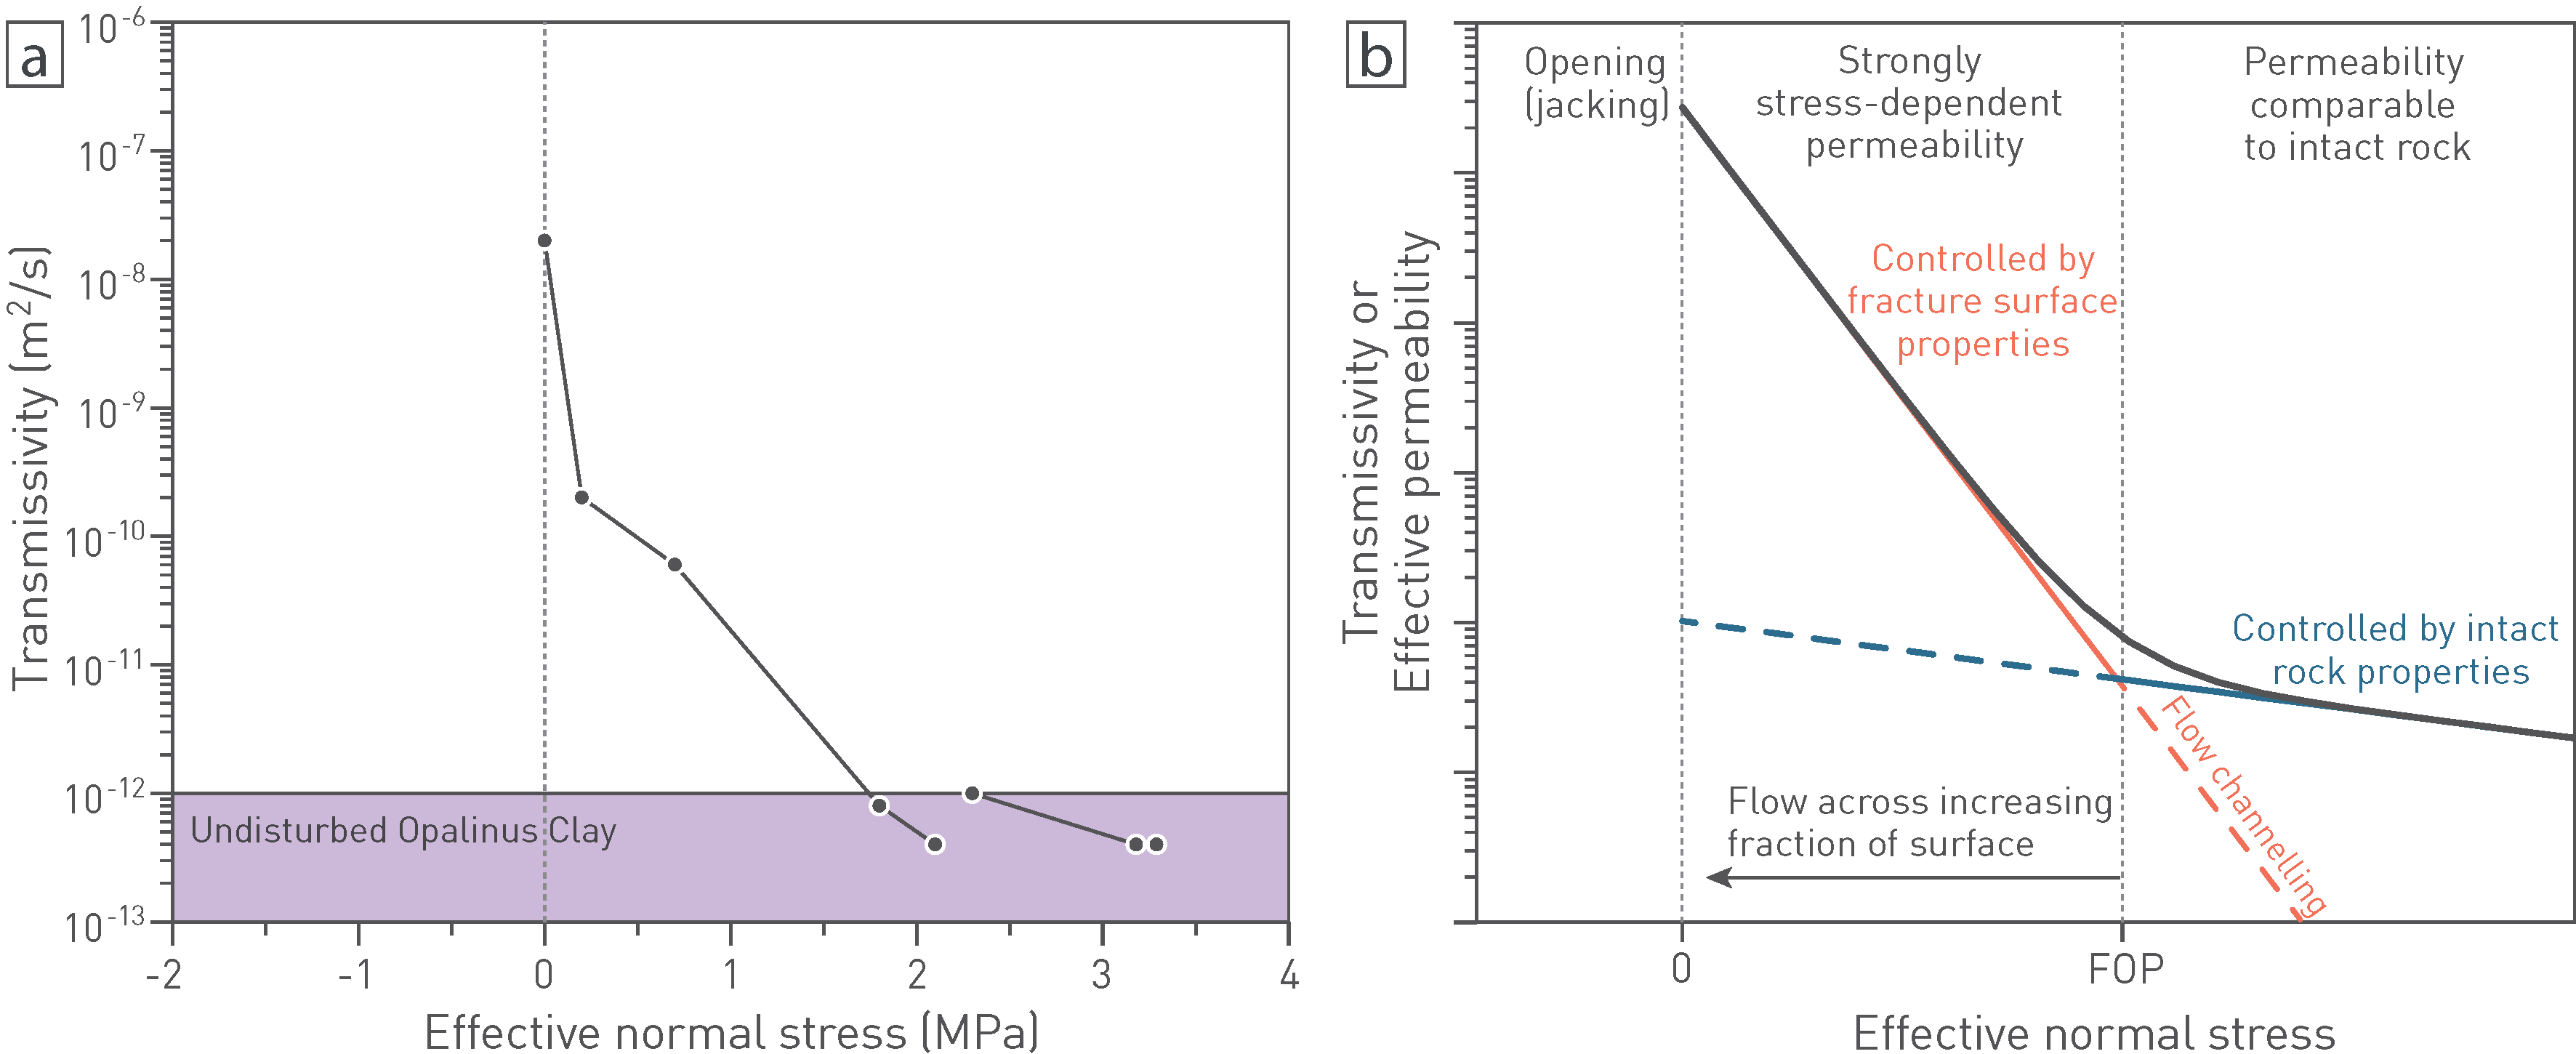
Fig. 5‑47:Dependence of fracture transmissivity on the effective normal stress
(a) Example of the GS experiment at Mont Terri (Marschall et al. 2017). (b) Conceptual understanding of flow regimes (modified after Donzé et al. 2023).
Conceptually, the FOP separates an effective permeability field at high effective stress, which is only marginally dependent on stress, from a field at low effective stress, which is strongly dependent on effective stress (Fig. 5‑47b). As the FOP is approached from initially higher effective stress, local dilatancy can occur, subsequently connecting dilatant parts of the fault and channelling fluid flow. Once fluid pressure achieves the critical value (FOP), transmissivities can increase by several orders of magnitude, as the effective confinement on the fault is gradually removed. It is important to note that the FOP is considered as a conceptual transition point, but absolute transmissivities may remain low (e.g. T < 10-10 m2/s at 0.5 – 1 MPa) before effective opening at close to zero effective stress (Fig. 5‑47a).
This conceptual understanding was recently confirmed in dedicated hydraulic tests in the Opalinus Clay in the RHE1 borehole at approximately 580 m depth below ground (Dossier VII, RHE1, Nagra (ed.) 2023b) (Fig. 5‑48). The test suite consisted of stepped-constant differential head injection tests (HI), followed by a withdrawal test applying constant differential head (HW) in an interval consisting of several fault planes with typical azimuth of 130° and main dips of 30 to 60° (Dossier V, RHE1, Nagra (ed.) 2023b).
Even after raising pore fluid pressure by more than 3 MPa in the test interval, no significant change in the flow rate was observed (point HI303 in Fig. 5‑48a). The stress field at the depth interval can be estimated from 3D geomechanical numerical modelling (Section 4.3 and Nagra 2024o). This is depicted by Mohr circles as initial condition in Fig. 5‑48b, where different circles represent the uncertainty in the total stresses (pore fluid pressure in the formation is assumed to be hydrostatic), and the dark grey circle as the average. The minimum value of the “failure” envelope of the fault planes can be estimated from post-peak strength of triaxial tests (Fig. 5‑27b). As illustrated in Fig. 5‑48b, the corresponding average Mohr circle prior to raising the fluid pressure is at safe distance from the failure envelope.
After increasing the pore fluid pressure to more than 5 MPa in the test interval (point HI306), the Mohr circle approximately intersects with the failure envelope, especially considering the uncertainties in the stress field. This is associated with a flow rate increase by 1 – 2 orders of magnitude. Furthermore, the effective normal pressure of the fault planes with dips of 30 to 60 degrees (indicated by dashed lines on the Mohr circle) at this stage was approximately 2 MPa, in good general agreement with a FOP as constrained in Mont Terri.
Fault opening is indicated with a progressive interval pressure drop after the HI306 phase, despite increasing the flow rate by nearly one order of magnitude. This was then followed by a pressure recovery after a constant head withdrawal test (HWS), where the pressure equilibrated to approximately 1 MPa above hydrostatic. The subsequent HW phase again allowed measurement of the flow rate, demonstrating major reduction to close to pre-stimulation values. The high transmissivities observed in the in-situ experiments (RHE1 and underground laboratories) followed by rapid reduction when injection is stopped is consistent with rapid pore fluid pressure equilibration across the fracture plane (Section 5.7.3). Over longer periods of time (months to years), “swelling” will dominate the self-sealing process and further reduce fracture transmissivity (Section 5.7.3).
Assuming a typical effective stress gradient of 0.01 – 0.015 MPa/m, a very similar range of effective stress (2 – 3 MPa) is reached for a FOP threshold at approximately 200 m overburden thickness. This is consistent with packer test results (Fig. 5‑41) and observations of water ingress and damp spots in tunnels (Gautschi 2017; Section 5.6.4).
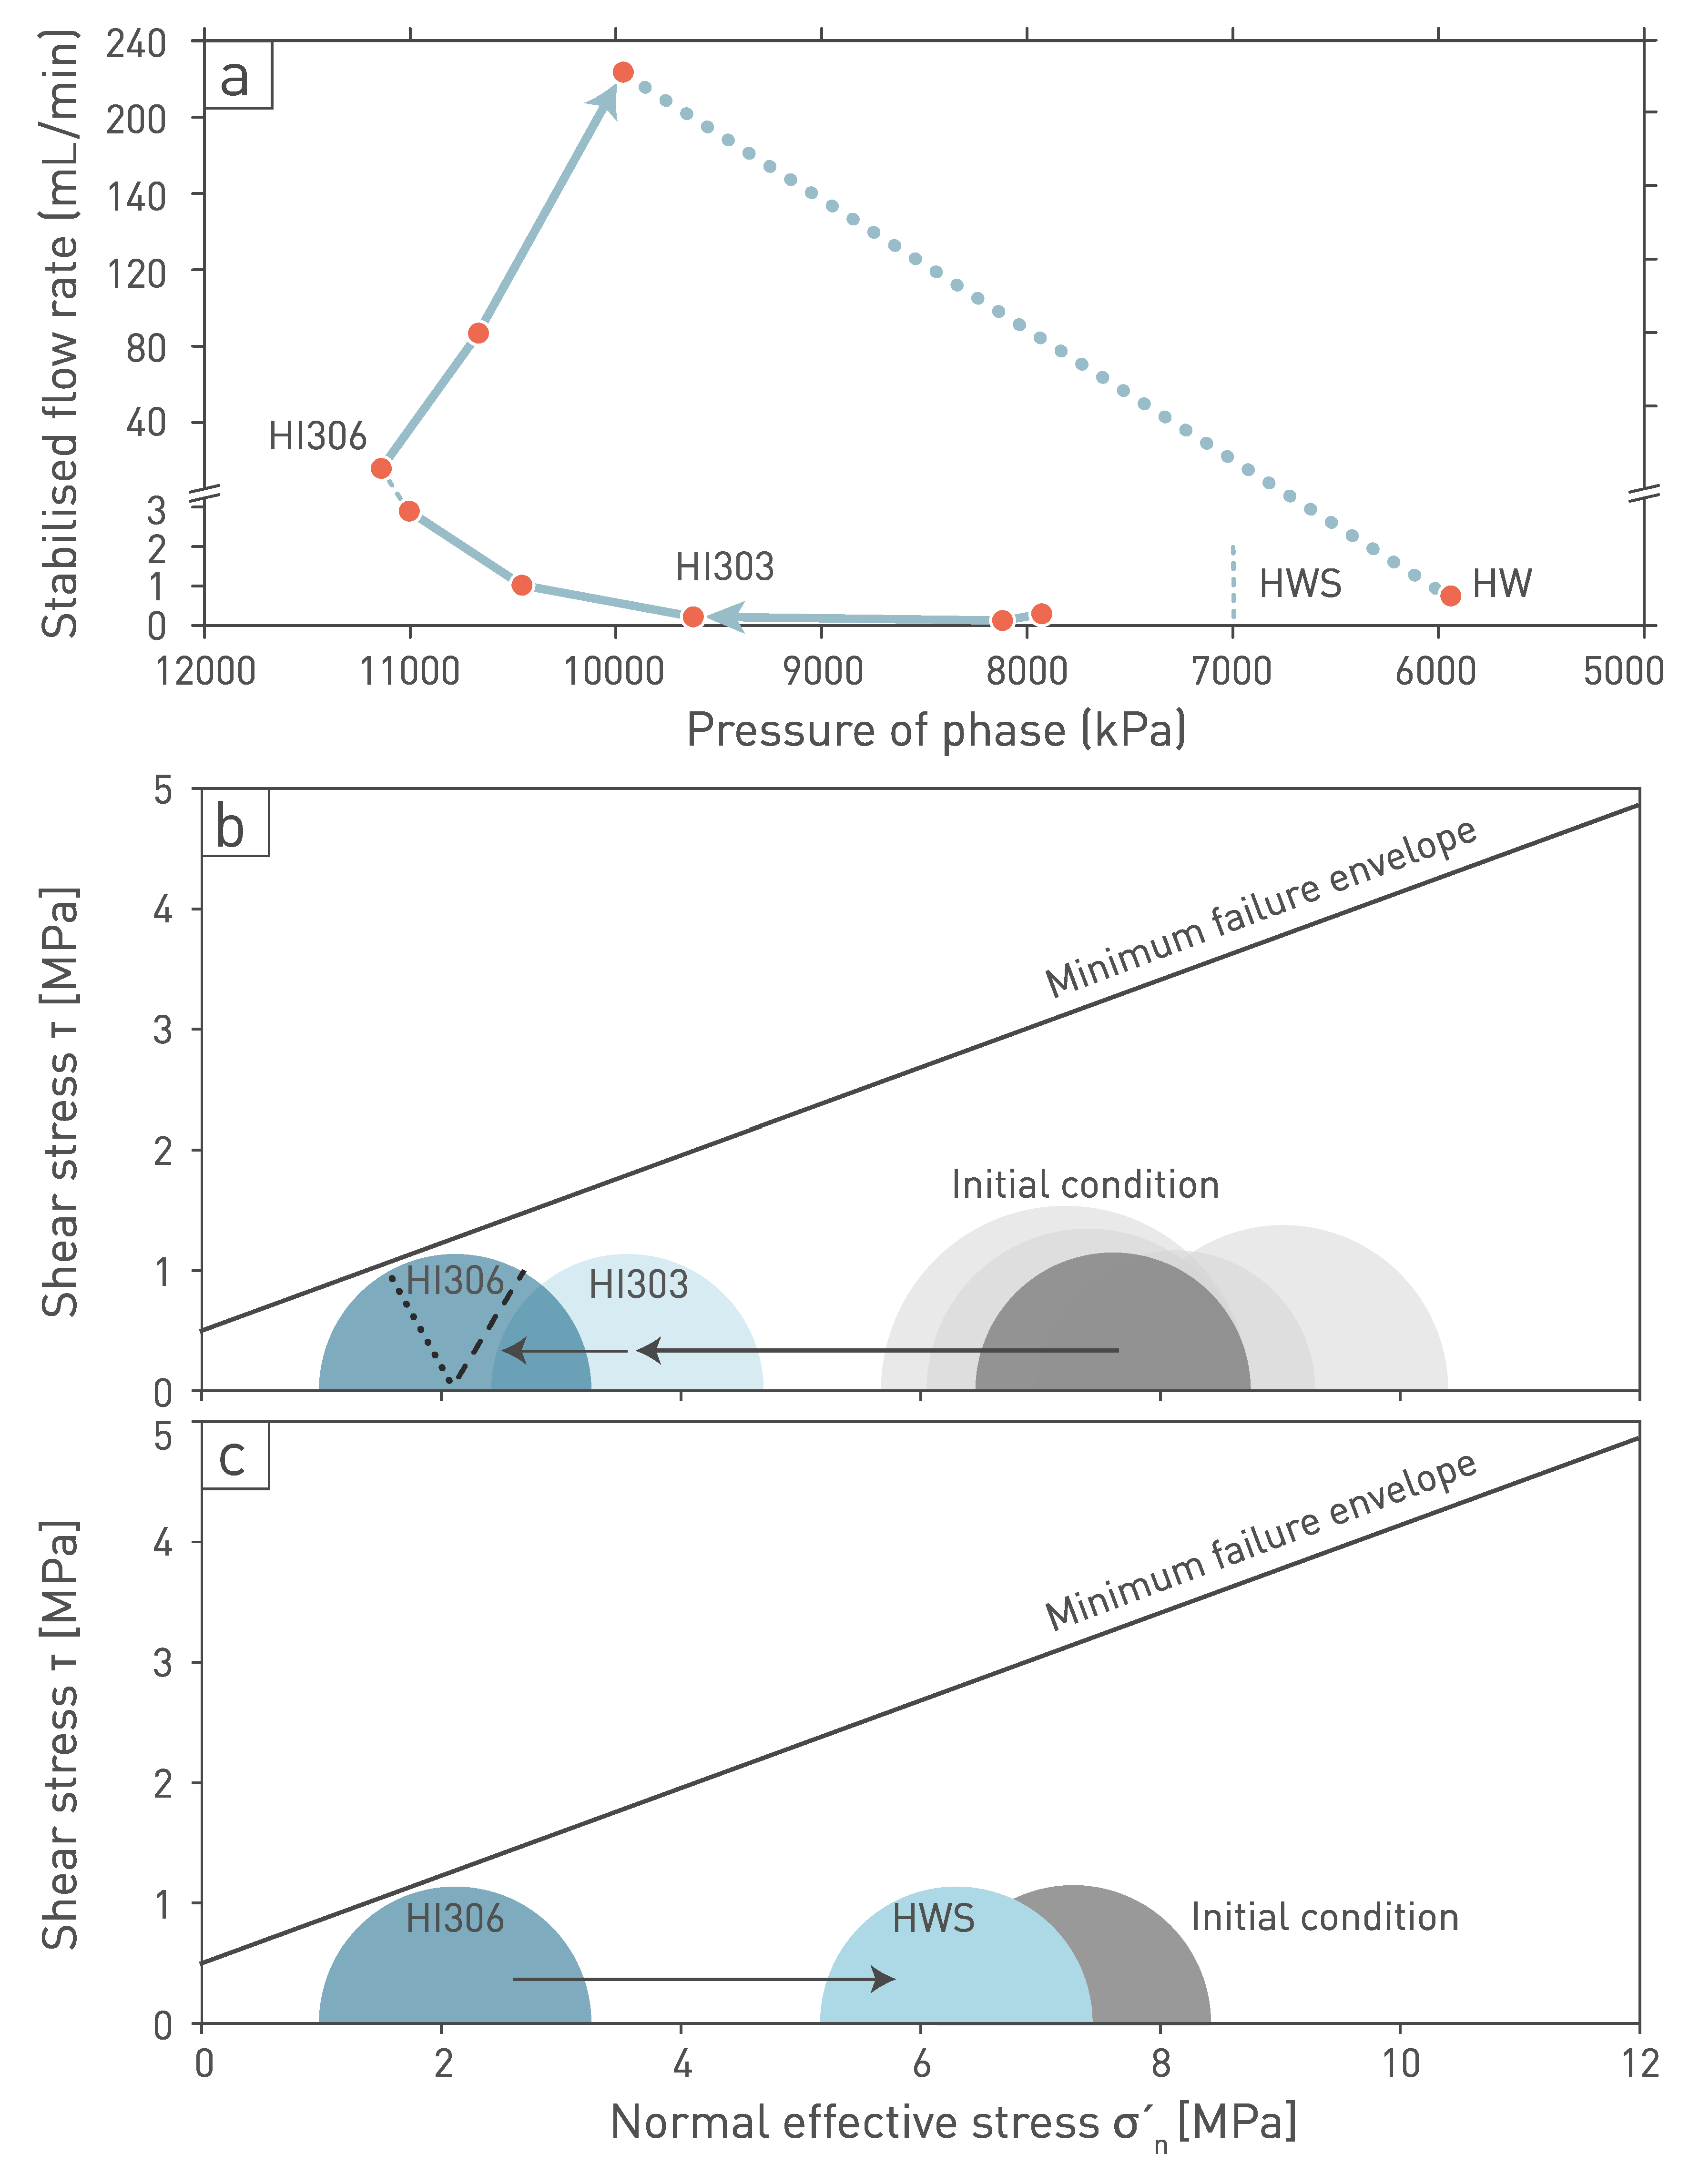
Fig. 5‑48:Relationship of fault-related flow and effective stress in the Opalinus Clay at the RHE1 borehole at approximately 580 m depth below ground
(a) Flow rate as a function of interval pressure (Nagra (ed.) 2023b, Dossier VII, RHE1). (b) and (c) show changes to the effective stresses and relationship to the Opalinus Clay minimum failure envelope as constrained from triaxial testing (Section 5.5.3). Mohr circles show stress field according to stress modelling results (Nagra 2024o). Dashed lines in figure (b) depict positions of fault dips between 30 and 60º on the Mohr circles. HI: constant head injection test, HW: withdrawal test (applying constant differential head), HWS: pressure recovery after constant head withdrawal test.
To summarise the points above, the critical factors for robust self-sealing are i) availability of water or brine, ii) a minimum effective stress, and iii) sufficient clay minerals in the rock matrix (Fig. 5‑22). Points ii) and iii) relate predominantly to the swelling mechanism, which in turn may be influenced by other aspects that are briefly discussed here.
Water chemistry: It is standard practice at the Mont Terri rock laboratory to use only compressed air as "drilling fluid" to evacuate cuttings, because water-based drilling fluids are known to result in swelling and disintegration of the borehole wall. The water chemistry, or concentration of ions in the porewater (also termed ionic strength), exerts a certain control on the swelling behaviour of clays, affecting mainly the osmotic swelling (Madsen & Müller-Vonmoos 1989). However, studies on more compacted clay-rich rocks, and on the Opalinus Clay in particular, have demonstrated that salinity has a moderate influence on swelling capacity unless water with very different chemistry to the in-situ porewater chemistry (Section 5.4.3) is used (Hauber et al. 2005, Ewy 2015, Delage & Belmokhtar 2022, Favero 2017, Barakat et al. 2024), and the porewater in the Opalinus Clay is chemically buffered (Section 5.4.6). Conversely, immersion tests showed rapid swelling and degradation of the Opalinus Clay even with a balanced porewater (Seiphoori 2019a). Hence, swelling can only be prevented when non-reactive fluids are used (Ewy 2015, Wenning et al. 2021a). For this reason, non-polar, non-wetting and volatile hydrocarbons are also used for gentle sample preparation for laboratory tests.
Clay mineralogy: The more actively swelling clay minerals in the Opalinus Clay and the clay-mineral-rich confining units are the smectite-illite (Ill/Sm) interlayers, with approximately 20 – 25 wt.-% of total clay minerals. The amount of the smectite endmember is approximately 6 – 8 wt.-%, and this proportion is fairly constant in the Opalinus Clay both in the vertical direction and between boreholes and sites (Section 5.2.4). However, as pointed out by Madsen & Nüesch (1989), swelling is related not only to the activity of clay minerals but essentially to the water-accessible clay mineral surface, and therefore non-active clay minerals (e.g. kaolinite) also contribute to the process, but to a much lesser extent.
Temperature: Experiments on fractured Opalinus Clay and Callovo-Oxfordian claystone have demonstrated no significant effect on the swelling behaviour of samples heated up to 90 °C, other than the expected change in hydraulic conductivity because of viscosity change (e.g. Zhang 2013, Favero et al. 2016, Favero 2017, Gbewade et al. 2024). A temperature of 90 °C is roughly comparable to the maximum temperature that can be expected by future thermal loading in the vicinity of high-level waste drifts (Bosch et al. 2023). The maximum temperature of the Opalinus Clay in its geological history was slightly higher (just above 100 °C, Sections 4.3.5 and 4.7.4).
Fault gouge material: The bulk of the evidence from laboratory and in-situ tests detailed above relates to discrete fractures or displacement surfaces. Larger faults or fault zones additionally consist of variable, sometimes highly fractured and de-structured rock from mechanical wear ("fault gouge") with a higher porosity than the strongly compacted intact rock (e.g. Nagra 2002, Orellana et al. 2022). Similarly, swelling in the vicinity of fractures can de-structure the rock and lead to an overall porosity increase in the matrix (Fig. 5‑45). Laboratory tests with ground and remoulded Opalinus Clay have demonstrated swelling indexes of approximately 0.03 to 0.08, i.e. approximately one order of magnitude greater than for intact material (Fig. 5‑22; Favero et al. 2016, Crisci et al. 2019). The stronger swelling can be explained by the mechanical grinding process removing diagenetic features such as grain interlocking and bonding.
As emphasised in Section 5.7.3, swelling is associated with a local increase in porosity to compensate for the fracture-related void increase. Crushed and recompacted Opalinus Clay was also used to estimate corresponding conductivity values at different stages of compaction. These tests show very low hydraulic conductivities even at much greater (matrix) porosities than those observed in natural examples (boreholes and Mont Terri). Although the method of grinding and compacting the material and the mineralogy led to some variability, it is found that, even for a porosity of 0.30, the hydraulic conductivity remains very low (< 1 × 10-11 m/s; Fig. 5‑49). A value of 0.30 would be higher than the porosities reported for fault gouges in the Opalinus Clay at Mont Terri (< 0.23; Orellana et al. 2022, Nagra 2002).
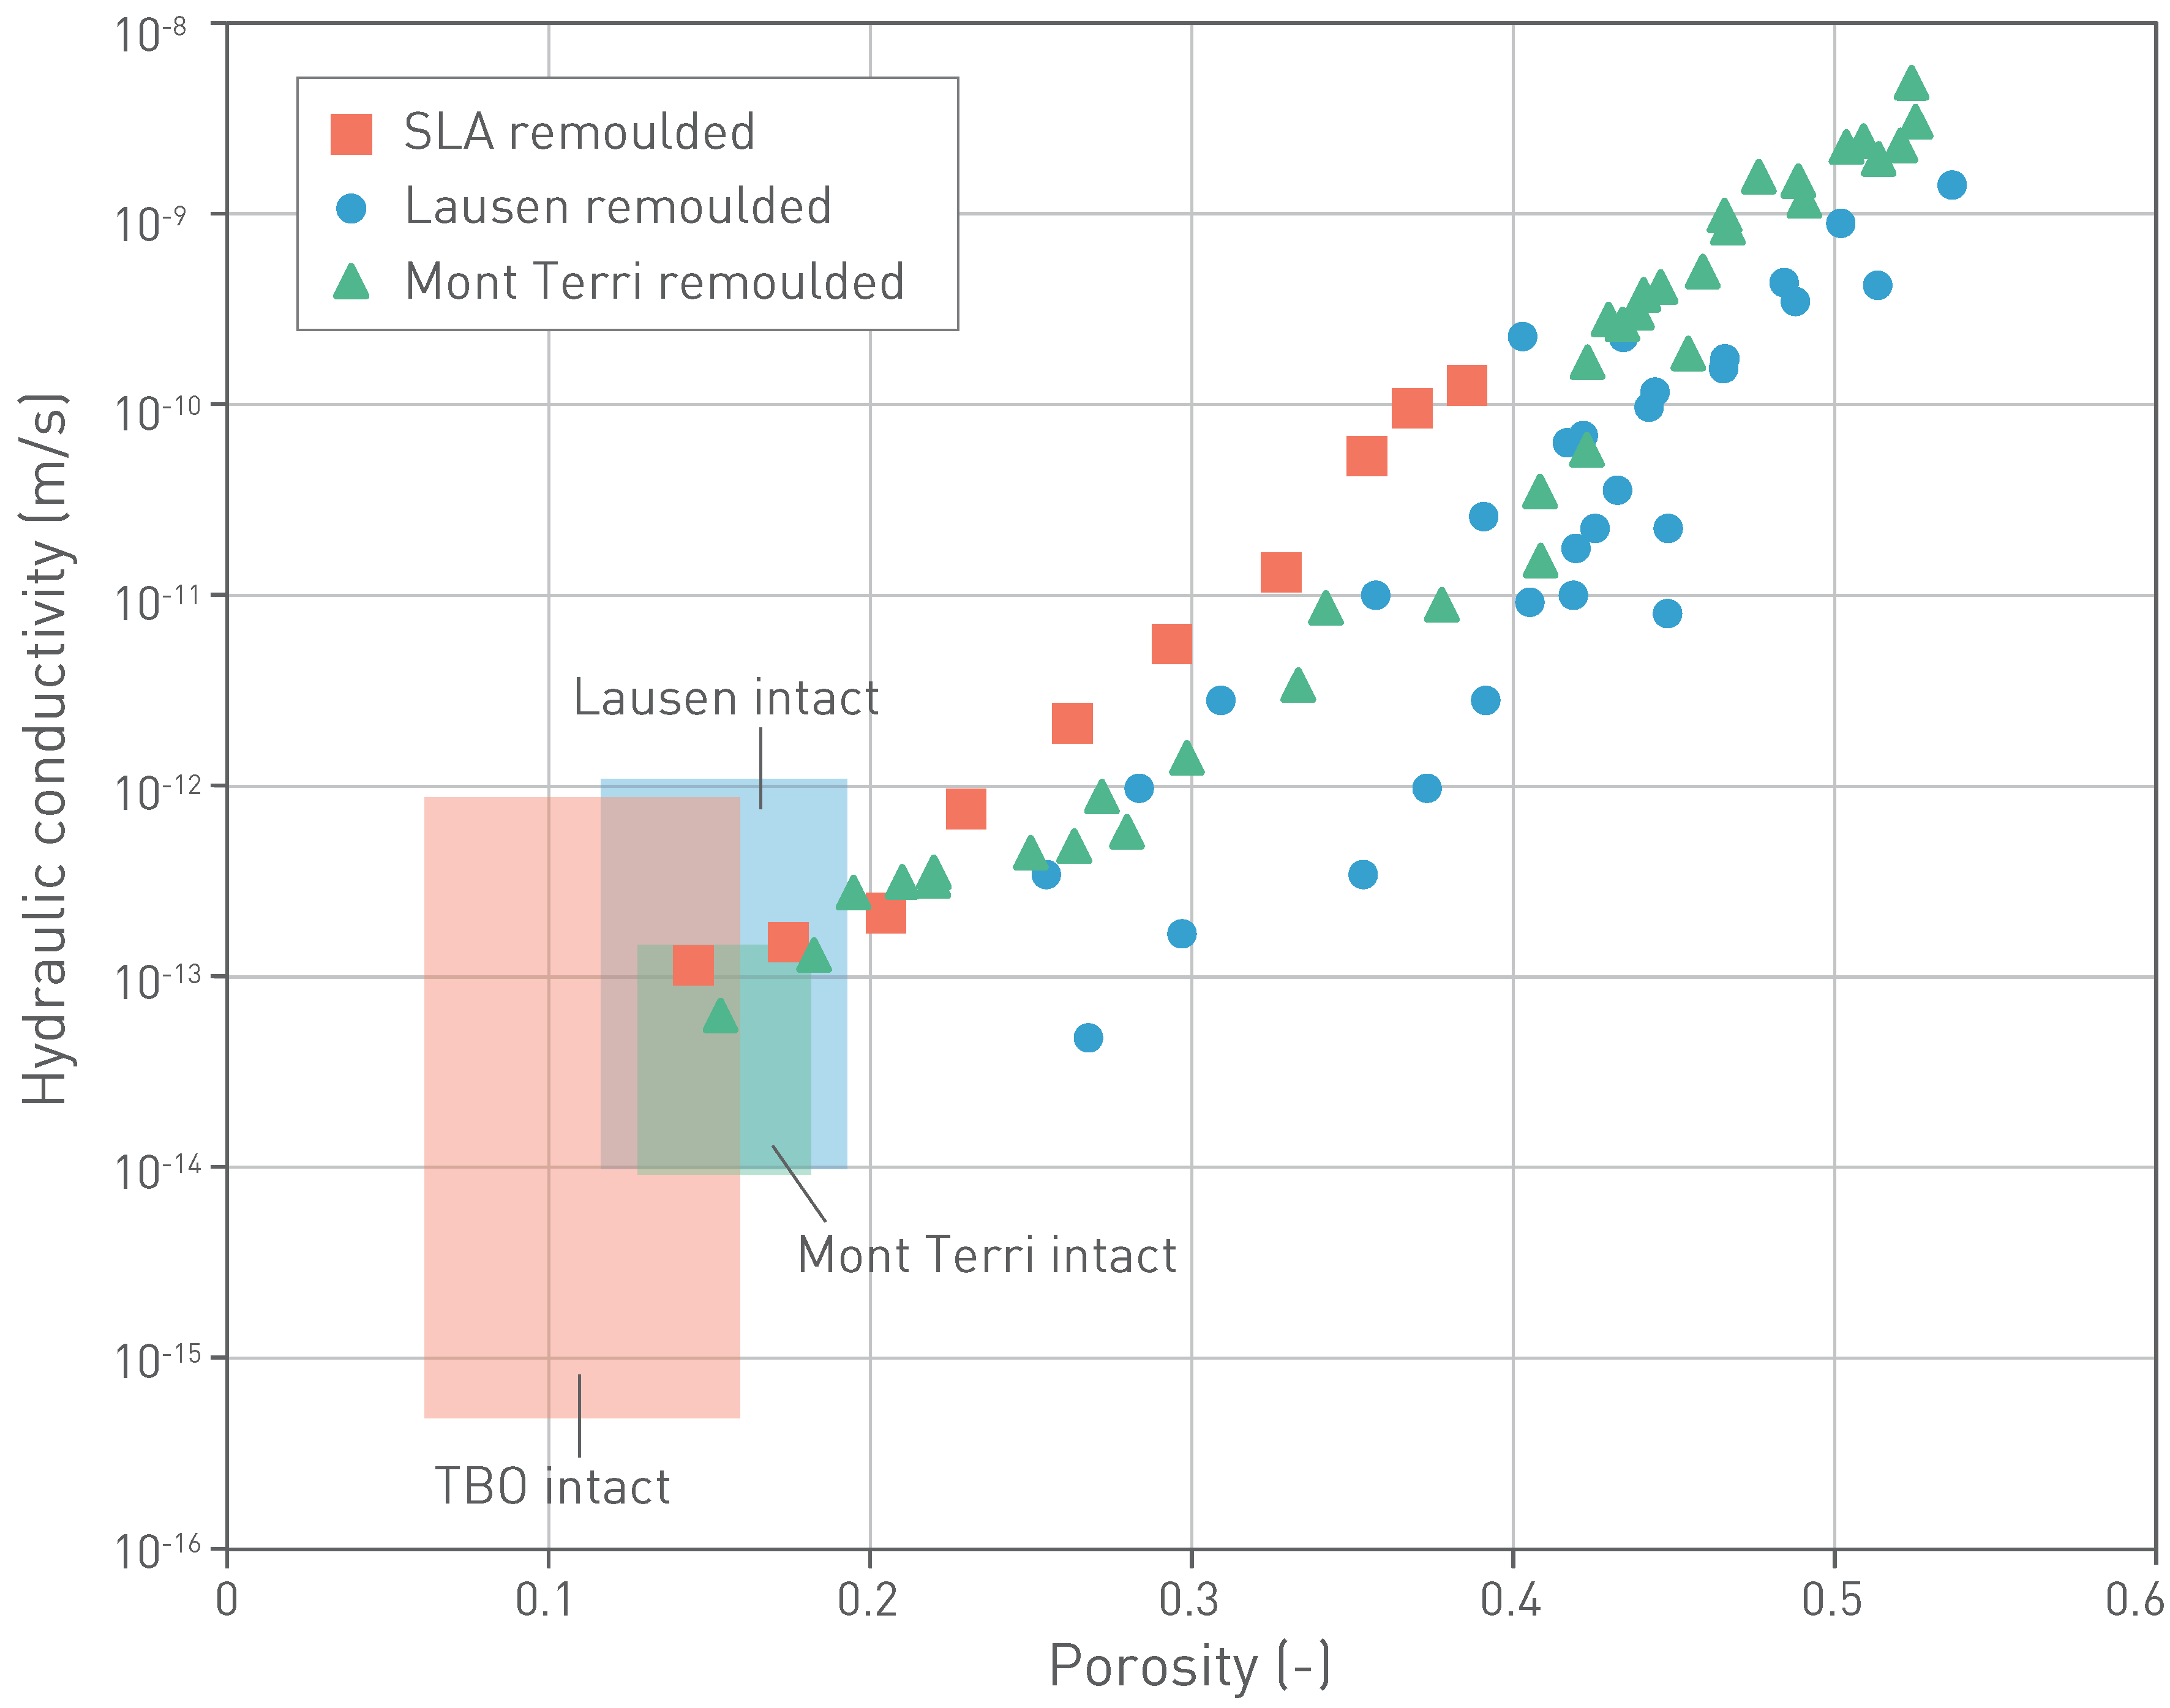
Fig. 5‑49:Relationship between porosity and hydraulic conductivity in crushed and recompacted ("remoulded") Opalinus Clay
Individual points show results at different stages of reconsolidation (compilation after Seiphoori 2019b). Data points from Lausen cover two different tests. Rectangles show values of intact Opalinus Clay by provenance for comparison.
Mineralised fractures (veins) in the Opalinus Clay are found in all boreholes of the TBO programme (Sections 4.7.4, 4.7.5 and 5.5.4). They are very thin (> 90% are thinner than 2 mm; Sections 4.7.3 and 5.5.4), macroscopically closed and show no detectable effect on the results of hydraulic testing (Section 5.6.3). Larger veins (up to centimetres in thickness) as depicted in Fig. 5‑31 are extremely rare and vary strongly in thickness and continuity even at the core scale.
Veins are observed in clay-rich rocks or shales worldwide (e.g. Cobbold et al. 2013, Gale et al. 2014). They are typically interpreted to have formed by precipitation from supersaturated aqueous solutions in the dilatational fractures (e.g. Bons et al. 2012), with precipitation and mineral growth leading to clogging of voids and essentially acting as a sealing mechanism (Bock et al. 2010; Section 5.7.3). However, mineral growth may also have been concurrent with fracture opening, as has been proposed for bedding-parallel «beef» structures in shales (Cobbold & Rodrigues 2007, Cobbold et al. 2013), that is with no open space for veins to grow into. Irregular, multi-stranded veins have also been considered to represent dewatering structures during early burial of fluid-overpressured mudstones (Lorenz & Cooper 2018). What all the models seem to have in common is that the local effective stress at the time of vein formation was probably quite low to allow for volume expansion (Fig. 5‑24), either with or without fluid overpressure.
Low effective stress conditions can occur during the early stage of burial, especially during rapid sedimentation (Section 4.1) and burial as inferred for the Middle Jurassic (Section 4.3.5). Together with the apparent thermal anomaly in the Late Jurassic to Early Cretaceous, this has probably caused temporary fluid overpressure from disequilibrium compaction. The geochemical signature of vein cements from the Lias and Dogger Groups and formation temperature (Akker et al. 2023) are consistent with such a conceptual model. Also, some of the matrix cement in the Opalinus Clay is attributed to such an early phase of burial (Section 5.2.5). Another phase of rapid burial occurred during the Oligocene and Early Miocene (Section 4.3.5).
Fluid overpressure may also have been triggered from the transformation of mineral reactions. For the Opalinus Clay, this could mainly concern the smectite to smectite-illite transformation with release of structurally bound water (Nadeau et al. 2005).
Tectonic loading may also have increased pore fluid pressure in the Opalinus Clay, provided that the loading rate was fast enough with respect to the drainage capacity or fluid dissipation rate (Section 5.5.3). But, as highlighted in the conceptual figure in Section 4.4, lateral tectonic loading has a stronger effect on stresses in the more competent layers (Malm, Keuper and Muschelkalk Groups). In other words, the stress field in the Opalinus Clay is somewhat shielded by these more competent layers. A certain degree of plastic deformation was also accommodated in the Opalinus Clay during the Miocene to present-day shortening.
There are substantial quantities of calcite in the Opalinus Clay (Section 5.2) and the porewater in the Opalinus Clay today is saturated in calcite and could therefore provide a local source for vein precipitates (Section 4.7). However, it remains unclear whether the existing veins formed in a closed system. Veins in the Opalinus Clay formed at higher or much higher temperatures than the present-day in-situ temperature, with plausible formation ages greater than 5 million years (Section 4.7.4), with most veins probably forming during the Late Jurassic – Cretaceous, and later during Eocene – Miocene times (Section 4.3.5).
Vein formation in the Opalinus Clay at low effective stress is also consistent with a minimum effective stress threshold required for robust self-sealing (see Section 5.7.4). Fracture closure is expected to occur quickly if low effective stress (high fluid pressure) is not maintained, and the rate of swelling is dependent on water supply. If the latter is slow, swelling is slowed down, but this can only occur in a tight ("closed") system, i.e. where water supply from the adjacent rock is low. In contrast, if water supply is ensured, a significant reduction in transmissivity will be fast, i.e. over days in laboratory experiments (e.g. Fig. 5‑43) and weeks to months in field experiments (Nagra 2014d, Lanyon et al. 2014).
The rate of self-sealing by swelling also depends on the width of the fractures generated during deformation. But, as elaborated in Section 5.5, deformation in the Opalinus Clay is characterised by a relatively low brittleness (low softening, low dilation angle), and more distributed deformation with low fracture width. These aspects also favour rapid self-sealing.
In summary, keeping in mind that veins record the integrated burial and tectonic history since the time of deposition, the following conclusions can be drawn:
-
Veins in the Opalinus Clay are rare, generally very thin, often discontinuous at core and outcrop scale and, because of soft-linked accommodation of deformation, are poorly interconnected, i.e. they are hydraulically insignificant.
-
Their formation is probably associated with low effective stress conditions, which were particularly prevalent during early diagenesis and burial in the Middle and Late Jurassic, and again during the Oligocene and Miocene. As in the clay-rich rocks in the Lias and Dogger Groups, it is probable that many veins in the Opalinus Clay are old (> 5 Ma) to very old structures (> 100 Ma). This interpretation is also consistent with tracer profiles (Section 4.6), suggesting that transport is diffusion-controlled also across intervals of the Opalinus Clay containing veins.
-
Today’s porewater is saturated in calcite and could provide a local source of vein formation without the need for an external water source.
-
At present depths in the siting regions, the effective stress conditions (Section 4.4) are well above the critical effective stresses of 2 – 3 MPa at which relevant modifications to the self-sealing potential could be expected (Section 5.7.4), and therefore the key mechanisms for robust self-sealing are expected to operate at the rate at which water can be supplied.
As a result of the high self-sealing potential of the Opalinus Clay, and of clay-rich rocks in general, fractures have a much lower significance as a threat to barrier integrity than fractures in other low-permeability rocks also considered as host rocks for a deep geological repository (e.g. granitic rocks).
Clay-mineral content is a very good indicator for the self-sealing potential of the Opalinus Clay and the confining units for the disposal depths considered in all the siting regions. Rocks with a clay-mineral content greater than about 40 wt.-% have a high self-sealing potential, and rocks with clay-mineral contents less than about 20 wt.-% have low or negligible self-sealing potential.
At the tunnel scale (several metres), self-sealing potential in the Opalinus Clay is high throughout the formation at all the sites. In contrast, some facies in the confining units have low or even negligible self-sealing potential over distances much larger than the tunnel scale.
The other key variable controlling the self-sealing potential is the stress field. The stress field can be considered favourable for robust self-sealing of the Opalinus Clay in all the siting regions at current depths.
The timescale over which self-sealing mechanisms operate depends on the ability of the rock to equilibrate water pressure in the disturbed area. Fracture closure can occur immediately upon a reduction in fluid pressure (or effective stress) and is followed by slower time-dependent mechanisms (especially swelling) over days to years.
For the long-term evolution of the repository, a residual overburden thickness of 200 m can be considered reliable for self-sealing in the Opalinus Clay. If the overburden thickness is reduced to 50 – 100 m, self-sealing may be limited, and if the overburden thickness is only 20 – 30 m, it is hardly or no longer effective.
Key points:
- In the Opalinus Clay, the diffusion coefficient for the water tracer HTO shows minor variation and is well comparable among the different sites. Owing to differences in porewater ionic strength, the effective diffusion coefficient for chloride shows site-specific differences with lowest values in JO (more pronounced anion exclusion).
- The validity of diffusion properties is established at different scales of space and time: Consistent diffusion properties are observed in small-scale lab experiments and in-situ experiments in the Mont Terri rock laboratory.
- The laboratory diffusion coefficients contribute to plausible modelling of the formation-scale profiles of natural tracers in porewater that evolved over geological timescales.
- Diffusion properties can be estimated from clay-mineral content or porosity.
Hydraulic conductivities of the Opalinus Clay and the surrounding rocks are very low. Accordingly, molecular diffusion is an important, or even the major, process by which radionuclides may be transported towards aquifers.
The modelling of the diffusive solute flux relies on appropriate diffusion coefficients. Diffusion coefficients for weakly- or non-sorbing species are typically determined in the laboratory using small, centimetre-sized samples and experimental setups that last from weeks to a few months. Field experiments in underground rock laboratories provide larger spatial scales (dm – m) and longer timescales (up to a few years) to validate laboratory parameters. Finally, profiles of natural tracers from deep boreholes provide a possibility to deduce transport processes at the formation scale (Section 4.6). This section presents and discusses diffusion parameters obtained in laboratory and field experiments and relates them to other rock properties.
This section forms the main basis for the parameterisation and process understanding.
At the laboratory scale, diffusion coefficients are most often estimated from through-diffusion experiments (e.g. Van Loon et al. 2023) that last over a few weeks to a few months. In such experiments, a rock sample with a thickness of one to a few centimetres is sandwiched between two solution reservoirs. The inlet reservoir is spiked with a tracer (e.g. HTO or 36Cl), while the breakthrough and the flux of the tracer through the sample is observed in the outlet reservoir. One difficulty of such experiments is that the solution used in the reservoirs should match the porewater with respect to the main ions, to avoid geochemical reactions and effects of coupled diffusion of several ions (multi-component diffusion). From the analysis of the temporal evolution of the tracer flux, the effective diffusion coefficient ε as well as the accessible porosity can be estimated. Slightly different setups exist that allow the diffusion coefficients to be derived either perpendicular or parallel to bedding.
Diffusion coefficients of solutes in rocks depend on the porosity of the rock and the tortuous pore pathway, and possibly also on interactions with the solid surfaces. The effective diffusion coefficient De of a non-sorbing solute can be given as:
with ε the (water-filled or accessible) porosity, Dp the pore diffusion coefficient, Dw the diffusion coefficient in bulk water, and G the geometric factor (often also called tortuosity) that depends on the pore structure and connectivity of the rock. The effective diffusion coefficient De is generally smaller than Dp as ε is smaller than 1. Because clays have negatively charged surfaces, anions are partly excluded from the pore space near the surfaces (Section 5.4). Thus, their accessible porosity is typically smaller than the water-filled porosity, and their tortuosity larger than that of a water tracer. As a result, the values of De and Dp of an anion (e.g. Cl) tend to be smaller than those of a water tracer (e.g. HTO), and the values of the geometric factor (tortuosity) G of an anion tend to be larger than those of a water tracer (conceptual model in Fig. 5‑17).
No cation diffusion data are presented here. For the sake of completeness, it is simply noted that the negative surface charge of clay minerals is also responsible for the sorption of cations in clay-rich rocks, and thus diffusive transport of cations is typically retarded compared to diffusion of HTO. If non-specific sorption in the diffuse layer near charged surfaces is important (Fig. 5‑17), the effective diffusion coefficient of cations such as, for instance, Na can be larger than that of a water tracer, as Na in the diffuse layer remains mobile and contributes to the total cation flux, in addition to the Na in the porewater. This effect depends on the ionic strength of the porewater (larger for low ionic strength, for instance Glaus et al. 2024).
A large number of laboratory diffusion experiments has been performed on samples from the deep drilling campaign in the three siting regions (Van Loon et al. 2024, 2023). Diffusion perpendicular to bedding was investigated. The HTO and 36Cl diffusion coefficients perpendicular to bedding of all samples from the three regions are plotted as a function of depth (scaled to a reference profile for each region) in Fig. 5‑50De. The following is observed: values for 36Cl are lower than those for HTO, especially in clay-mineral-rich units. The differences tend to be larger for the JO siting region, which exhibits the lowest salinities of the porewater (Section 5.4). Both observations are related to the partial anion exclusion near the negatively charged clay-mineral surfaces, as noted above. The exclusion effect tends to be larger at the lower salinities in the JO region (lower salinities lead to thicker diffuse double layers that have low anion concentrations, or generally to larger anion exclusion, see for instance interpretation in Glaus et al. 2024). Lower diffusion coefficients of anions compared to those of the water tracer have already been reported in earlier studies for samples from the Opalinus Clay, Dogger Group above Opalinus Clay or Effingen Member in the Malm Group (see Table 2.6-1 in Nagra 2014f).
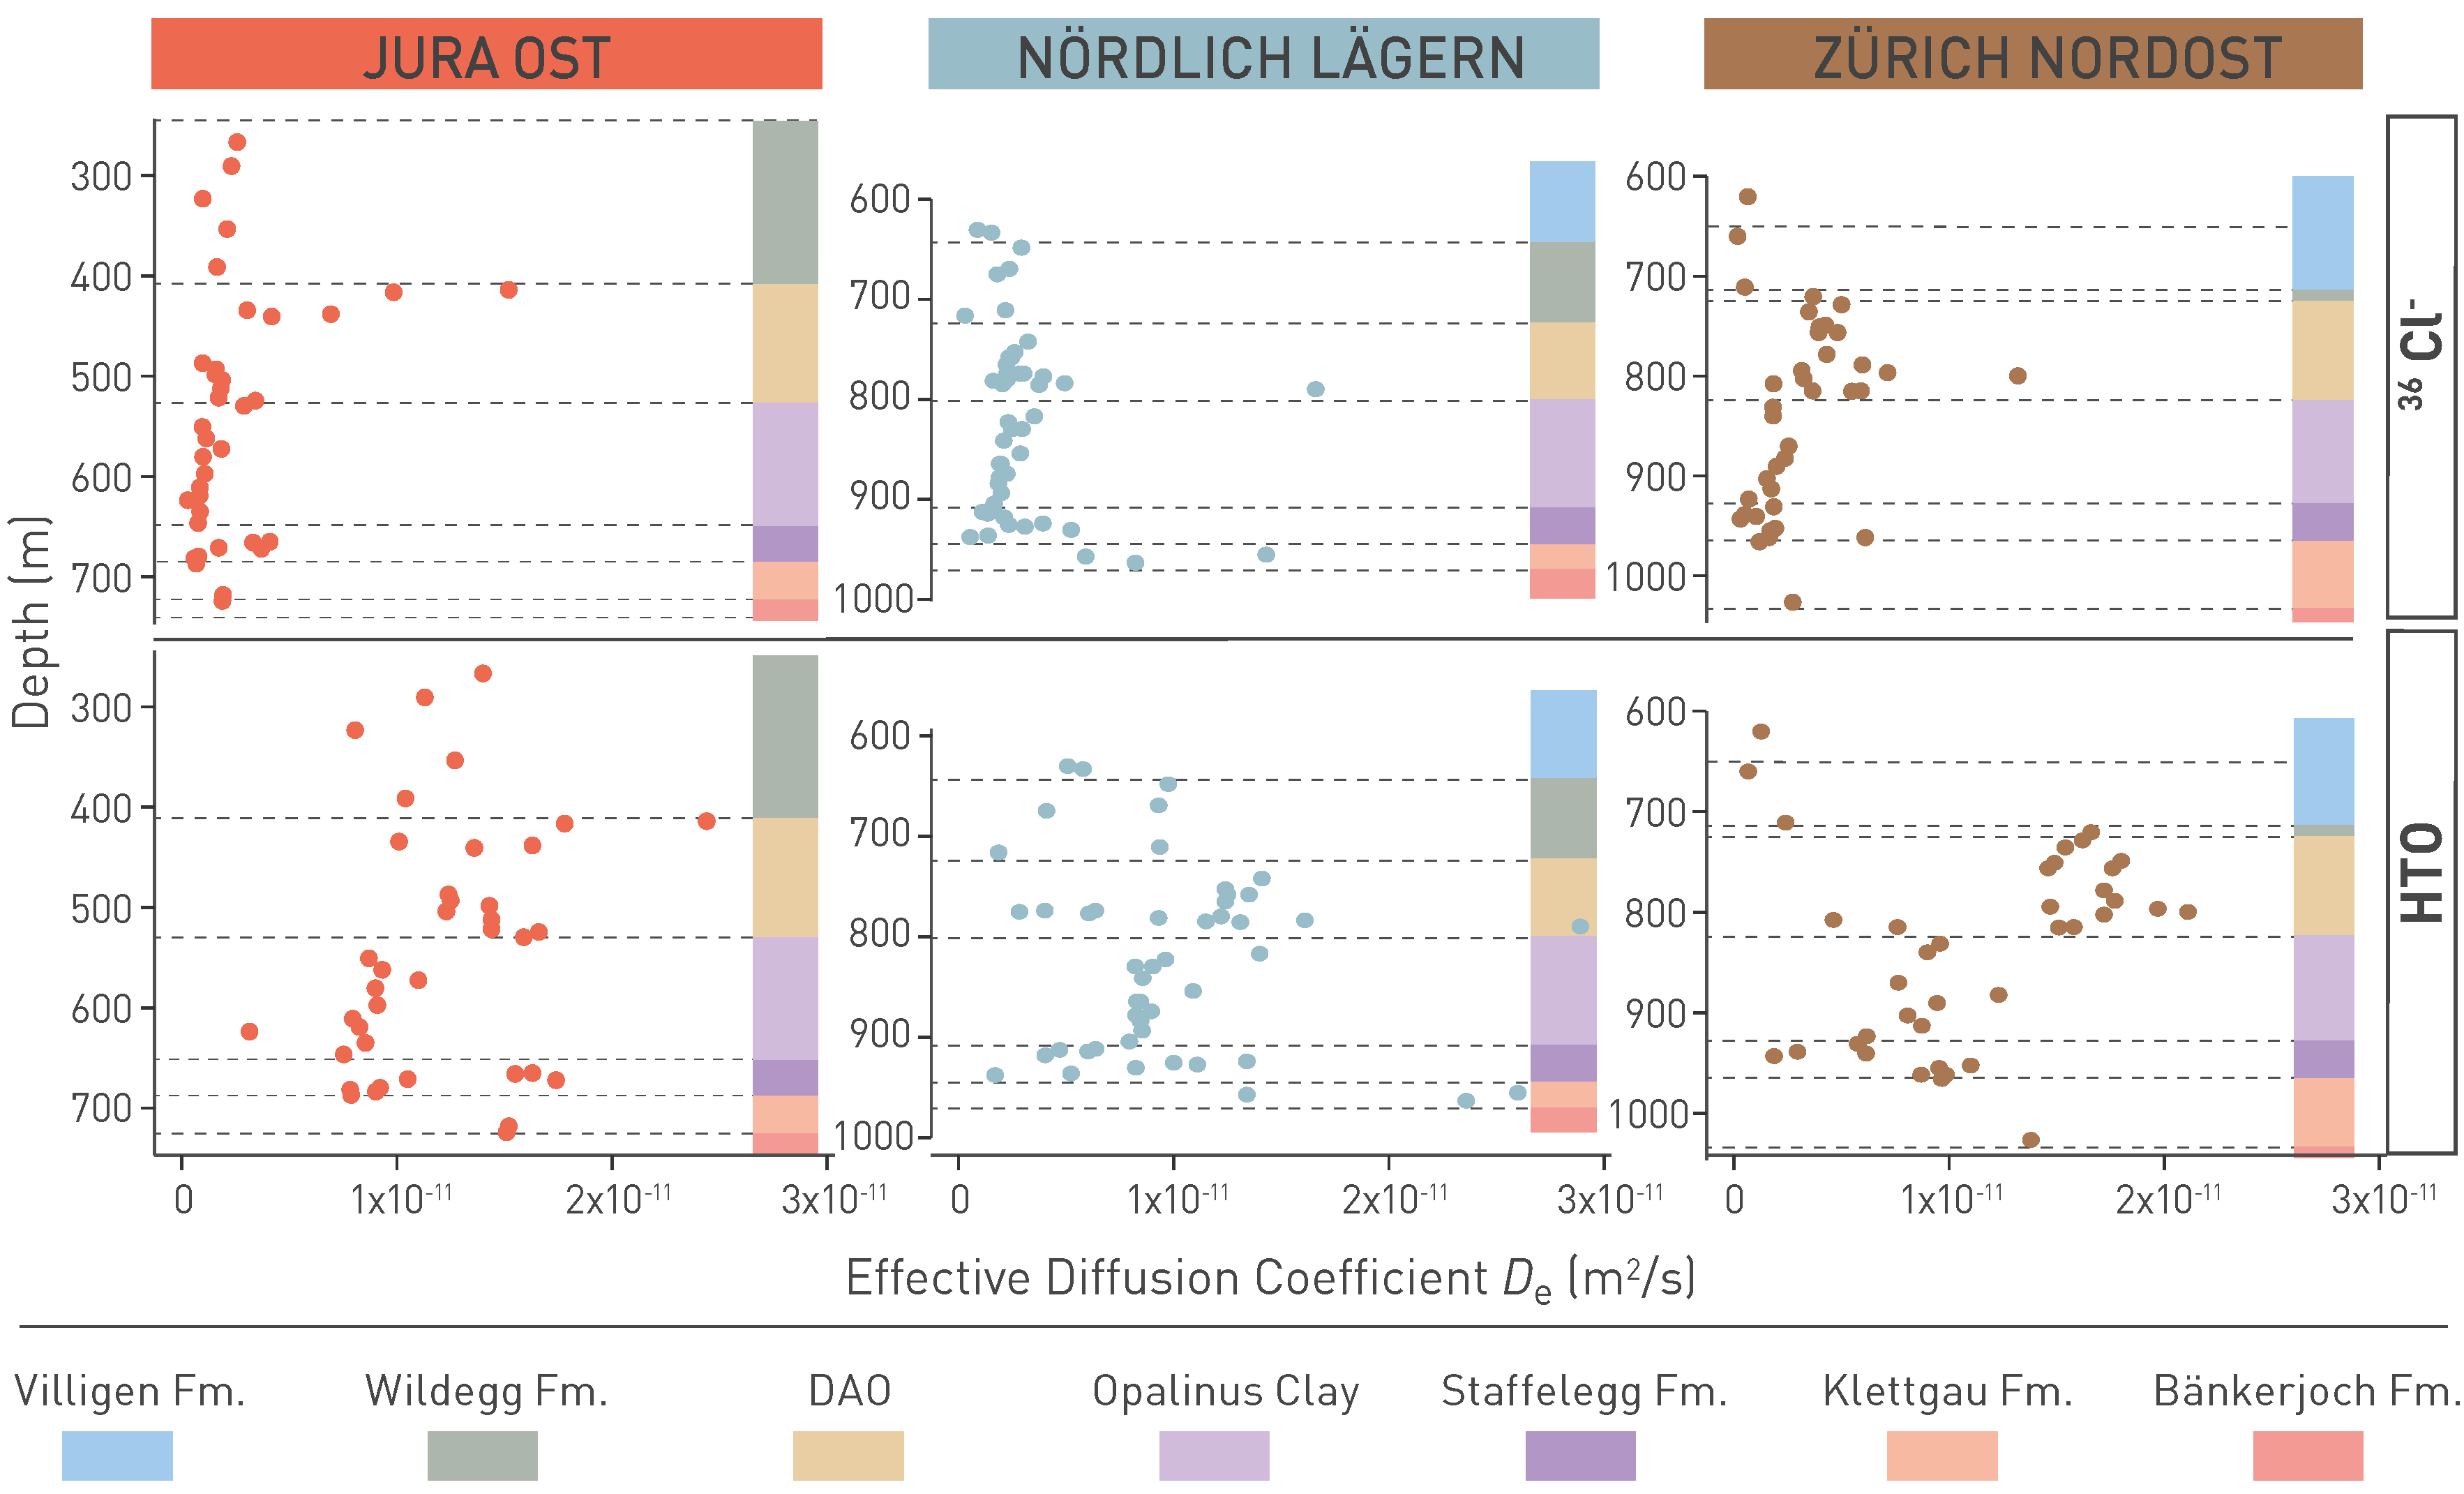
Fig. 5‑50:Measured effective diffusion coefficients De for chloride and HTO of the investigated formations in the three siting regions
Measurements were done perpendicular to bedding. The samples of a siting region are projected to a reference profile: in the case of JO to BOZ1, in the case of NL to STA2 and in the case of ZNO to TRU1. DAO: Dogger Group above Opalinus Clay, Fm.: Formation.
Box plots illustrating the range of the diffusion coefficients De perpendicular to bedding obtained for HTO and Cl in the three siting regions are shown in Fig. 5‑51. The data show again that De values for Cl are markedly smaller than those for HTO, especially in the Opalinus Clay. Furthermore, the diffusion properties of the Opalinus Clay scatter over a small range. Finally, De values for HTO are largely identical between different siting regions. For Cl, some region-specific differences result from different porewater salinities (ionic strength) as already noted above: De values of Cl in the Opalinus Clay are lower in JO than in other regions because of its lower salinity. For the less clay-mineral-rich units Dogger Group above Opalinus Clay and Lias Group, the De values of Cl scatter more, but no clear differences are seen between the different siting regions.
The anisotropy of diffusion in the Opalinus Clay from the Benken (BEN) borehole or Mont Terri was assessed with radial through-diffusion experiments in the laboratory. It is in the order of 4:1 to 6:1 (largest values for BEN), i.e. diffusion parallel to bedding is about a factor 4 to 6 faster than diffusion perpendicular to bedding (Van Loon et al. 2004a). This can be explained by the more tortuous pathway perpendicular to bedding, because the clay platelets have a large aspect ratio and tend to be aligned along the bedding.
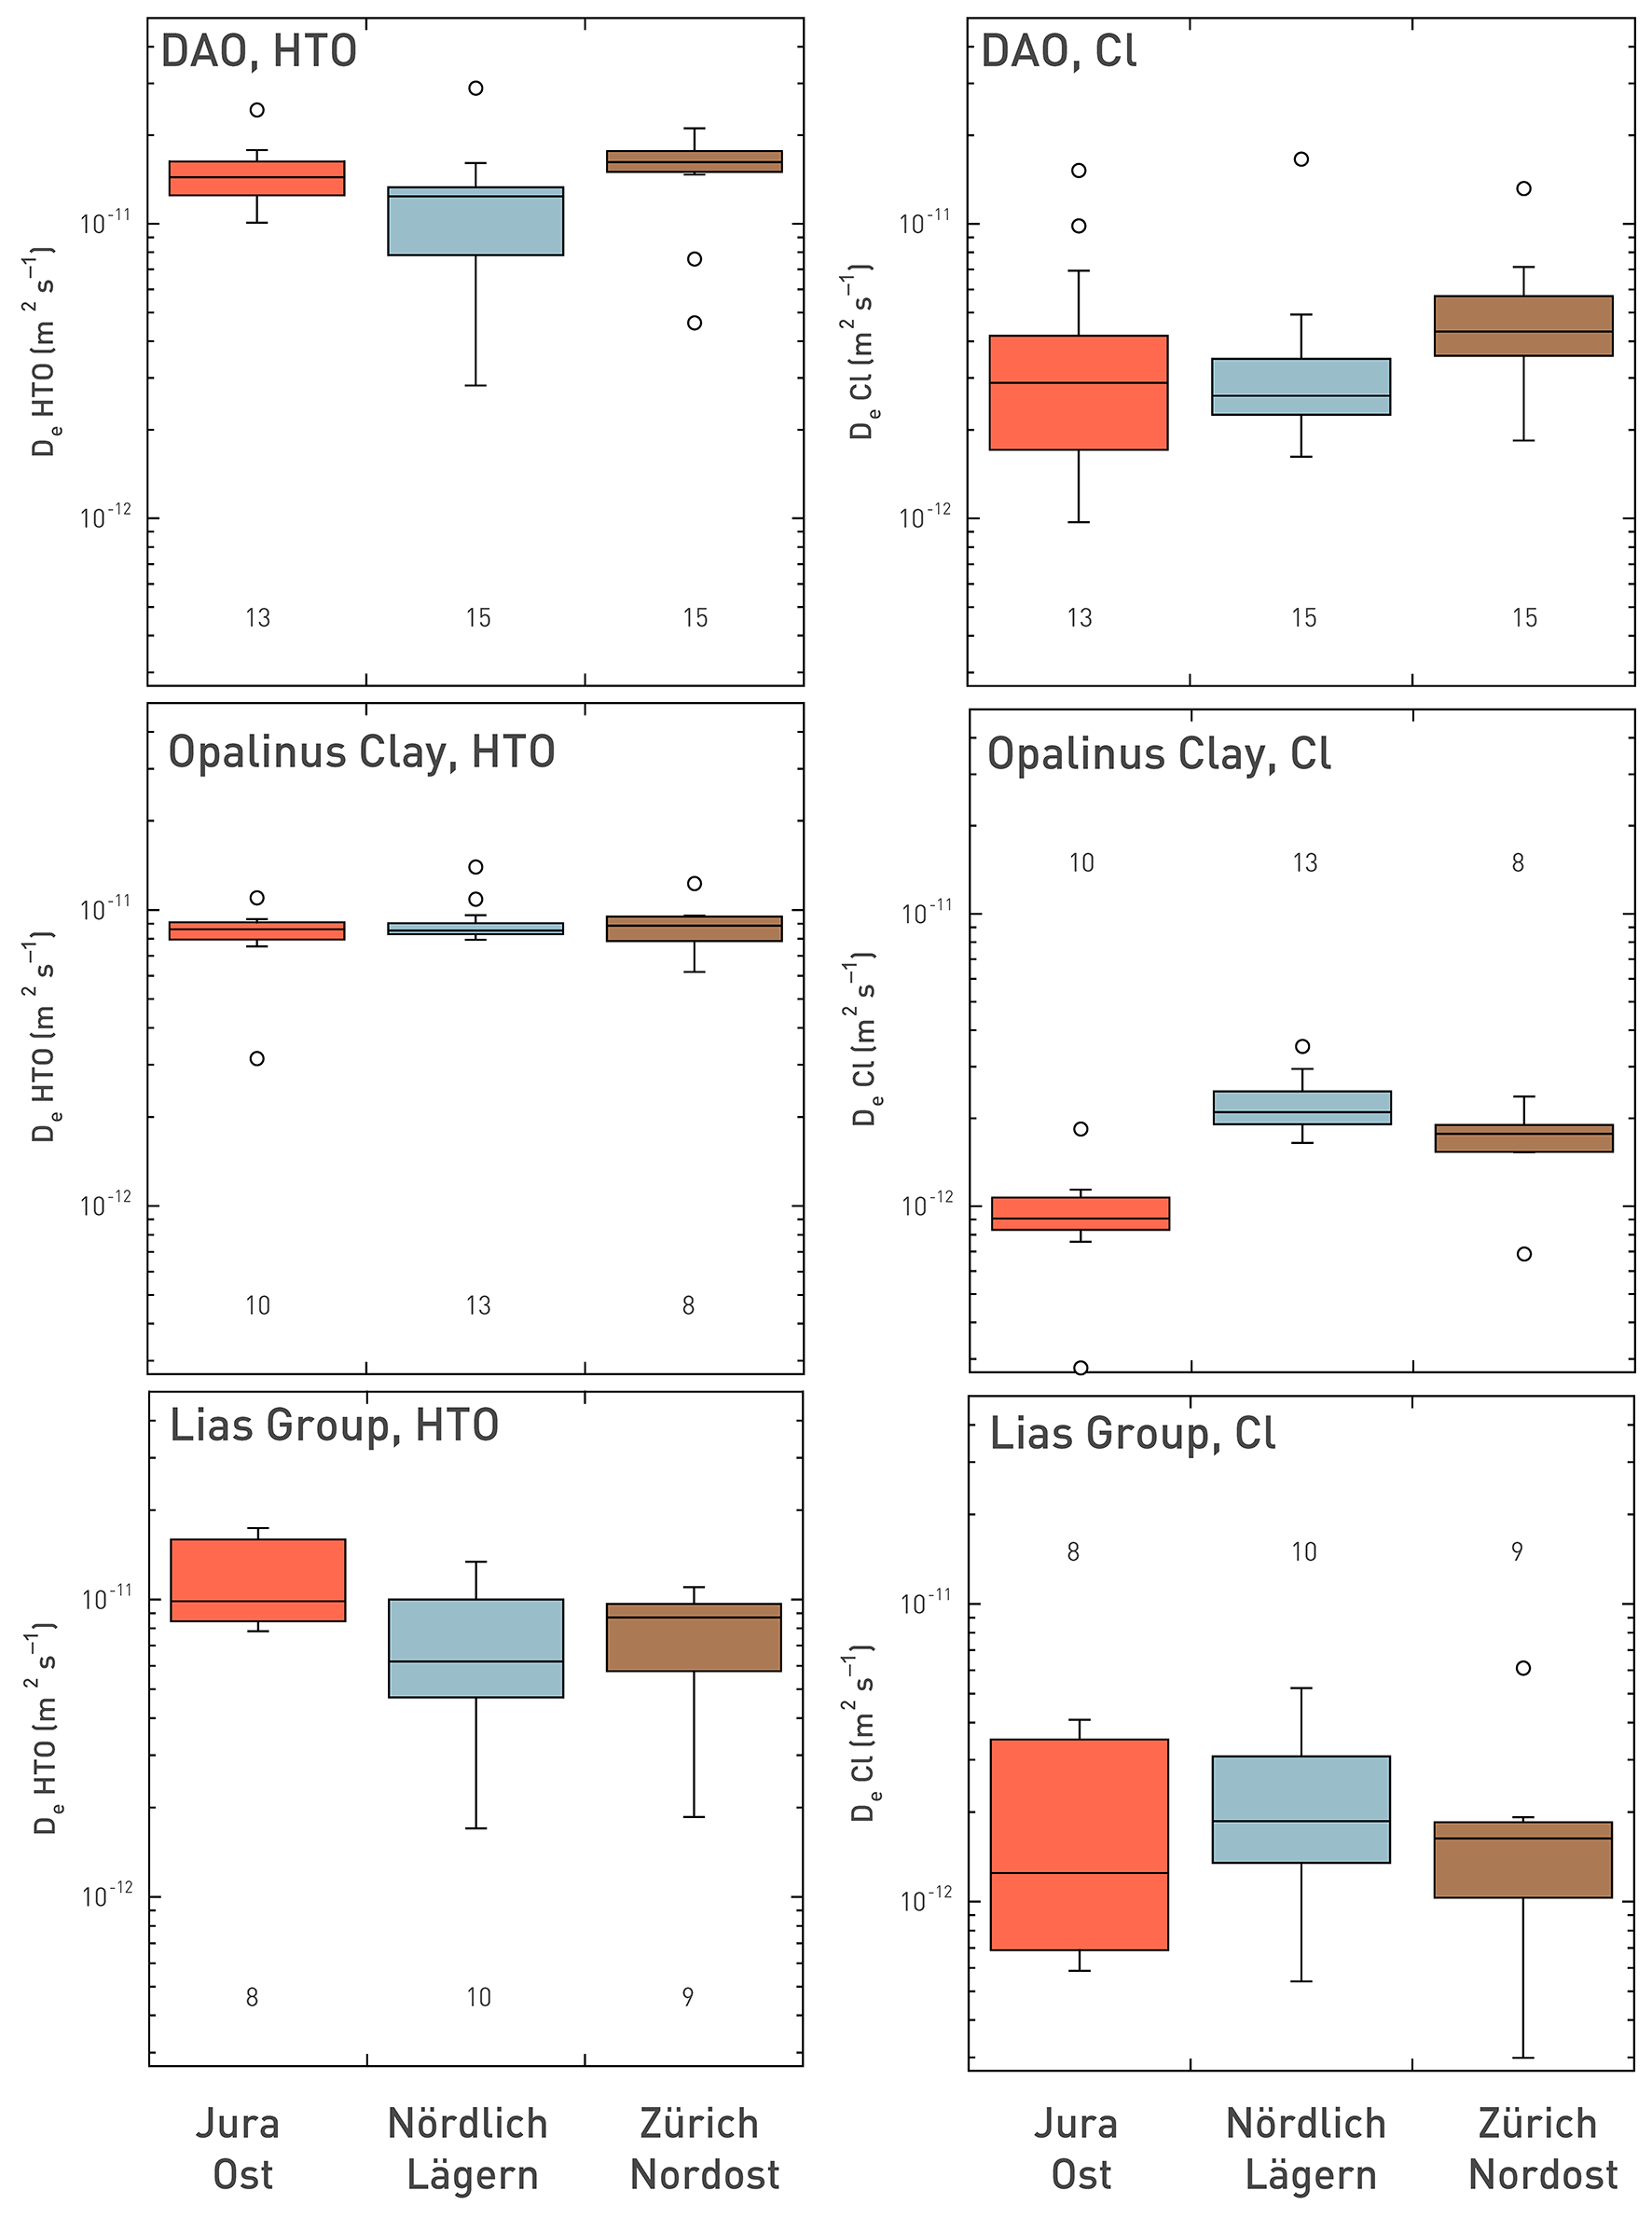
Fig. 5‑51:Box plots illustrating the range of effective diffusion coefficients De for HTO (left column) and for Cl (right column), grouped by siting regions
Measurements were done perpendicular to bedding. DAO: Dogger Group above Opalinus Clay. Each box contains 50% of the values; the horizontal line shows the median, the whiskers the minimum and maximum values within an ‘acceptable’ range (from the upper or lower box limit to ± 1.5 times the box size), the circles values outside this range. The sample number for each group is also indicated.
The accessible porosities derived from the diffusion experiments with HTO and Cl are illustrated in Fig. 5‑52. The results are also presented as box plots that show the typical range of values. It can be seen here that accessible porosities of HTO in the Opalinus Clay scatter over a small range and are very similar between the different siting regions. For the Dogger Group above Opalinus Clay and the Lias Group, the accessible porosities of HTO extend over larger ranges, which is related to the more pronounced lithological heterogeneity in these formations. The diffusion-accessible porosity of Cl in the Opalinus Clay is lower in JO compared to NL and ZNO, resulting from different porewater salinities (ionic strength effect). For the Dogger Group above Opalinus Clay and the Lias Group, the ranges are larger and no influence of the porewater salinity is seen.
Finally, the geometric factor G correlates with the clay-mineral content, both for HTO and for Cl (Fig. 5-53). The factor G becomes larger in a non-linear way with increasing clay-mineral contents. Thus, the De values inversely tend to become smaller with increasing clay-mineral contents. No simple relationship exists to fit all data. However, when excluding some outliers with comparably high tortuosity values (and corresponding low De), the relationship for G of HTO can be fitted for instance by an exponential function (R2 of 0.77) or by a polynomial of degree 4 (R2 of 0.79). Such a relationship can for instance be used to estimate G and then the diffusion coefficient De of a sample, provided its clay-mineral content and its porosity are available. Outliers with comparably large G values for HTO (and thus comparably low De values for HTO) are found in formations with specific pore configurations, such as the Rietheim Member containing considerable contents of organic matter, the Schambelen Member and the Beggingen Member of the Lias Group, or the Wedelstandstein Formation, the Passwang Formation, and the «Humphriesioolith Formation» belonging to the Dogger Group above Opalinus Clay. Many rock samples with comparably large G values for HTO (and thus low De) show at the same time some peculiarities in the pore-size distribution derived from N2 adsorption.
Outliers with large geometric factors G for HTO tend to also have large tortuosities for Cl (and thus low De for Cl), with the exception of the two samples from the Beggingen Member and the Schambelen Member of the Lias Group. When excluding the same values as for the relationship for G for HTO (open symbols), the relationship for G for Cl can be fitted for instance by an exponential function (R2 of 0.74) or by a polynomial of degree 4 (R2 of 0.76). The geometric factors G for Cl for clay-mineral-rich samples are roughly a factor of 2 larger than those for HTO. For lower clay-mineral contents, the difference is smaller (about a factor of 1 – 2). This is related to the effects of anion exclusion in clay minerals, which lead to an increase in the tortuosity of the anion diffusion pathways compared to those for HTO in clay-mineral-rich samples.
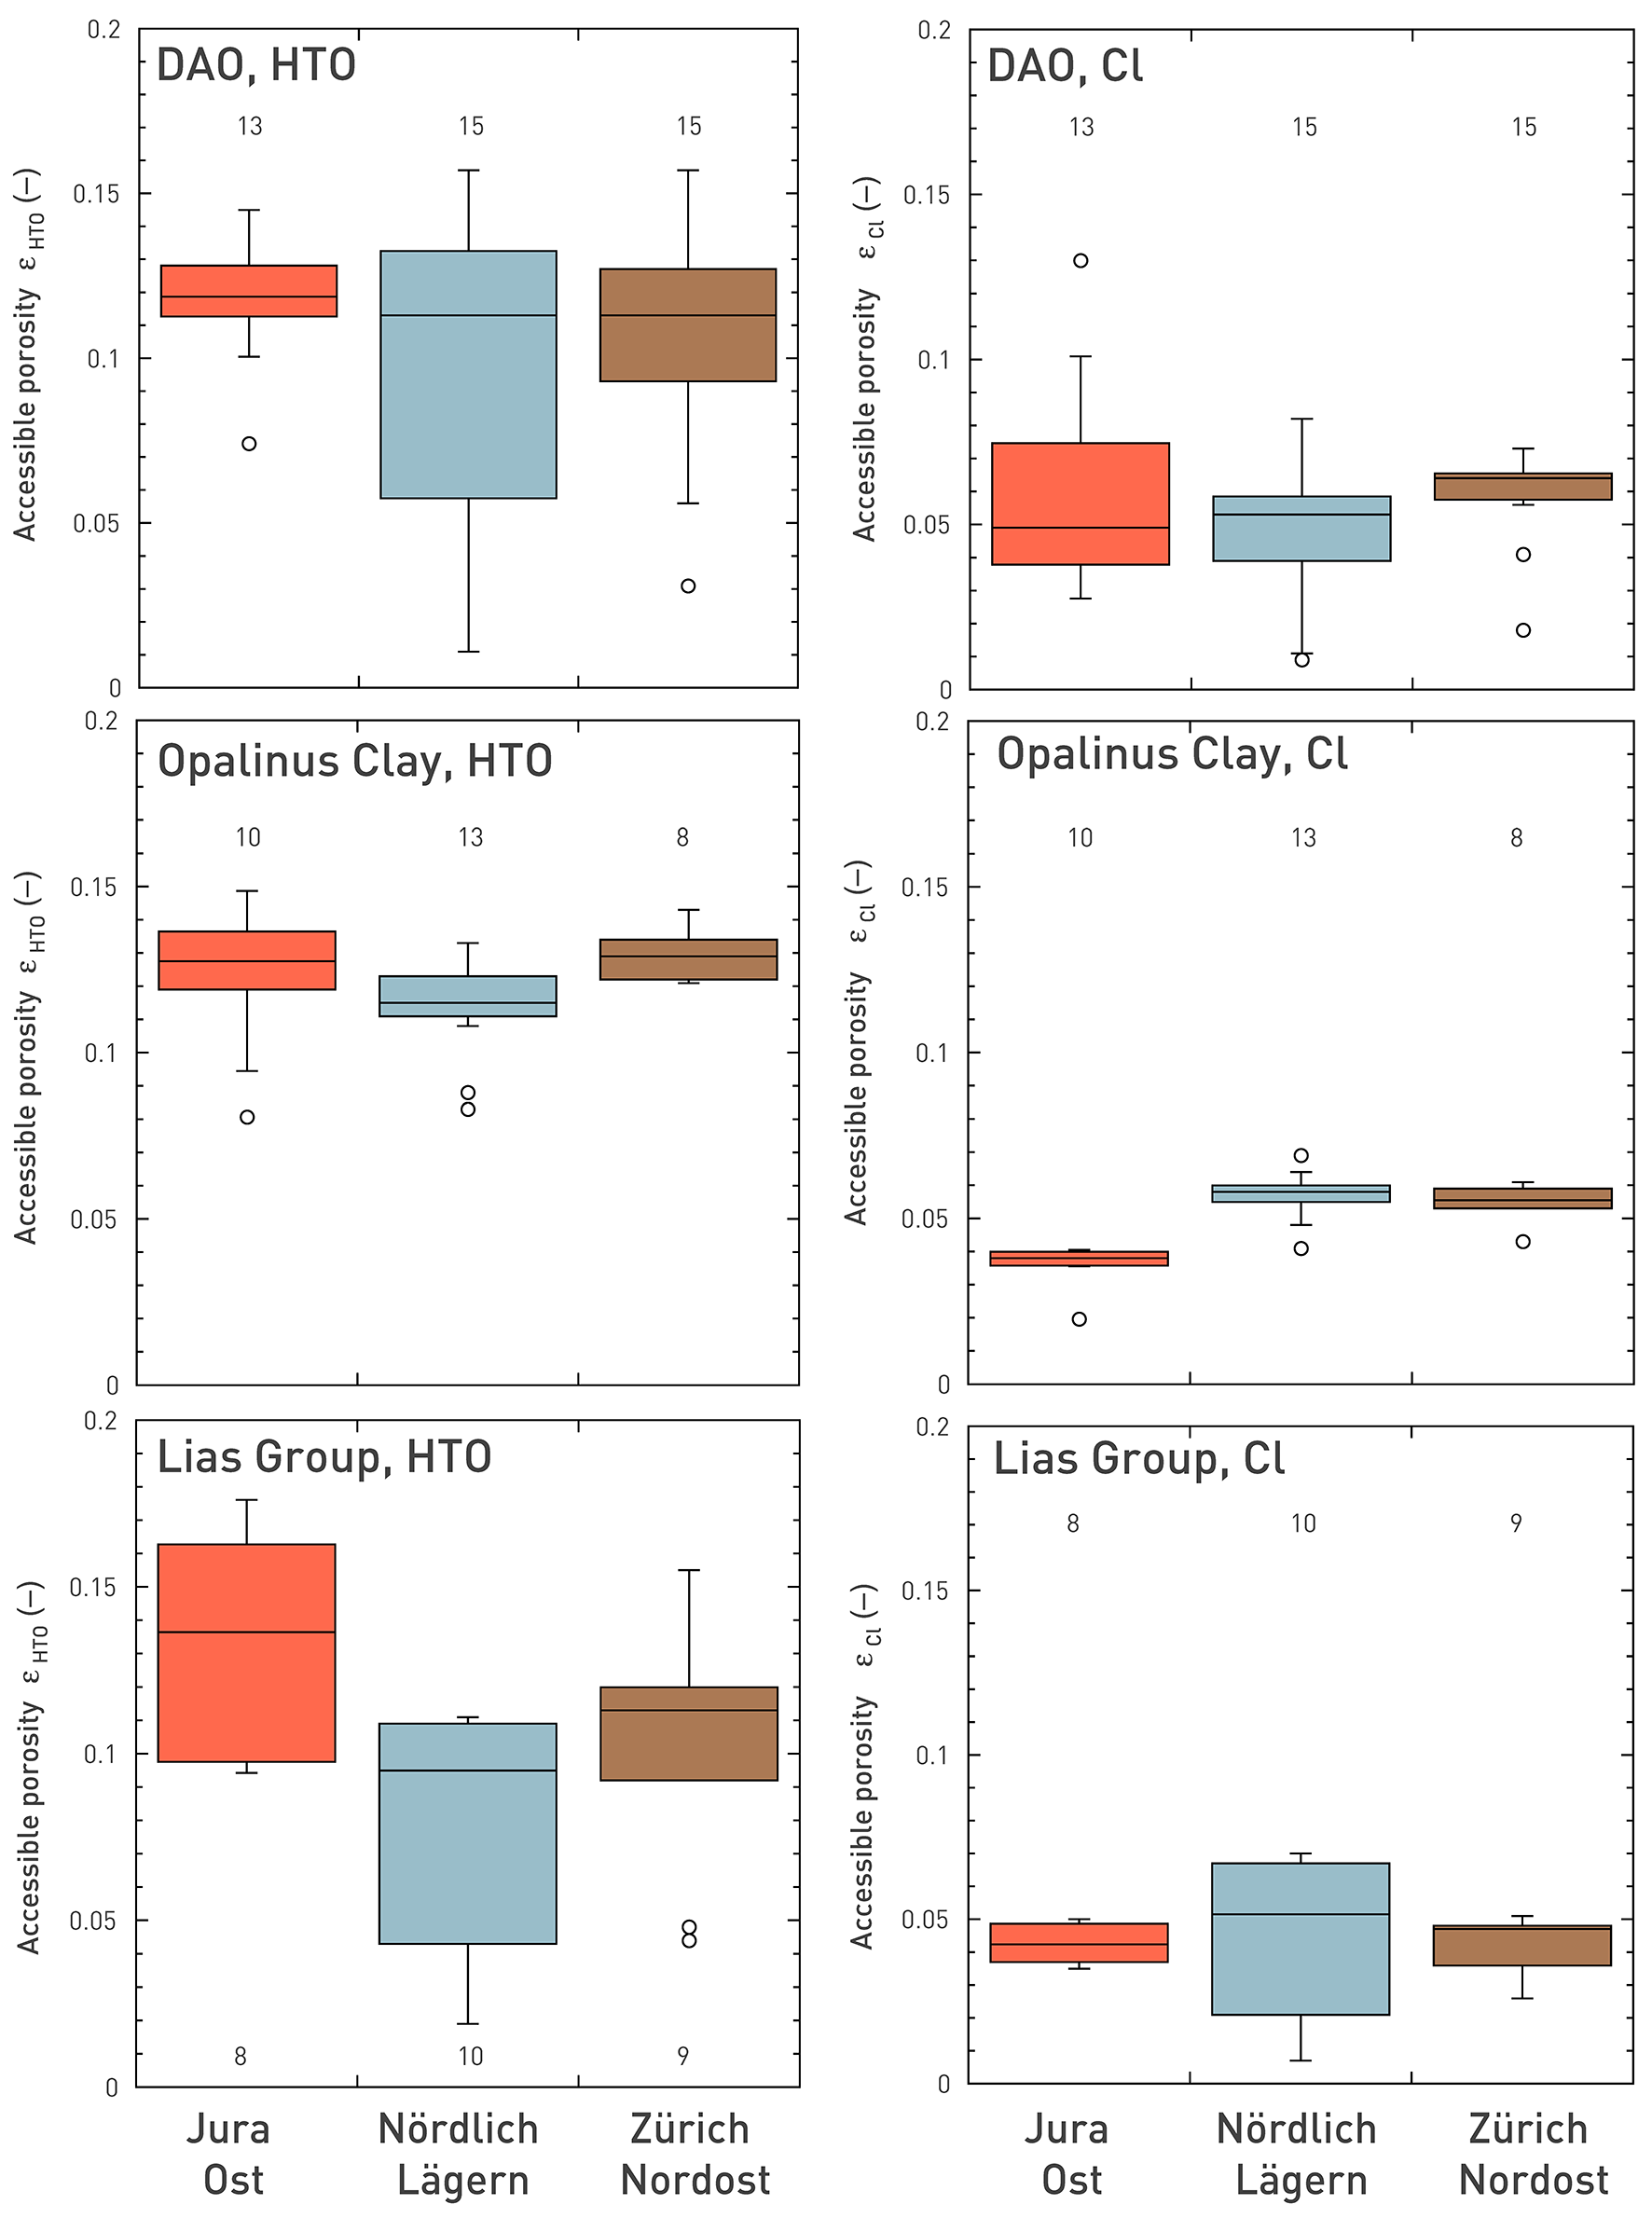
Fig. 5‑52:Box plots illustrating the range of accessible porosities ε for HTO and for Cl, grouped according to the siting regions
DAO: Dogger Group above Opalinus Clay. Each box includes 50% of the values; the horizontal line shows the median, the whiskers the minimum and maximum values within an ‘acceptable’ range (from the upper or lower box limit to ± 1.5 times the box size), the circles values outside this range. The sample number for each group is also indicated.

Fig. 5-53:Correlation of geometric factor G with clay-mineral content for HTO (a) and Cl (b) as a basis for estimating  of HTO and Cl for the Dogger Group above Opalinus Clay, the Opalinus Clay and the Lias Group
Measurements perpendicular to bedding. The solid line shows an exponential function, the dashed line a polynomial of fourth degree fitted to the solid symbols. Open symbols denote outliers defined as values with comparably high G for HTO (i.e. low De of HTO); they are located in the Rietheim Member (Rieth.), Schambelen Member (Scha.) and Beggingen Member (Begg.) of the Lias Group, and in the Wedelsandstein Formation (Wsst.), Passwang Formation (Pass.) and «Humphriesioolith Formation» (Hum.) of the Dogger Group above Opalinus Clay (DAO). In most cases, these outliers also have comparably high G for Cl (i.e. low De of Cl).
This section gives a short overview of results from in-situ diffusion experiments that typically cover larger scales than laboratory experiments (decimetre to metre, months to a few years).
In-situ diffusion experiments at the underground rock laboratory scale provide an important link between small-scale laboratory experiments and diffusion profiles at the formation scale (Altmann et al. 2012). They complement lab experiments by exploring a much larger rock volume under in-situ geochemical conditions (e.g. pH, redox, porewater composition) and in-situ pressures that are closer to the repository situation. Simultaneous diffusion in all directions (parallel and perpendicular to bedding) occurs during in-situ experiments, but – depending on the setup – diffusion parallel to bedding often dominates. In contrast, the substantial database from lab experiments contains mostly data normal to bedding. In-situ diffusion data for the Opalinus Clay exist from the Mont Terri rock laboratory as a result of a number of experiments carried out over the last ca. 25 years (Leupin et al. 2017). The first pioneering test was the DI experiment (carried out 1997 – 2001) where the basic design was developed (Palut et al. 2002, 2003). In this design, tracers (HTO, I-) were continuously circulated between a reservoir and the borehole and were allowed to diffuse into the rock in a packed-off test interval via a porous screen. Tracers were monitored by regular sampling of the circulated solution. After termination, tracer profiles were analysed from the overcored sections. The DI design and methodology were successively refined in the later experiments (FM-C, DI-A1, DI-B, DI-A2, DR, DR-A) and additional non-reactive and reactive tracers were investigated (Gómez-Hernández et al. 2004, Wersin et al. 2006, Yllera et al. 2004, Wersin et al. 2010, Gimmi et al. 2014, Leupin et al. 2017, Soler et al. 2019; see also summary in Leupin et al. 2017). Most of the test boreholes were drilled straight down, i.e. oblique to the bedding (dip 30 – 45°) of the Opalinus Clay and had long test intervals (~ 1 m) such that diffusion parallel to the bedding plane dominated the experiments. The DR experiment was drilled perpendicular to bedding and, besides a short pressure monitoring interval at the bottom, had two short (0.15 m) test intervals (separated by ~ 40 cm) which allowed the effect of rock anisotropy on diffusion to be investigated. The FM-C test was carried out in the highly fractured "Main Fault". As for laboratory diffusion experiments, the solution composition in the reservoir (except for the second stage of the DR-A experiment) was chosen to more or less match the porewater with respect to the main ions, in order to prevent any geochemical reactions and avoid effects of coupled diffusion of several ions (multi-component diffusion).
All tests were accompanied by extensive modelling, yielding diffusion parameters including effective diffusion coefficients parallel to bedding, diffusion-accessible porosities, information on rock anisotropy (DR only) and sorption data. As mostly radioactive tracers were used in these experiments in a solution with a composition similar to the porewater (identical to laboratory experiments), individual tracers could be modelled separately. Tab. 5‑3 summarises the diffusion parameters (De, ε) parallel to bedding obtained for conservative tracers (HTO, l- and Br‑). Consistent values within their uncertainty ranges between the different in-situ tests are evident, regardless of their location, setup or diffusion time. The in-situ values are also consistent with those obtained from small-scale laboratory diffusion tests parallel to bedding with the Opalinus Clay samples from the Mont Terri (Tab. 5‑3 and Fig. 5‑54). The results from the DR experiments further confirm lab experiments regarding rock anisotropy. Thus, diffusion perpendicular to bedding in the Opalinus Clay from Mont Terri is lower by a factor of 3 – 5 relative to diffusion, parallel to bedding (Gimmi et al. 2014). The ensemble of results underlines the comparability between small-scale laboratory (e.g. Van Loon et al. 2004a, 2004b, Appelo & Van Loon 2008, Appelo et al. 2010) and larger-scale field experiments.
Tab. 5‑3:Modelled diffusion data for the Opalinus Clay (parallel to bedding) for HTO, l- and Br- of in-situ diffusion experiments at the Mont Terri rock laboratory and comparison with data (parallel to bedding) from small-scale lab experiments with Mont Terri samples
|
Experiment |
HTO |
Iodide |
Bromide |
Anisotropy ratio |
Duration |
Ref. | |||
|---|---|---|---|---|---|---|---|---|---|
|
|
De |
ε |
De |
ε |
De |
ε |
|||
|
|
× 10-11 m2/s |
– |
× 10-11 m2/s |
– |
× 10-11 m2/s |
– |
– |
yr |
|
|
DI-B |
4 – 5 |
nc |
0.83 – 1.2 |
nc |
~ 1 |
a |
|||
|
DI-A1 |
5.4 – 6.5 |
0.17 – 0.2 |
1.2 – 2.0 |
0.08 – 0.09 |
~ 1 |
b |
|||
|
DI-A2 |
6.0 |
0.15 |
3.0 |
0.08 |
3.0 |
0.10 |
~ 1 |
c |
|
|
DR-A |
4.1 |
0.15 |
(1.2) i |
(0.075) i |
~ 0.5 |
d |
|||
|
DI |
5 |
0.15 |
1 – 1.5 |
0.07 – 0.125 |
~ 1 |
e |
|||
|
FM-C |
6.8 |
0.12 |
2.5 |
0.05 |
~ 0.7 |
f |
|||
|
DR |
5.4 |
0.164 |
1.6 |
0.08 |
2.6 |
? |
~ 5 (HTO) ~ 3 – 4 (I, Br) |
~ 4 |
g |
|
Lab exp. |
5.4 – 5.7 |
0.1 – 0.17 |
1.44 |
0.06 – 0.08 |
1.7 – 4.5 |
0.08 – 0.15 |
~ 4 |
~ 0.1 |
h |
a Yllera et al. (2004); b Van Loon et al. (2004b); c Wersin et al. (2008); d Soler et al. (2019), first stage; e Palut et al. (2003); f Tevissen & Soler (2003); g De modelling in progress; h Van Loon et al. (2004b), Appelo et al. (2010); I when assuming e of 0.075; nc: not considered.
Fig. 5‑54:Comparison of effective HTO and anion diffusion coefficients De for the Opalinus Clay obtained in Mont Terri field and laboratory experiments
Measurements are parallel to bedding. Laboratory tests were on small samples. Each box includes 50% of the values; the horizontal line shows the median, the whiskers the minimum and maximum values within an ‘acceptable’ range (from the upper or lower box limit to ± 1.5 times the box size), circles are values outside this range. The sample number for each group is also indicated.
Diffusion experiments cannot be performed at the formation scale because of time constraints. However, profiles of natural tracers (Section 4.6) offer an opportunity to test the applicability of transport properties derived in the laboratory on small samples. For instance, the observed profiles of stable water isotopes and of Cl in porewater in the Benken borehole have been modelled based on several assumptions. The following conclusions were drawn (Gimmi et al. 2007, Gimmi & Waber 2004): (1) No signature of advection could be detected in the profile shapes; the development of the profiles is dominated by molecular diffusion. (2) Using laboratory-derived diffusion coefficients adjusted for the higher in-situ temperature, an evolution time for the signature towards the Keuper aquifer consistent with the palaeo-hydrogeological history could be obtained. Thus, laboratory-derived diffusion coefficients are relevant also at the formation scale. Similar conclusions were drawn from a broad study that compared profiles of several natural tracers at various sites in several countries including the Mont Terri rock laboratory (Mazurek et al. 2011) and from the recent modelling of profiles of e.g. stable water isotopes obtained in the three siting regions (Section 4.6). There, porosities and diffusion coefficients that vary with depth according to the measured laboratory parameters and the measured temperature trend for each site were used. This led to a good match with the measured tracer profiles for plausible timing of events (with respect to the palaeo-hydrogeological evolution) in each aquifer.
The diffusion properties of the Opalinus Clay are comparable with those of other clay-rich rocks with similar porosity (Fig. 5‑55). The porosity is related to the (maximum) burial depth, and the effective diffusion coefficient of a water tracer approximately follows a power law (Archie) relationship with the porosity.
Fig. 5‑55:Comparison of Opalinus Clay diffusion coefficients with data from other clay-rich rocks worldwide
De of HTO for Opalinus Clay from the JO, NL and ZNO siting regions plotted at the diffusion-accessible porosity. International examples are from the Clay Club Catalogue (OECD/NEA 2022) plotted at the indicated water-loss porosity. For the international samples, points indicate best estimates, bars represent minimum and maximum values. 1: Wakkanai Formation at Horonobe (JP, maximum burial depth: 1'200 m), 2. Ypresian Clay at Kallo/Doel (B, 450 m), 3: Boom Clay at Mol (B, 215 m), 4: Callovo-Oxfordian at Meuse/Haute Marne (F, UA unit, 850 m), 5: Toarcian-Domerian at Tournemire (F, 1'300 m), 6: Georgian Bay Formation at Bruce Site (CDN, 1'520 m); 7: Queenston Formation at Bruce Site (CDN, 1'450 m). Maximum burial depths as an indication for consolidation (best estimates or average values).
-
De values for HTO in the Opalinus Clay cluster within a small range and are almost identical for all three siting regions (Fig. 5‑51).
-
As a result of differences in porewater ionic strength, De for chloride shows site-specific differences, with lowest values in JO.
-
The geometric factor G can be correlated to the clay-mineral content both for HTO and for Cl (Fig. 5-53). As (accessible) porosity is also correlated with the clay-mineral content (Fig. 5‑11), De of HTO or Cl can be estimated from clay-mineral contents from Base Lias Group up to the Malm Group. Outlier lithologies can be identified and relate to rocks with special texture and pore architecture (pore-size distribution, pore connectivity) probably related to distinct diagenetic features, notably the Rietheim Member rich in organic matter («Posidonienschiefer»).
-
The Dogger Group above Opalinus Clay and the Lias Group below the Opalinus Clay show more variability of diffusion properties, because of the more variable lithology (Fig. 5‑51).
-
For the Opalinus Clay, diffusion coefficients determined on small drill core samples in the laboratory match well with those derived from field-scale diffusion experiments in the Mont Terri rock laboratory (Fig. 5‑54).
-
The anisotropy factor for diffusion in the Opalinus Clay (values parallel to bedding compared to values perpendicular to bedding) is in the order of 3 – 6.
-
Using laboratory diffusion coefficients (adjusted for increased temperature at greater depths) in simulations of the tracer profiles leads to good matches with the tracer profiles for plausible evolution times.
-
No obvious scale dependence of diffusion properties of the Opalinus Clay between the lab, underground rock laboratory and formation scale was detected; local variations can be related to differences in the porosity or the clay-mineral content and the specific microstructure of samples from certain layers.
Key points:
- Molecular diffusion is the dominant transport mechanism in the Opalinus Clay and in adjacent low-permeability clay-rich rocks at formation scale.
The relative importance of diffusive compared to advective solute transport can be evaluated with the so-called Peclet number. This dimensionless number is defined as the ratio between the rate of advection to the rate of diffusion over a given characteristic length scale. Depending on the characteristic length used and the field of application, different definitions of the Peclet number exist in the literature (Huysmans & Dassargues 2005). To evaluate the importance of diffusion versus advection in the Opalinus Clay, a Peclet number similar to the one defined in de Marsily (1986) and Freeze & Cherry (1979) is considered:
![]()
where |q| is the module of the Darcy flux [m/s], |v| the module of the porewater velocity [m/s], I the characteristic length of the porous medium in [m] and De and Dp the effective and the pore diffusion coefficient, respectively, of a tracer in the porous medium in [m2/s]. When this Peclet number equals 1, transport by advection is almost equally important as transport by diffusion. If Peclet numbers are < ~ 0.1 or > ~ 10, diffusion or advection, respectively, dominate.
Here, the main interest is in transport at the formation scale. Accordingly, a characteristic length I of 50 m, which reflects the distance between the deep disposal tunnels and the upper and lower limits of the Opalinus Clay, is chosen. The module of the Darcy flux |q| was calculated using a vertical hydraulic conductivity of 1 × 10-14 m/s and hydraulic gradients i of 0.1 and 1.0. An effective diffusion coefficient De of 2 × 10-12 m2/s for chloride was considered (Fig. 5‑51).
The evaluation for chloride shows that, even for a high vertical hydraulic gradient of 1, advection is hardly important (Fig. 5‑56). For more likely lower gradients (e.g. 0.1), the properties of the Opalinus Clay ensure dominance of diffusive transport. That is, the Peclet number for characteristic properties is well below 1.
Additional transport mechanisms were evaluated in earlier publications (Soler 1999, 2001, Nagra 2002, Marschall et al. 2004). The overall conclusion was that coupled phenomena will only have a very minor impact on radionuclide transport in the Opalinus Clay, in terms of fluid and solute fluxes. Recent work considered thermo-osmosis to explain pore pressures at Mont Terri (Gonçalvès et al. 2023). However, the study confirmed that diffusion remains the dominant transport mechanism also under consideration of this additional driving force.
Fig. 5‑56:Dominant transport mechanisms in the Opalinus Clay based on the Peclet number illustrated for chloride
The figure shows the range of hydraulic conductivity and effective diffusion coefficient compared to isolines of reference Peclet numbers Pe (i.e. 1.0 and bounding values of 0.1 and 10.0). The upper and lower figures consider a hypothetical hydraulic gradient across the Opalinus Clay of 0.1 and 1.0 respectively.
For the long-term safety of a geological repository and for site comparison, the following aspects of the Opalinus Clay and its confining units are particularly relevant:
-
The Opalinus Clay exhibits excellent and comparable barrier quality in all three siting regions. The consistently high clay-mineral content (> 40 wt.-%) leads to a clay-matrix-supported microstructure, which in turn dominates the mechanical behaviour and transport properties with relatively low variability.
-
The porewater of the Opalinus Clay is of moderate ionic strength, pH near neutral and the redox conditions are buffered by pyrite and siderite equilibria to the reducing range. This translates to favourable geochemical conditions regarding the mobility of radionuclides and the stability of the engineered barriers.
-
The difference in current burial depth in the three siting regions (approximately 400 to 900 m) results in only minor differences in basic properties (e.g. porosity). The Opalinus Clay can therefore be considered comparable across all regions. Depth-dependence of mechanical properties (strength and stiffness) is accounted for by the well-established dependence of these properties on effective stress.
-
Deformation is accommodated in a more distributed manner than in more competent rocks with low clay-mineral content, with segmentation of fault planes and soft-linkage geometrically restricting continuous fracture flow paths.
-
Measurements of extremely low hydraulic conductivity and porewater investigations provide evidence that mass transport in the Opalinus Clay is diffusion-dominated.
-
The Opalinus Clay self-seals fractures at burial depths greater than approximately 200 m and therefore fractures do not compromise the barrier integrity over relevant timescales.
-
The validity of diffusion properties is established at different scales of space and time: Consistent properties result from small-scale lab experiments and in-situ experiments in the Mont Terri rock laboratory. The laboratory diffusion coefficients lead to plausible matches of the formation-scale profiles of natural tracers in porewater that evolved over geological timescales.
-
In the Opalinus Clay, the diffusion coefficient for the water tracer HTO shows very minor variation and is consistent across the different siting regions. As a result of differences in porewater ionic strength, the effective diffusion coefficient
 for chloride shows some site-specific differences, with lowest values in JO.
 -
The confining units increase the effective containment of a future repository and also have very low hydraulic conductivities, but a lower self-sealing potential than the Opalinus Clay. Relative homogeneity, good spatial correlation and consistently high clay-mineral content are the major differences of the Opalinus Clay and its confining units, and a major advantage in terms of ease of characterisation.
Fig. 5‑57:Link of texture and clay-mineral content with key hydromechanical properties in Jurassic sediments of the siting regions (lower confining units to upper aquifers)
The uppermost figure depicts a highly simplified transition from a grain-supported framework (clastics or carbonate skeleton, with low clay-mineral content partially filling the pores) on the left side, to a clay-matrix-supported framework on the right. Transition to the clay-matrix-supported framework at approximately 20 to 40 wt.-% is consistent with the low hydraulic conductivity (a; see Fig. 5‑42) because of the high swelling capacity (c; see Fig. 5‑22), which in turn is possible because swelling is not hindered by strong diagenetic bonds, as indicated by low strength (b; see Fig. 5‑30). Note figure shows data from the Lias Group to the Malm Group. HR stands for Hauptrogenstein.
The above observations are conceptually explained in relation to the clay-mineral content, and more specifically to the distribution of clay minerals at the microstructure scale (Fig. 5‑57). At low clay-mineral content, the larger clastic grains (typically carbonates or quartz) are load-bearing and the microstructure can be referred to as grain-supported, whereas at higher clay-mineral content the microstructure is clay matrix-supported with clastic grains enclosed in clay minerals (Section 5.2). The transition between a grain-supported and matrix-supported microstructure for shales was interpreted to be around 30 to 40 wt.-% of clay and considered a threshold for robust barrier function with increasing clay-mineral content (Bourg & Ajo-Franklin 2017, Revil & Cathles 1999). This value is in good agreement with an increasing self-sealing potential observed from the confining units towards the Opalinus Clay, most notably with an increase in the swelling index (Fig. 5‑57c).
In Fig. 5‑57 only Jurassic sediments are shown (which have low matrix permeability), where elevated transmissivity can be related to fracture-dominated flow. It is noted that the hydraulic conductivity of the intact material is very low (<< 10-10 m/s) in all formations shown in Fig. 5‑57, in limestones of the Malm Group ("Aquifers") as well as in the Opalinus Clay. But while cementation of pores plays a dominant role in ensuring low permeability in intact limestones, flow in the clay matrix is controlled by the pore network of the small clay particles, i.e. a high tortuosity and narrow passages (constrictivity).
Fracturing in the Opalinus Clay has a much lower impact on changes in rock mass hydraulic conductivity because of the fundamentally different controls on its low permeability compared to limestones, where the brittle response during fracturing leads to relatively high surface roughness and localisation of deformation with hard linkage. As cement bonds and grains are broken during fracturing and swelling capacity is negligible, fracture permeability cannot easily be reversed.
Whereas the clay-mineral content in the Opalinus Clay is consistently high, the confining units show a larger variability, with clay-mineral contents transitioning from grain-supported to clay matrix-supported microstructures. At a clay-mineral content of approximately 20 to 40 wt.-%, this transition is associated with a decrease in strength and an increase in the swelling index towards higher clay-mineral contents. In the Opalinus Clay, packer tests show consistently low hydraulic conductivity (< 10-12 m/s), regardless of whether clay-mineral contents are 40, 50 or even 70 wt.-%. In contrast, rocks with clay-mineral contents < 20 wt.-% exhibit rather high strength, negligible swelling indexes and partly very high, fracture-dominated hydraulic conductivities. Confining units in the transition zone with clay-mineral contents of 20 to 40 wt.‑% generally also show low hydraulic conductivities but can occasionally be 1 – 2 orders of magnitudes above those measured in the Opalinus Clay.