
Several laboratory methods were used to quantify porosity, including the measurement of water content upon heating to 105 °C (yielding water-loss porosity), density measurements (yielding pycnometer porosity), or based on diffusive isotope exchange experiments (yielding porosity from isotope exchange). The methodologies are documented in Waber (2020). While the physical basis for the porosity determination differs substantially between these methods, the results converge, despite small method-specific differences. In addition to laboratory-based methods, porosity was also quantified from borehole logs (Becker & Marnat 2024).
Along the investigated profiles (Fig. 5‑8), porosity is mostly below 0.15 (expressed as the fraction of pore space relative to bulk rock volume). The Opalinus Clay shows little variation in the continuous log-derived porosity profiles. Porosities are generally very low in the Malm Group section (< 0.05), pointing to well cemented rock. Particularly low porosities are also observed at the base of the Bänkerjoch Formation, in the zone where typically massive anhydrite occurs. A substantial variation is seen within the Muschelkalk aquifer, with higher values in the upper, dolostone-dominated part (Sections 4.2.2 and 4.5.3.12).
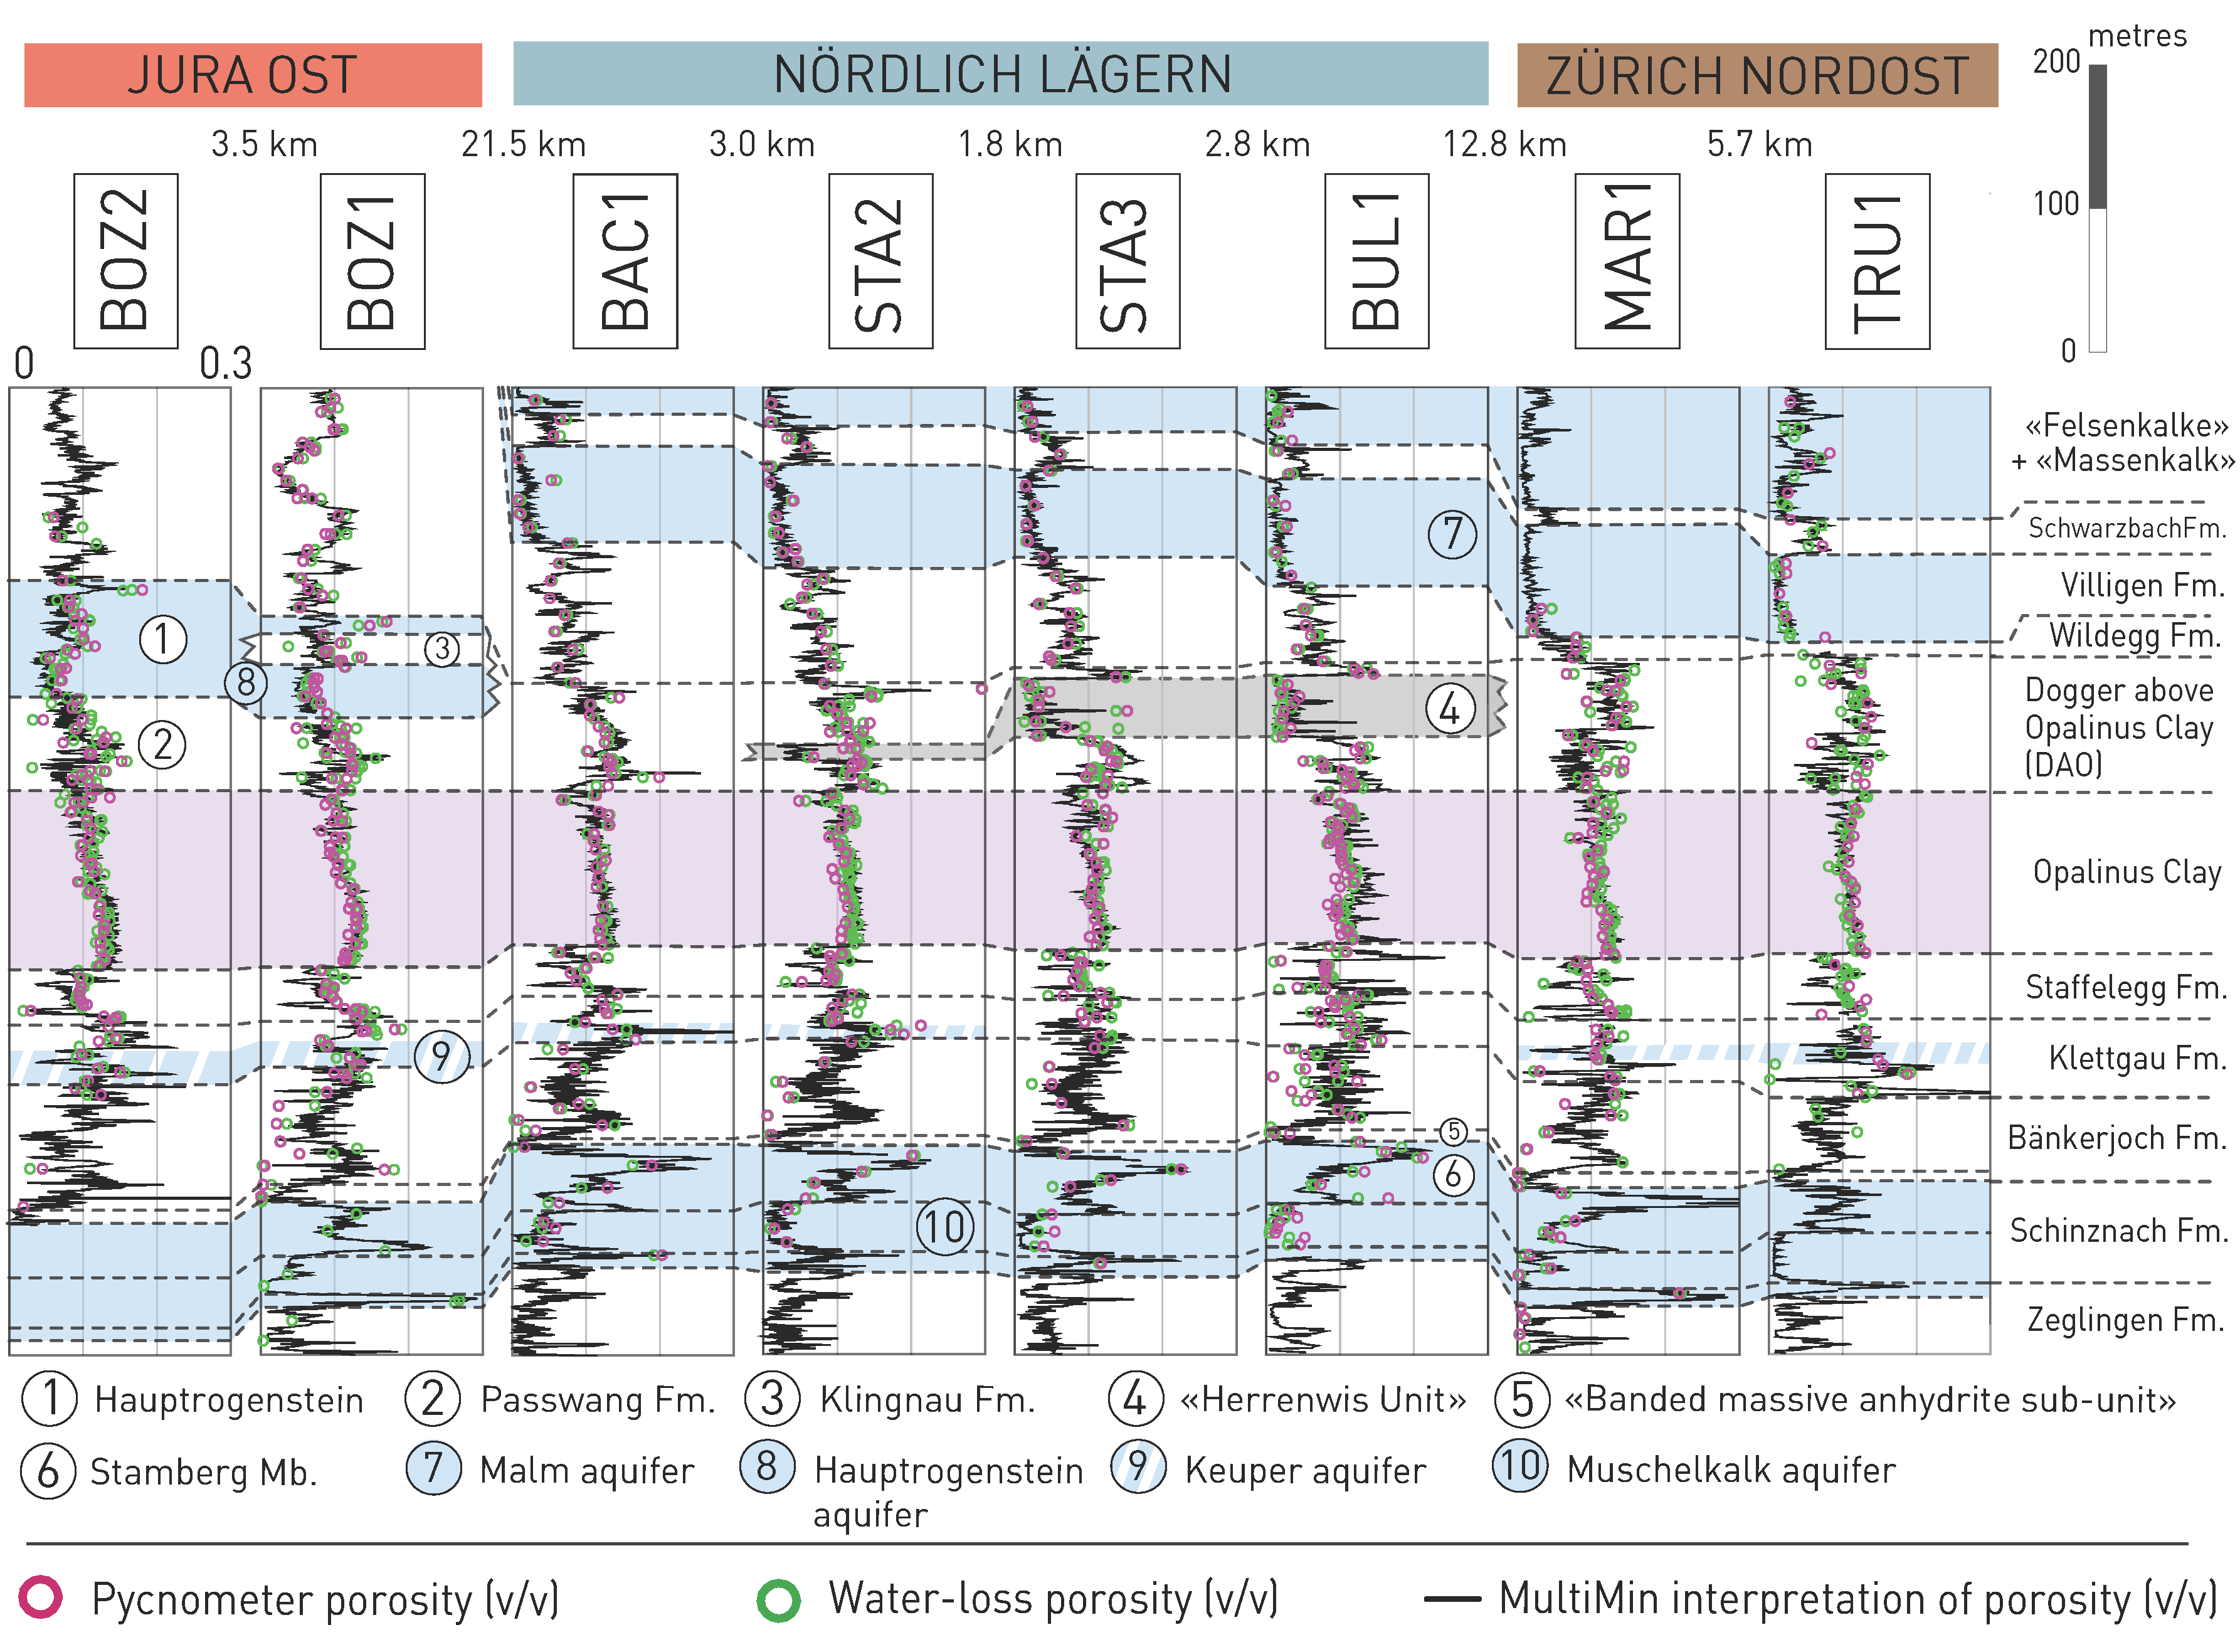
Fig. 5‑8:Porosity profiles from selected boreholes in the siting regions
Blueish shading depicts the regional and local aquifers while the purple shading depicts the Opalinus Clay. The continuous MultiMin-porosity profiles (Becker & Marnat 2024) are computed from geophysical logging data and are calibrated with drill-core analyses.
The typical range for porosity in the Opalinus Clay in the siting regions is 0.10 – 0.13 (Fig. 5‑9). At the Mont Terri rock laboratory (Fig. 5‑10), the porosity is somewhat higher (0.12 – 0.15), which can be explained by the external position relative to the Alpine front and therefore shallower Miocene burial and compaction (details in Mazurek et al. 2006). There is a moderate correlation between the current depth of the Opalinus Clay and its porosity (Fig. 5‑10). The median porosity is around 0.11 for the BUL1 and TRU1 boreholes, where the Opalinus Clay occurs at 820 – 1'000 m depth, while it is around 0.12 at shallower depth in boreholes BOZ1 and BOZ2 (450 – 650 m depth). The porosity increase associated with unloading from 1'000 m to 400 m depth can be estimated from oedometric test results (Section 5.5.2). This yields an approximately 0.002 to 0.007 increase in porosity. It is therefore conceivable that other factors in the burial history contributed to the slightly different porosities observed at the different depth intervals, for example a lower maximum burial depth during Miocene times, where Molasse sediments are mostly absent in the JO siting region (Section 3.4.3).
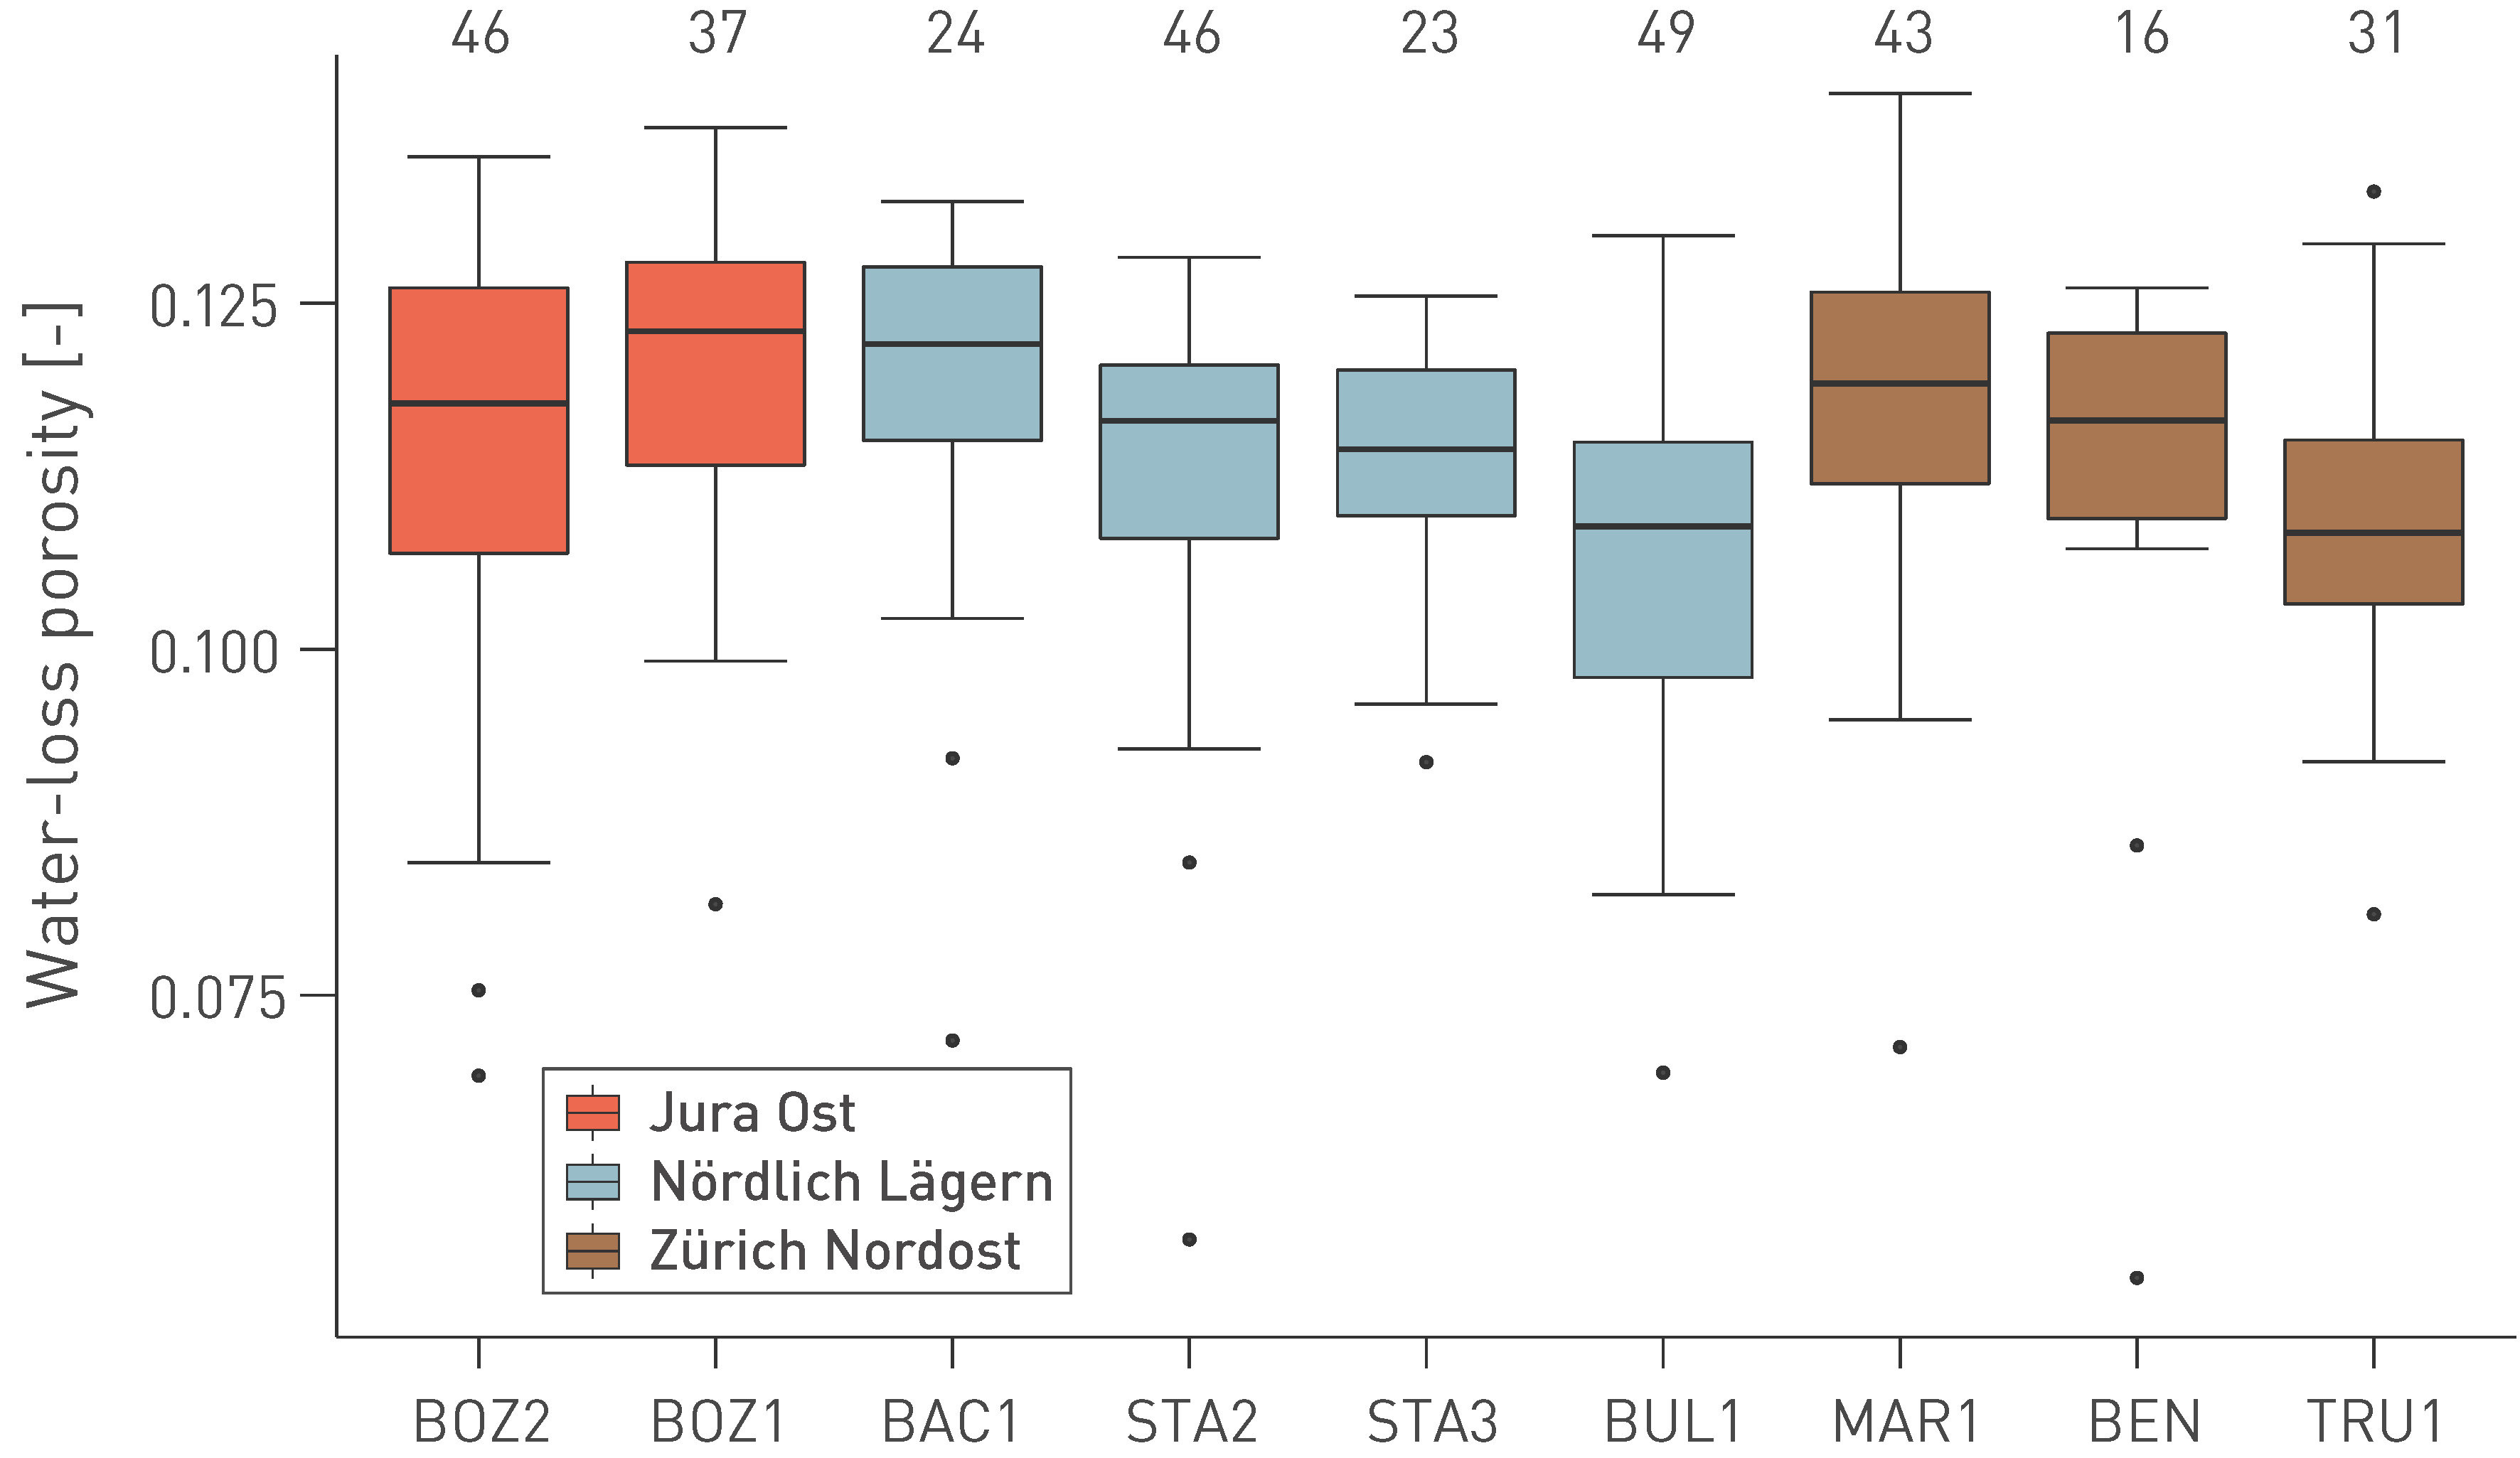
Fig. 5‑9:Water-loss porosity of the Opalinus Clay
Each box encloses 50% of all measured values. The horizontal line in the box indicates the median, and the whiskers (error bars) the minimum and maximum values (min: 25th percentile – (1.5 × interquartile range); max: 75th percentile + (1.5 × interquartile range)). The black circles indicate outliers. The values above the boxplots denote the number of samples.
The scatter of porosity is remarkably low (1s deviations are 0.010 – 0.016) within the Opalinus Clay. Outliers towards lower porosity are related to clay-poor, often well cemented beds in the upper part of the formation (Fig. 5‑10). At Mont Terri, the most prominent outliers occur in the «Carbonate-rich silty sub-unit», which is not observed in the siting regions in Northern Switzerland.
The increased variability of porosity in the Dogger Group above Opalinus Clay reflects the higher lithological heterogeneity of this sequence both vertically and laterally (Fig. 5‑8). Particularly low matrix porosities are found in the limestones of the «Herrenwis Unit» of STA3 and BUL1, and in the Hauptrogenstein of BOZ1 and BOZ2. Nevertheless, the average porosity is relatively high (0.10), given the generally clay-rich lithologies present in the Dogger Group above Opalinus Clay.
Porosity in the Staffelegg Formation also varies over a wide range, but the variability shows a systematic vertical pattern over the area of the siting regions, reflecting variation in clay-mineral contents (Mazurek et al. 2023a). The lowest porosity values are found in the limestones of the Beggingen and the Grünschholz, Breitenmatt and Rickenbach Members, whereas all other members yield averages of 0.08 – 0.11.
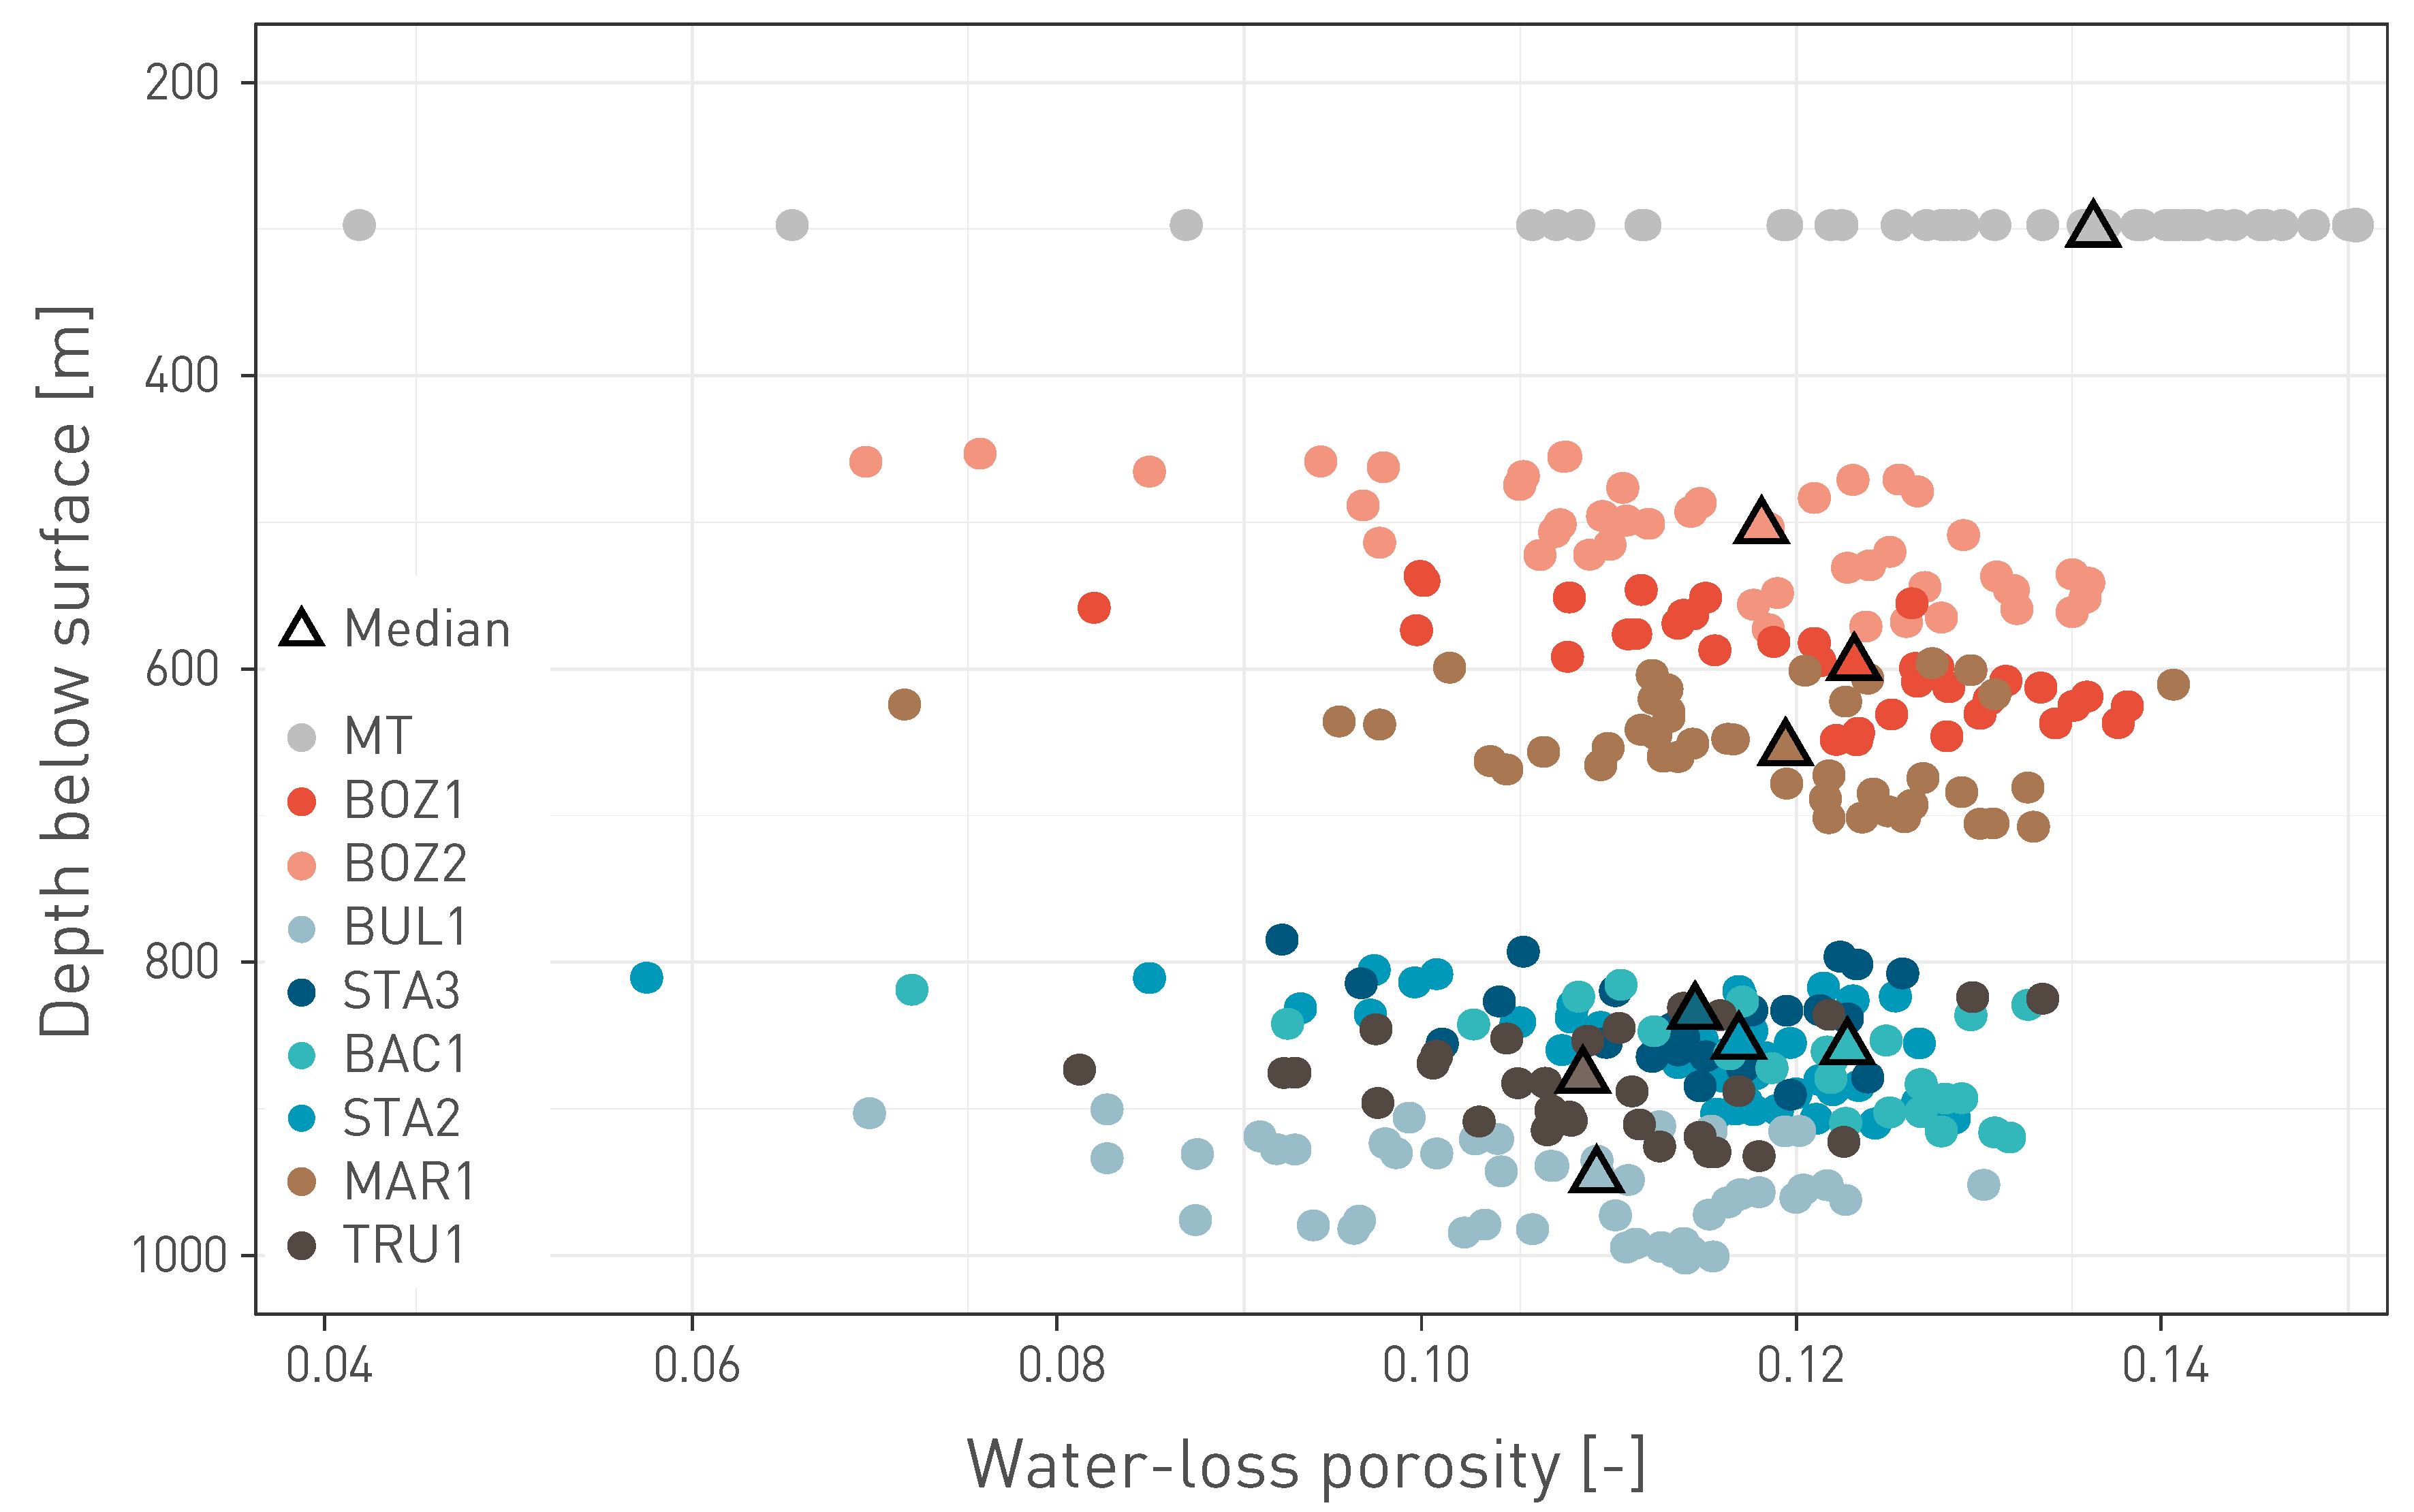
Fig. 5‑10:Water-loss porosity of the Opalinus Clay in different boreholes as a function of current depth
Triangles indicate the borehole-specific median values (plotted at mid formation depth).
Mont Terri (MT) data refer to the BDB1 borehole (complete profile) and are shown at a nominal depth of 300 m.