
In the Jurassic profile, a good correlation is found between clay-mineral content and porosity, even though several outliers towards higher porosity can be identified (Fig. 5‑11). These originate from Fe-rich oolites (e.g. Wutach Formation, «Humphriesioolith Formation», «Murchisonae-Oolith Formation»), from the Hauptrogenstein (oolitic limestone) and from the reef facies of the «Herrenwis Unit». All samples from these units are shown with open symbols in Fig. 5‑11, together with sandstones (but not the more clay-mineral-rich lithologies) of the Wedelsandstein Formation. All these units have in common that, at the time of deposition, they contained large mechanically competent grains, such as ooids, abundant quartz in the sand fraction and coarse-grained calcite from the reef. As suggested by Mazurek et al. (2023a) and following earlier work (e.g. Revil & Cathles 1999), it is conceivable that the compaction of such grain-supported lithologies led to less reduction of porosity when compared with the other, in general matrix-supported units (clay and micrite). When these outliers are screened out, a power-law function provides a good fit of the measured data (Fig. 5‑11). The slope of the fit curve is 0.010 – 0.016 at low clay-mineral contents but flattens out to < 0.0015 at contents > 40 wt.-%. As discussed in more detail in Mazurek et al. (2023a), considering pore-size distributions based on N2 ad‑/ desorption isotherms (see below), the porosity data shown in Fig. 5‑11 can be considered to consist of two contributions: 1) Clay porosity between clay aggregates, with sizes of a few nm, and 2) porosity related to geometric incompatibilities between platy and granular minerals, with sizes in the range of tens of nm (Fig. 5‑12). Clay porosity can be assumed to be proportional to the clay-mineral content, whereas porosity due to incompatibilities is present in clay – carbonate mixtures but not in pure clay or carbonate. Extrapolating the trend line fitting the measured data in Fig. 5‑11 to pure clay leads to a porosity of 0.17. The red line then reflects the clay porosity, considering proportionality with the clay-mineral content. The curvature in the fit line reflects the additional pore type that occurs in lithologies in which platy clay minerals occur together with more isometric grains of calcite. The contribution of this pore type is at a maximum when both mineral types occur in comparable proportions and is of lesser relevance towards the pure clay and non-clay compositions.
The scatter that remains in the correlation between clay-mineral content and porosity even after screening out lithologies with grain-supported fabrics indicates that clay-mineral content is not the only parameter that controls porosity. The following additional factors probably play a role:
-
While the studied Jurassic sequence is dominated by mixtures of clay minerals and carbonates (i.e. claystones, marls and limestones), silty/sandy lithologies also occur but are less frequent. The decrease in porosity from claystone towards the quartz/feldspar corner as shown in Fig. 5‑13 is less strong compared to that towards the carbonate corner, indicating that the compaction behaviour of clay-mineral – quartz mixtures differ from that of clay-mineral-carbonate mixtures.
-
It can also be seen in Fig. 5‑11 that, even at the same clay-mineral content, systematic differences in porosity exist between different geological units. For example, the Opalinus Clay has a lower porosity than the overlying Dogger units of comparable clay-mineral content, a finding that cannot be explained by the only marginally different maximum burial depths. Rock fabric and porosity thus depend on other parameters as well, such as the rate of sediment deposition as this is related to the time available for early diagenesis. A low deposition rate means that the time over which early diagenesis acted on the unconsolidated sediment was longer, potentially leading to more extensive mineral reactions, such as dissolution and cementation, with consequences for the rock fabric and its compactional behaviour during later burial. The Opalinus Clay was deposited at a rate of about 50 – 60 m/Myr (referring to the current thickness in the compacted state), which is more than for any of the other Dogger units (see Section 4.2). The rapid burial is consistent with the observation that the Opalinus Clay is only weakly cemented and disaggregates when immersed in pure water, except in silty lenses in which sparitic calcite fills the pore space. In comparison, the average deposition rates for the underlying Staffelegg Formation and the Dogger Group above Opalinus Clay were 1.3 – 1.6 and 10 – 14 m/Myr, respectively, thus leaving more time for early diagenetic cementation and leading to a stiffer behaviour during compaction.
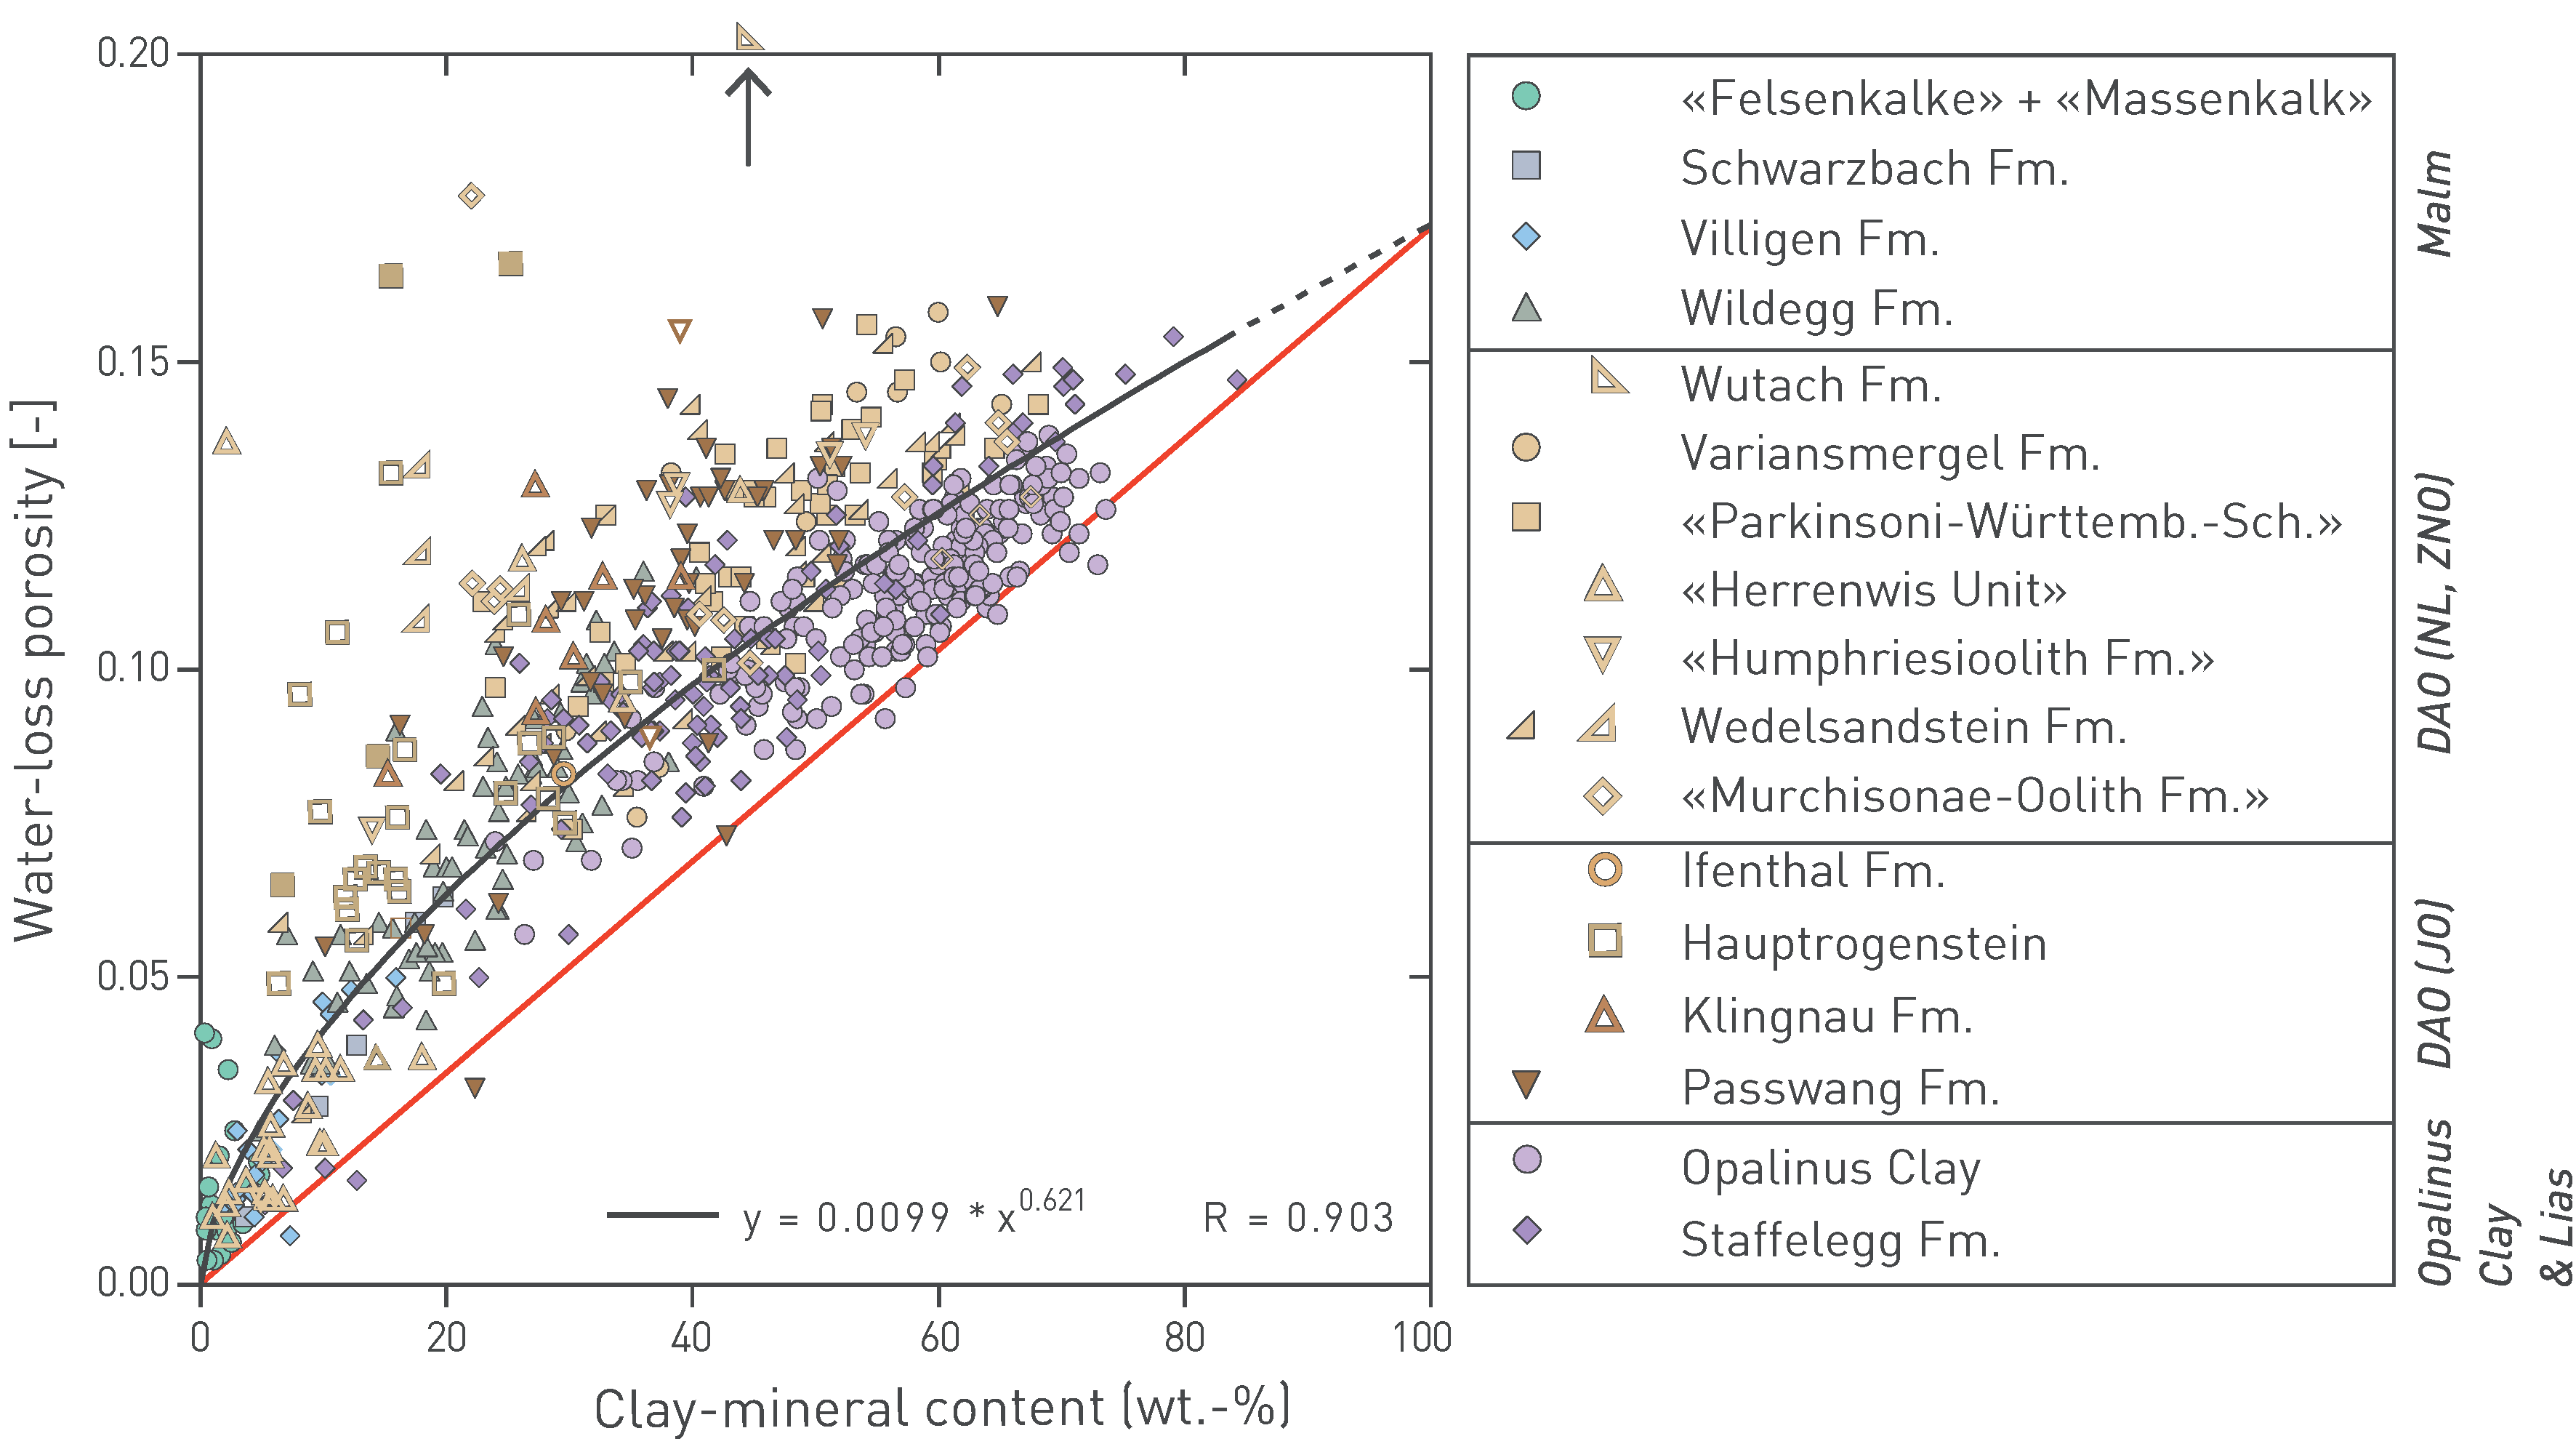
Fig. 5‑11:Relationship between clay-mineral content and porosity in the Jurassic section
Redrawn from Mazurek et al. (2023a). Points with open symbols were not considered for the calculation of the black fit curve (see text). The red line reflects the clay porosity, considering proportionality with the clay-mineral content. Arrow points to a sample with a porosity of 0.30. DAO: Dogger Group above Opalinus Clay, Fm.: Formation.
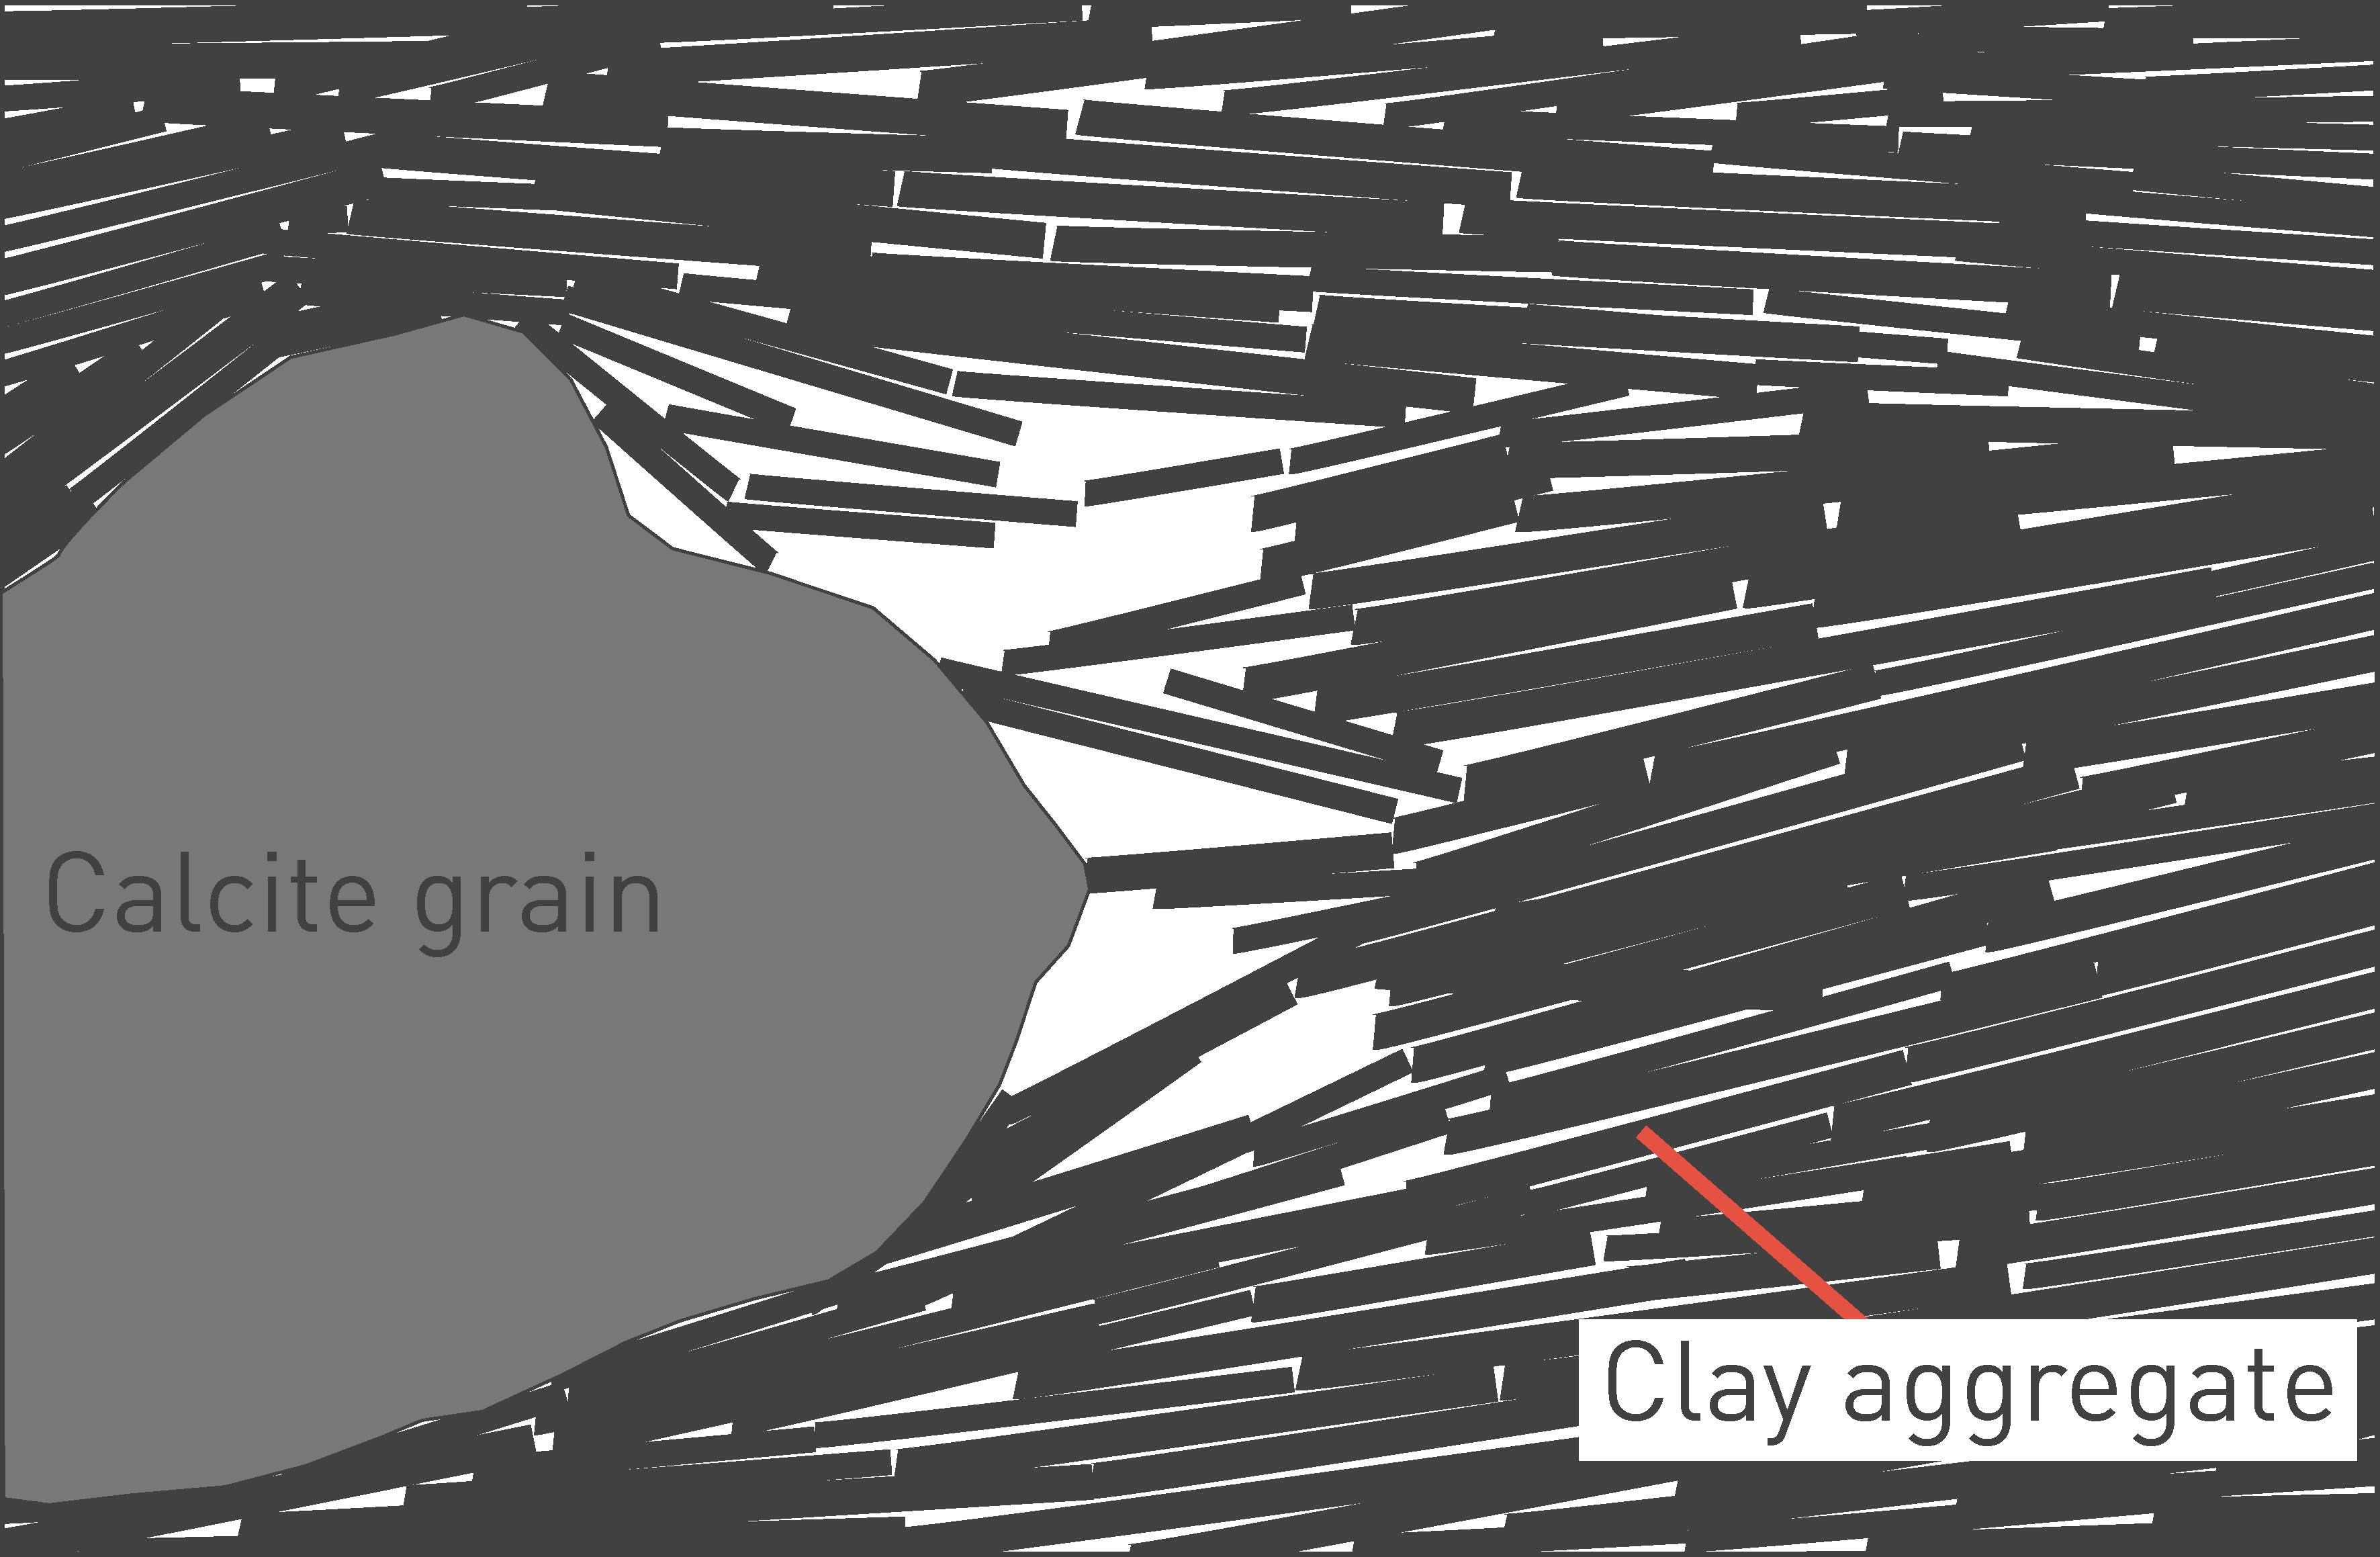
Fig. 5‑12:Conceptual view of the porosity types (white) in clay-carbonate mixtures
Redrawn from Mazurek et al. (2023a). Sketch width is ~ 1 µm.
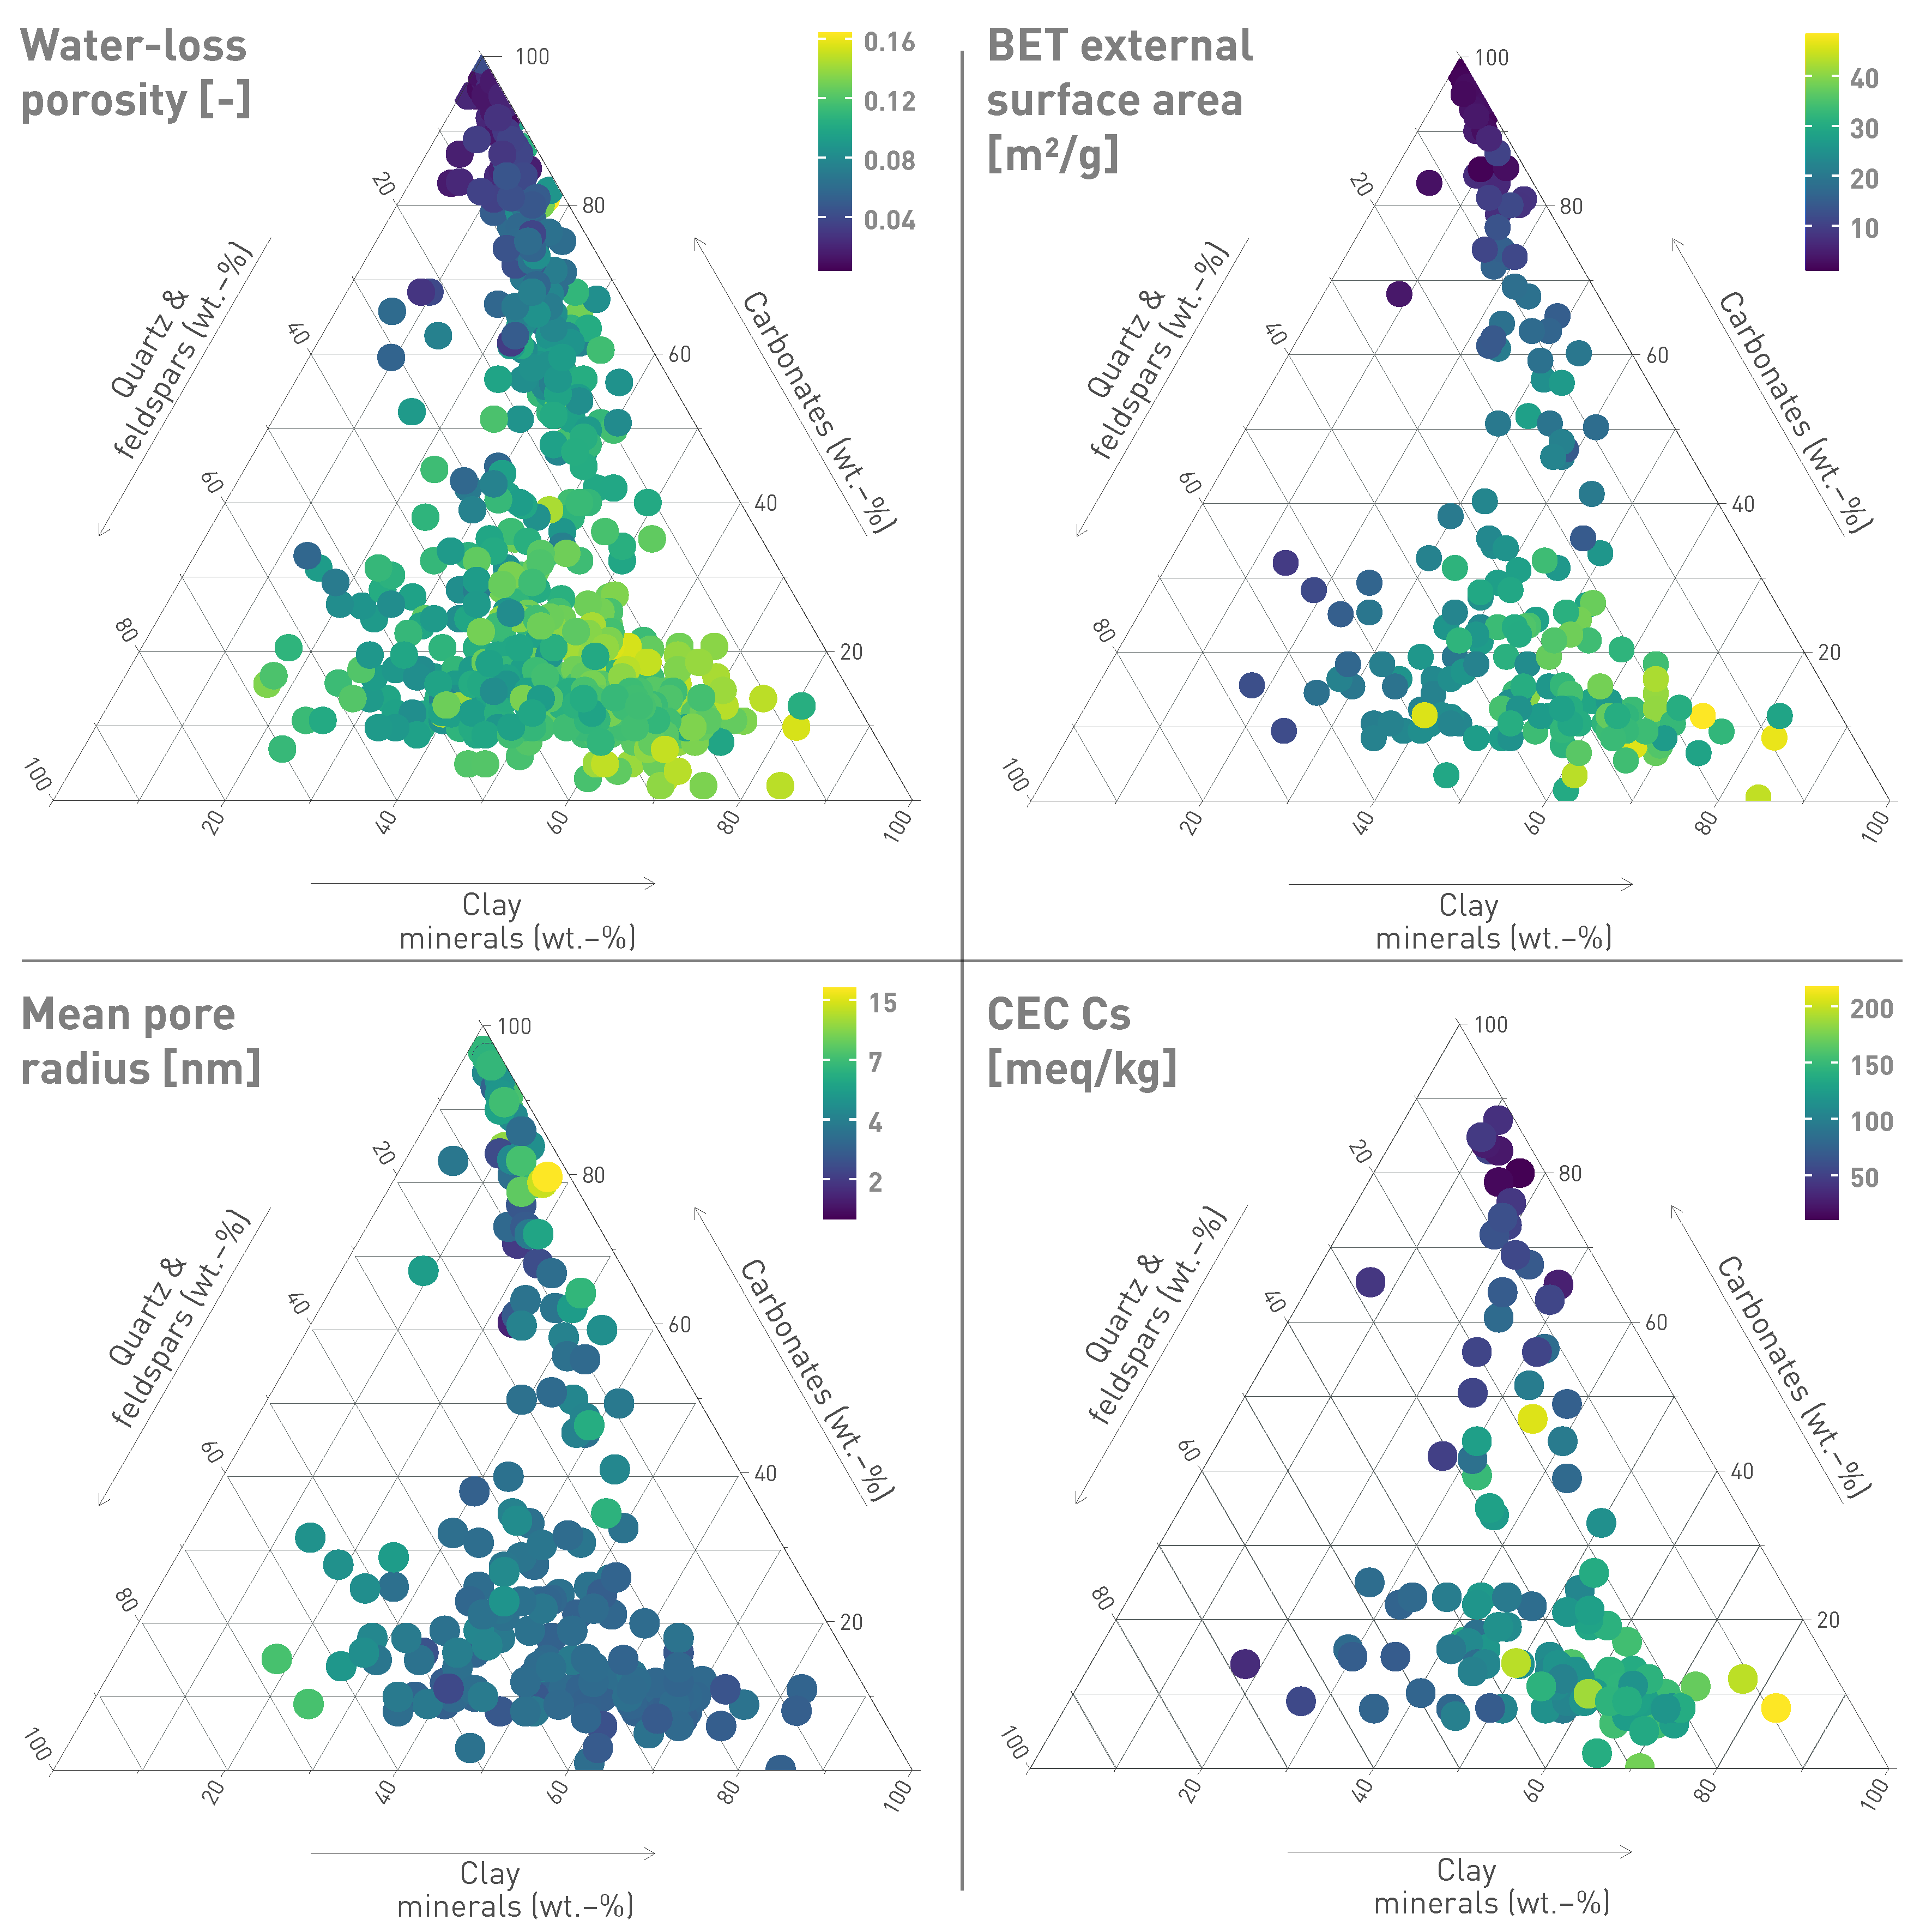
Fig. 5‑13:Key rock data for Jurassic samples from TBO boreholes shown in the Füchtbauer triangle
Axes are in wt.-%. Samples with > 10 wt.-% minerals other than those represented by the triangle are excluded. After Füchtbauer (1988).
Fig. 5‑14 shows the relationship between clay-mineral content and porosity for a number of formations under investigation in the context of radioactive waste disposal (OECD/NEA 2022). The Opalinus Clay is among the units richest in clay minerals and exhibits some of the lowest porosities of the clay-rich rocks shown. The absence of a correlation between clay-mineral content and porosity is because the maximum burial depth and therefore degree of compaction varies widely among the different units (e.g. < 500 m for the Belgian clays, 4'000 m for the Boda Claystone Formation in Hungary).
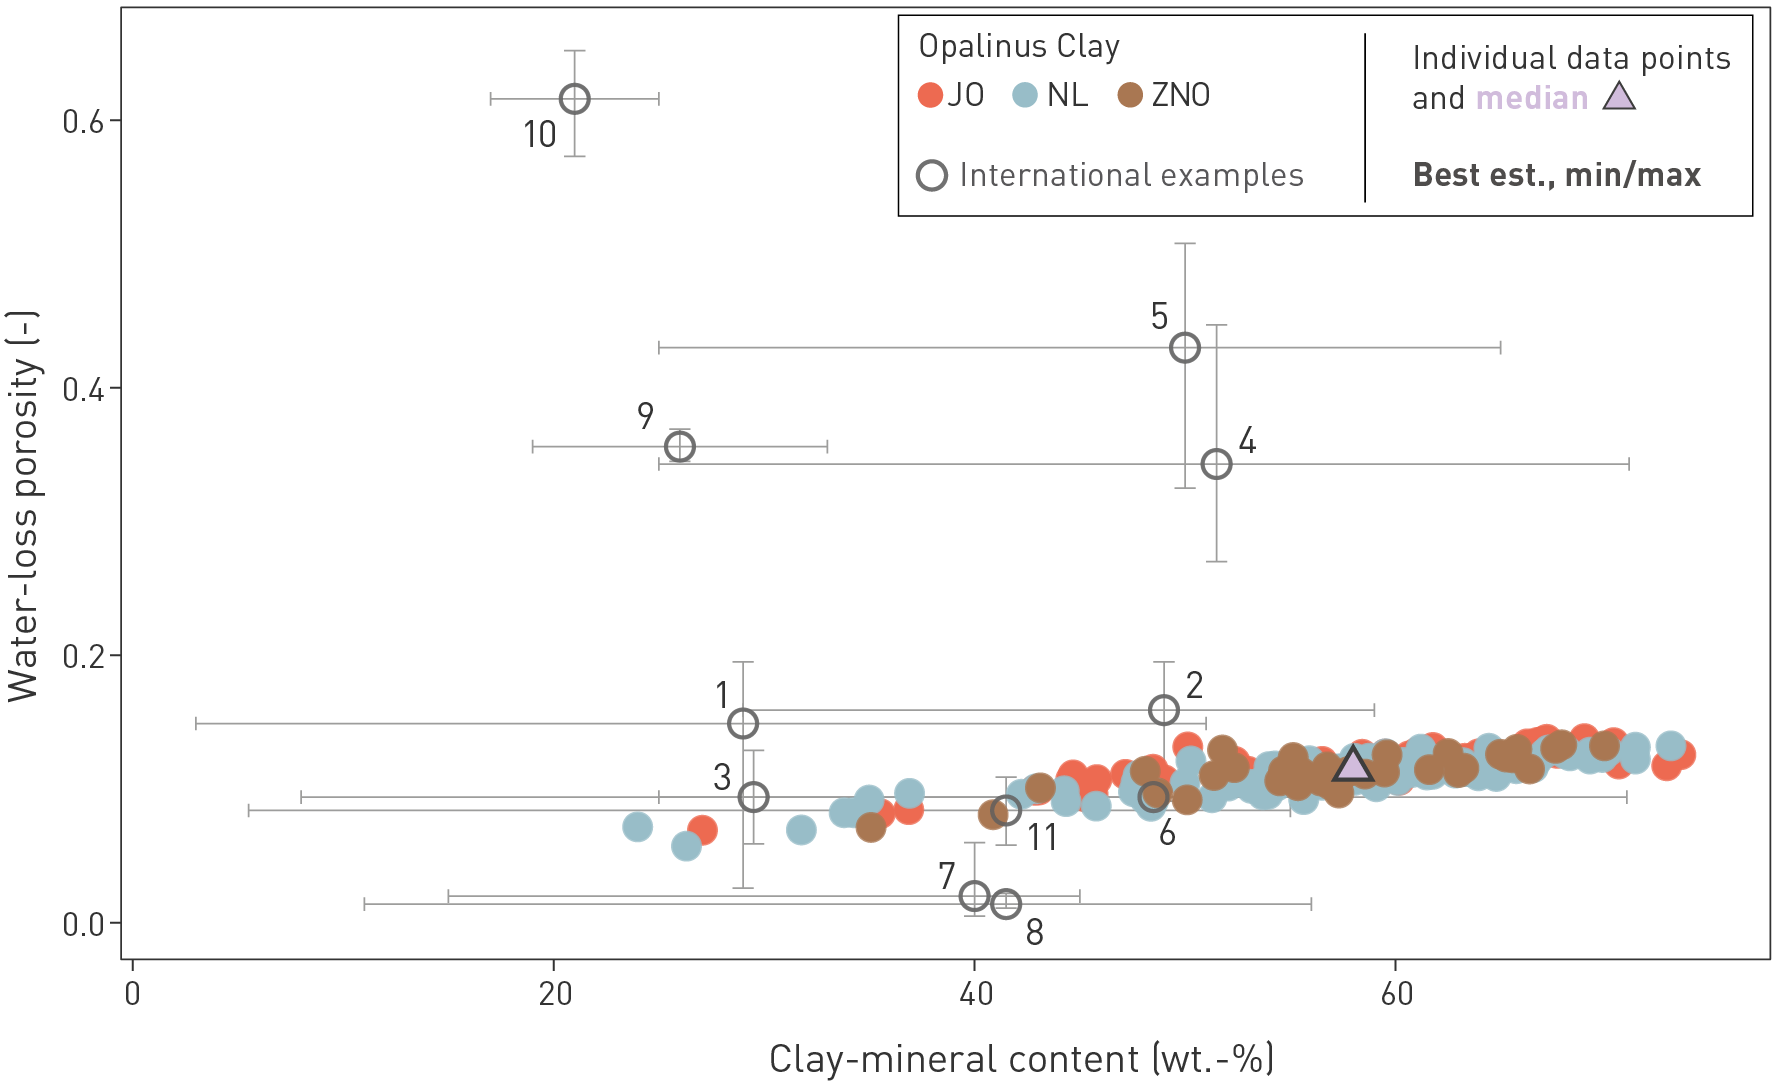
Fig. 5‑14:Water-loss porosity of the Opalinus Clay as a function of clay-mineral content and comparison to other clay-rich rocks
The figure shows drill-core analyses of the Opalinus Clay from the TBO boreholes and the related median value. International data are from the Clay Club Catalogue (OECD/NEA 2022). 1: Callovo-Oxfordian at Meuse/Haute Marne, silty-calc. unit (F); 2: Callovo-Oxfordian at Meuse/Haute Marne, clay-rich unit (F); 3: Toarcian-Domerian at Tournemire (F); 4: Boom Clay at Mol (B); 5: Ypresian Clay at Kallo/Doel (B); 6: Georgian Bay Formation at Bruce nuclear site (CDN); 7: Boda Claystone Formation, Gorica block (H); 8: Boda Claystone Formation, Boda block (H); 9: Wakkanai Formation at Horonobe (JP), 10: Koetoi Formation at Horonobe (JP), 11: Queenston Formation (CDN). est.: estimate.