
A schematic of the mechanical response of the Opalinus Clay depending on effective stress paths is presented in Fig. 5‑24, in the plane deviator stress versus mean effective stress. Deviator stress is intended here as the maximum minus the minimum principal stress applied, while mean effective stress is the average of the three principal effective stress components.
If the change in stress remains in the elastic domain, the deformation is reversible. Once the stress applied exceeds the elastic domain, part of the deformation will be reversible (elastic), and part will be irreversible (plastic and the elastic domain will expand).
The failure envelope defines the strength of the material, which is dependent on the mean effective stress. Along the failure envelope, the material is not able to sustain further stress increments without the formation of fractures.
Along the curved part of the envelope in the tensile strength domain, low deviator and mean effective stress provide conditions for the initiation of mode I tensile fractures, which might be induced by, e.g., pore pressure increments at low confining stress. For intermediate confinement levels and high deviator stress, shear fractures can be induced. Along the right-hand side of Fig. 5‑24, compaction occurs for high mean and relatively low deviator stress. Some material compaction might be localised (as in a compaction band), while in plastic materials compaction results in a more irreversible volume decrease associated with porosity reduction. Combinations and arrangements between shear and dilation fractures (mixed mode I and II) and compaction structures will occur under intermediate stress conditions.
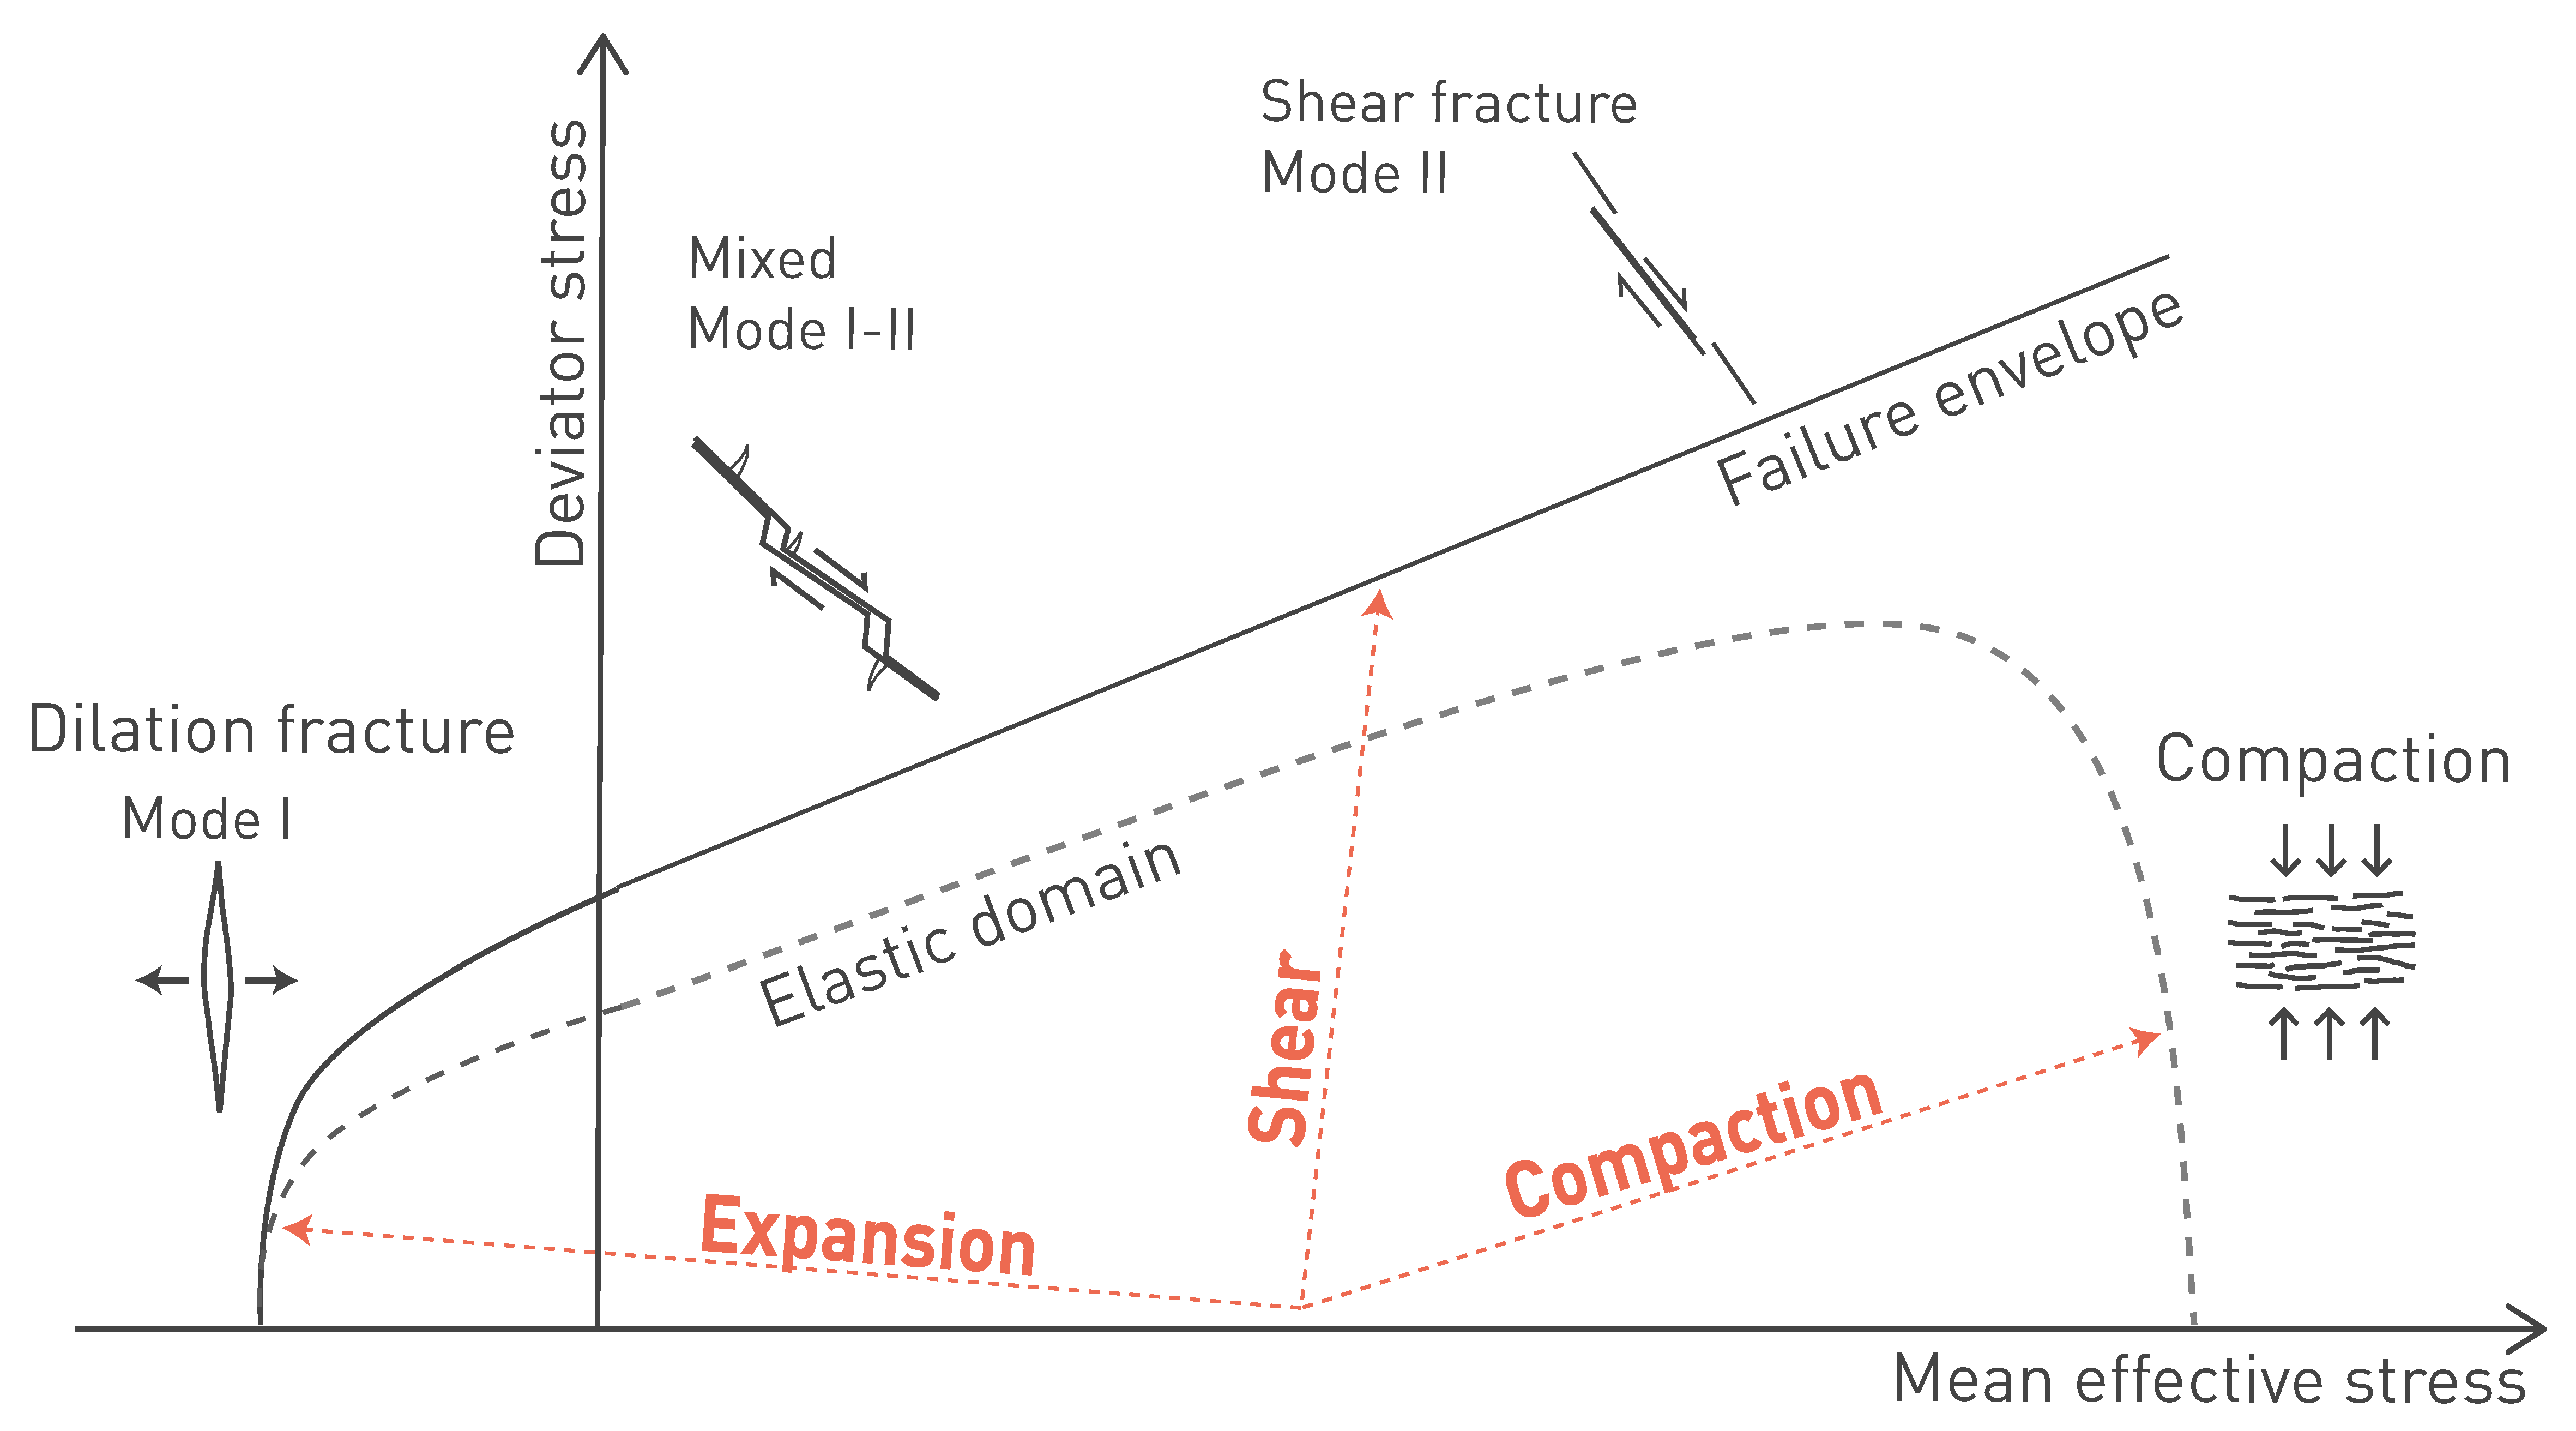
Fig. 5‑24:Schematic of the mechanical response of the Opalinus Clay for different stress paths
Dilation is associated with extensional fractures (mode I) and shear fractures at low effective mean stress (mixed mode I and II). At higher mean effective stress, compactional shear dominates.
During fast loading (and unloading), the pore fluid contained in the pore space is subject to over- (or under-) pressure that dissipates over time. The dissipation of the pore pressure variation is strictly related to the formation permeability. To study the mechanical response of low-porosity geomaterial, it is necessary to analyse both the pore pressure and stress changes through the evolution of the effective stress.
The Opalinus Clay has a low stiffness compared to most other rocks, and high strain to failure. In contrast to other rocks, once the stress to which the material is subjected exceeds the elastic realm, the material can continue to sustain increased loading and accommodate deformation (hardening) before reaching the maximum deviator stress (strength). With further loading after reaching the strength value, the material does not dramatically lose its capacity to sustain load (as brittle response typical of rocks) but can still accommodate a significant deviator stress of approximately 50 to 70% of the strength value. This is commonly referred to as quasi-brittle behaviour.
Over 150 laboratory triaxial tests were conducted on the Opalinus Clay and confining units to characterise the hydromechanical response of these geomaterials in detail, and to explore material variability. Dedicated and benchmarked testing protocols (Minardi et al. 2021) were adopted. These testing protocols are also in accordance with new procedures suggested for triaxial testing of shales currently being finalised by the International Society of Rock Mechanics. The dedicated protocols ensure sufficient pore fluid pressure equilibration to derive effective material parameters, but also avoid damage to the specimens by swelling during the early saturation phase (Crisci et al. 2024a).
Examples of stress paths and stress-strain evolutions during triaxial testing of three contrasting Mesozoic sediments are shown in Fig. 5‑25. For specimens of the Opalinus Clay and the Wedelsandstein Formation, the initial linear elastic stress – strain response transitions into non-linear up to peak (strength). After peak, softening occurs, i.e. progressive reduction of the sustained stress as strain increases until reaching a relatively stable value (usually referred to as post-peak strength). At this point, a clear failure surface has been created within the sample, and further shearing will develop as movement along the surface.
Rocks such as the limestones of the Villigen Formation exhibit a much stronger increase in stress because of their high stiffness when shortening is applied and the elastic domain extends close to the failure envelope (Fig. 5‑24). This is then followed by a more brittle response with a stronger reduction in sustained stress after peak. The differences in stiffness and plastic response between the Opalinus Clay and such competent rocks have implications for the stress concentration (Section 4.4) and the tectonic overprint (Sections 4.3.5 and 5.5.4).
The stress paths shown in Fig. 5‑25 correspond to undrained tests, i.e. the pore fluid volume in the sample remains constant during loading. An increase (or decrease) in pore pressure is related to the specimen’s attempt to reduce (or increase) its volume. Since water cannot escape (or enter) the sample in undrained conditions, pore pressure increases (or decreases). As loading progresses, pore pressure is increased until reaching a maximum value, then decreases. It is noted that, given the low permeability of the Opalinus Clay and the confining units, a slow shear rate needs to be used to ensure that the measured pore pressure is representative of the entire sample volume.
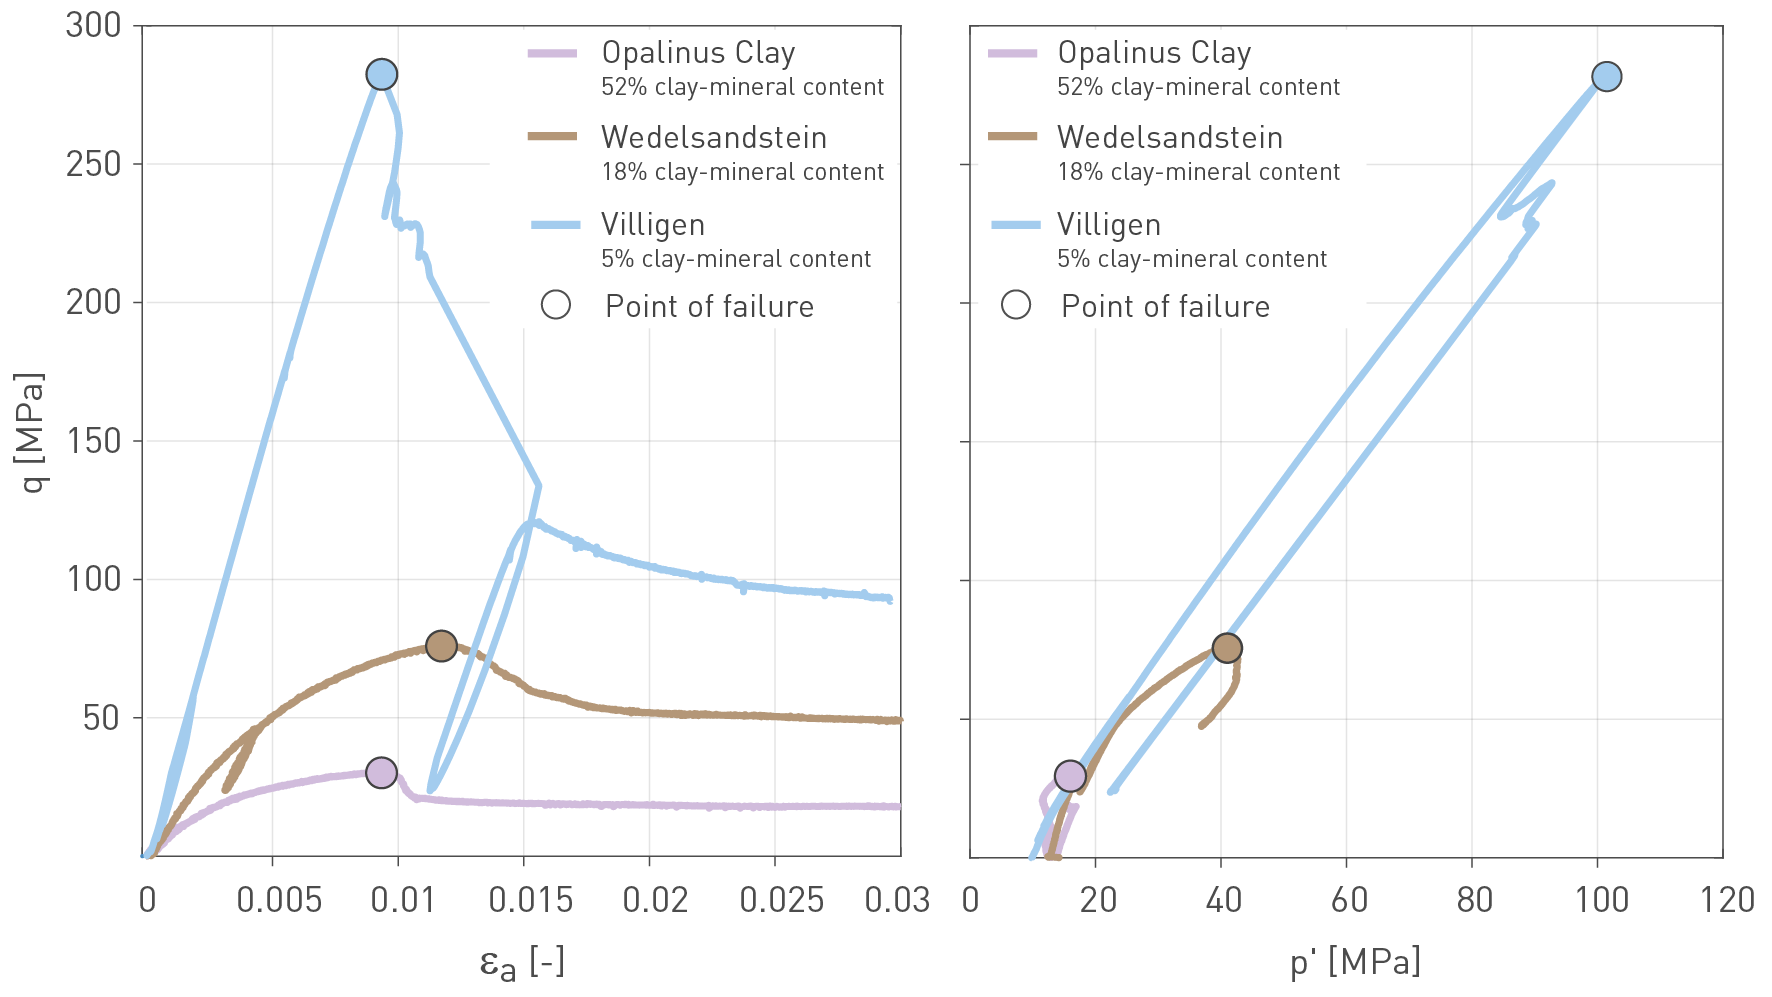
Fig. 5‑25:Different mechanical response of Mesozoic sedimentary rocks with contrasting clay-mineral contents
Left side: deviator stress (q) vs. axial strain (εa). Right side: Deviator stress (q) vs. mean effective stress (p'). Data from Dossier IX of TBO reports in Tab. 2‑1.
The Opalinus Clay shows a cross-anisotropic (or transversely isotropic) behaviour (Section 5.5.5), i.e. the response in the direction orthogonal to the bedding plane is different from the response in the bedding plane direction. Despite the heterogeneity of the formation, the shear strength shows limited variability in all the tested directions with respect to bedding (Crisci et al. 2024b).
The shear strength of all triaxial tests loaded perpendicular to the bedding direction (S-specimens) of the Opalinus Clay tested in the TBO campaign is reported in Fig. 5‑26 by borehole, in terms of axial versus radial effective stress. Results are colour-coded by sample bulk density. Bulk density is adopted because it depends on both the effect of the mineralogical composition and the porosity of the sample. Despite the range of sourcing depth in the 7 boreholes (450 m – 1'000 m), the range of mineralogy (35% to 70% clay-mineral content) and porosity (0.10 to 0.14) tested, only minor strength differences emerge. The same observation was also made in the other testing directions (parallel and at an angle to bedding).
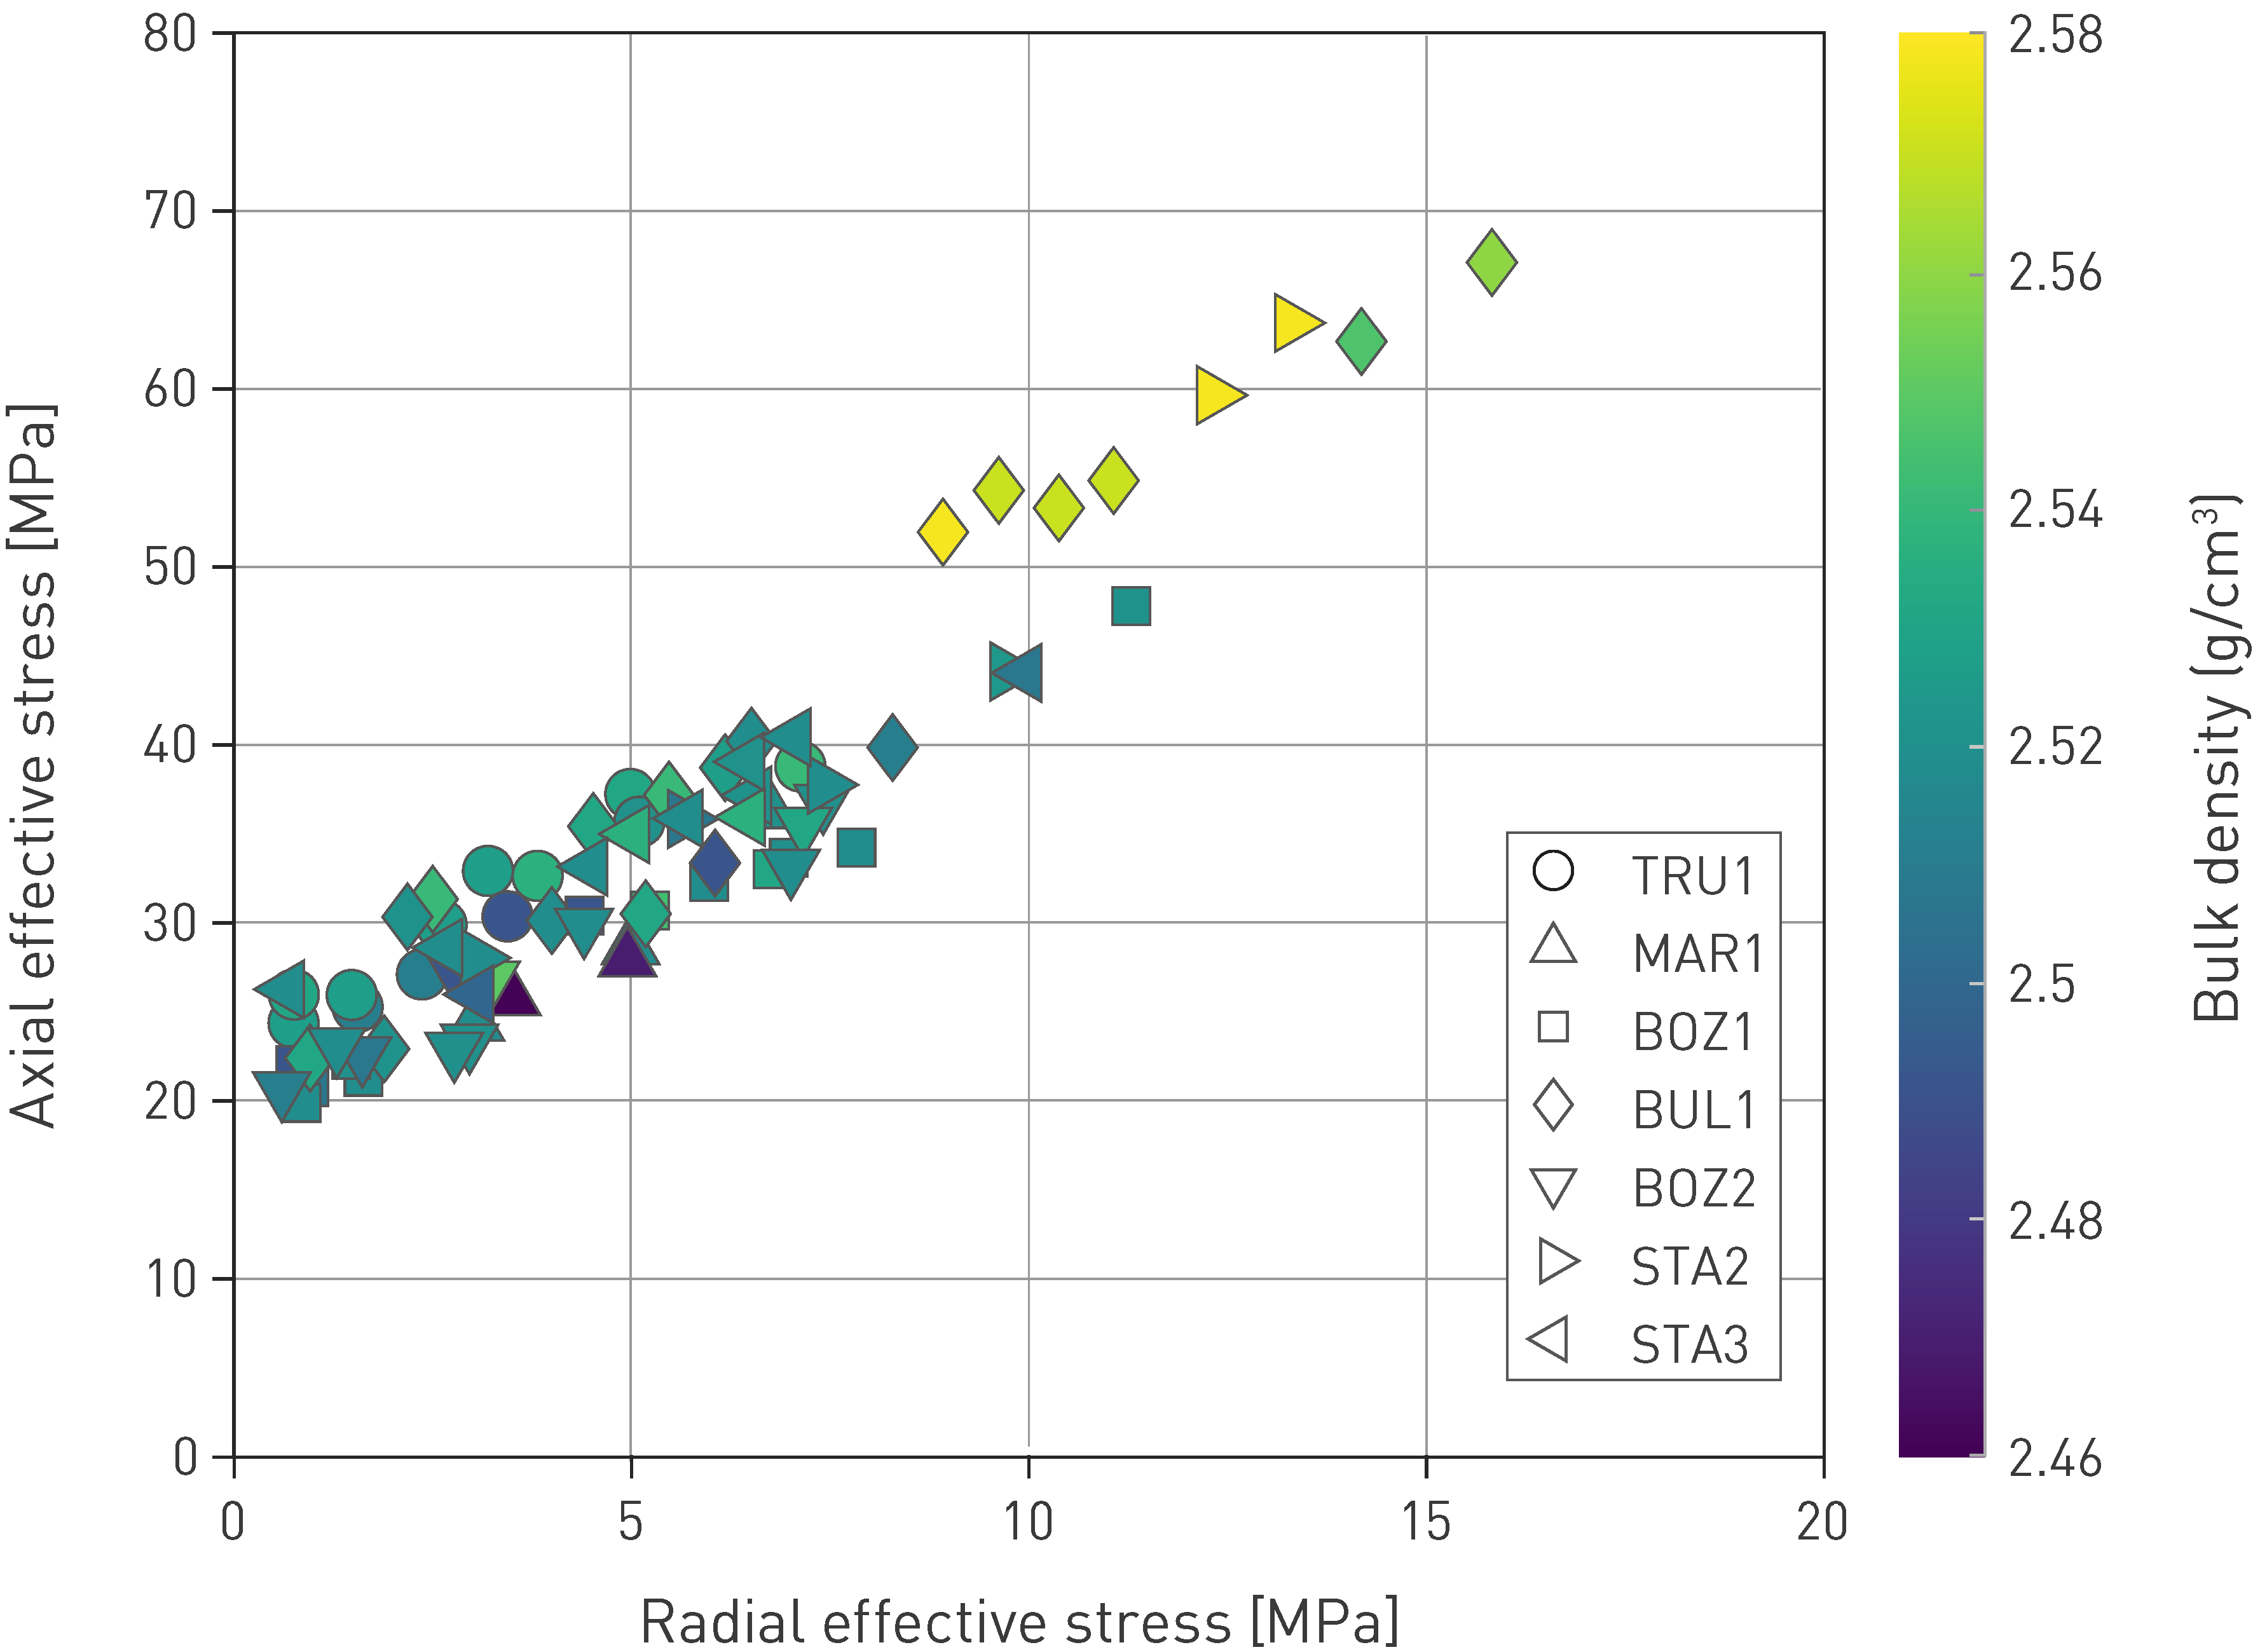
Fig. 5‑26:Shear strength of the Opalinus Clay from the siting regions
Loading of the cylindrical specimens was in axial direction, prependicular to bedding. Note: The intersection of the regression line (not shown) with the y-axis would correspond to the calculated effective unconfined compressive strength (approximately 21 ± 5 MPa). Detailed data analysis can be found in Crisci et al. (2024b).
The shear strength values of the Opalinus Clay from the siting regions (TBO campaign) contrast with results obtained from the Mont Terri rock laboratory (FMT), particularly for samples with high clay-mineral contents (shaly facies; Fig. 5‑27). This is related to the difference in porosity, especially between shaly facies and TBO results (approximately 0.12 to 0.17 vs. 0.10 to 0.13; Crisci et al. 2024b). Therefore, the different burial history and difference in current depth between TBO (400 to 1'000 m) and FMT (220 to 320 m) clearly influences the strength of the clay-mineral-rich endmember of the Opalinus Clay.
In contrast to shear strength of the intact material, no major discrepancy is seen for test results of TBO and FMT samples for post-peak strengths (Fig. 5‑27 right), but differences appear to be related to facies type (mineralogy). In summary, where intact strength values are homogenised across the facies with greater burial, i.e. controlled by the burial history, post-peak strength seems to be controlled by mineralogy (Crisci et al. 2024b).
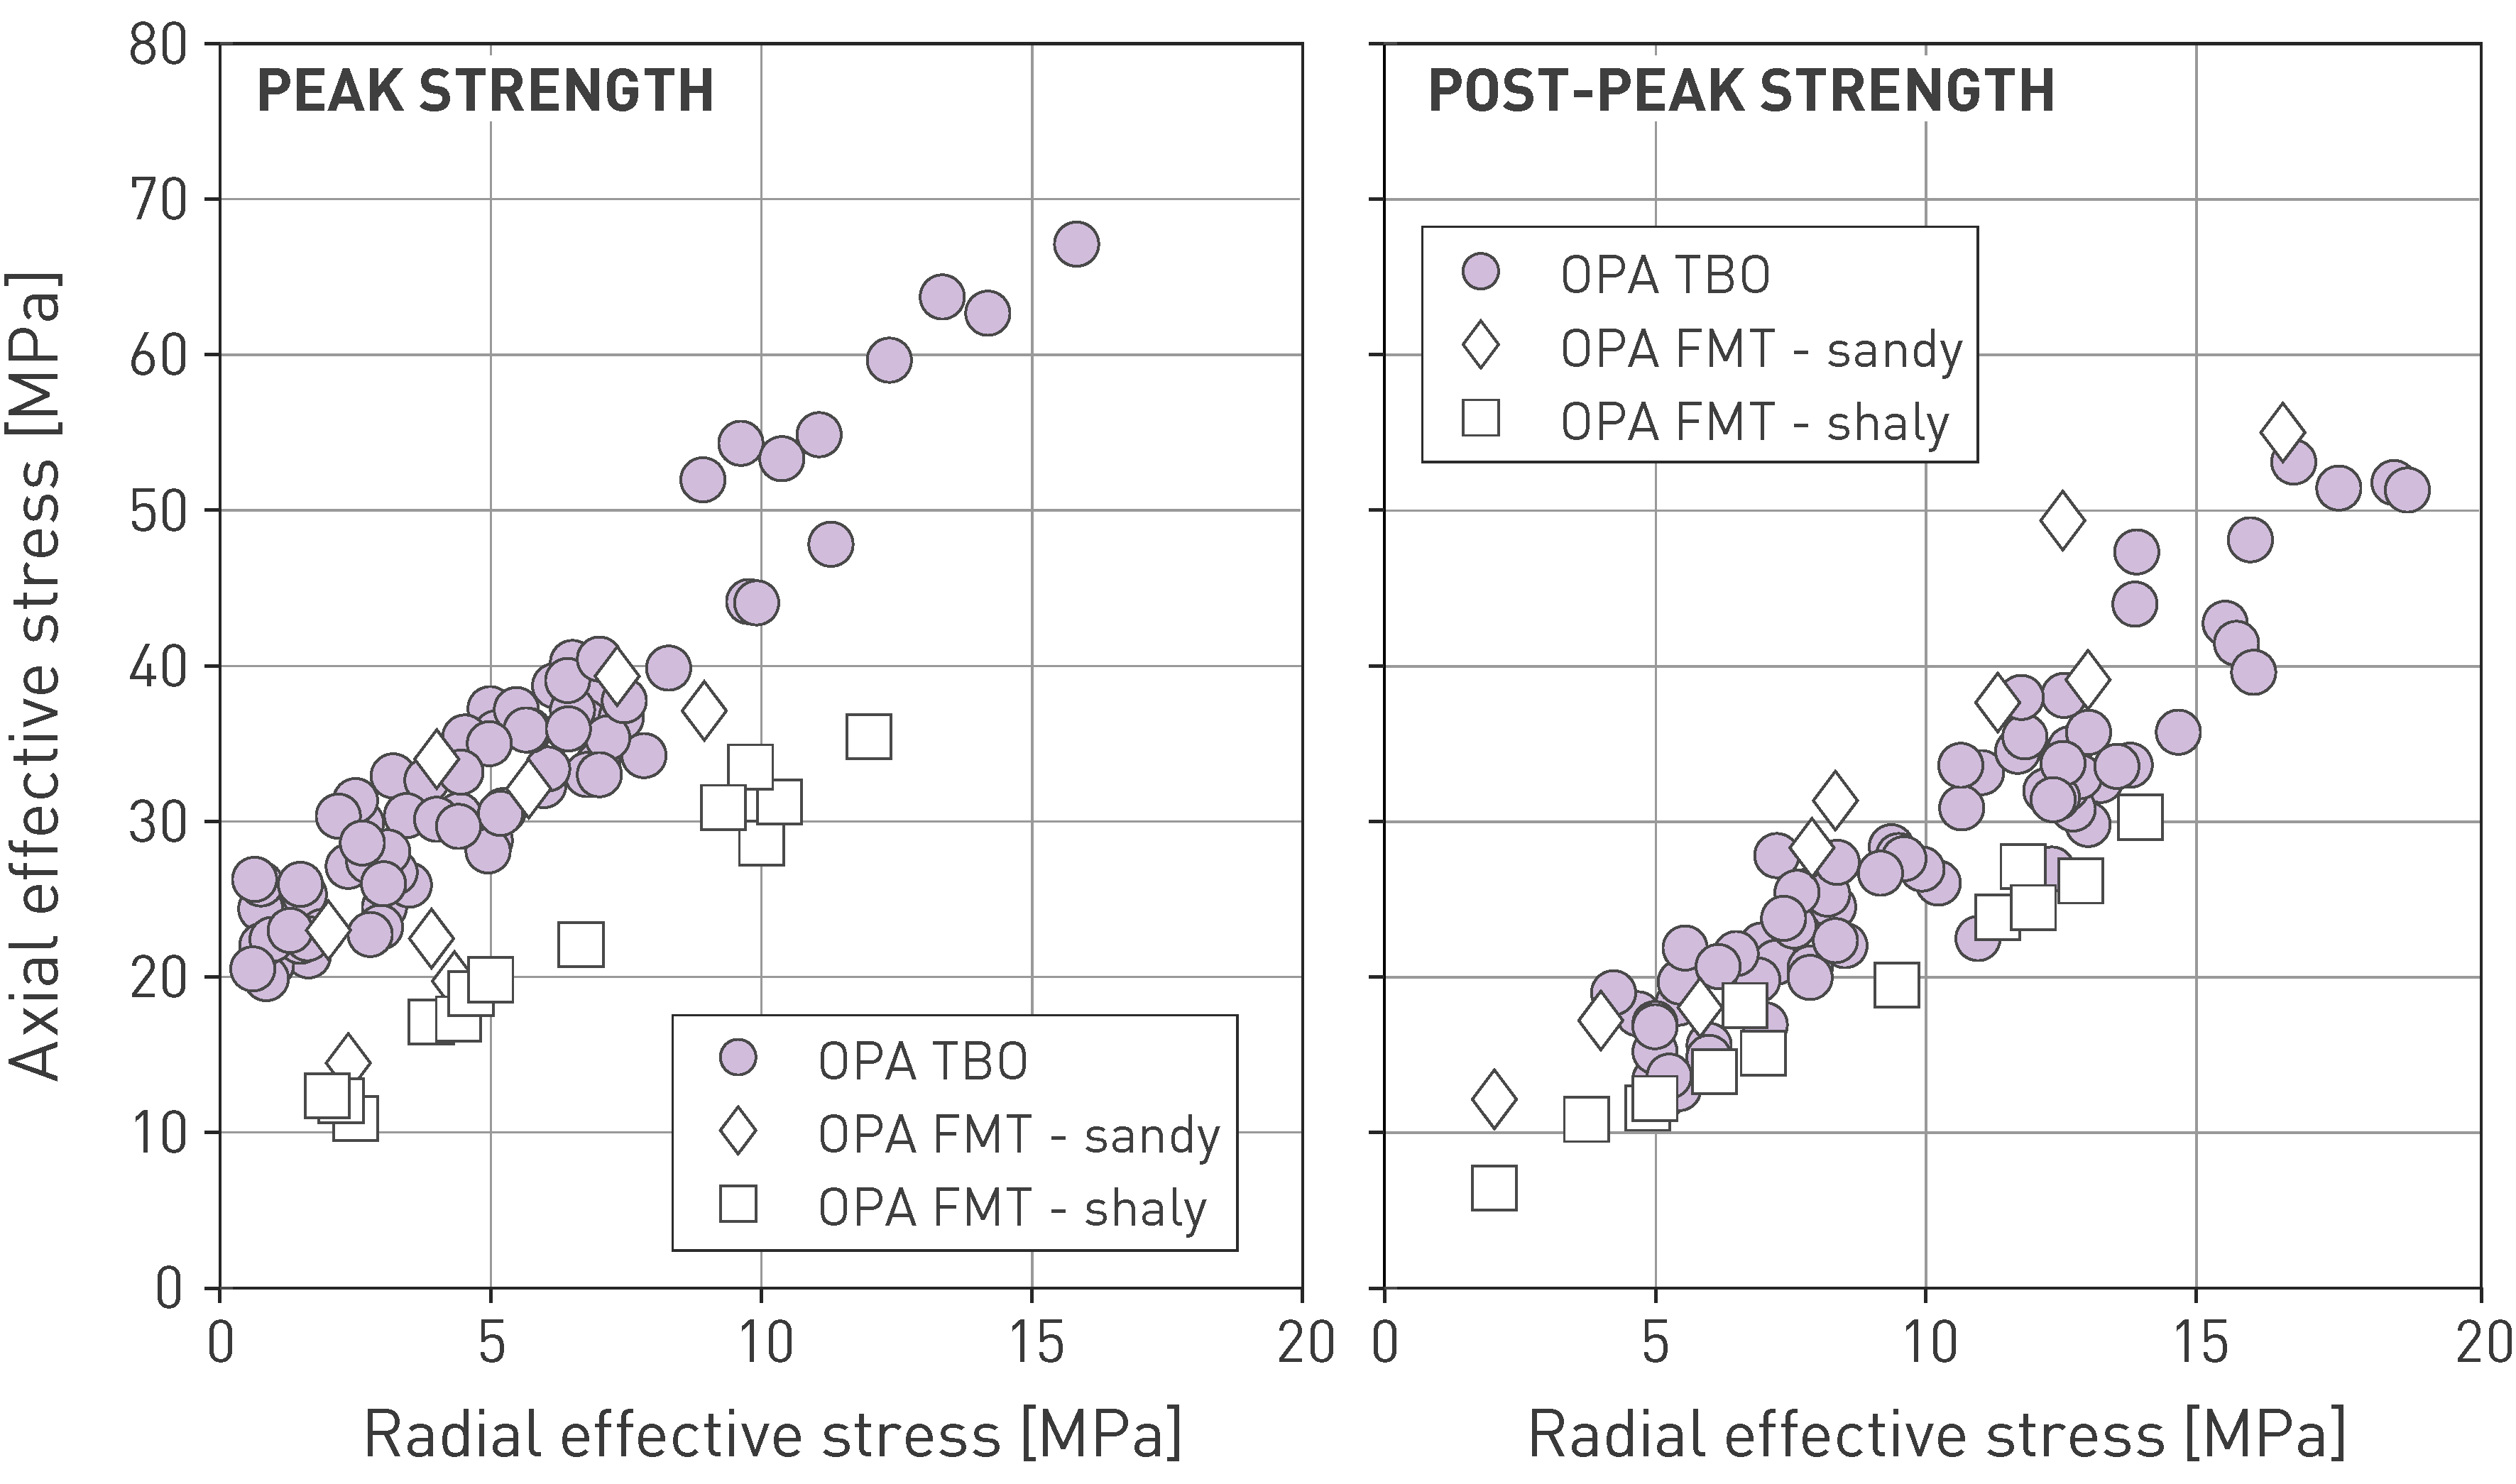
Fig. 5‑27:Peak and post-peak strength of the Opalinus Clay in the siting regions in comparison to Mont Terri
All test results are for specimens loaded perpendicular to bedding, and each data point reflects stresses at point of failure (peak strength) or after development of deformation band (post-peak strength). TBO data are from Crisci et al. (2024b). Mont Terri rock laboratory (FMT) data are from Crisci et al. (2021), Favero et al. (2018) and Minardi et al. (2019).
No significant differences in shear strength were observed with depth or between siting regions. Fig. 5‑26 and Fig. 5‑27 also indirectly illustrate the strength differences of the Opalinus Clay compared to estimates prior to the TBO campaign. The estimation of the shear strength of the Opalinus Clay in Stage 2 of the Sectoral Plan (SGT) was mainly based on experience from Mont Terri (Marschall & Giger 2016) because of the small size of the database for the siting regions. This led to a relatively low reference value for the unconfined compressive strength (~ 10 MPa). In contrast, the unconfined compressive strength of the new TBO data varies between approximately 16 and 26 MPa. This is clearly greater than the reference value and partly even greater than the upper bound of SGT Stage 2 (20 to 22 MPa). The range of strengths of Opalinus Clay from the TBO results are also very similar to the Callovo-Oxfordian clay-rocks at Meuse / Haute Marne (OECD/NEA 2022).
Besides laboratory testing, elastic properties of the Opalinus Clay and confining units were also assessed through direct field measurements at larger scale, via pressure meter tests (Elkhoury et al. 2022, Elkhoury et al. in press). Pressure meter testing (PMT) is a formation test that consists of inflating a cylindrical packer inside a borehole, while measuring the radial deformation as a function of packer pressure. Measurement of fluid volume injected into the packer serves as a measure of borehole deformation, therefore changes in packer pressure associated with changes in injected fluid volume provide a direct measurement of formation stiffness. Results from five pressure meter stations allow a direct comparison between the laboratory and field determination of the shear modulus in the direction of the bedding plane (G//). The impact of the difference in scales (a few cm in the laboratory, a few decimetres in the field) was investigated via dedicated numerical analysis and was found to be negligible. Field moduli compare well with moduli derived from laboratory testing but were approximately 10 – 30% higher than the latter (Elkhoury et al. in press, Nagra 2024m). The main cause of the difference is identified in the strain dependency of the elastic moduli determination, in agreement with findings in similar investigations at Mont Terri (Liu et al. 2022).
Overall, there is an excellent database on the geomechanical properties of the Opalinus Clay from both laboratory and field measurements. The good understanding of the deformation behaviour of the Opalinus Clay is also reflected in detailed constitutive laws, which have been further improved over recent years (e.g. Parisio & Laloui 2017, Khaledi et al. 2023). An advanced elasto-plastic damage model was developed (Madaschi et al. 2023), accounting for the anisotropy in strength and stiffness. The good agreement of modelled evolution of stresses and pore pressure compared with laboratory test results is shown in Fig. 5‑28.
Depending on the purpose of the investigation, somewhat simpler constitutive models have also been developed and calibrated on the new Opalinus Clay database (e.g. Nordas et al. 2024).
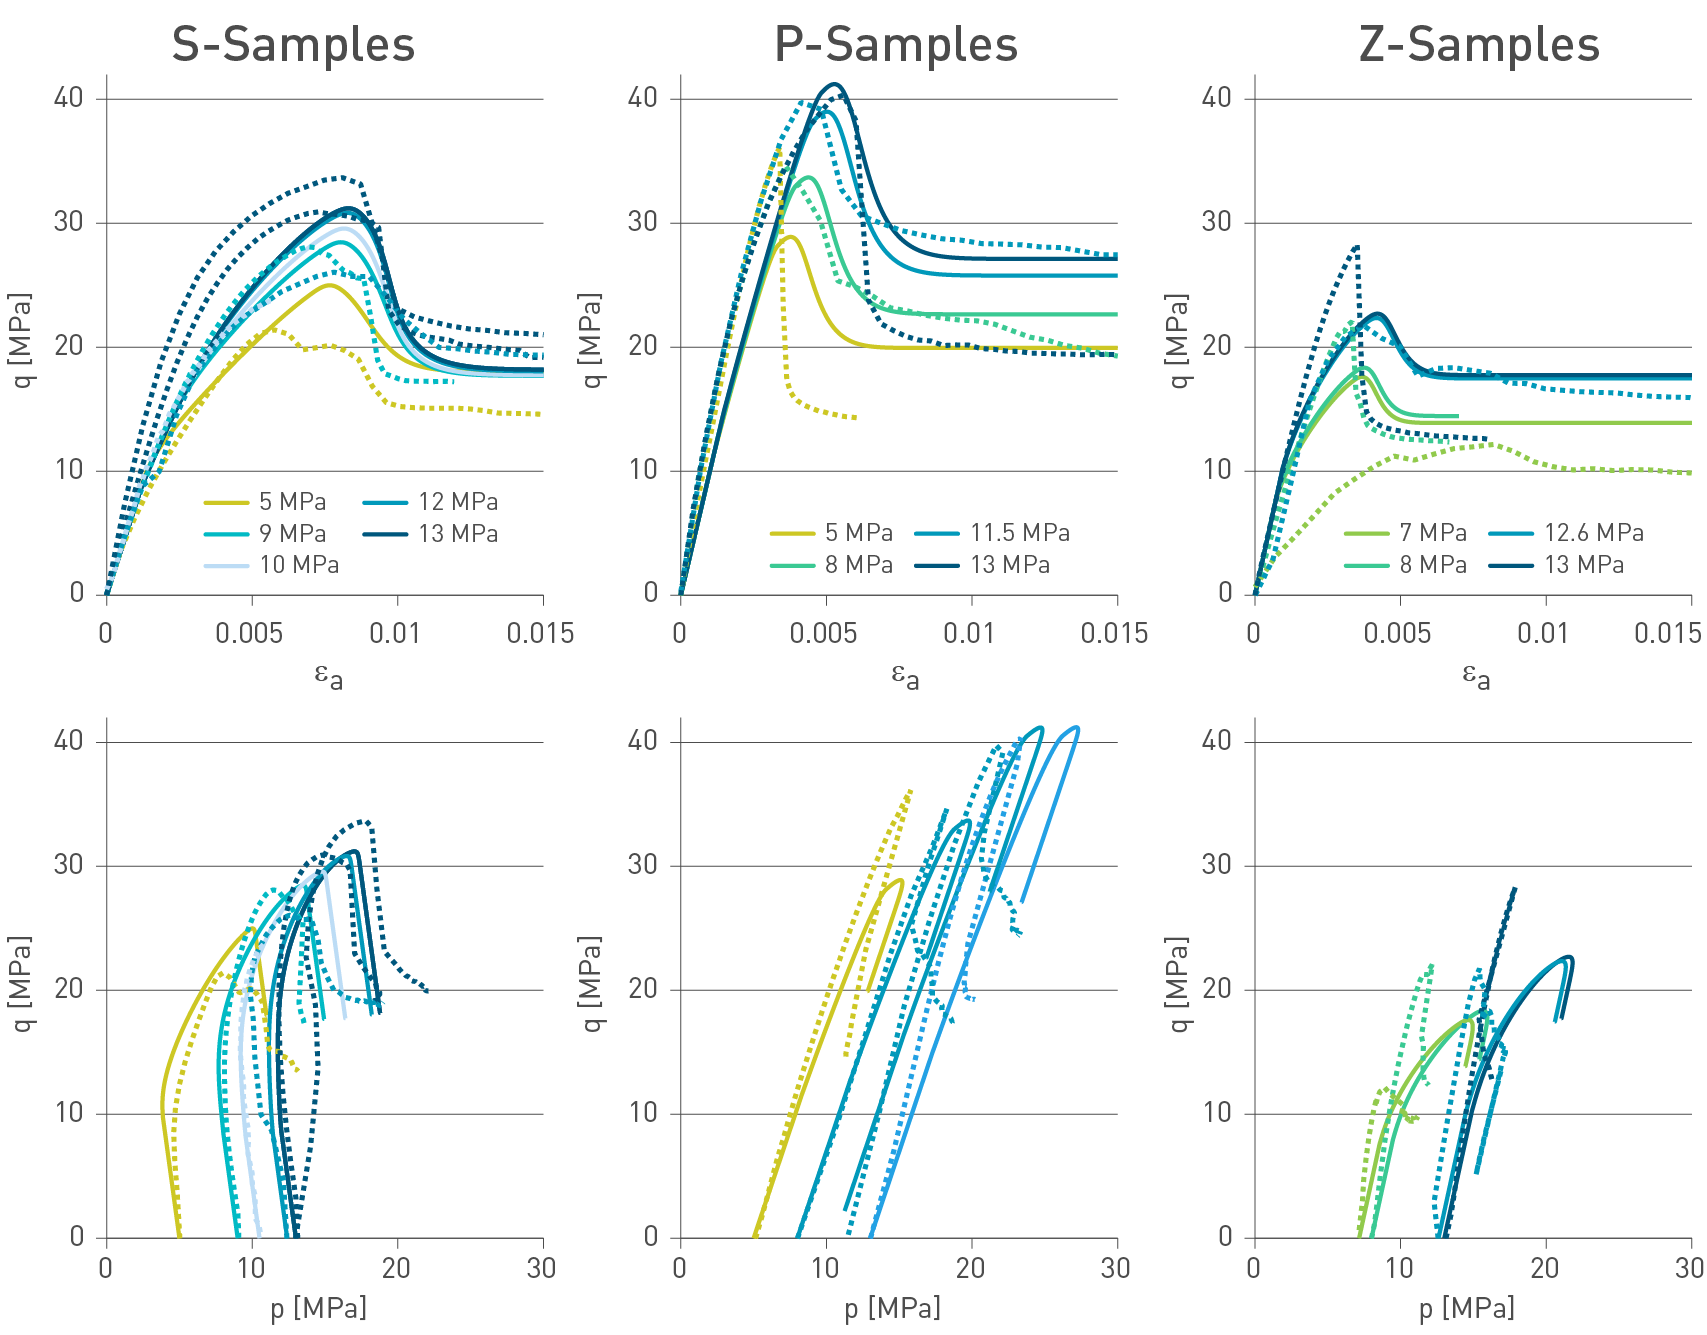
Fig. 5‑28:Comparison of mechanical behaviour in numerical (bold lines) and laboratory test results (dashed lines)
Plots above show deviator stress q as a function of axial strain εa, and plots below show stress paths, i.e. q as a function of the mean effective stress p'. Results are grouped by loading direction with respect to bedding: S = 90º, P = 0º, Z = 30º. After Madaschi et al. (2023).
Transitioning from the peak to the post-peak phase in laboratory tests of the Opalinus Clay is associated with the formation and evolution of slip surfaces and linkage structures between them. A light microscope image showing the deformation feature of a laboratory-deformed specimen is shown in Fig. 5‑29. This specimen contains mm-wide layers which are largely free of clay minerals and was loaded in the direction perpendicular to bedding. Deformation between the hanging wall cylinder and footwall cylinder is accommodated along several shear bands which form an anastomosing network of variable thickness and enclosing relatively undeformed rocks as lenses. The shear band can also be seen to deflect at mineralogical boundaries where dark grey shows clay-mineral-rich intervals and the white bands are quartz- and carbonate-rich layers. The following section relates this microstructural example to the rare field examples of faults in the Opalinus Clay.
The unconfined compressive strength (UCS) of the sedimentary rocks encountered in the deep boreholes varies strongly depending on the rock mineralogical composition. Low clay-mineral content formations generally show higher strength, while strength progressively reduces as the clay-mineral content increases and cementation decreases. The largest decrease in strength is observed for a clay-mineral content from 0 wt.-% to 20 wt.-%, while the decrease is moderate between 20 wt.-% and 40 wt.-%. The UCS remains relatively constant for clay-mineral content values above 40 wt.-%, i.e. in the range of the composition of the Opalinus Clay and many of its confining units (Fig. 5‑30).
For the Opalinus Clay, the range of UCS values in Fig. 5‑30 is extrapolated from triaxial tests (y‑axis intercept in Fig. 5‑26). For the other rock formations, UCS was measured via uniaxial compressive tests in the rock-mechanical testing programme.
Mineralogical composition was measured on the Opalinus Clay samples, while for the other rock samples it was constrained from the core-calibrated logs (Becker & Marnat 2024) for the location where the samples were sourced.
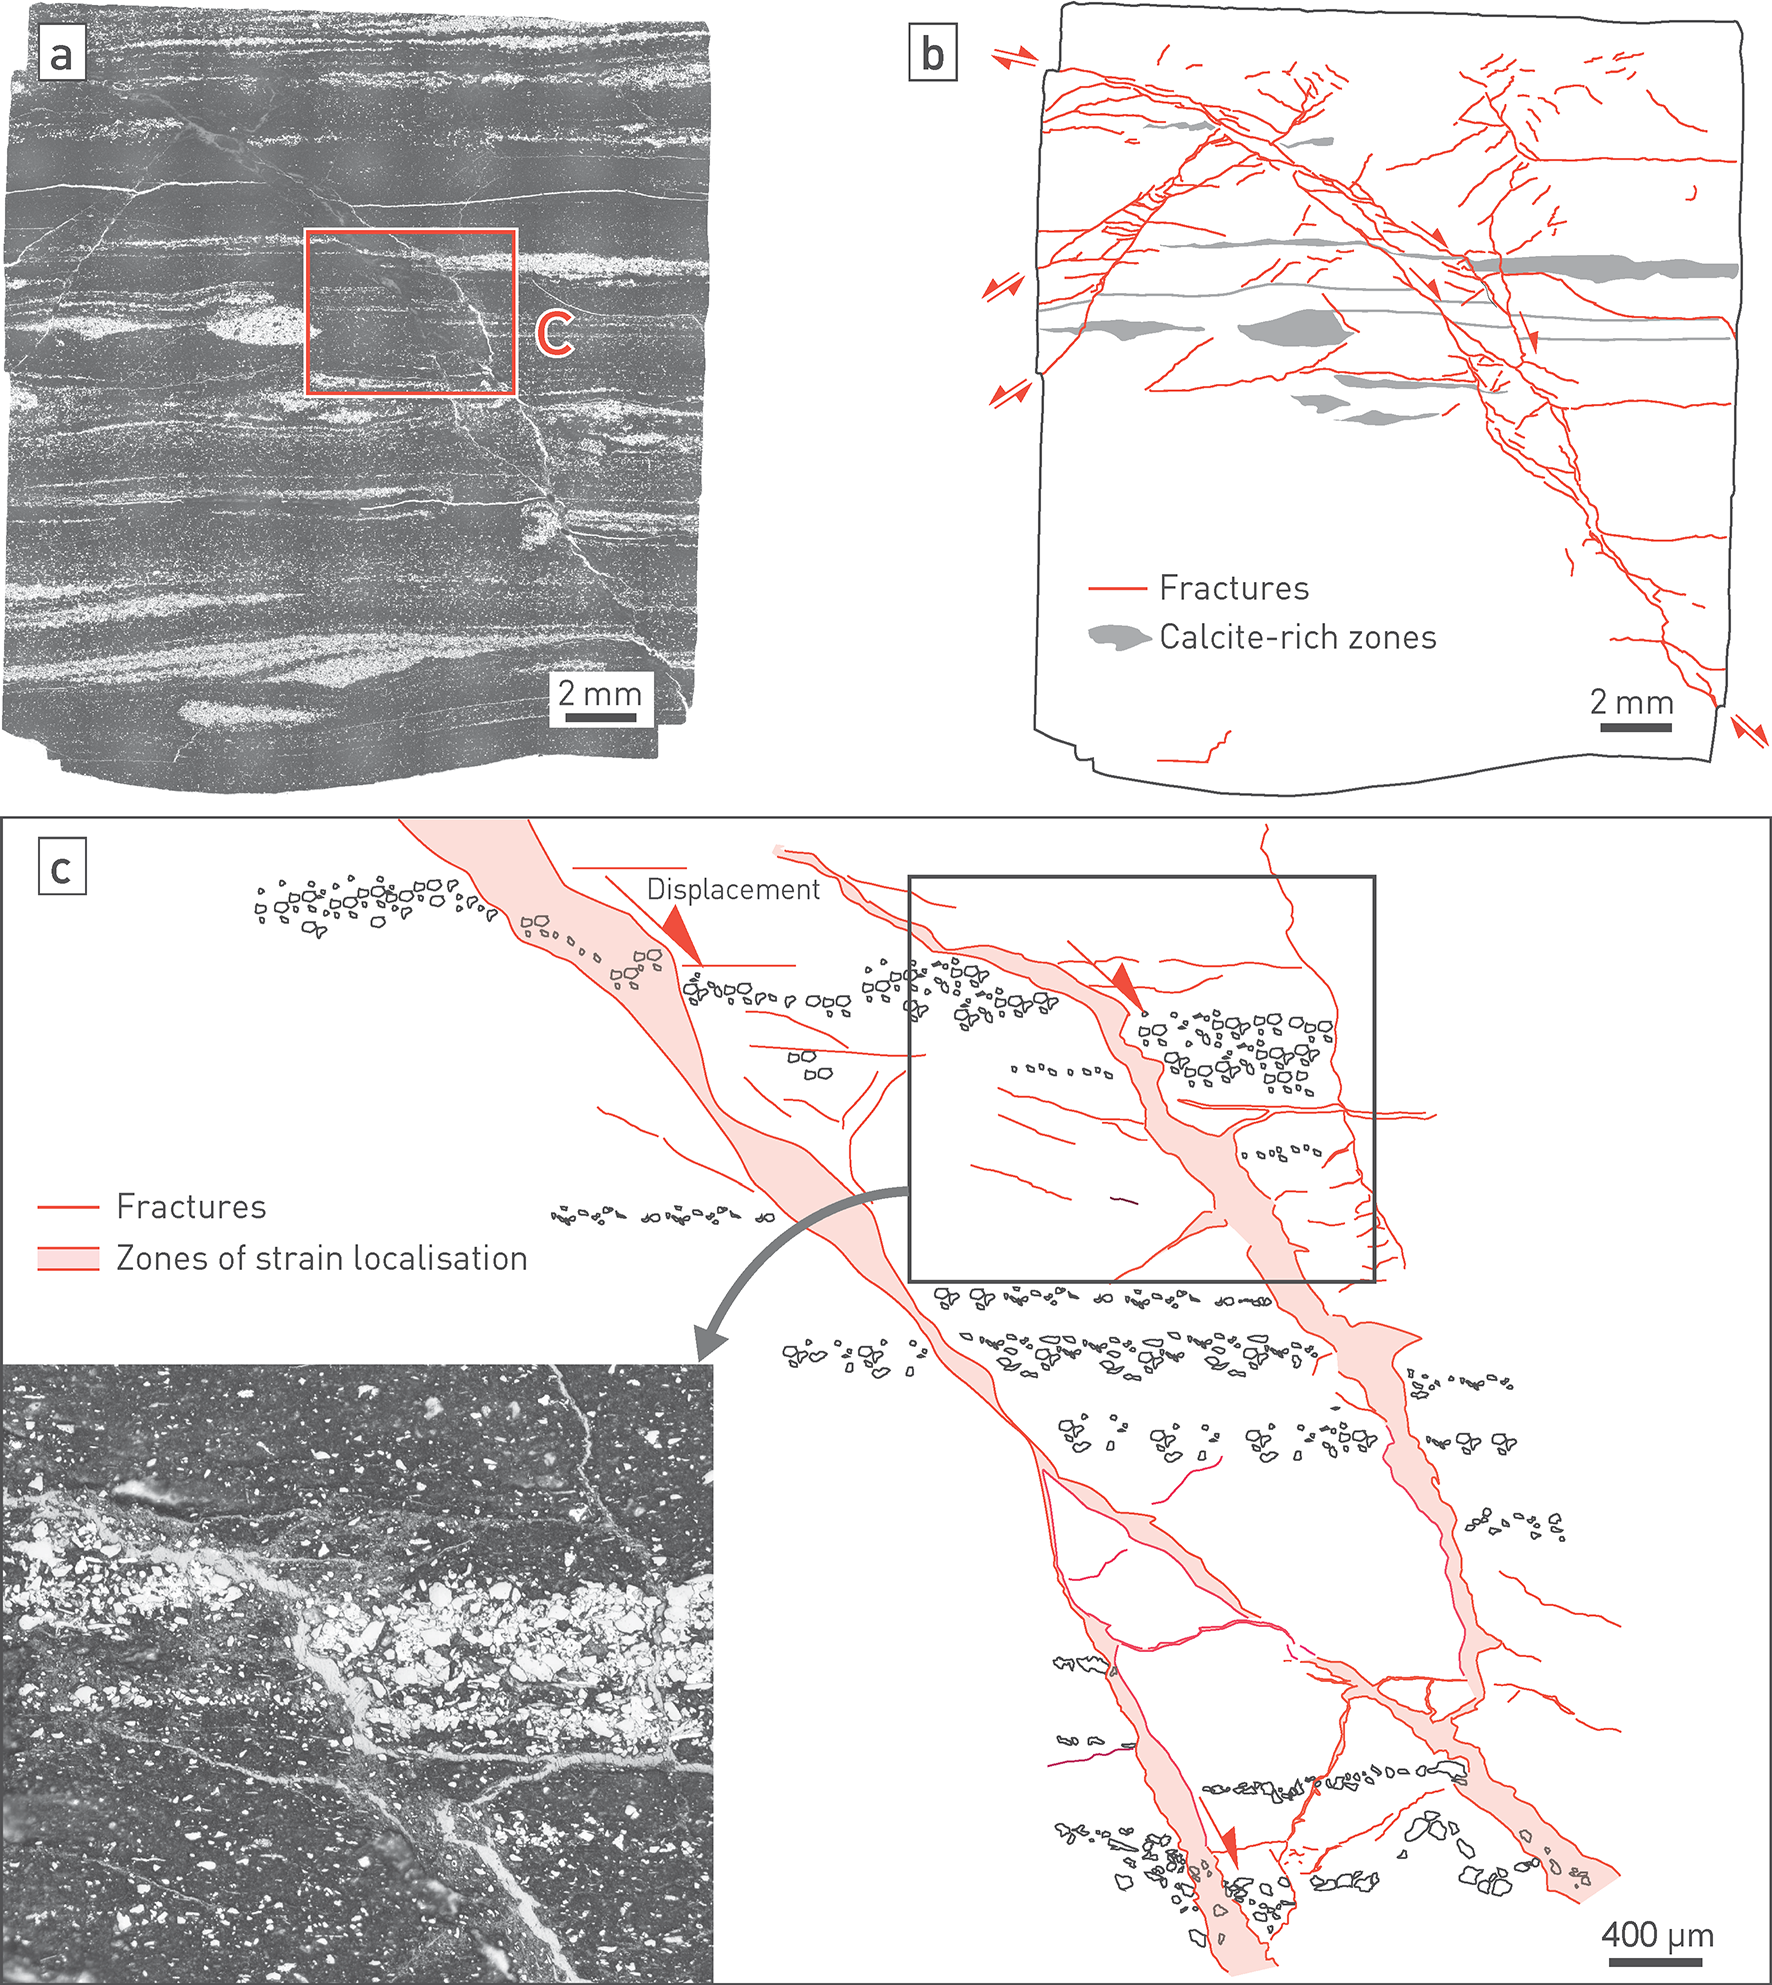
Fig. 5‑29:Typical fault microstructure of the Opalinus Clay obtained in triaxial testing
Example of the Opalinus Clay from borehole BOZ2 (test C5_BOZ2_1_504.78S8CTCU).
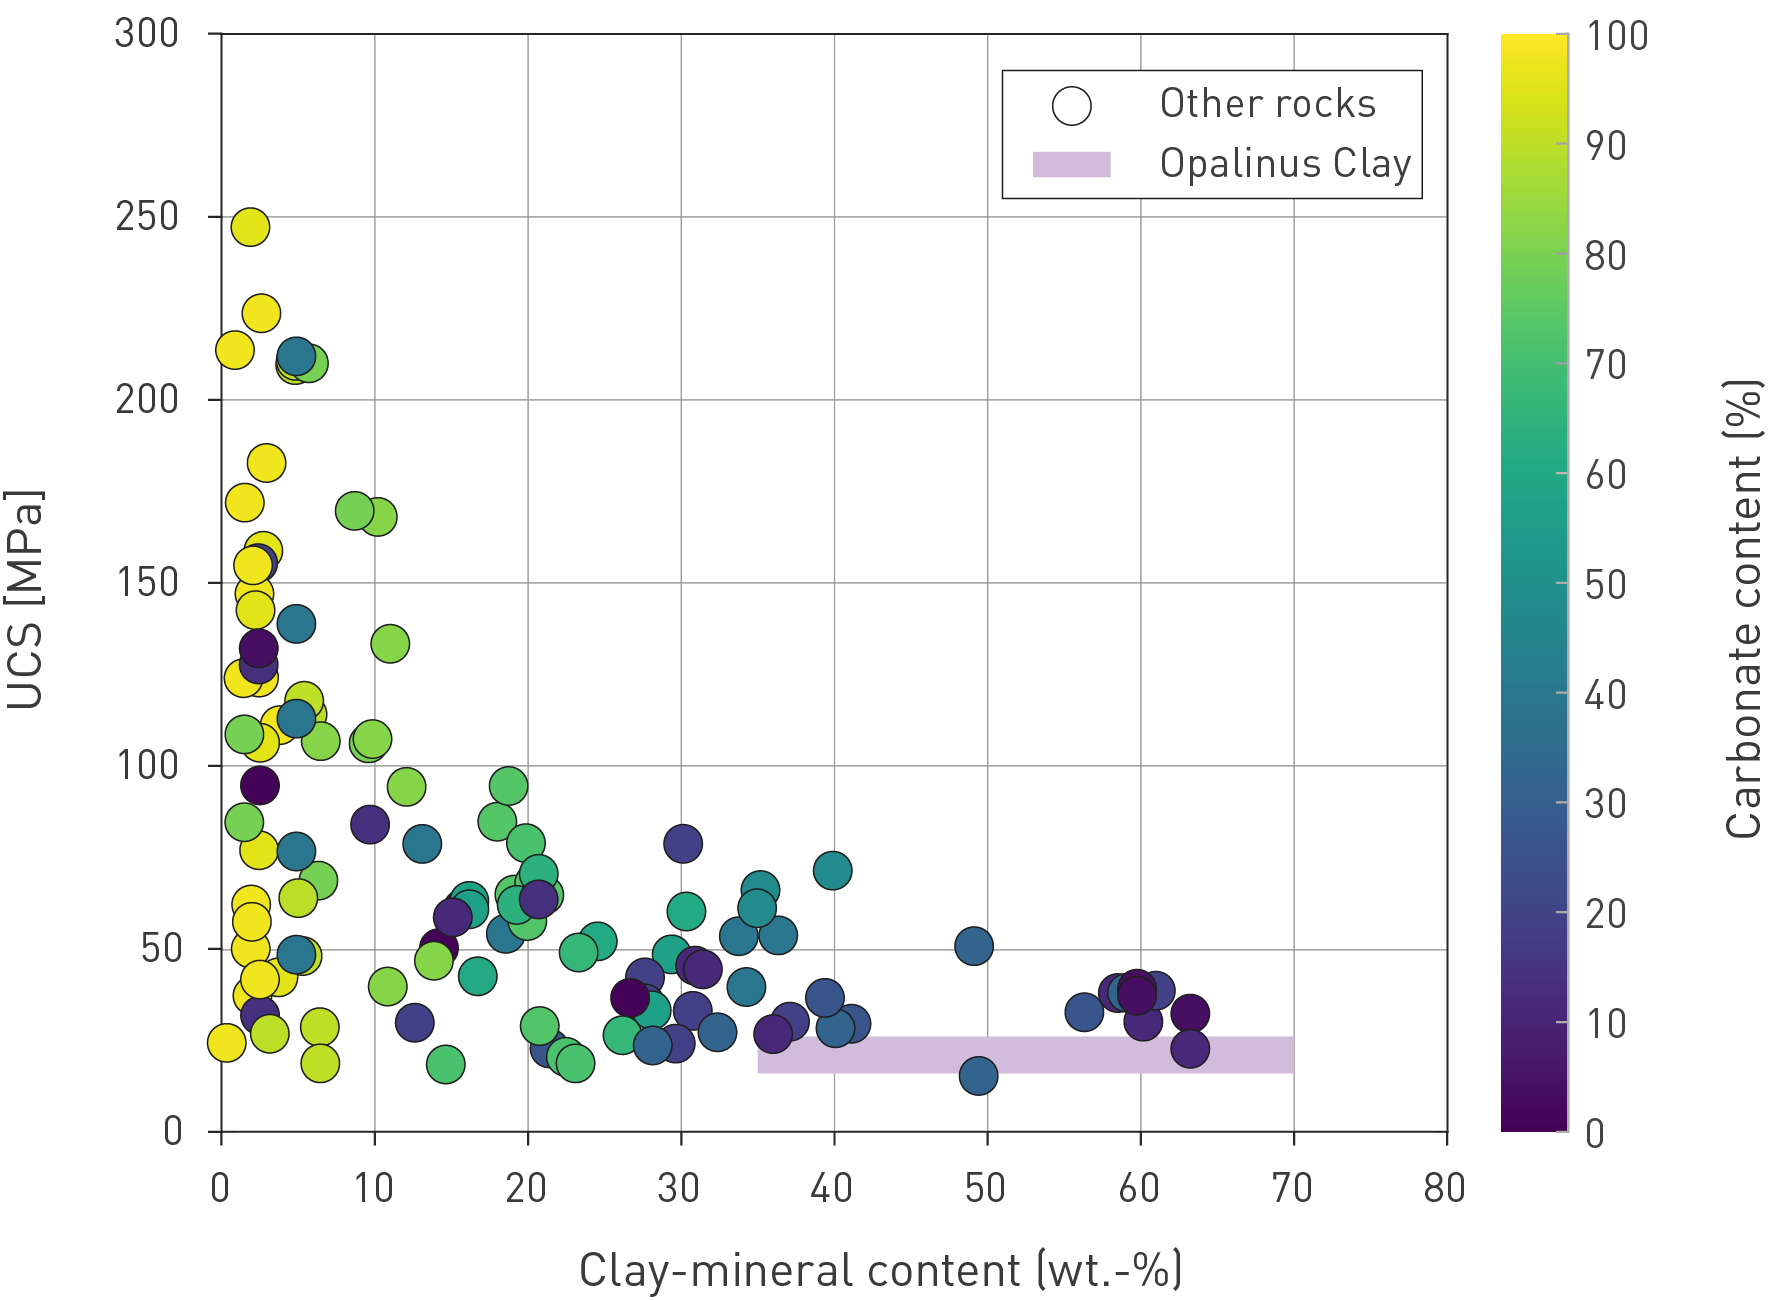
Fig. 5‑30:Unconfined compressive strength (UCS) as a function of the clay-mineral content
Note the strong reduction in strength from 0 to approximately 20 wt.-% clay-mineral content. At higher clay-mineral contents, the changes are moderate, and almost negligible within the Opalinus Clay.