
A comprehensive and robust database for the hydraulic properties is available from Nagra’s investigations in the siting regions as well as from earlier investigation programmes, from the Mont Terri rock laboratory and from third party investigations.
Hydraulic properties are known to depend on overburden (stress). In the case of the overconsolidated Opalinus Clay, high values up to ca. 10-4 m/s are observed only in the uppermost decametres (Fig. 5‑38) because of rock weathering and decompaction, as evidenced by the Lausen case study (Vogt et al. 2016, Mazurek et al. 2017) or the study of Hekel (1994). With increasing depth, the values decrease by several orders of magnitude, e.g. in the Mont Terri rock laboratory typical values are in the range of 1 × 10-12 to 1 × 10-13 m/s (see also Nagra 2014f). The best estimates of the hydraulic conductivities from hydraulic packer tests carried out in the JO, NL and ZNO boreholes plot in a narrow range, namely from 1 × 10-13 to 1 × 10-14 m/s. With this overburden thickness, no depth dependence is apparent (Fig. 5‑38), i.e. the hydraulic properties of the Opalinus Clay are considered to be identical among the siting regions.
The hydraulic conductivities from the in-situ tests agree with the properties derived from the tests on drill core samples (see Section 5.6.2). In addition, there is a trend of a linear increase of the interval transmissivity with increasing test interval length, despite the possible presence of faults (Fig. 5‑39). This indicates comparably homogeneous behaviour and shows that lithological variability, and in particular faults, have no major impact on hydraulic conductivity.
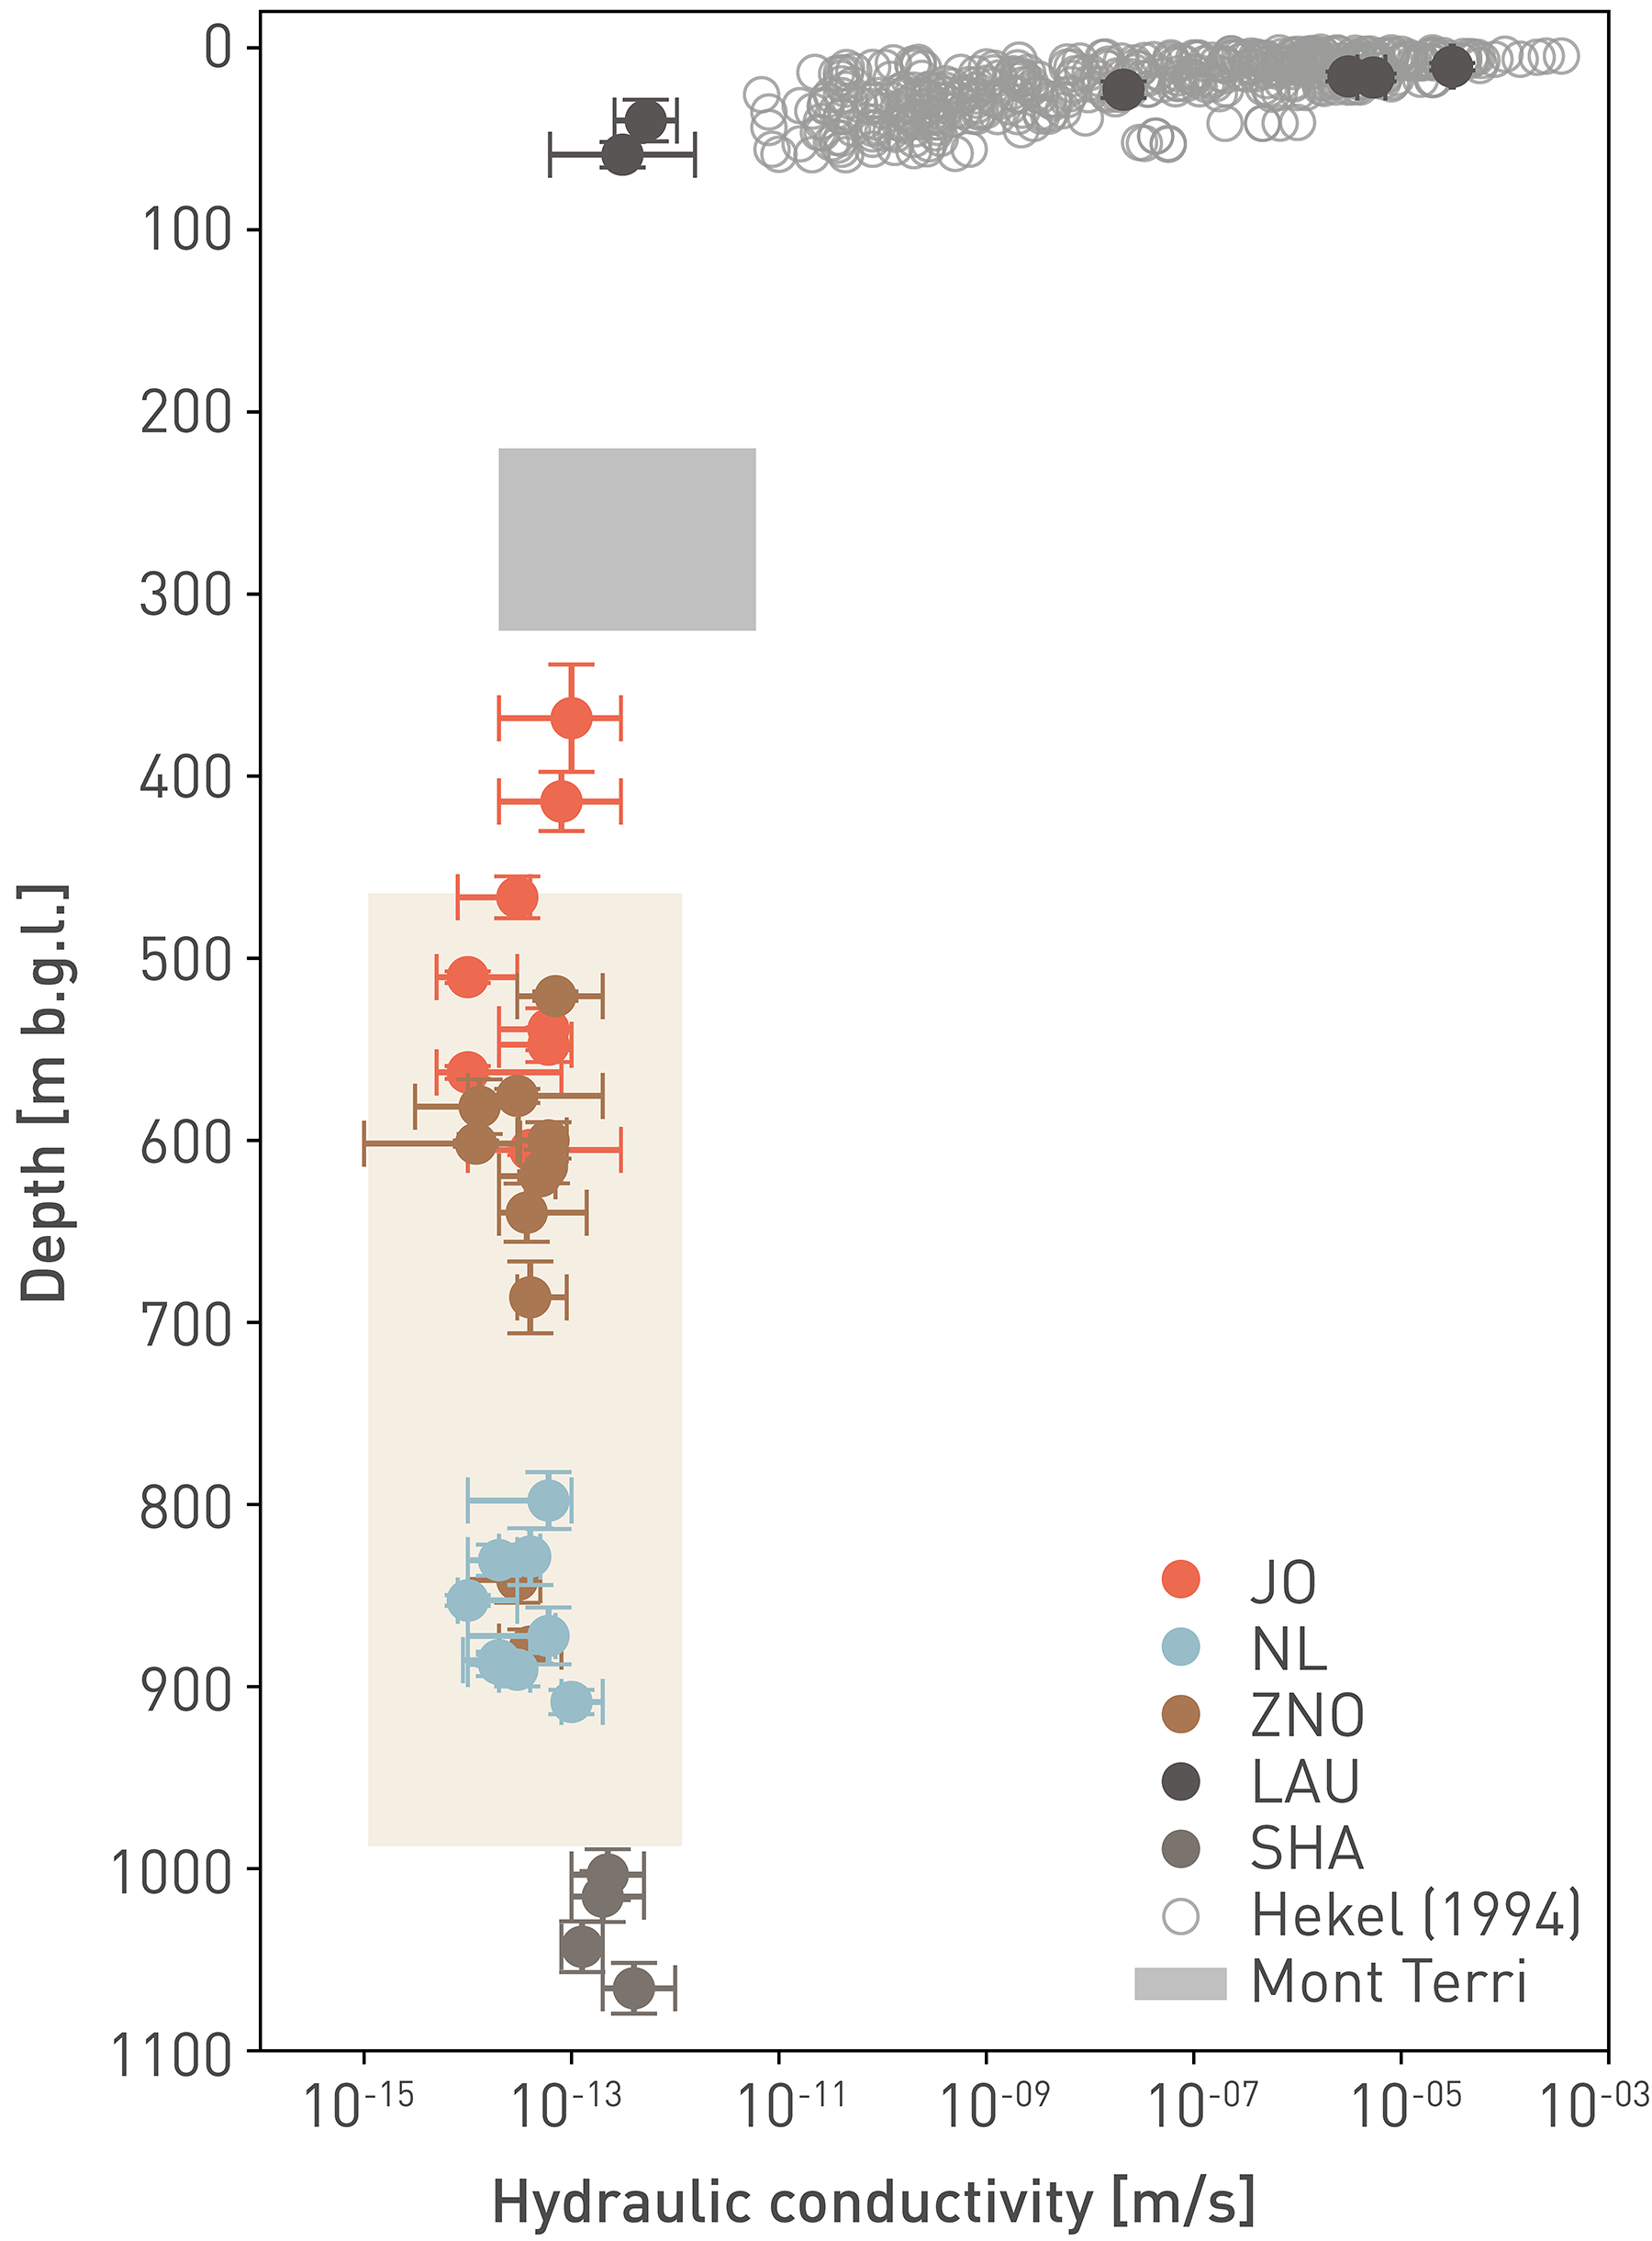
Fig. 5‑38:Hydraulic conductivities of the Opalinus Clay as a function of depth
The beige zone indicates the range of hydraulic conductivities from lab tests on drill core samples performed parallel and perpendicular to bedding. The data range from Mont Terri is from Gautschi (2017). Fig. 6‑46 illustrates the dataset at small overburden thickness in detail.
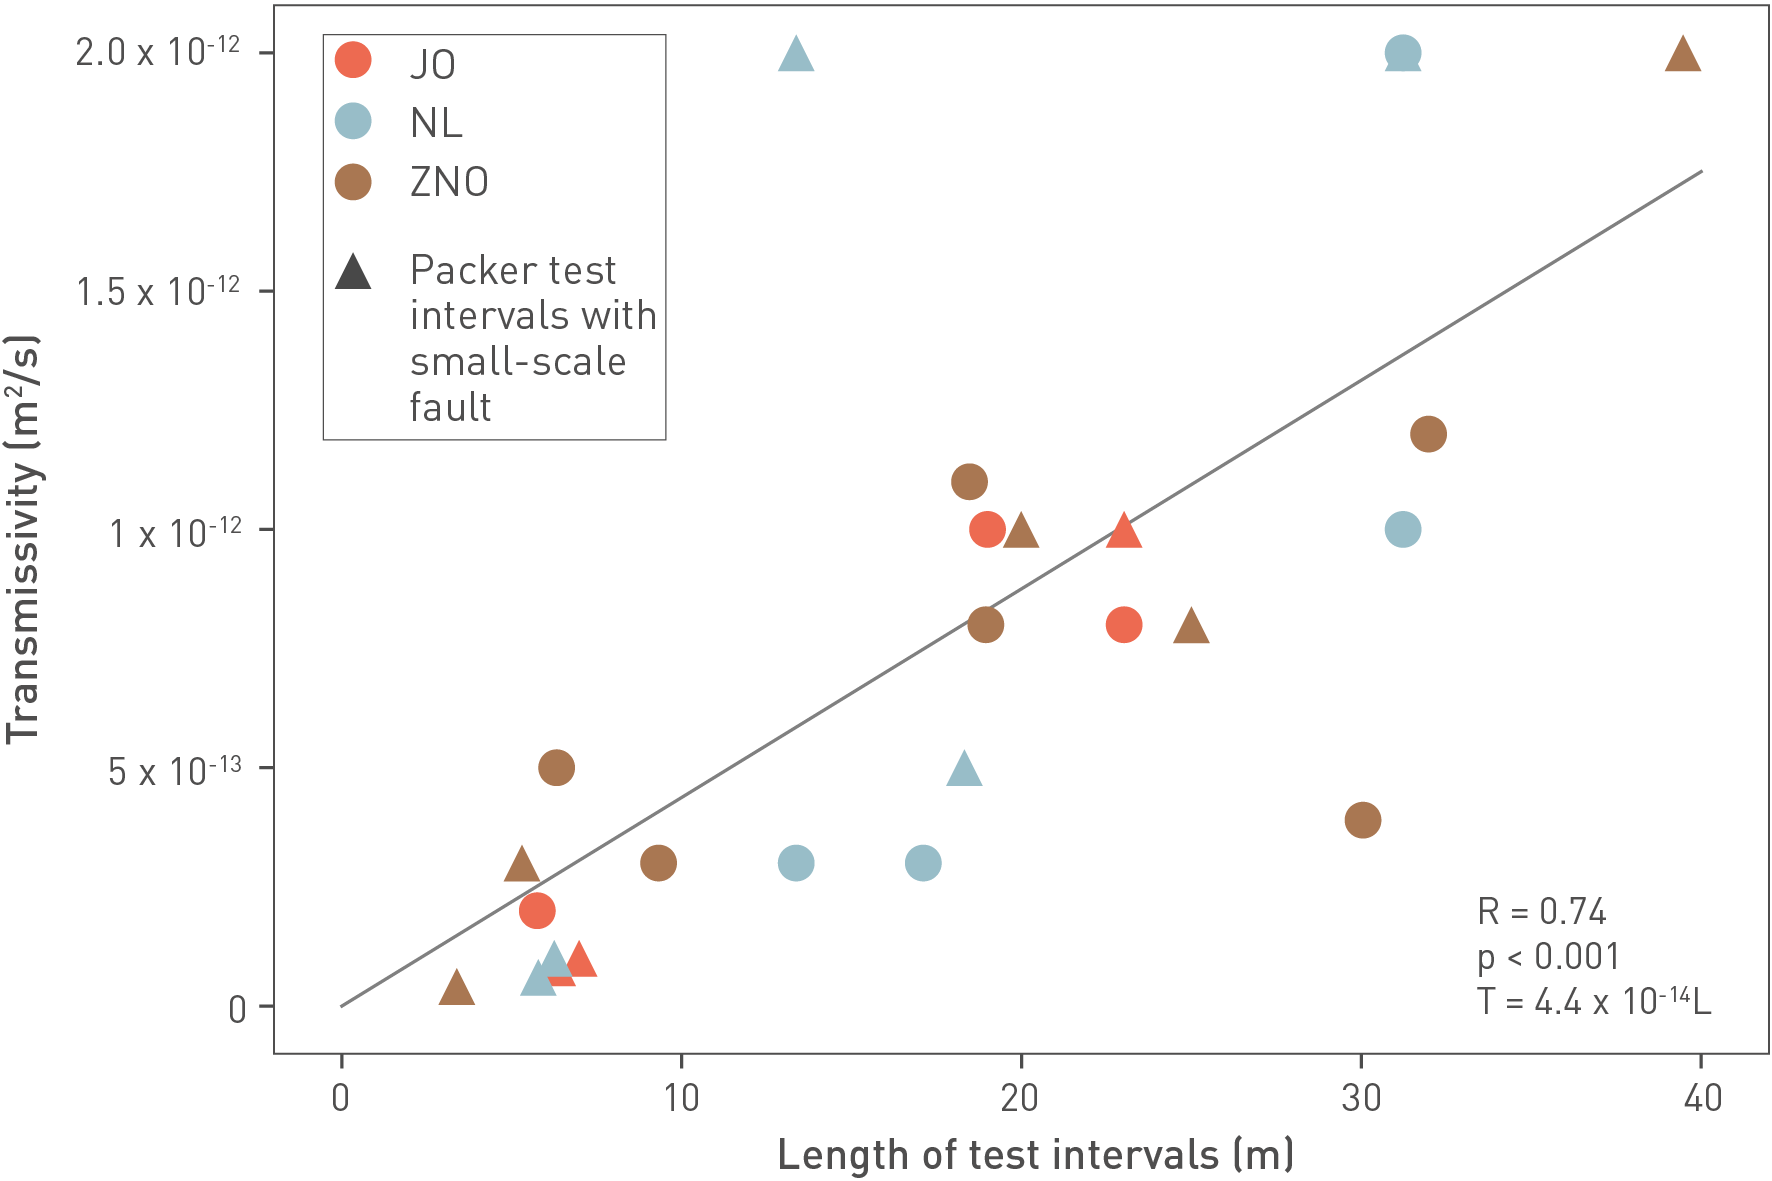
Fig. 5‑39:In-situ test best estimate transmissivities of the Opalinus Clay derived from hydraulic packer tests as a function of the length of the test intervals
The figure shows data from the TBO boreholes plus the Benken borehole, which were tested using a similar state-of-the-art approach. "R" refers to the Pearson correlation coefficient of the regression line, "p" refers to the p value, "T" refers to the transmissivity, and "L" refers to the length of the test interval. The low calculated p value (< 0.001) indicates there is a statistically significant linear relationship between the transmissivity and the length of the test intervals. The bandwidth of the transmissivities is typically within an order of magnitude around the best estimate.
During the TBO campaign, hydraulic testing of fractures (faults, joints) was a primary target in all boreholes. The maximum transmissivities of the fractures can be estimated from the test results assuming one such discontinuity per interval. The histogram of the transmissivities shows generally low values of approximately 1 × 10-12 m2/s ± one order of magnitude (Fig. 5‑40). The maximum value of 10-11 m2/s is from a long test interval at the base of the Opalinus Clay in the Schafisheim (SHA) borehole. This interval includes a major fault zone related to the folding and thrusting of the Jura mountains – such structures are absent in the siting regions. In the BAC1 borehole, a test on a small-scale fault indicated 2 × 10-12 m2/s (Fig. 5‑39). To summarise, fractures in the Opalinus Clay in the siting regions under present-day stress conditions have low transmissivity and are not considered to be preferential flow paths. This can be explained with the deformation and self-sealing behaviour (Sections 5.5 and 5.7).
The low hydraulic conductivity of the Opalinus Clay can also be well justified by comparison with international examples (Fig. 5‑41). The values are of the same order of magnitude as in other clay-rich rocks of comparable porosity. The Opalinus Clay hydraulic conductivity is lower than in the high-porosity soft clays and lower than in highly indurated brittle clays.
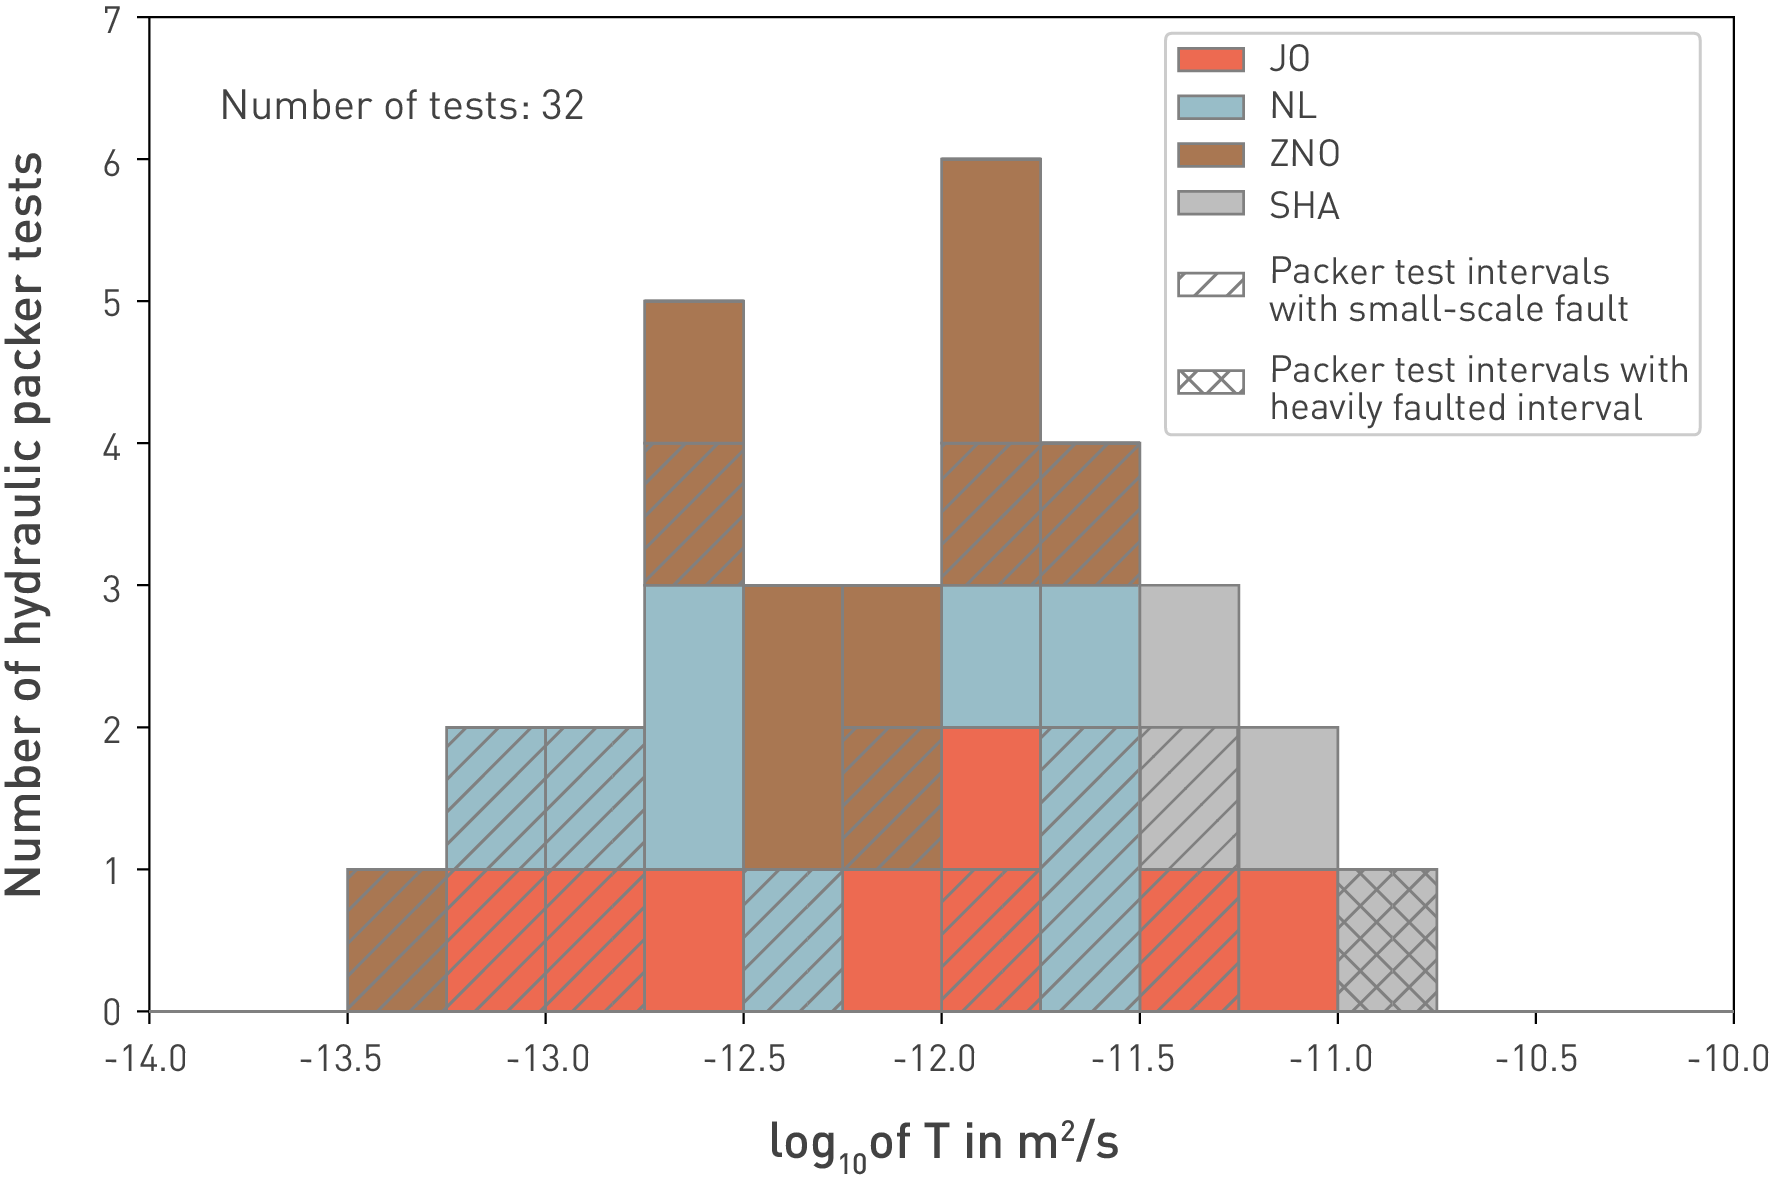
Fig. 5‑40:Distribution of the logarithm of the best estimate of the in-situ hydraulic packer test transmissivities in the Opalinus Clay
The figure includes tests performed in the TBO boreholes plus the Benken (BEN) and Riniken (RIN) boreholes of the JO, NL and ZNO siting regions, and the tests in the Schafisheim borehole (SHA). Interval length of displayed tests varies between < 5 m and 60 m. Structural inventory of the BEN, RIN and SHA boreholes from Ebert (2014).
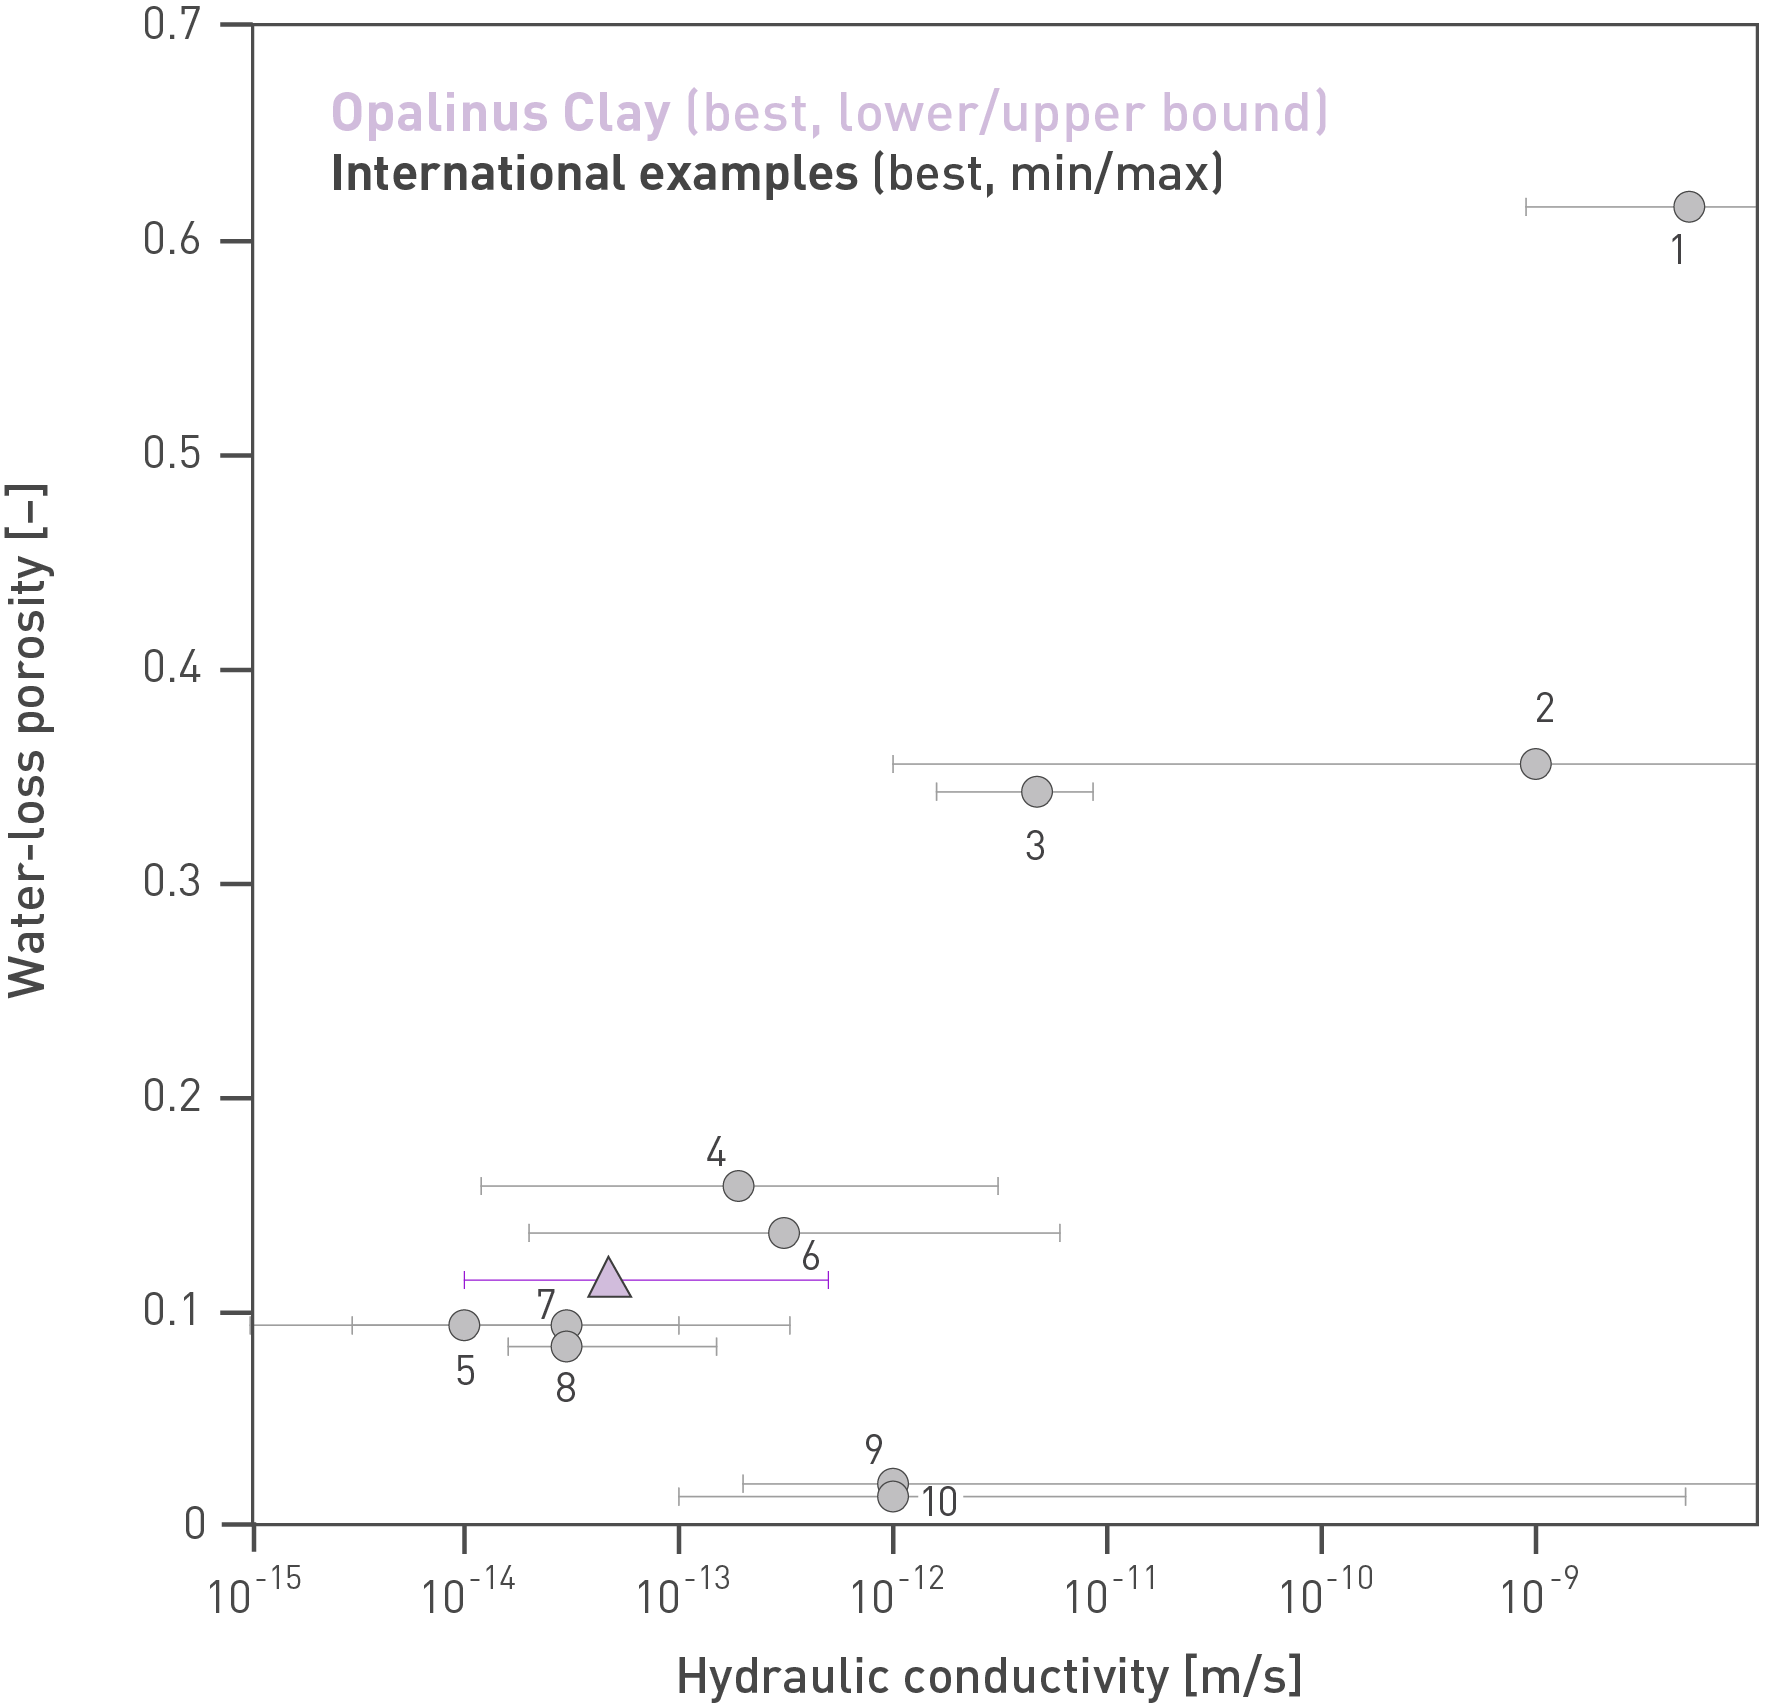
Fig. 5‑41:Comparison of the horizontal hydraulic conductivity of the Opalinus Clay with examples of clay-rich rocks worldwide
Opalinus Clay data based on Nagra (2024m). Values are plotted at best estimate water-loss porosity. International data are from the Clay Club Catalogue (OECD/NEA 2022). Points indicate best estimates, bars represent minimum and maximum values. 1: Koetoi Formation at Horonobe (JP, max. burial: 1'000 m), 2: Wakkanai Formation at Horonobe (JP, 1'200 m), 3: Boom Clay at Mol (B, 215 m), 4: Callovo-Oxfordian at Meuse/Haute Marne (F, porosity UA unit, 850 m), 5: Toarcian-Domerian at Tournemire (F, 1'300 m), 6: Opalinus Clay Mont Terri (CH, upper bound K from Gautschi 2017, 1'350 m), 7: Georgian Bay Formation at Bruce nuclear site (CDN, 1520 m); 8: Queenston Formation (CDN, 1'450 m), 9: Boda Claystone Formation, Gorica block (H, 4000 m); 10: Boda Claystone Formation, Boda block (H, 4'000 m). Max. burial depths as indication for consolidation (best estimates or average values).