
This section gives a short overview of results from in-situ diffusion experiments that typically cover larger scales than laboratory experiments (decimetre to metre, months to a few years).
In-situ diffusion experiments at the underground rock laboratory scale provide an important link between small-scale laboratory experiments and diffusion profiles at the formation scale (Altmann et al. 2012). They complement lab experiments by exploring a much larger rock volume under in-situ geochemical conditions (e.g. pH, redox, porewater composition) and in-situ pressures that are closer to the repository situation. Simultaneous diffusion in all directions (parallel and perpendicular to bedding) occurs during in-situ experiments, but – depending on the setup – diffusion parallel to bedding often dominates. In contrast, the substantial database from lab experiments contains mostly data normal to bedding. In-situ diffusion data for the Opalinus Clay exist from the Mont Terri rock laboratory as a result of a number of experiments carried out over the last ca. 25 years (Leupin et al. 2017). The first pioneering test was the DI experiment (carried out 1997 – 2001) where the basic design was developed (Palut et al. 2002, 2003). In this design, tracers (HTO, I-) were continuously circulated between a reservoir and the borehole and were allowed to diffuse into the rock in a packed-off test interval via a porous screen. Tracers were monitored by regular sampling of the circulated solution. After termination, tracer profiles were analysed from the overcored sections. The DI design and methodology were successively refined in the later experiments (FM-C, DI-A1, DI-B, DI-A2, DR, DR-A) and additional non-reactive and reactive tracers were investigated (Gómez-Hernández et al. 2004, Wersin et al. 2006, Yllera et al. 2004, Wersin et al. 2010, Gimmi et al. 2014, Leupin et al. 2017, Soler et al. 2019; see also summary in Leupin et al. 2017). Most of the test boreholes were drilled straight down, i.e. oblique to the bedding (dip 30 – 45°) of the Opalinus Clay and had long test intervals (~ 1 m) such that diffusion parallel to the bedding plane dominated the experiments. The DR experiment was drilled perpendicular to bedding and, besides a short pressure monitoring interval at the bottom, had two short (0.15 m) test intervals (separated by ~ 40 cm) which allowed the effect of rock anisotropy on diffusion to be investigated. The FM-C test was carried out in the highly fractured "Main Fault". As for laboratory diffusion experiments, the solution composition in the reservoir (except for the second stage of the DR-A experiment) was chosen to more or less match the porewater with respect to the main ions, in order to prevent any geochemical reactions and avoid effects of coupled diffusion of several ions (multi-component diffusion).
All tests were accompanied by extensive modelling, yielding diffusion parameters including effective diffusion coefficients parallel to bedding, diffusion-accessible porosities, information on rock anisotropy (DR only) and sorption data. As mostly radioactive tracers were used in these experiments in a solution with a composition similar to the porewater (identical to laboratory experiments), individual tracers could be modelled separately. Tab. 5‑3 summarises the diffusion parameters (De, ε) parallel to bedding obtained for conservative tracers (HTO, l- and Br‑). Consistent values within their uncertainty ranges between the different in-situ tests are evident, regardless of their location, setup or diffusion time. The in-situ values are also consistent with those obtained from small-scale laboratory diffusion tests parallel to bedding with the Opalinus Clay samples from the Mont Terri (Tab. 5‑3 and Fig. 5‑54). The results from the DR experiments further confirm lab experiments regarding rock anisotropy. Thus, diffusion perpendicular to bedding in the Opalinus Clay from Mont Terri is lower by a factor of 3 – 5 relative to diffusion, parallel to bedding (Gimmi et al. 2014). The ensemble of results underlines the comparability between small-scale laboratory (e.g. Van Loon et al. 2004a, 2004b, Appelo & Van Loon 2008, Appelo et al. 2010) and larger-scale field experiments.
Tab. 5‑3:Modelled diffusion data for the Opalinus Clay (parallel to bedding) for HTO, l- and Br- of in-situ diffusion experiments at the Mont Terri rock laboratory and comparison with data (parallel to bedding) from small-scale lab experiments with Mont Terri samples
|
Experiment |
HTO |
Iodide |
Bromide |
Anisotropy ratio |
Duration |
Ref. | |||
|---|---|---|---|---|---|---|---|---|---|
|
|
De |
ε |
De |
ε |
De |
ε |
|||
|
|
× 10-11 m2/s |
– |
× 10-11 m2/s |
– |
× 10-11 m2/s |
– |
– |
yr |
|
|
DI-B |
4 – 5 |
nc |
0.83 – 1.2 |
nc |
~ 1 |
a |
|||
|
DI-A1 |
5.4 – 6.5 |
0.17 – 0.2 |
1.2 – 2.0 |
0.08 – 0.09 |
~ 1 |
b |
|||
|
DI-A2 |
6.0 |
0.15 |
3.0 |
0.08 |
3.0 |
0.10 |
~ 1 |
c |
|
|
DR-A |
4.1 |
0.15 |
(1.2) i |
(0.075) i |
~ 0.5 |
d |
|||
|
DI |
5 |
0.15 |
1 – 1.5 |
0.07 – 0.125 |
~ 1 |
e |
|||
|
FM-C |
6.8 |
0.12 |
2.5 |
0.05 |
~ 0.7 |
f |
|||
|
DR |
5.4 |
0.164 |
1.6 |
0.08 |
2.6 |
? |
~ 5 (HTO) ~ 3 – 4 (I, Br) |
~ 4 |
g |
|
Lab exp. |
5.4 – 5.7 |
0.1 – 0.17 |
1.44 |
0.06 – 0.08 |
1.7 – 4.5 |
0.08 – 0.15 |
~ 4 |
~ 0.1 |
h |
a Yllera et al. (2004); b Van Loon et al. (2004b); c Wersin et al. (2008); d Soler et al. (2019), first stage; e Palut et al. (2003); f Tevissen & Soler (2003); g De modelling in progress; h Van Loon et al. (2004b), Appelo et al. (2010); I when assuming e of 0.075; nc: not considered.
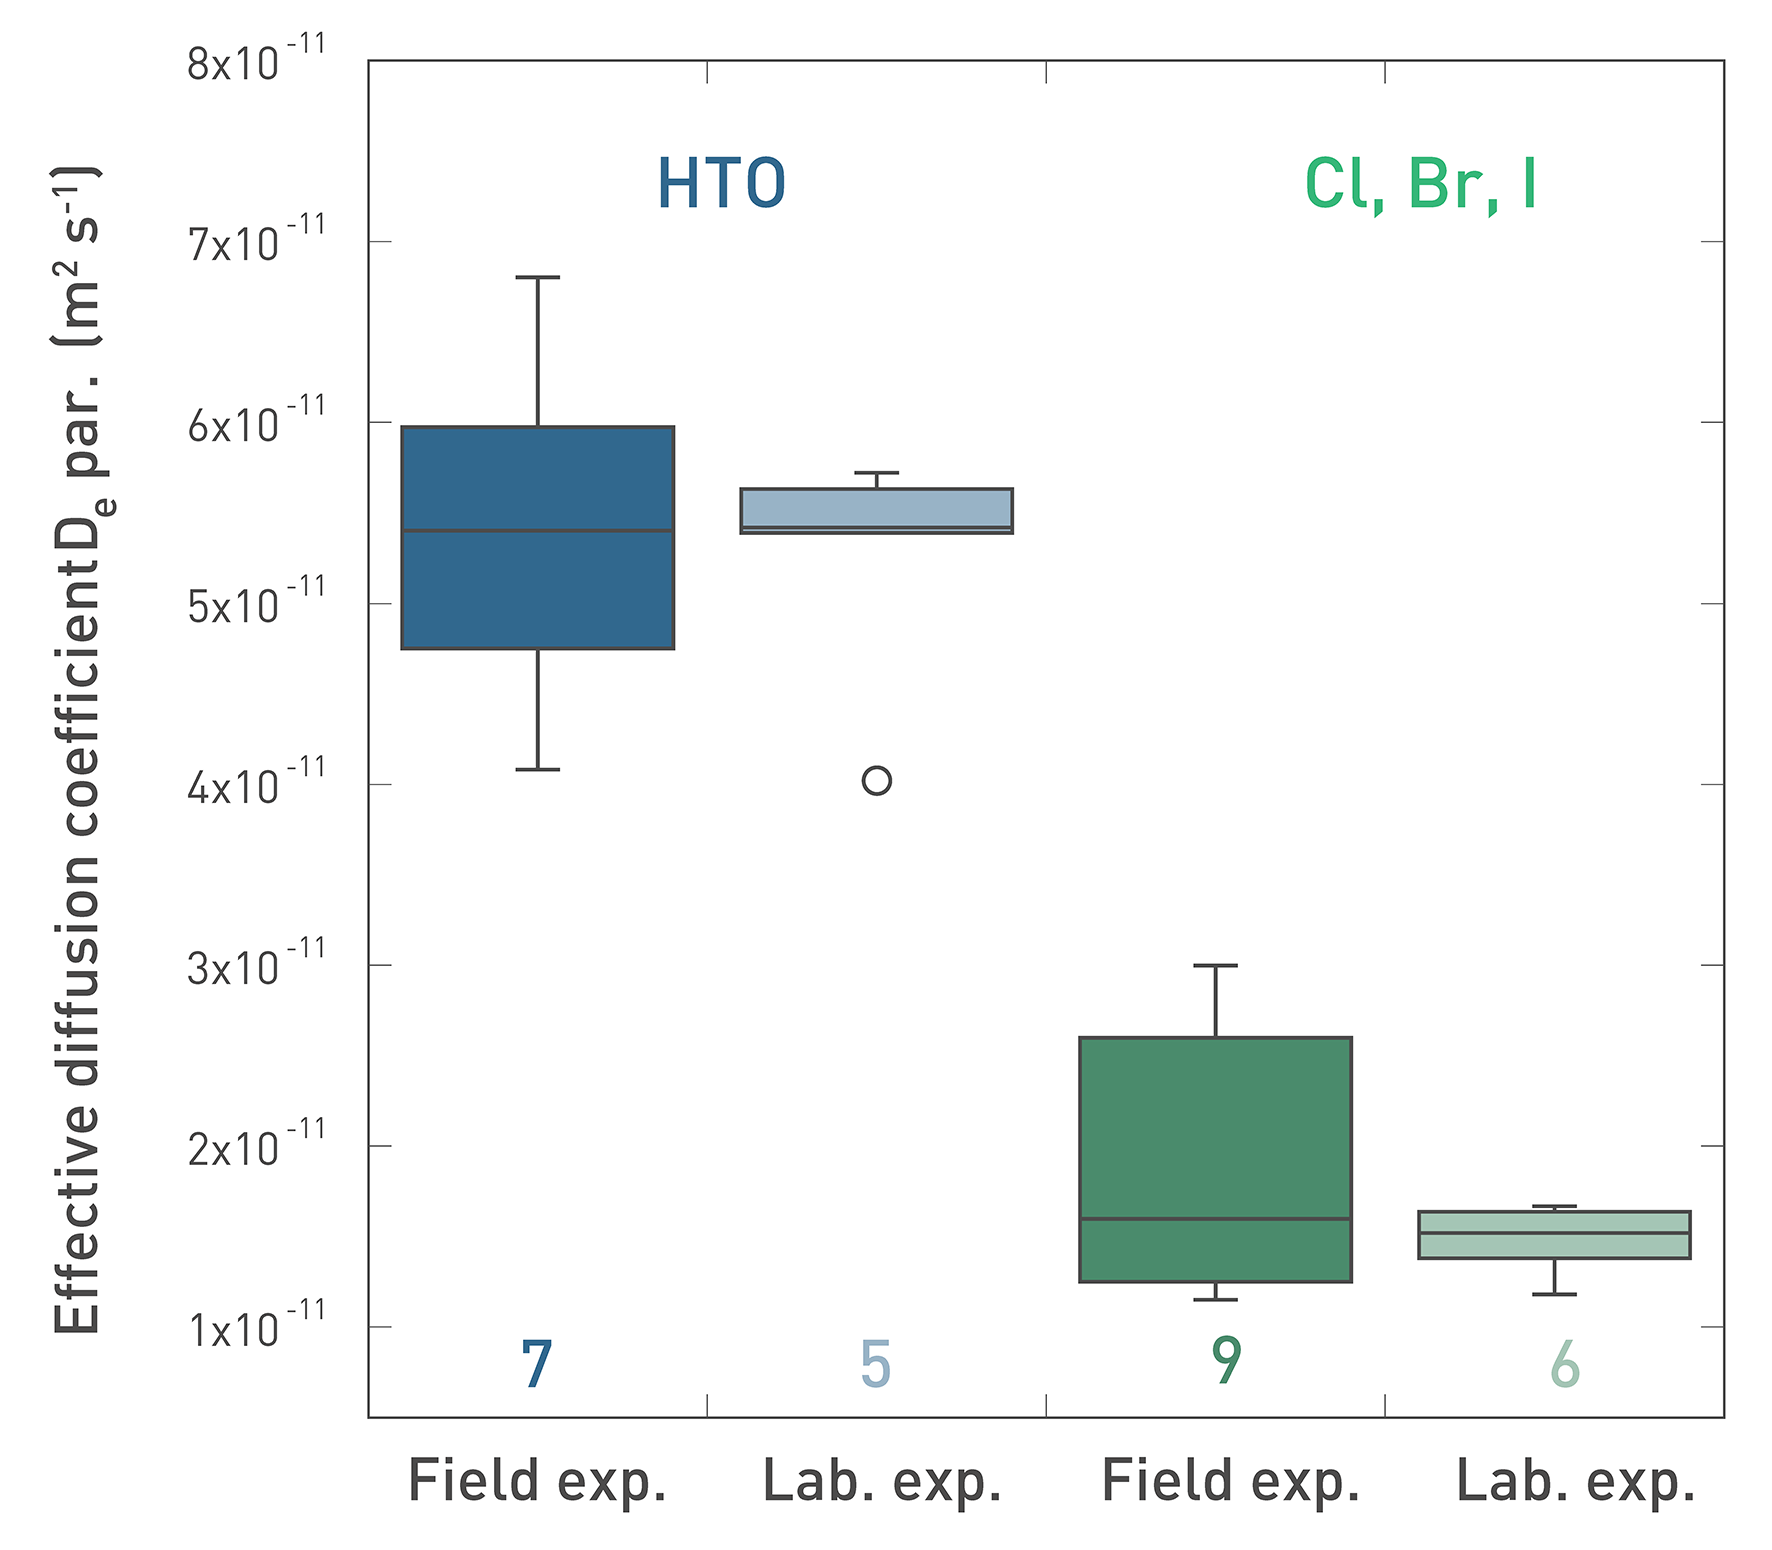
Fig. 5‑54:Comparison of effective HTO and anion diffusion coefficients De for the Opalinus Clay obtained in Mont Terri field and laboratory experiments
Measurements are parallel to bedding. Laboratory tests were on small samples. Each box includes 50% of the values; the horizontal line shows the median, the whiskers the minimum and maximum values within an ‘acceptable’ range (from the upper or lower box limit to ± 1.5 times the box size), circles are values outside this range. The sample number for each group is also indicated.