
This section forms the main basis for the parameterisation and process understanding.
At the laboratory scale, diffusion coefficients are most often estimated from through-diffusion experiments (e.g. Van Loon et al. 2023) that last over a few weeks to a few months. In such experiments, a rock sample with a thickness of one to a few centimetres is sandwiched between two solution reservoirs. The inlet reservoir is spiked with a tracer (e.g. HTO or 36Cl), while the breakthrough and the flux of the tracer through the sample is observed in the outlet reservoir. One difficulty of such experiments is that the solution used in the reservoirs should match the porewater with respect to the main ions, to avoid geochemical reactions and effects of coupled diffusion of several ions (multi-component diffusion). From the analysis of the temporal evolution of the tracer flux, the effective diffusion coefficient ε as well as the accessible porosity can be estimated. Slightly different setups exist that allow the diffusion coefficients to be derived either perpendicular or parallel to bedding.
Diffusion coefficients of solutes in rocks depend on the porosity of the rock and the tortuous pore pathway, and possibly also on interactions with the solid surfaces. The effective diffusion coefficient De of a non-sorbing solute can be given as:
with ε the (water-filled or accessible) porosity, Dp the pore diffusion coefficient, Dw the diffusion coefficient in bulk water, and G the geometric factor (often also called tortuosity) that depends on the pore structure and connectivity of the rock. The effective diffusion coefficient De is generally smaller than Dp as ε is smaller than 1. Because clays have negatively charged surfaces, anions are partly excluded from the pore space near the surfaces (Section 5.4). Thus, their accessible porosity is typically smaller than the water-filled porosity, and their tortuosity larger than that of a water tracer. As a result, the values of De and Dp of an anion (e.g. Cl) tend to be smaller than those of a water tracer (e.g. HTO), and the values of the geometric factor (tortuosity) G of an anion tend to be larger than those of a water tracer (conceptual model in Fig. 5‑17).
No cation diffusion data are presented here. For the sake of completeness, it is simply noted that the negative surface charge of clay minerals is also responsible for the sorption of cations in clay-rich rocks, and thus diffusive transport of cations is typically retarded compared to diffusion of HTO. If non-specific sorption in the diffuse layer near charged surfaces is important (Fig. 5‑17), the effective diffusion coefficient of cations such as, for instance, Na can be larger than that of a water tracer, as Na in the diffuse layer remains mobile and contributes to the total cation flux, in addition to the Na in the porewater. This effect depends on the ionic strength of the porewater (larger for low ionic strength, for instance Glaus et al. 2024).
A large number of laboratory diffusion experiments has been performed on samples from the deep drilling campaign in the three siting regions (Van Loon et al. 2024, 2023). Diffusion perpendicular to bedding was investigated. The HTO and 36Cl diffusion coefficients perpendicular to bedding of all samples from the three regions are plotted as a function of depth (scaled to a reference profile for each region) in Fig. 5‑50De. The following is observed: values for 36Cl are lower than those for HTO, especially in clay-mineral-rich units. The differences tend to be larger for the JO siting region, which exhibits the lowest salinities of the porewater (Section 5.4). Both observations are related to the partial anion exclusion near the negatively charged clay-mineral surfaces, as noted above. The exclusion effect tends to be larger at the lower salinities in the JO region (lower salinities lead to thicker diffuse double layers that have low anion concentrations, or generally to larger anion exclusion, see for instance interpretation in Glaus et al. 2024). Lower diffusion coefficients of anions compared to those of the water tracer have already been reported in earlier studies for samples from the Opalinus Clay, Dogger Group above Opalinus Clay or Effingen Member in the Malm Group (see Table 2.6-1 in Nagra 2014f).
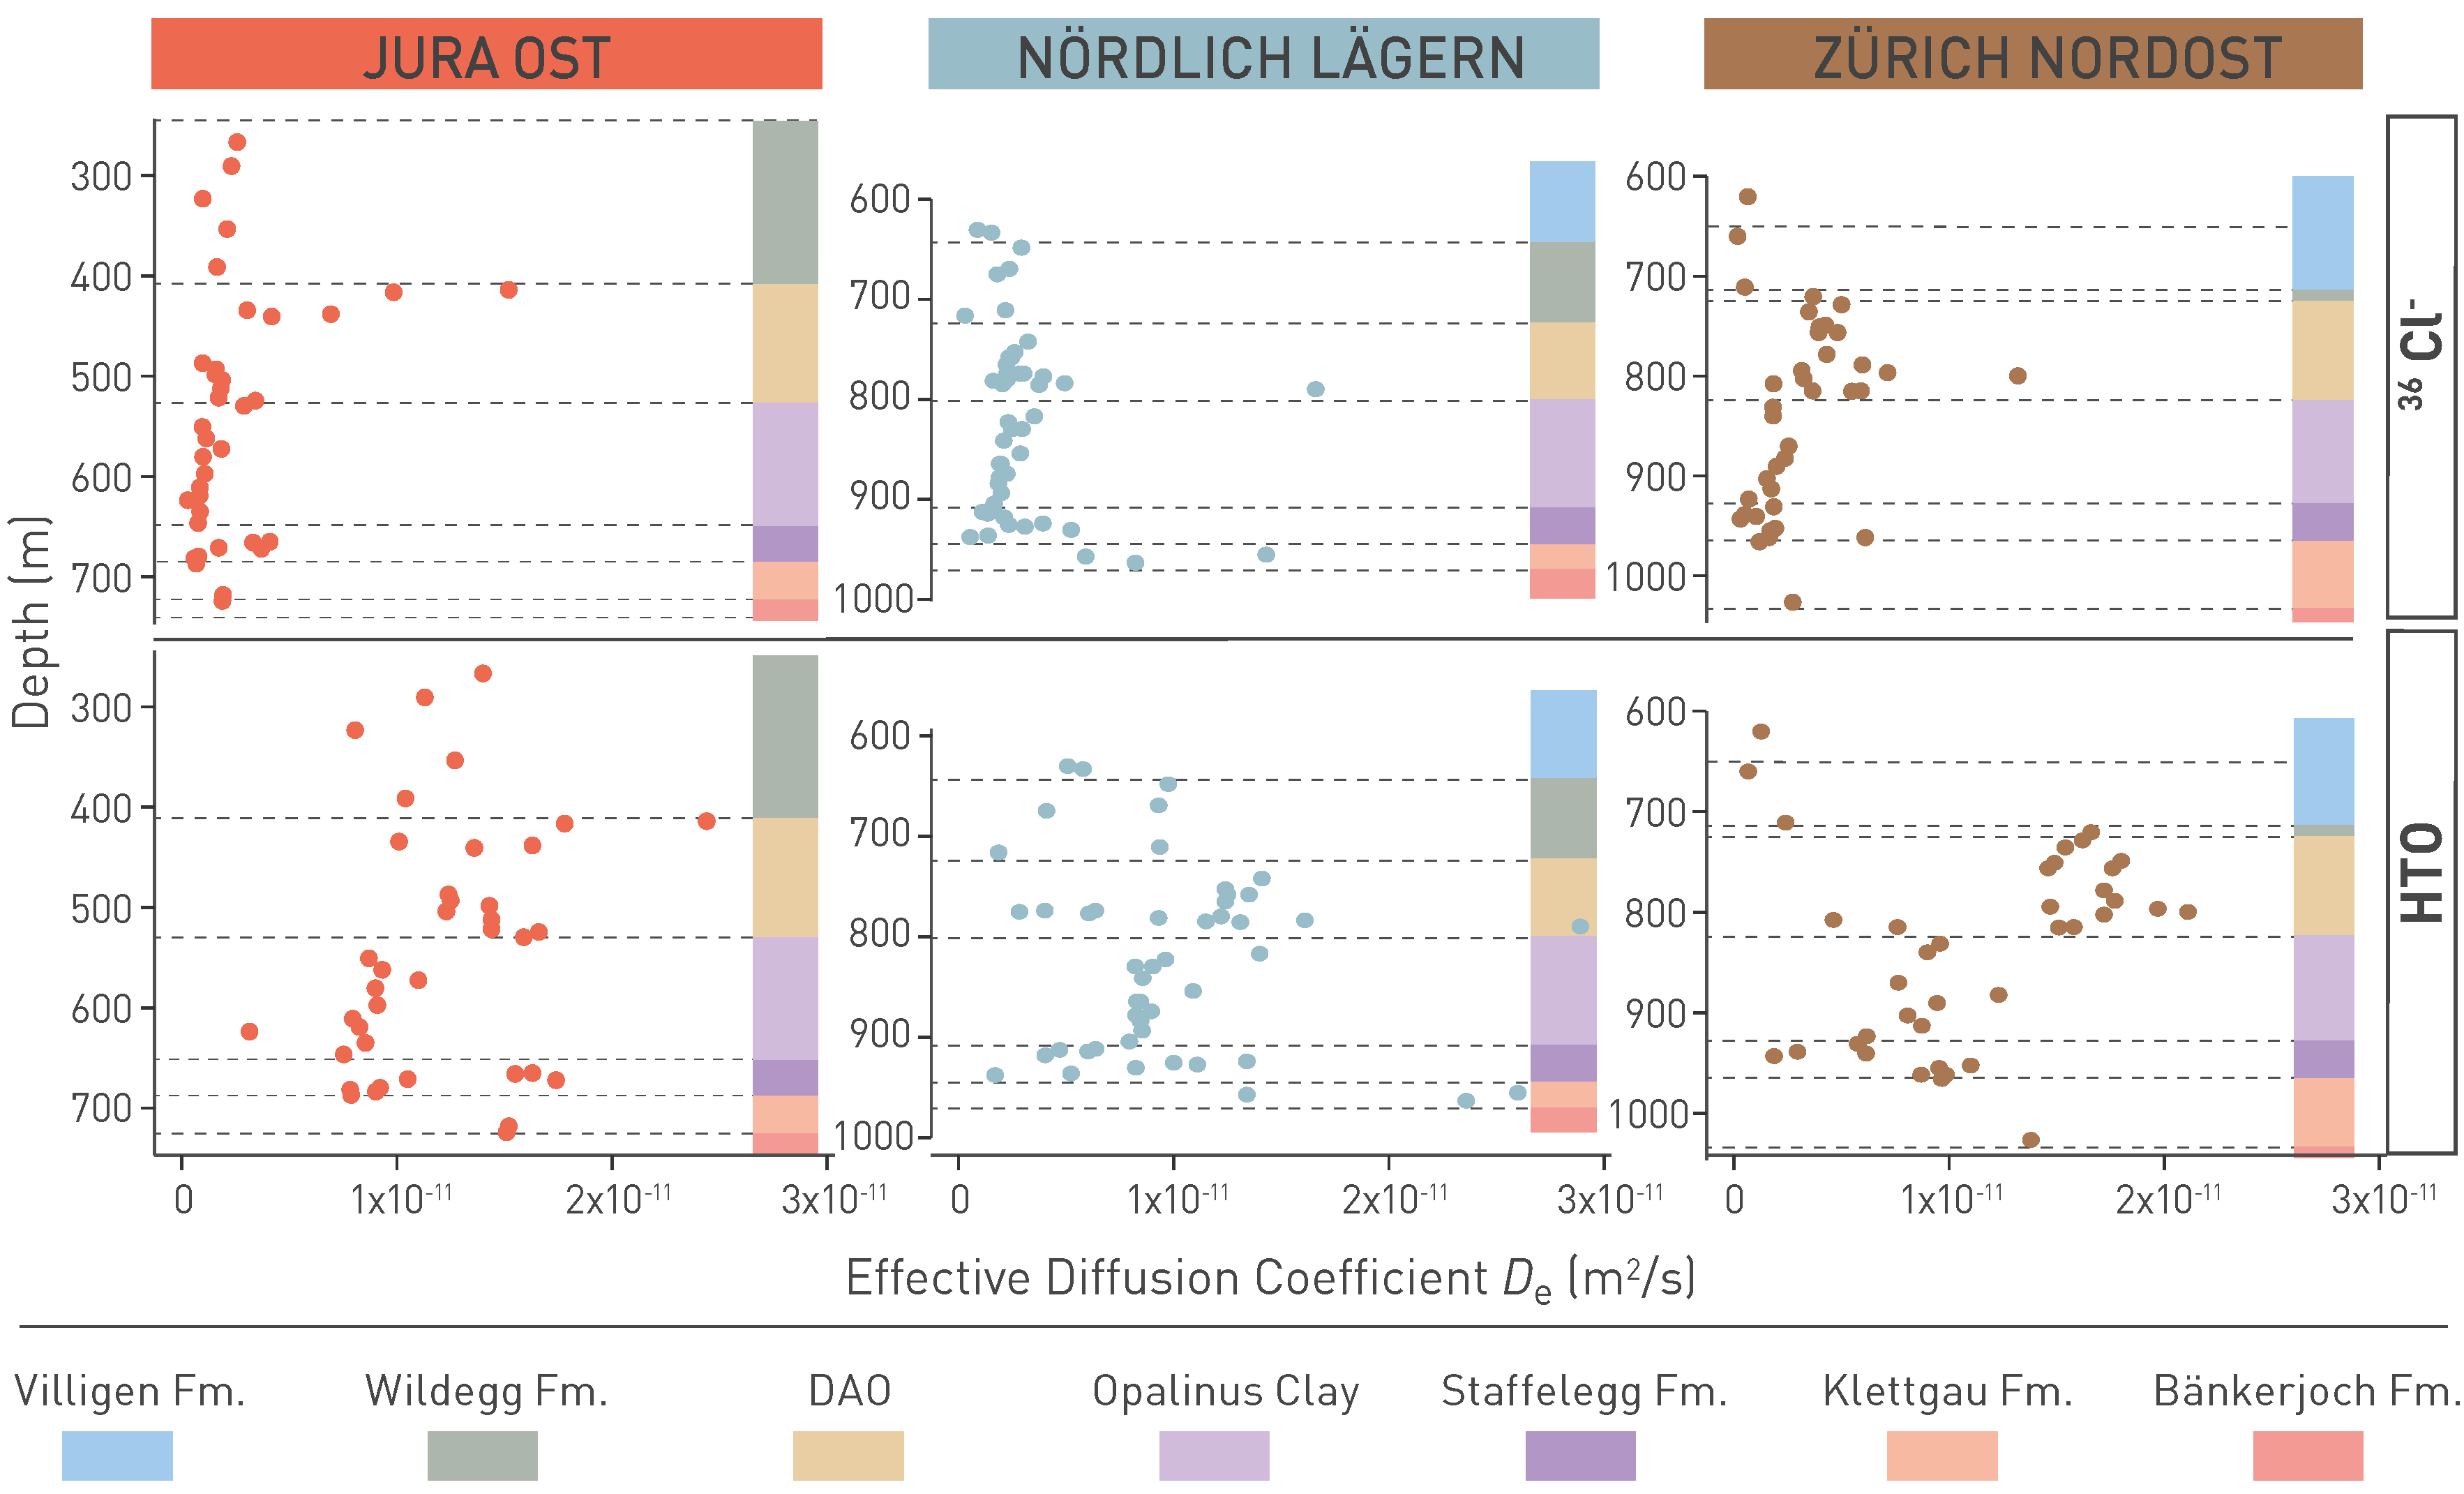
Fig. 5‑50:Measured effective diffusion coefficients De for chloride and HTO of the investigated formations in the three siting regions
Measurements were done perpendicular to bedding. The samples of a siting region are projected to a reference profile: in the case of JO to BOZ1, in the case of NL to STA2 and in the case of ZNO to TRU1. DAO: Dogger Group above Opalinus Clay, Fm.: Formation.
Box plots illustrating the range of the diffusion coefficients De perpendicular to bedding obtained for HTO and Cl in the three siting regions are shown in Fig. 5‑51. The data show again that De values for Cl are markedly smaller than those for HTO, especially in the Opalinus Clay. Furthermore, the diffusion properties of the Opalinus Clay scatter over a small range. Finally, De values for HTO are largely identical between different siting regions. For Cl, some region-specific differences result from different porewater salinities (ionic strength) as already noted above: De values of Cl in the Opalinus Clay are lower in JO than in other regions because of its lower salinity. For the less clay-mineral-rich units Dogger Group above Opalinus Clay and Lias Group, the De values of Cl scatter more, but no clear differences are seen between the different siting regions.
The anisotropy of diffusion in the Opalinus Clay from the Benken (BEN) borehole or Mont Terri was assessed with radial through-diffusion experiments in the laboratory. It is in the order of 4:1 to 6:1 (largest values for BEN), i.e. diffusion parallel to bedding is about a factor 4 to 6 faster than diffusion perpendicular to bedding (Van Loon et al. 2004a). This can be explained by the more tortuous pathway perpendicular to bedding, because the clay platelets have a large aspect ratio and tend to be aligned along the bedding.
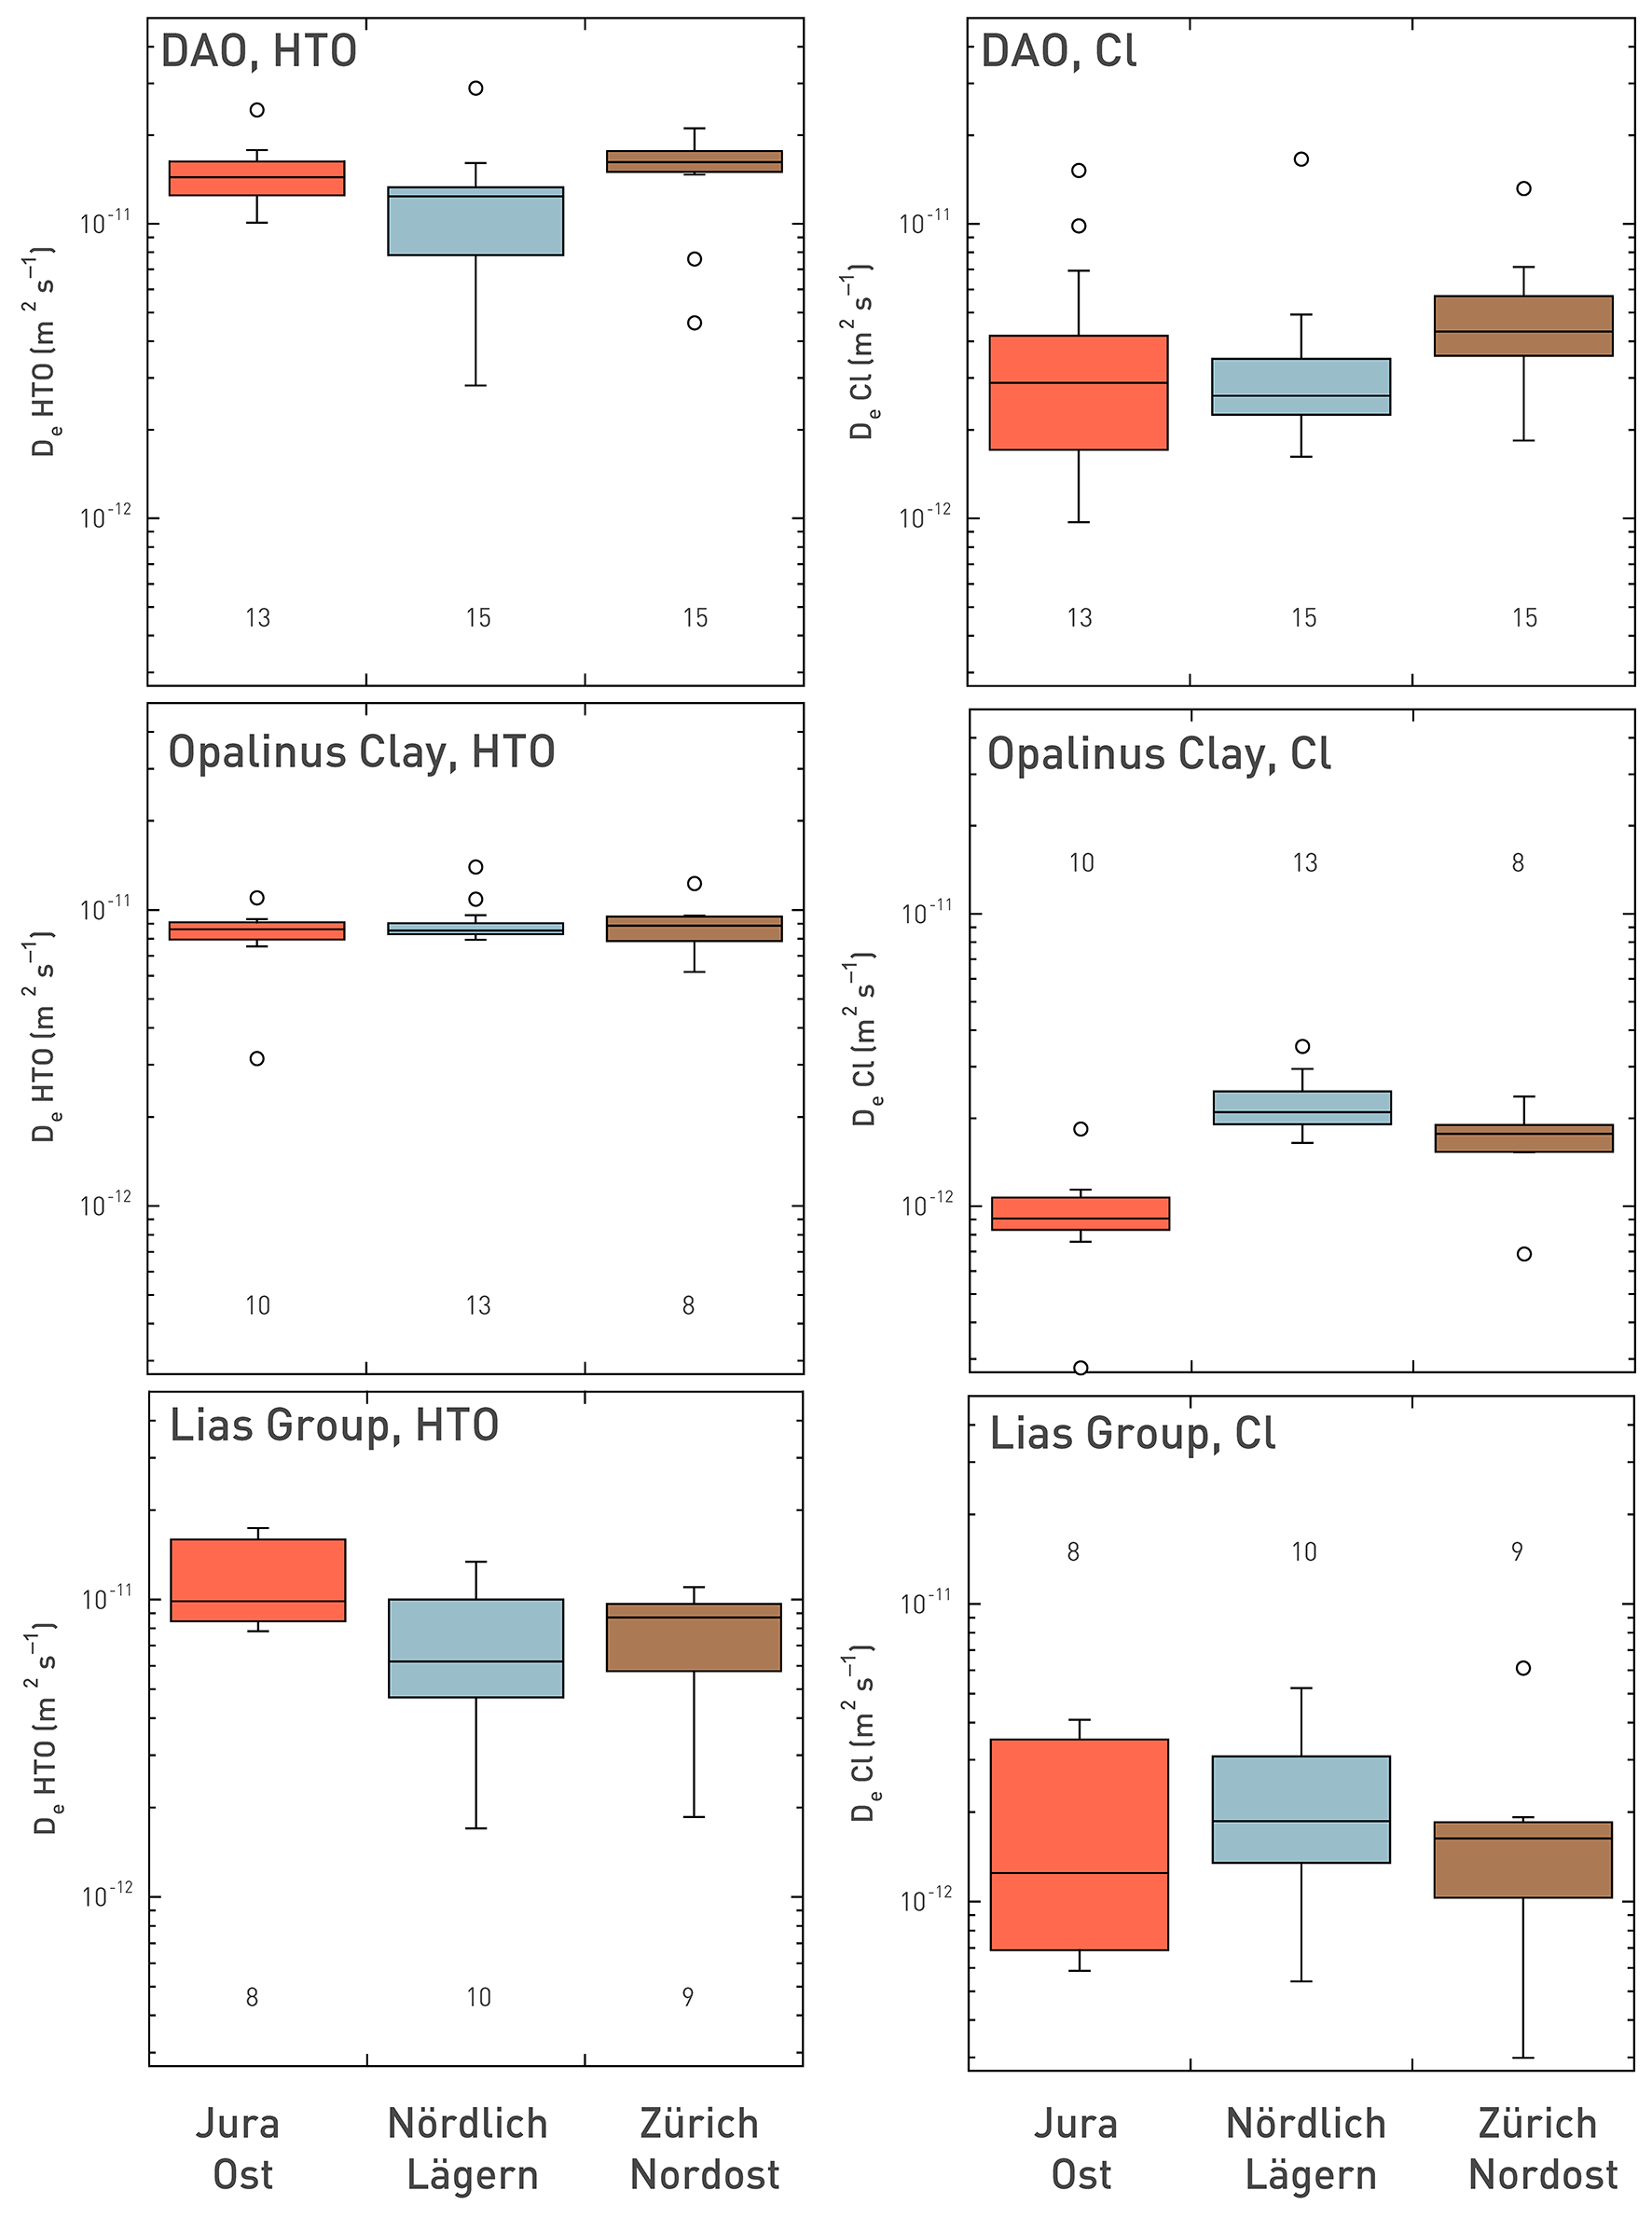
Fig. 5‑51:Box plots illustrating the range of effective diffusion coefficients De for HTO (left column) and for Cl (right column), grouped by siting regions
Measurements were done perpendicular to bedding. DAO: Dogger Group above Opalinus Clay. Each box contains 50% of the values; the horizontal line shows the median, the whiskers the minimum and maximum values within an ‘acceptable’ range (from the upper or lower box limit to ± 1.5 times the box size), the circles values outside this range. The sample number for each group is also indicated.
The accessible porosities derived from the diffusion experiments with HTO and Cl are illustrated in Fig. 5‑52. The results are also presented as box plots that show the typical range of values. It can be seen here that accessible porosities of HTO in the Opalinus Clay scatter over a small range and are very similar between the different siting regions. For the Dogger Group above Opalinus Clay and the Lias Group, the accessible porosities of HTO extend over larger ranges, which is related to the more pronounced lithological heterogeneity in these formations. The diffusion-accessible porosity of Cl in the Opalinus Clay is lower in JO compared to NL and ZNO, resulting from different porewater salinities (ionic strength effect). For the Dogger Group above Opalinus Clay and the Lias Group, the ranges are larger and no influence of the porewater salinity is seen.
Finally, the geometric factor G correlates with the clay-mineral content, both for HTO and for Cl (Fig. 5-53). The factor G becomes larger in a non-linear way with increasing clay-mineral contents. Thus, the De values inversely tend to become smaller with increasing clay-mineral contents. No simple relationship exists to fit all data. However, when excluding some outliers with comparably high tortuosity values (and corresponding low De), the relationship for G of HTO can be fitted for instance by an exponential function (R2 of 0.77) or by a polynomial of degree 4 (R2 of 0.79). Such a relationship can for instance be used to estimate G and then the diffusion coefficient De of a sample, provided its clay-mineral content and its porosity are available. Outliers with comparably large G values for HTO (and thus comparably low De values for HTO) are found in formations with specific pore configurations, such as the Rietheim Member containing considerable contents of organic matter, the Schambelen Member and the Beggingen Member of the Lias Group, or the Wedelstandstein Formation, the Passwang Formation, and the «Humphriesioolith Formation» belonging to the Dogger Group above Opalinus Clay. Many rock samples with comparably large G values for HTO (and thus low De) show at the same time some peculiarities in the pore-size distribution derived from N2 adsorption.
Outliers with large geometric factors G for HTO tend to also have large tortuosities for Cl (and thus low De for Cl), with the exception of the two samples from the Beggingen Member and the Schambelen Member of the Lias Group. When excluding the same values as for the relationship for G for HTO (open symbols), the relationship for G for Cl can be fitted for instance by an exponential function (R2 of 0.74) or by a polynomial of degree 4 (R2 of 0.76). The geometric factors G for Cl for clay-mineral-rich samples are roughly a factor of 2 larger than those for HTO. For lower clay-mineral contents, the difference is smaller (about a factor of 1 – 2). This is related to the effects of anion exclusion in clay minerals, which lead to an increase in the tortuosity of the anion diffusion pathways compared to those for HTO in clay-mineral-rich samples.
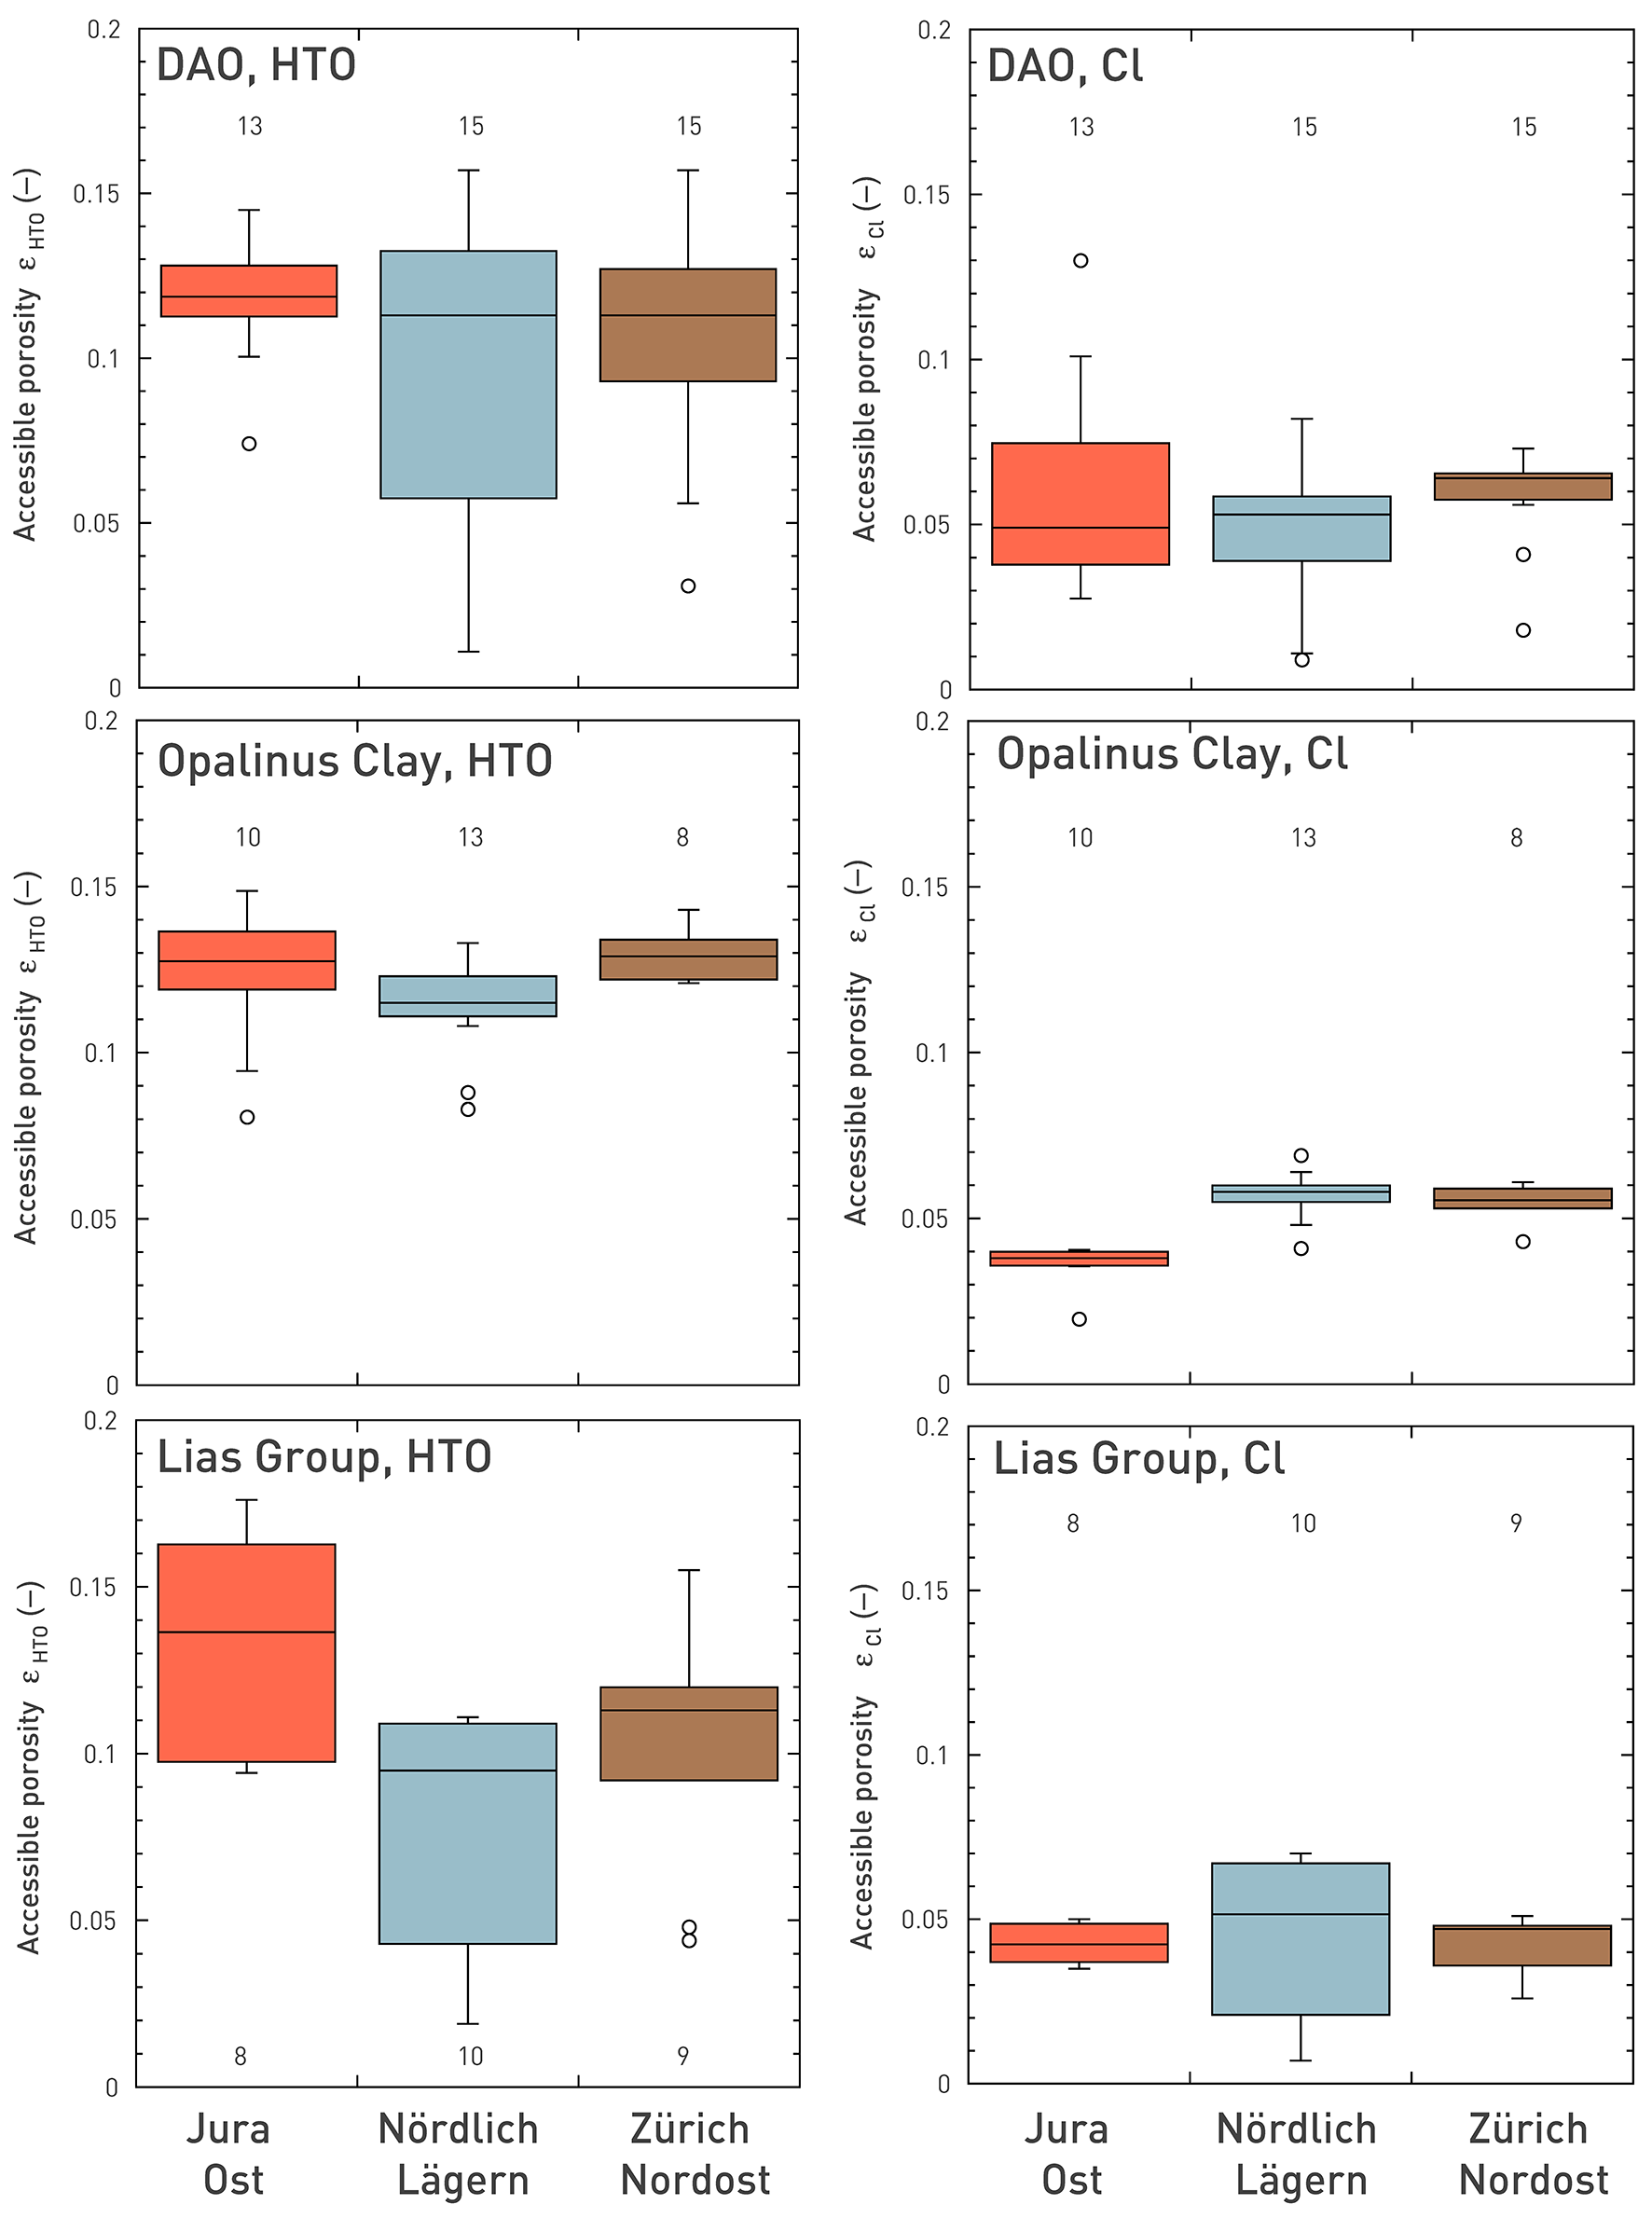
Fig. 5‑52:Box plots illustrating the range of accessible porosities ε for HTO and for Cl, grouped according to the siting regions
DAO: Dogger Group above Opalinus Clay. Each box includes 50% of the values; the horizontal line shows the median, the whiskers the minimum and maximum values within an ‘acceptable’ range (from the upper or lower box limit to ± 1.5 times the box size), the circles values outside this range. The sample number for each group is also indicated.

Fig. 5-53:Correlation of geometric factor G with clay-mineral content for HTO (a) and Cl (b) as a basis for estimating  of HTO and Cl for the Dogger Group above Opalinus Clay, the Opalinus Clay and the Lias Group
Measurements perpendicular to bedding. The solid line shows an exponential function, the dashed line a polynomial of fourth degree fitted to the solid symbols. Open symbols denote outliers defined as values with comparably high G for HTO (i.e. low De of HTO); they are located in the Rietheim Member (Rieth.), Schambelen Member (Scha.) and Beggingen Member (Begg.) of the Lias Group, and in the Wedelsandstein Formation (Wsst.), Passwang Formation (Pass.) and «Humphriesioolith Formation» (Hum.) of the Dogger Group above Opalinus Clay (DAO). In most cases, these outliers also have comparably high G for Cl (i.e. low De of Cl).