
The degree of tectonic deformation in the Opalinus Clay is small compared to the more competent units of the Malm Group and Triassic units (Section 4.3.4). Geomechanically stiffer units are more affected by tectonic loading (Section 4.4), i.e. the stress increase per increment of shortening is higher for limestones than for the Opalinus Clay (Fig. 4‑79 and Fig. 5‑25).
Most drill cores recovered from the Opalinus Clay during the TBO campaign were free of any fractures (Fig. 5‑24). Nevertheless, some veins and smaller faults (below the seismically mappable scale) were encountered (Dossier V of TBOs, see Tab. 2‑1). Based on borehole image analysis, all fractures are considered macroscopically closed in situ. A representative selection of encountered fractures is provided in Fig. 5‑31 (see Tab. 4‑1 for terminology).
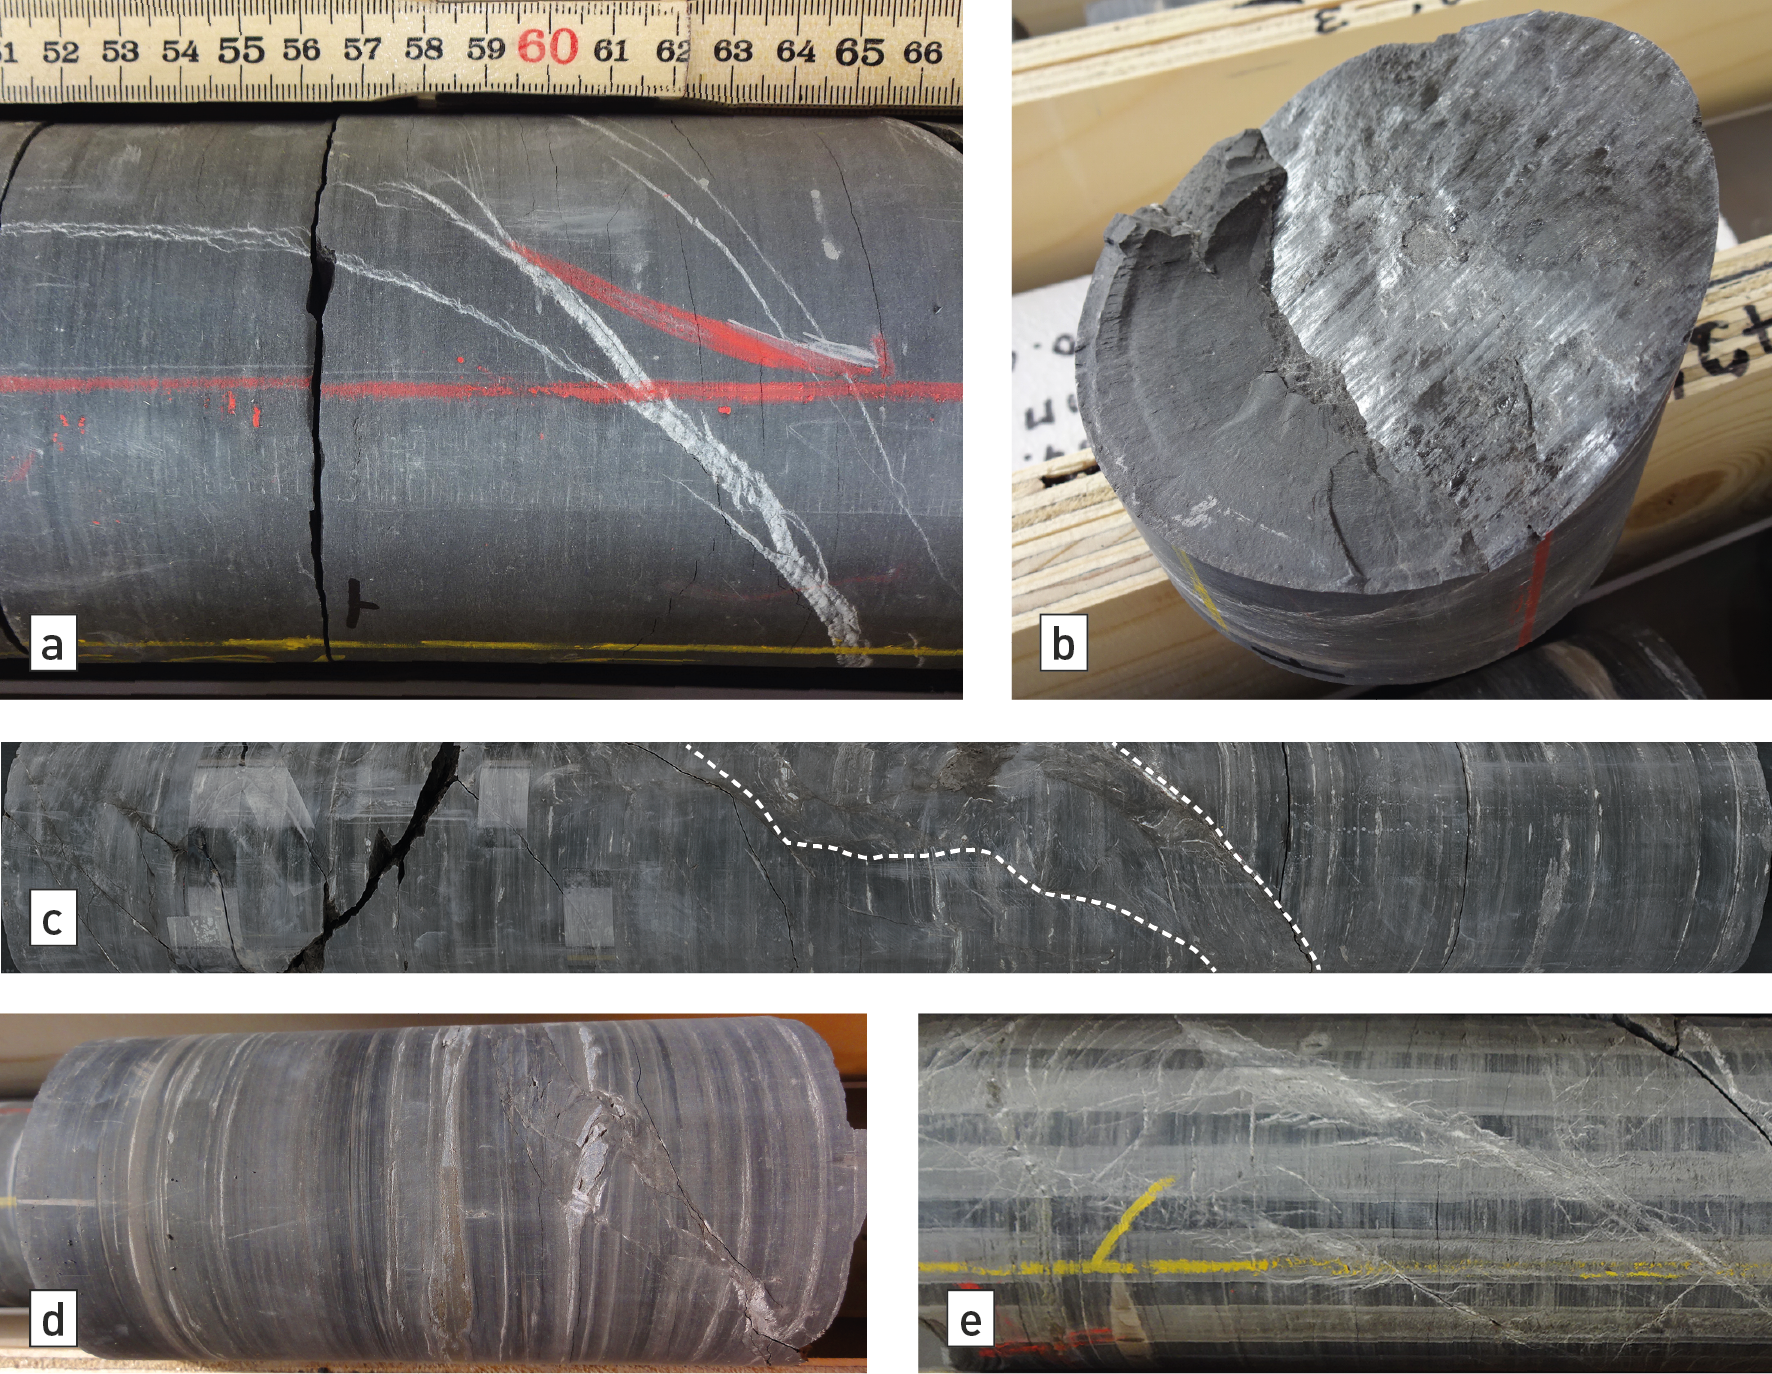
Fig. 5‑31:Examples of tectonic deformation accommodated in the Opalinus Clay from the recent deep boreholes
(a) Vein or mineralised fracture (STA2, 821.86 – 822.15 m MD log depth). (b) Example of micro fault (shear fracture) with calcite slickenfibres (STA2, 855.61 m MD log depth). (c) Small-scale fault resulting in tilting of bedding (BOZ2, 510.02 – 510.70 m MD log depth). (d) Micro- to small-scale fault (BOZ2, 507.90 – 508.15 m MD log depth) with tilting of bedding and onset of fault breccia. Initial normal faulting was followed by a strike-slip-dominated faulting. (e) Multi-stranded veins (STA2, 885.93 – 886.33 m MD log depth).
Small-scale faults (i.e. faults below seismically mappable scale, but larger than an individual surface) consist of tilted and disturbed bedding and fault rock (Fig. 5‑31c), or in some cases of a cluster of micro faults (i.e. individual surface with evidence for movement) including mineralisation of variable thickness (Fig. 5‑31d) and were referred to as fault zones in Dossier V of the deep borehole reports (Tab. 2‑1). Here, major clusters of micro faults are also included; these were highlighted and discussed in the respective reports in the total count of small-scale faults. Typically, one to a maximum of three small-scale faults are identified within each of the newly drilled boreholes in the Opalinus Clay section (Fig. 5‑32a). No cohesionless fault rocks (e.g. gouges) were observed in any of these small-scale faults.
Micro faults (Tab. 4‑1) are more common in the Opalinus Clay. In Dossier V of the deep borehole reports (Tab. 2‑1), micro faults are either termed fault planes, mirror-like fault planes or stylolitic fault planes. Offsets constrained on the micro faults are typically very small, in the order of sub-mm to mm for examples of mirror-like fault planes.
These are typically only 1 – 2 mm thick and cannot be drawn to scale in Fig. 5‑32a (i.e. the stroke width exaggerates the actual width of the micro fault). They are characterised by a single shear surface with striations (i.e. slickensides) and partly slickenfibres indicating sense of shear (Fig. 5‑31b). The number of micro faults encountered in the boreholes varies between 162 micro faults in 122 m of the Opalinus Clay in BOZ2 (i.e. 1.3 micro faults per m) and 37 micro faults in 106 m of the Opalinus Clay in STA2 (0.4 micro faults per m). Overall, the micro faults show shallow dips below 30° (74% of the measured dips are below 30°, 91% are below a dip of 45°). The deviated borehole RHE1 (ca 30° from vertical) shows very similar dip values for the micro faults (71% of the micro faults have measured dips below 30° and 86% have dips below 45°). This comparability of dip angle between the deviated RHE1 borehole and the vertical boreholes can be interpreted in the sense that no systematic sampling bias by vertical boreholes was observed: if vertical micro faults were systematically undersampled in the vertical boreholes, a different dip distribution of micro faults in RHE1 would have been expected.
Veins (mineralised fractures) (Fig. 5‑31a) are mostly very thin, with thicknesses of 1 – 2 mm (> 90% of all mapped veins have a thickness below 2 mm). These veins were further analysed regarding their microstructural and geochemical characteristics (Section 4.7). Detailed microstructural analyses highlighted several phases of vein growth from early compaction to Miocene shortening and extension related to the formation of the Jura Fold-and-Thrust Belt and the Hegau-Bodensee Graben (Akker et al. 2023). Mechanisms of formation and relevance of veins for the barrier integrity are further discussed in Section 5.7.6.
The overall fracture frequency (i.e. including veins) was statistically evaluated by the fracture area per unit volume (P32 value) in Section 4.3, and a detailed analysis for the Opalinus Clay is provided in Fig. 5‑32b. The whisker plots in the figure are explained for the example of borehole BOZ2: the median P32 is 0.6 m2/m3, the average P32 is 1.9 m2/m3, with 75% of the 15 cm sampling intervals having a P32 lower than 2.1 m2/m3 and 95% of the 15 cm intervals lower than 5.3 m2/m3.
Comparing the analyses across all new boreholes shows generally very low P32 values; only for BOZ2 is the median value above 0 m2/m3. This means that the vast majority of the 15 cm sampling intervals in the Opalinus Clay are devoid of any fracture (excluding drilling-induced). For STA3, STA2, BUL1, MAR1 and TRU1, 95% of all sampling intervals have a P32 value of zero (i.e. box and whisker plots are located at zero in Fig. 5‑32b). Larger continuous intervals free of any fracture (excluding drilling-induced) were encountered in each borehole. The longest intervals free of fractures for each borehole vary between 12.1 m in BOZ2 and 32.1 m in BUL1.
Furthermore, the whisker plots allow differentiation of the degree of clustering between the boreholes (Fig. 5‑32b). For the boreholes STA3, STA2, BUL1, MAR1 and TRU1, the average P32 values are above the 95% interval of data, indicating a strong clustering with very few 15 cm intervals characterised by relatively high P32 values. In the boreholes BOZ2, BOZ1 and BAC1, this difference is less but the average values are still above the median values, indicating some degree of clustering. Generally, the boreholes BOZ2, BOZ1 and BAC1 are characterised by a more pervasive tectonic deformation and generally higher P32 values. The RHE1 borehole also has elevated P32 values, which might be associated with the seismically mappable Rheinau Fault located in the vicinity (Nagra 2024c). The more acute angle between the micro faults and the borehole path also leads to higher P32 for geometric reasons because dip distribution in RHE1 is comparable to that in the vertical boreholes (TBO reports in Tab. 2‑1).
Outcrop-scale faults within the Opalinus Clay are known from quarries in Siblingen and Holderbank (Fig. 5‑33), and the "Main Fault" in the Mont Terri rock laboratory (Fig. 5‑34). These faults can be considered as transitional small-scale to local faults according to Tab. 4‑1, and accordingly are at an intermediate scale between the structures encountered in the cores and the seismically mappable faults (Nagra 2024a, 2024b, 2024c).
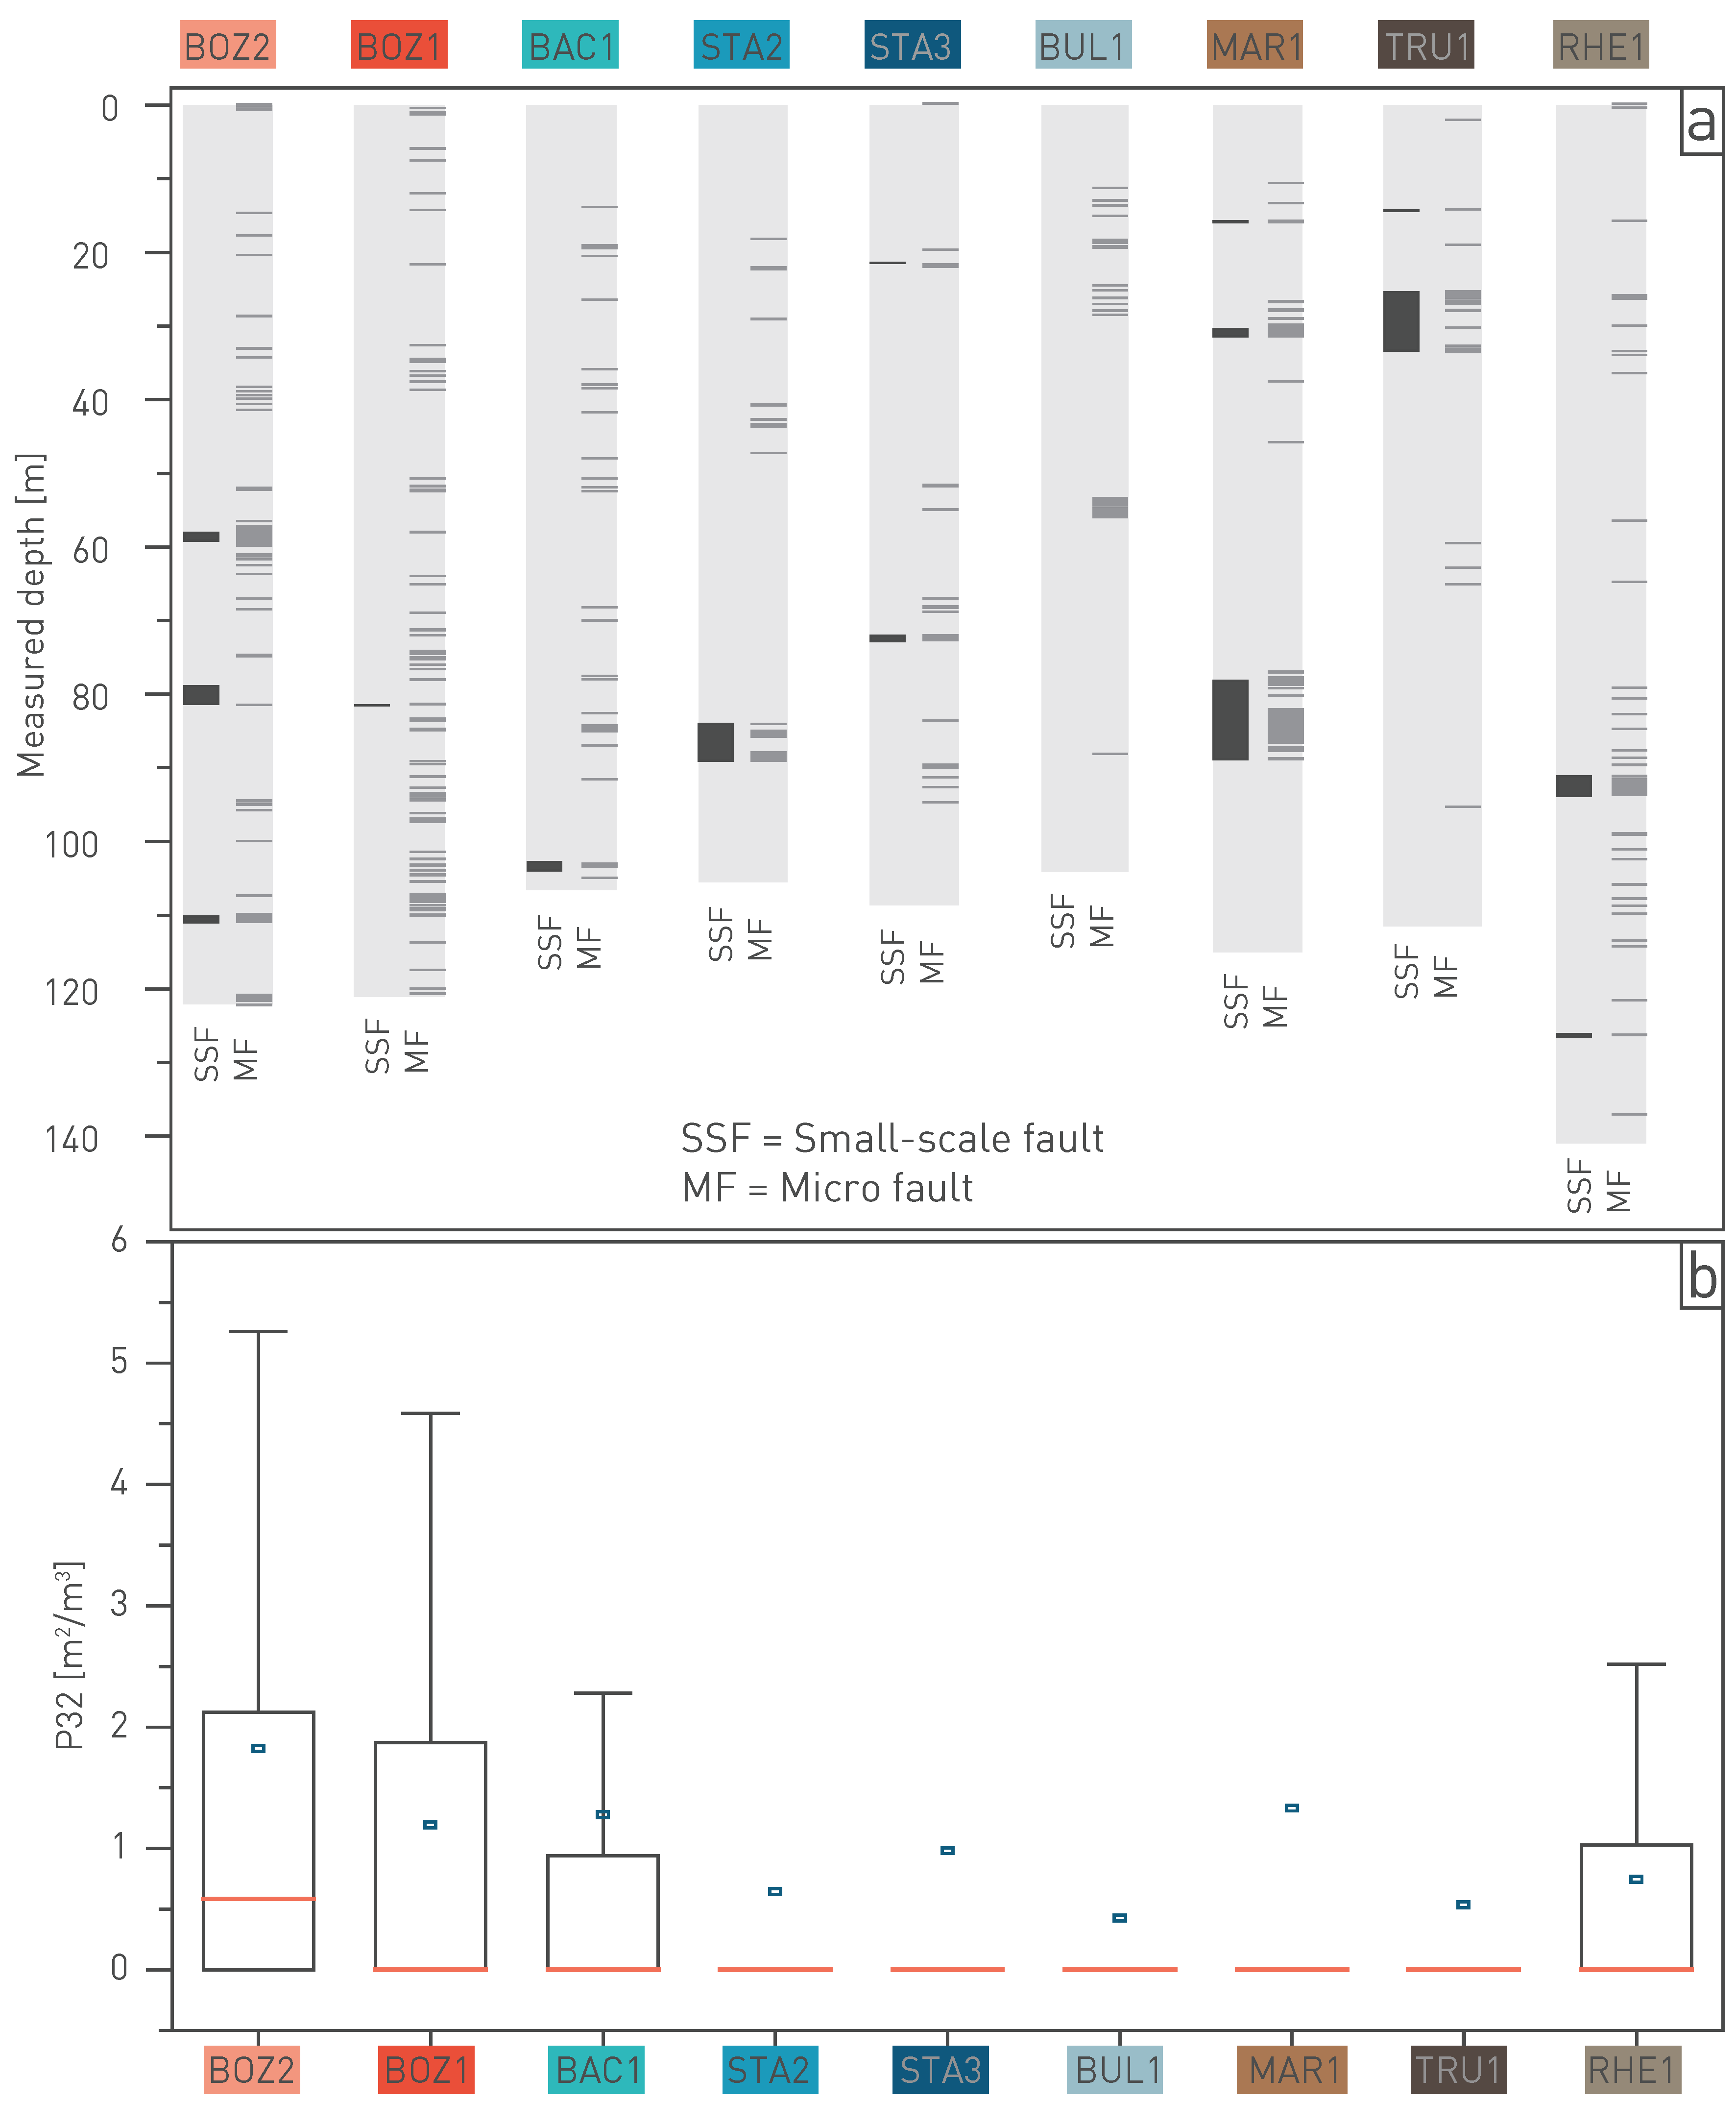
Fig. 5‑32:Distribution of small-scale fault and micro fault frequency in the Opalinus Clay from new boreholes and overall fracture frequency
(a) Depth plot showing the distribution of small-scale faults and micro faults. Boreholes are arranged from W to E. Note that vertical extent is only to scale for the small-scale faults, but stroke width exaggerated the width of micro faults. (b) Whisker plots for fracture frequency in the Opalinus Clay (P32 values, see Section 4.3). Boreholes are arranged from W to E. Note that no box or whisker plots are shown for boreholes STA3, STA2, BUL1, MAR1 and TRU1, indicating that at least 95% of the sampling intervals (15 cm length) are devoid of any fractures (excl. drilling-induced fractures). The box extents to the 5% and 95% percentiles and the red line represents the median, while the blue marker depicts the mean of the distributions.
The outcrop-scale faults are characterised by strong heterogeneity, both in terms of width but also in terms of disturbance and accommodated deformation. Multiple micro faults often form an anastomosing network, also containing less deformed rock volumes. Similar fault geometries are also observed in the fairly wide deformation zones observed in triaxial testing at low strain (Fig. 5‑32), with increasing strain leading to stronger rotation of bedding, fragmentation of the rock and potentially scaly clay and fault gouge along several slip surfaces (e.g. Laurich et al. 2014, 2018, Winhausen et al. 2022).
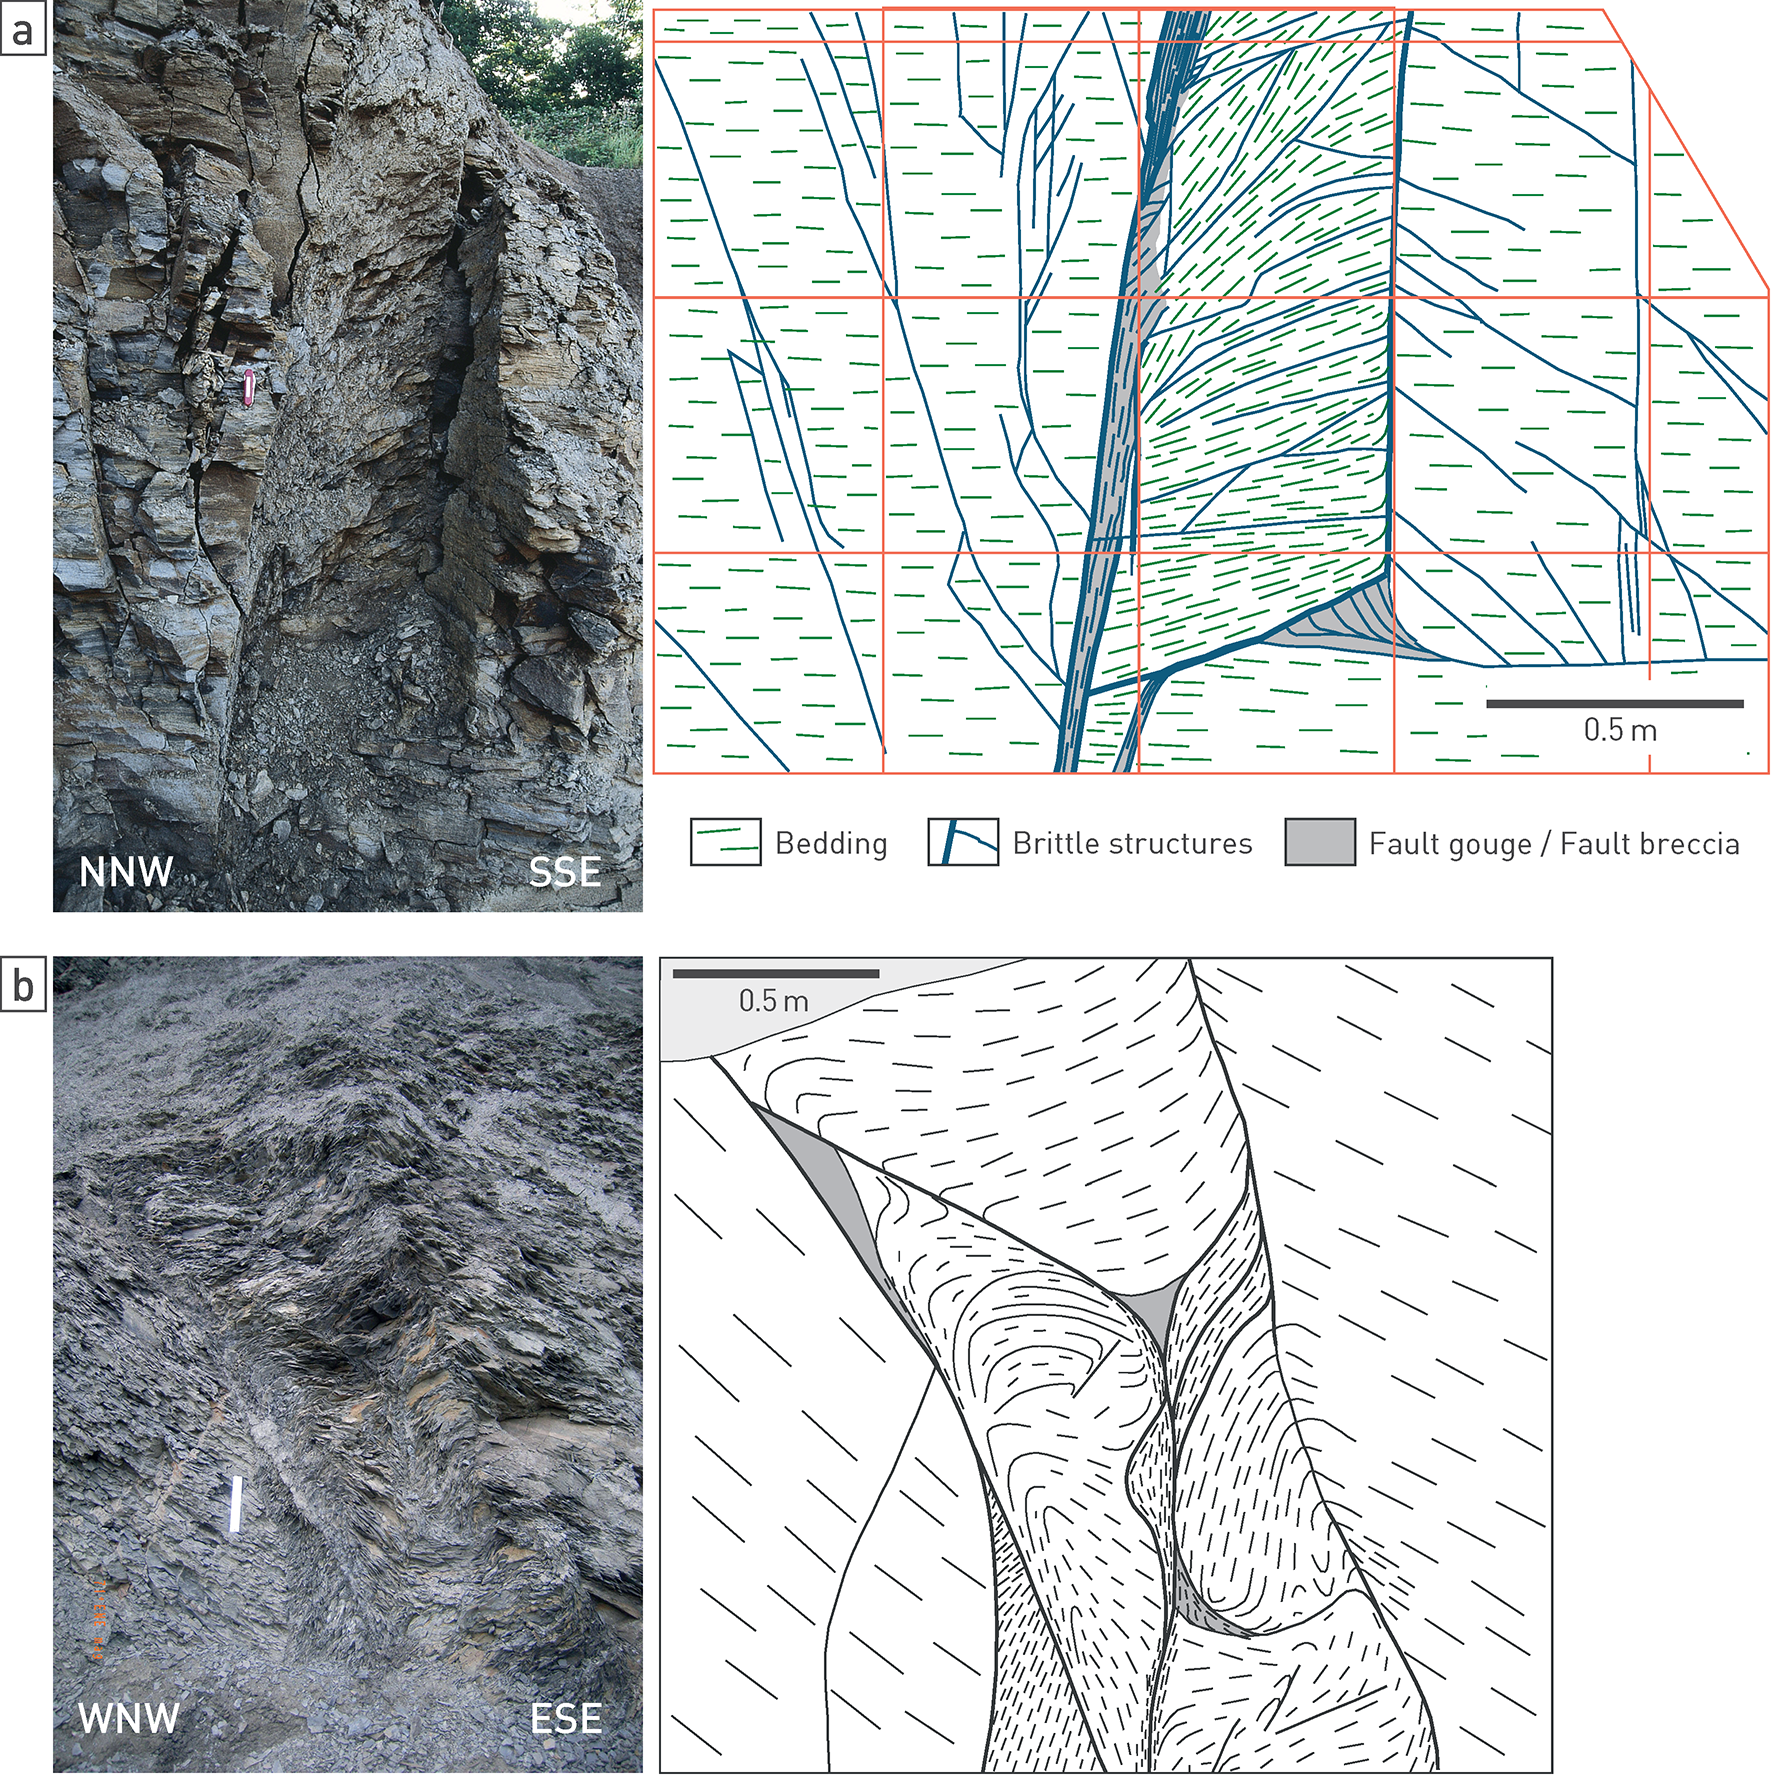
Fig. 5‑33:Outcrop examples of fault structures in the Opalinus Clay
(a) Normal fault in a quarry near Siblingen, close to ZNO (Nagra 2002). (b) Thrust fault in a quarry near Holderbank, close to JO (Giger & Marschall 2014). Note: friable rock structure is affected by surface effects (swelling, drying, weathering) and not representative of in-situ conditions.
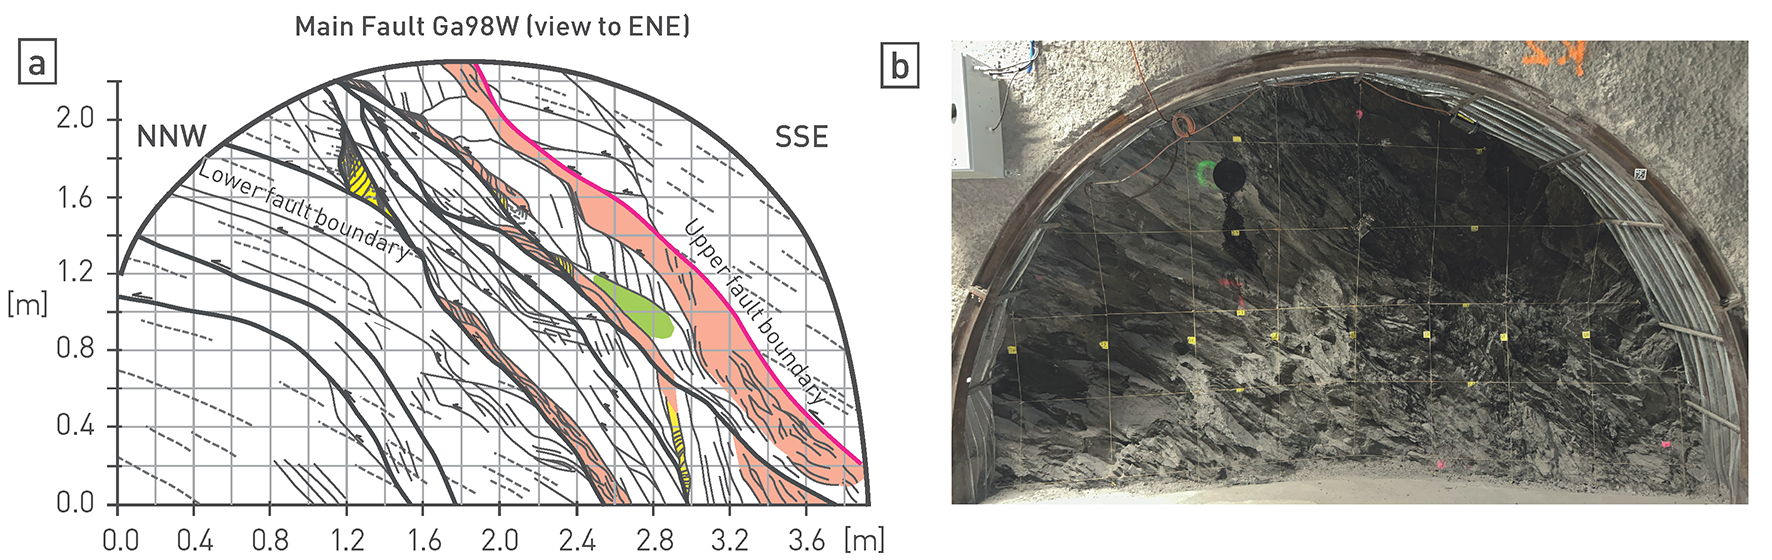
Fig. 5‑34:Example of the "Main Fault" in the Opalinus Clay at the Mont Terri rock laboratory
a) Interpretation according to Jaeggi et al. (2017). b) Photograph.
The strong variability in the degree of deformation in the Opalinus Clay is typical for so-called soft-linked sediments (e.g. Dahlstrom 1969, Walsh et al. 1999, Fossen & Rotevatn 2016). Based on vintage 3D seismic reflection data from ZNO, Roche et al. (2020) interpreted fault segmentation not only along strike, but also vertically across the Opalinus Clay in the Wildensbuch Flexure (Fig. 5‑35 and Section 4.3.4). Localised deformation was found to be more partitioned across the Opalinus Clay, partly accommodated by folding. Similar observations are made from the Mont Terri rock laboratory (Fig. 5‑34), where the "Main Fault" is segmented along strike (e.g. Jaeggi et al. 2017) and also in a vertical direction, as drilling experience in various experiments has shown. Partitioning of deformation by segmentation and soft-linkage thus reduces offsets along individual fault segments and affects the vertical connectivity of the segments. Overall, the segmentation hinders fault continuity and connectivity, and consequently also fault-related flow.
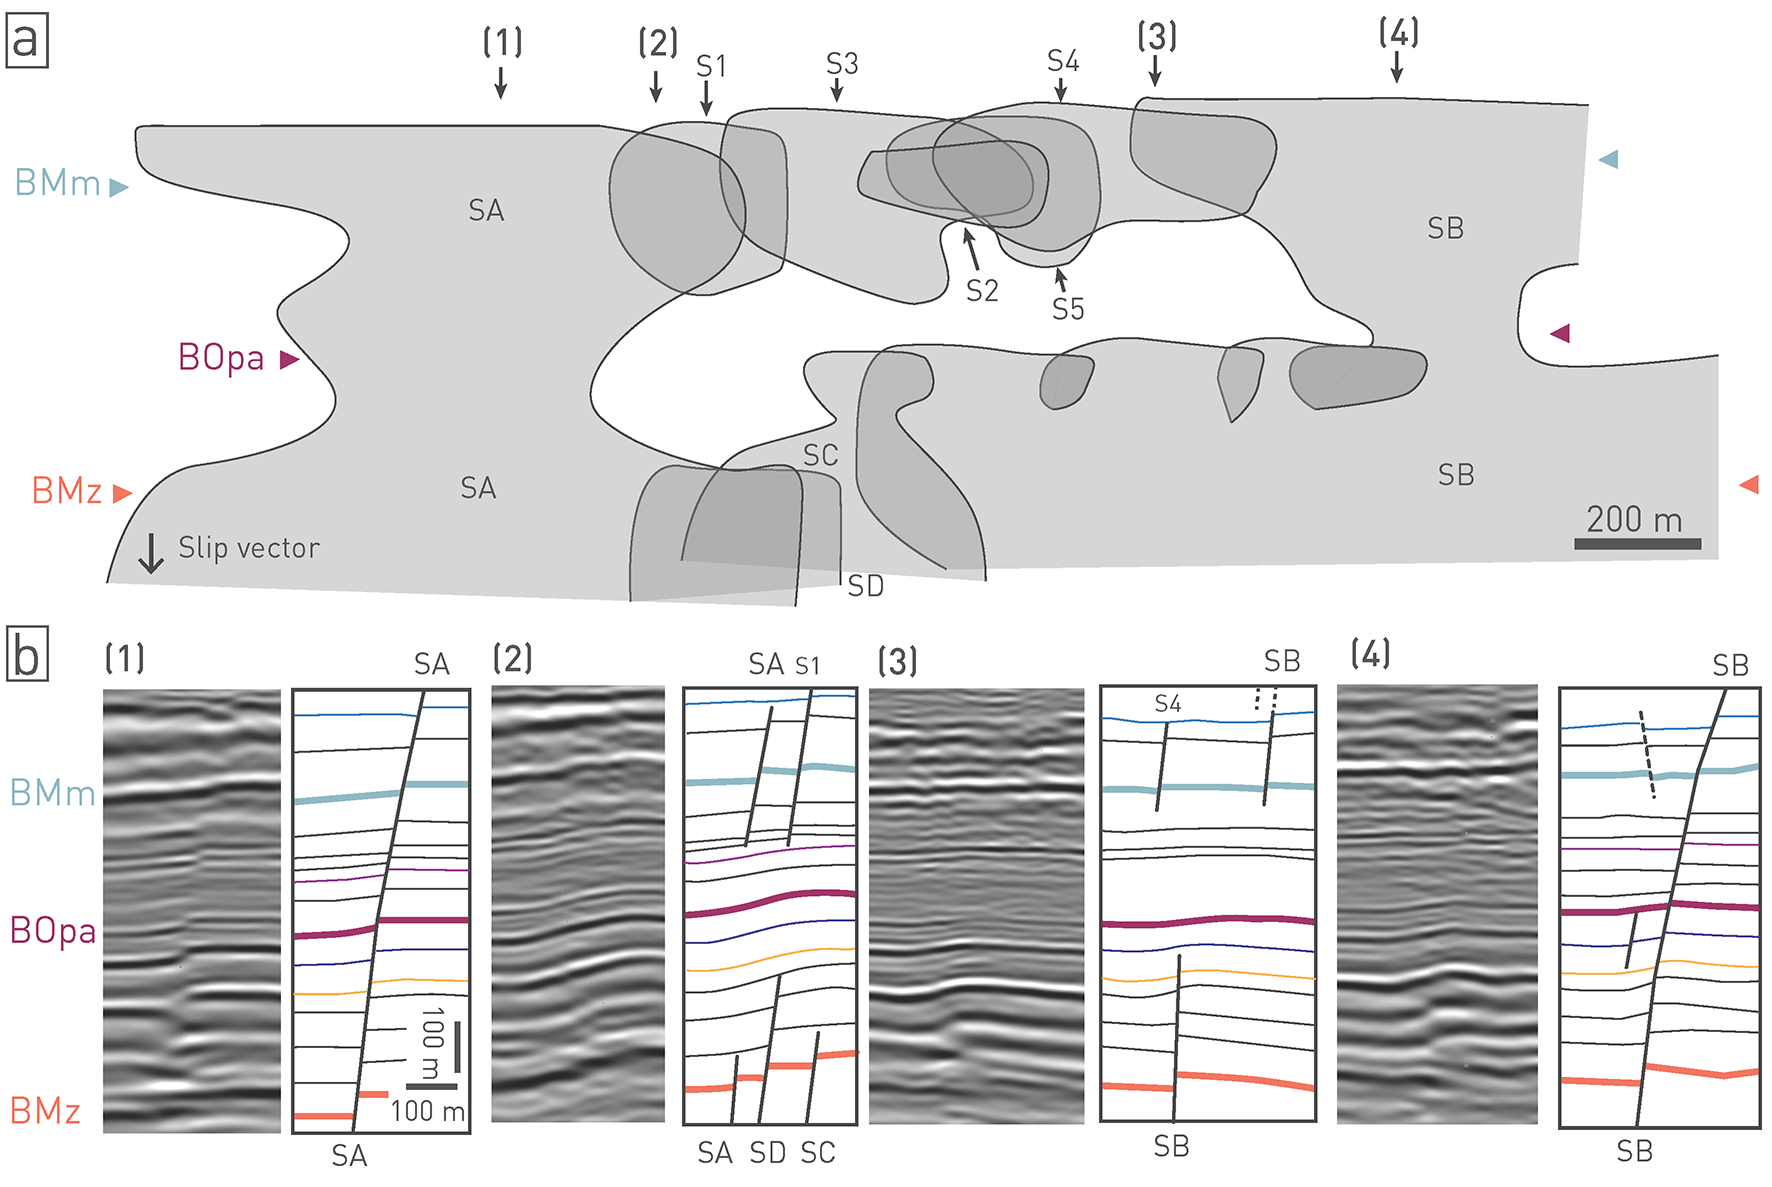
Fig. 5‑35:Fault architecture of a seismically mappable fault (Wildensbuch Flexure in ZNO)
(a) Strike projection of the Wildensbuch Flexure (see also Section 4.3.4) with fault surfaces represented in grey. (b) Four seismic sections and their interpretations at the locations indicated in (a). BMm: Base Malm Group, Bopa: Base Opalinus Clay, BMz: Base Mesozoic unconformity. SA-SD and S1 to S5 indicate distinct fault segments. In sections (1) and (4) faults are continuous across the Opalinus Clay, whereas in sections (3) and (4) they are interpreted to be discontinuous at the seismic scale. Slightly modified after Roche et al. (2020).
Recent trenching and outcrop mapping around Frick (JO siting region) focused first on the Opalinus Clay in the Cheesleten quarry, but no tectonic fault could be mapped. However, in the nearby Gruhalde quarry, a normal fault in the underlying Staffelegg Formation was exposed. An offset between 1.5 to 2.5 m in two mechanically contrasting lithologies (the Beggingen Member and the Frick Member) is interpreted (Fig. 5‑36, see also Fig. 4‑25). In the fossiliferous limestones of the Beggingen Member, the fault is discrete, but then splays off into the mechanically softer and weaker clay-rich rocks of the Frick Member. The trench mapping highlighted that as the fault propagates into softer rock, the strain becomes more distributed. Softer rocks deform more easily and can accommodate strain over a larger area. The Frick Member is considered here as an analogue of the Opalinus Clay, where similar dispersion of strain accommodation is also indicated at the seismic scale in the siting regions (Nagra 2024a, 2024b, 2024c).
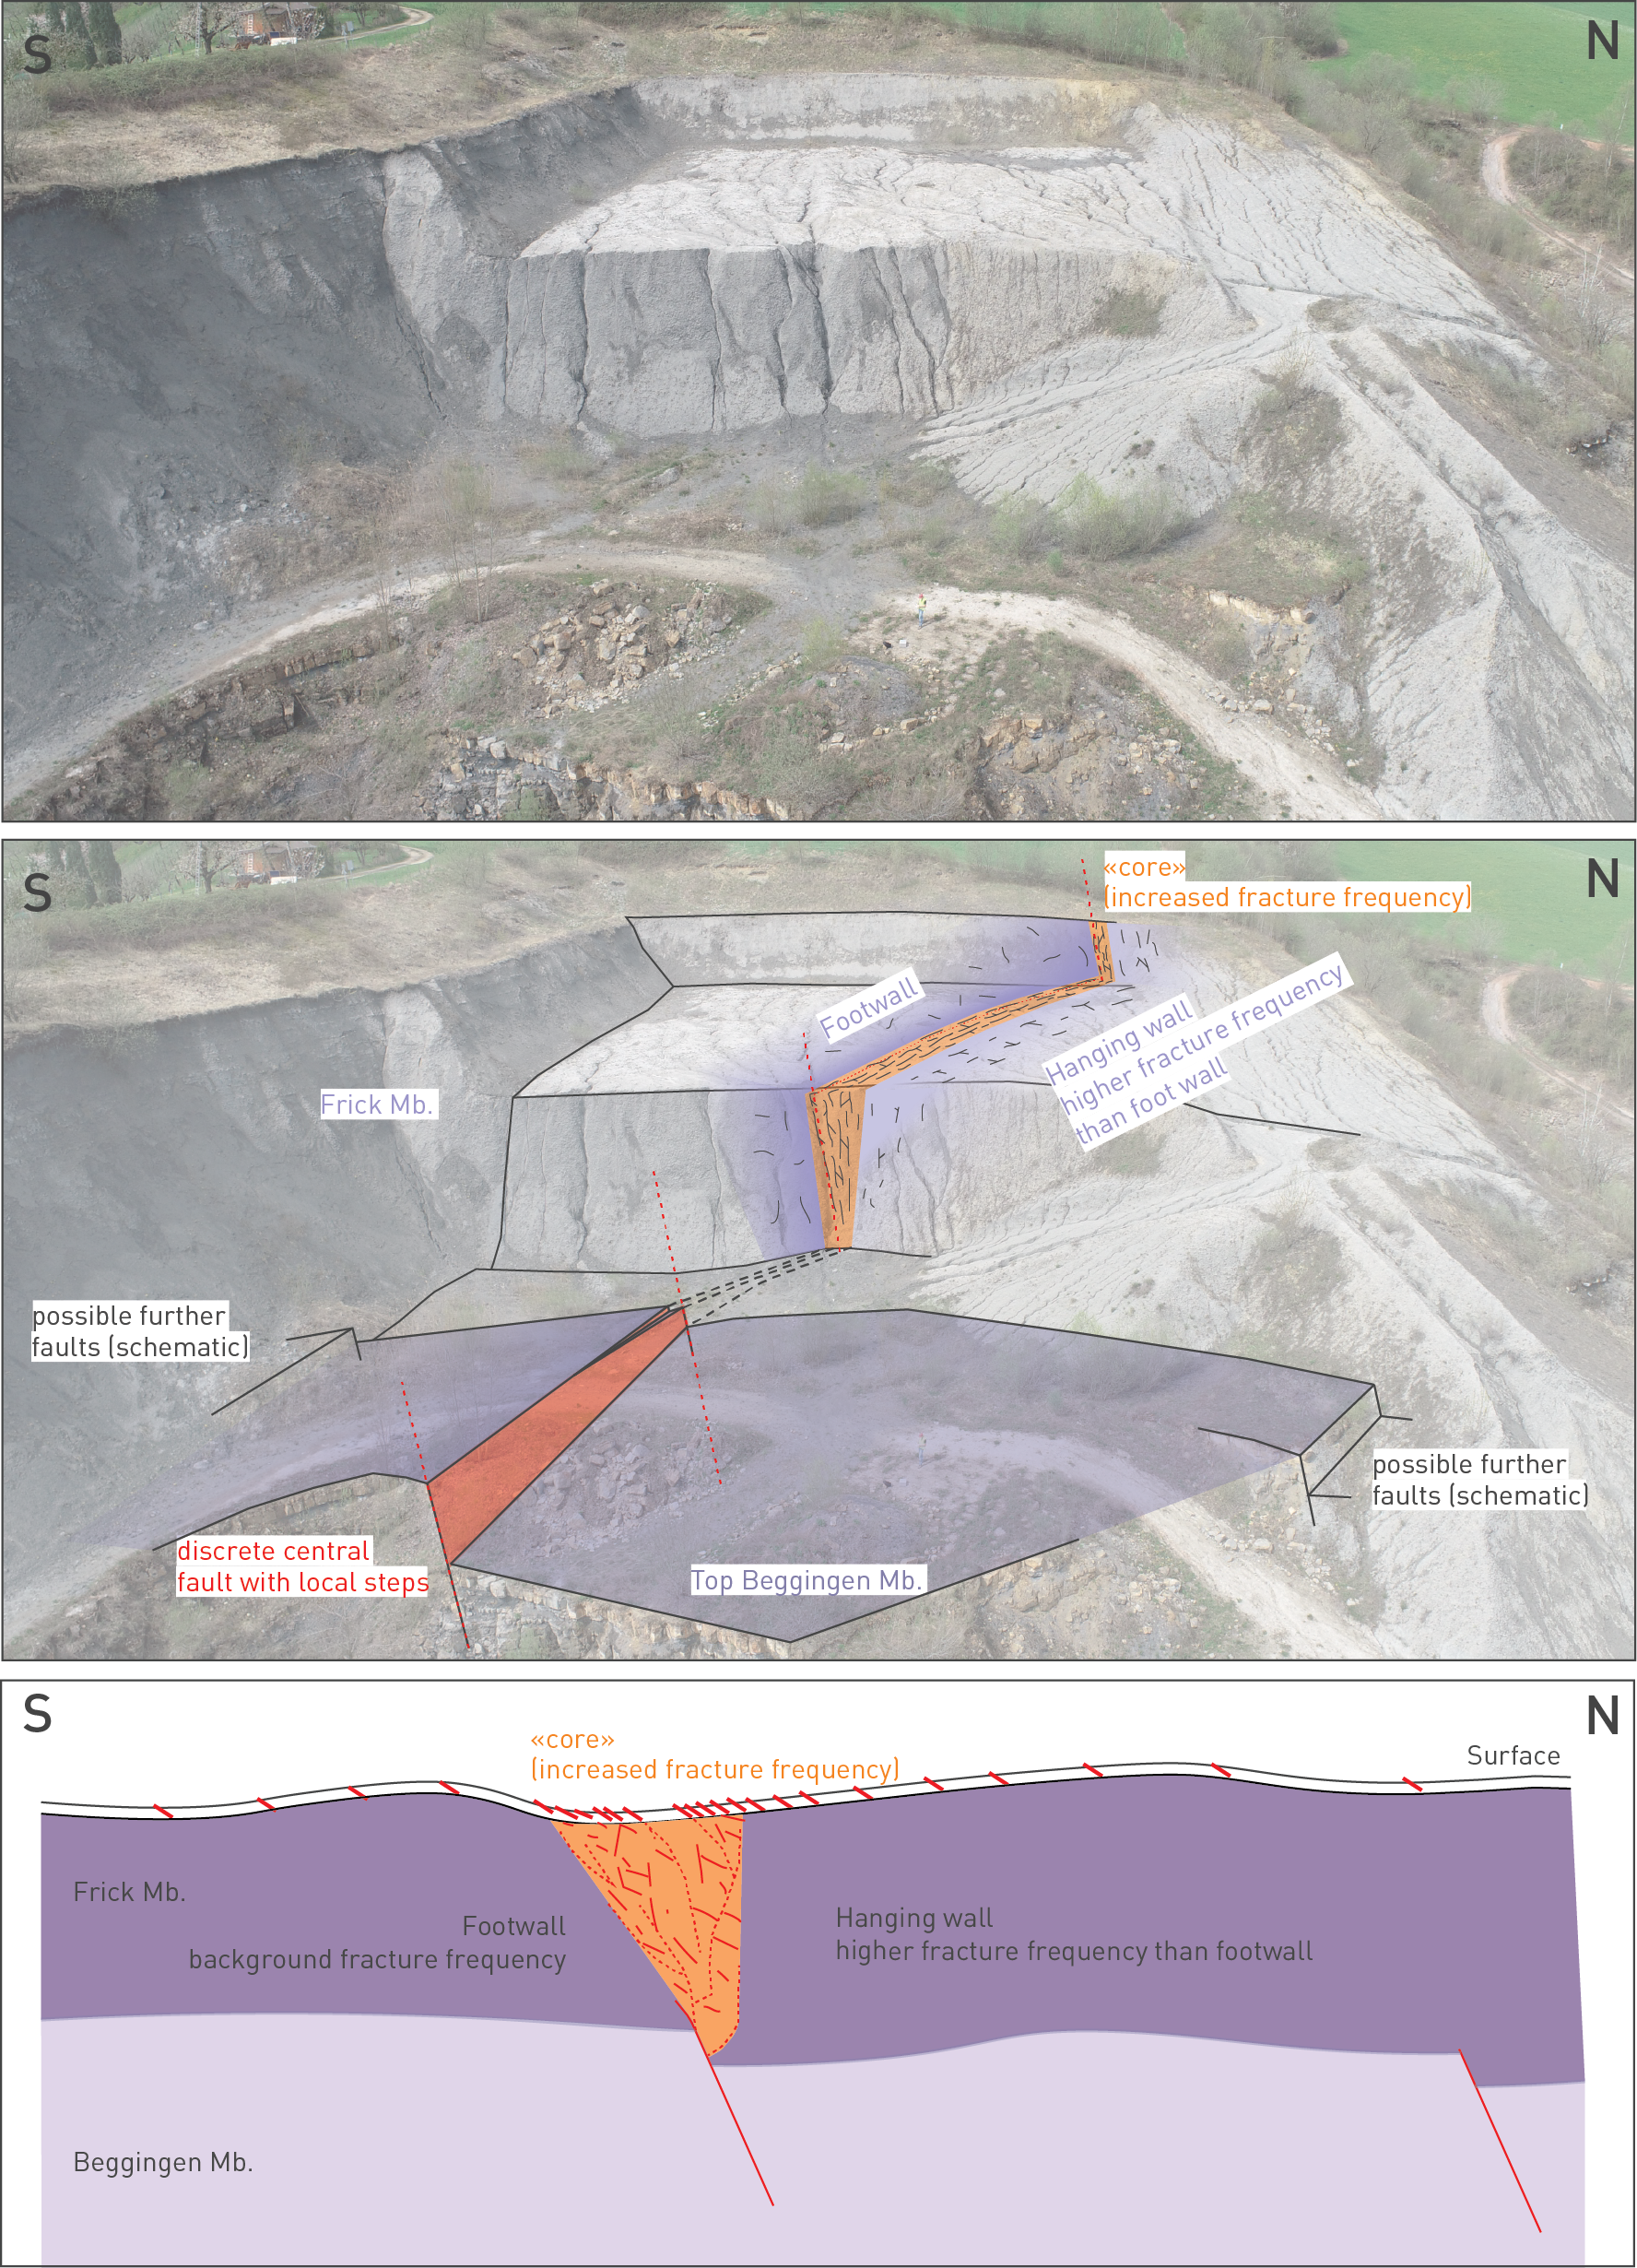
Fig. 5‑36:Synthesis of trench mapping exposing fault propagation across mechanical layering
Highlighting the difference in strain accommodation between the Beggingen Member and the clay-mineral-rich Frick Member (Gruhalde quarry near Frick, Canton Aargau).