
Hydraulic tests on core samples have the advantage that effective stresses can be controlled, and the matrix properties can be related to a measurable mineralogy or porosity. A variety of methods such as constant head tests, consolidation theory (oedometer) and advective displacement with sample dimensions in the range of 1 to 10 cm were applied and provide an overall consistent picture (see Dossier IX of TBO reports in Tab. 2‑1 and Waber 2020).
The matrix hydraulic conductivities perpendicular to bedding scatter over a relatively narrow range around 10-13 m/s (Fig. 5‑37). There is no obvious correlation between hydraulic conductivity and mineralogy or porosity. Given the substantial lithological variability, this can be taken as an indication that diagenetic cementation of clay-poor samples is the cause for the low hydraulic conductivities. Note that a similar trend is observed by an in-depth interpretation of the in-situ hydraulic packer test dataset, for example the existence of a negative correlation between the measured bulk hydraulic conductivities with the carbonate content in the Passwang Formation in JO and the Wedelsandstein Formation in ZNO and NL (Nagra 2024m). The hydraulic packer test results in the latter formations also indicate that quartz and feldspar-rich layers that are poor in carbonates could show slightly enhanced matrix hydraulic conductivities (Nagra 2024m).
The systematic comparison of tests parallel and perpendicular to bedding on the centimetre-scale samples did not show a meaningful hydraulic anisotropy of the Opalinus Clay. Anisotropy depends on the scale of observation and the centimetre-scale samples are too small to directly derive formation-scale anisotropy. However, the dataset can be used for a geostatistical evaluation of equivalent horizontal and vertical hydraulic conductivities. The result indicates an anisotropy (Kh/Kv) ratio of ca. 5 (best estimate; Nagra 2024m).
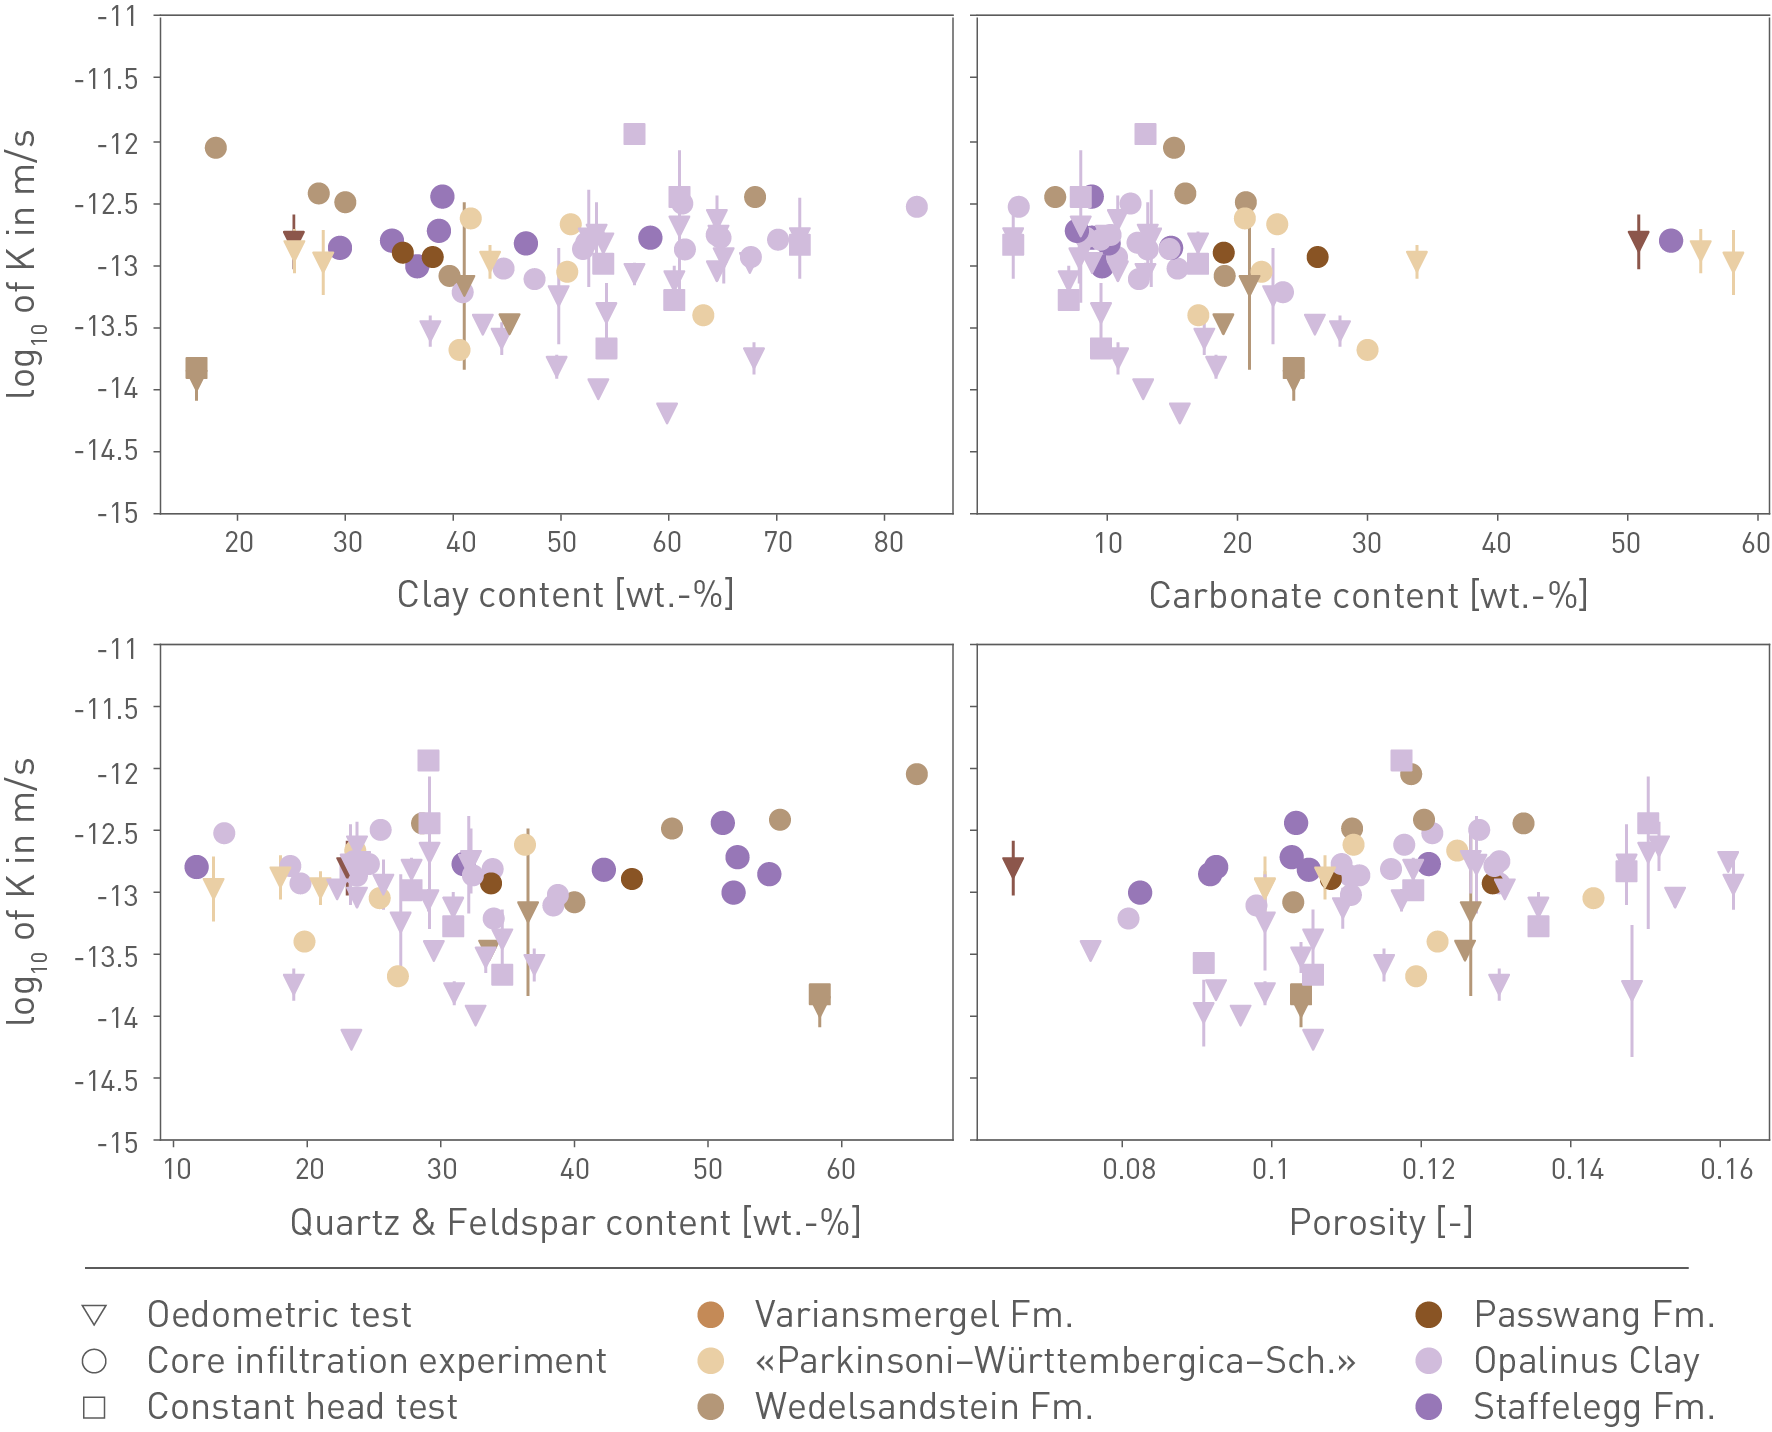
Fig. 5‑37:Matrix hydraulic conductivity of the Opalinus Clay and clay-mineral-rich confining units as a function of mineral composition and porosity
All measurements were done with flow perpendicular to bedding. The figure displays the results of different test types. For the oedometric tests, the error bars show the range of measured hydraulic conductivities over a spectrum of effective stress representative for in-situ conditions (Dossier IX of TBO reports, see Tab. 2‑1). The data shown are from the TBO boreholes plus Benken and Schlattingen-1 boreholes. The few drill core samples tested perpendicular to bedding, whose mineralogy and porosity are not available, show hydraulic conductivities scattering between 1 × 10-15 and 2 × 10-13 m/s.