
Together with porosity, the surface area of minerals and the distribution of pore sizes are key parameters that affect numerous rock properties. Clay-mineral-rich lithologies are known to have small pore apertures and large mineral surface areas, with major consequences for solute transport (low permeability, substantial cation-exchange capacity and sorption on clay surfaces etc.). N2 ad-/desorption tests provide the basis for obtaining the external surface area of minerals (i.e. not considering clay interlayers that are not accessed by N2; Brunauer et al. 1938), as well as the pore-size distribution in the range 2 – 200 nm (Barrett et al. 1951). More detail on methodology and results is provided in Mazurek et al. (2023a).
As expected, the external surface area shows a good correlation with the clay-mineral content (Fig. 5‑15a), illustrating the fact that clay minerals are by far the most relevant contributors to surface area. The average value for the Opalinus Clay is 30 m2/g. The trends for all lithologies represented in the Füchtbauer triangle are shown in Fig. 5‑13. Mean radii of external pores (assuming cylindrical geometry) can be estimated by dividing the water content relative to dry weight by the external surface area and the water density. The data trends are shown in Fig. 5‑13, and all data from the Jurassic profile are shown as a function of the clay-mineral content in Fig. 5‑15b. For lithologies with > 50 wt.-% clay minerals, the mean pore radius is remarkably constant at 3 nm. More scatter is found for clay-mineral-poor rocks, illustrating the textural heterogeneity of limestones in particular. While the oolitic Hauptrogenstein (and all Fe-rich oolites) have large mean pore apertures, other limestones with often micritic fabrics (such as the Wildegg Formation) may have mean apertures even smaller than clay-mineral-rich lithologies.
Examples of the full pore-size distributions for different lithologies are illustrated in Fig. 5‑15c. In clay-mineral-rich lithologies, the size distribution based on the adsorption branch shows a prominent peak at 2 – 3 nm, which can be associated with clay minerals as its amplitude decreases with decreasing clay-mineral content. In carbonate-rich lithologies (most of which still contain a small proportion of clay minerals), a broad peak in the range of 40 – 100 nm dominates. Bimodal distributions with both peaks at comparable amplitude are found for intermediate, more quartz-rich lithologies, while silt-/sandstones towards the quartz corner show a broad plateau over a wide range of pore sizes. Thus, pore-size distributions vary systematically between lithologies, and clay-mineral-rich lithologies tend to be dominated by the smallest pore diameters in the range of a few nm.
N2 adsorption is insensitive to pore radii larger than about 200 nm. Samples from the Opalinus Clay were also studied using NMR cryoporometry (Fleury et al. 2022, Mazurek et al. 2023a), a method that can capture even larger pores. As shown in Fig. 5‑15d, such pores were not identified by this method and probably do not exist. Another advantage of the cryoporometry technique is the fact that samples are tested in their natural state, i.e. no drying is needed prior to or during analysis, in contrast to most other methods (e.g. Hg intrusion porosimetry, H2O ad-/desorption). It is concluded that many, if not most, pores resolvable in the clay-mineral-rich matrix under the SEM are not present in the formation but are artefacts of drying and sample preparation.
As already noted in previous studies (e.g. Mazurek 2011), an excellent correlation can be found between the external surface area and the cation-exchange capacity (Fig. 5‑16). This is also shown in Fig. 5‑13.
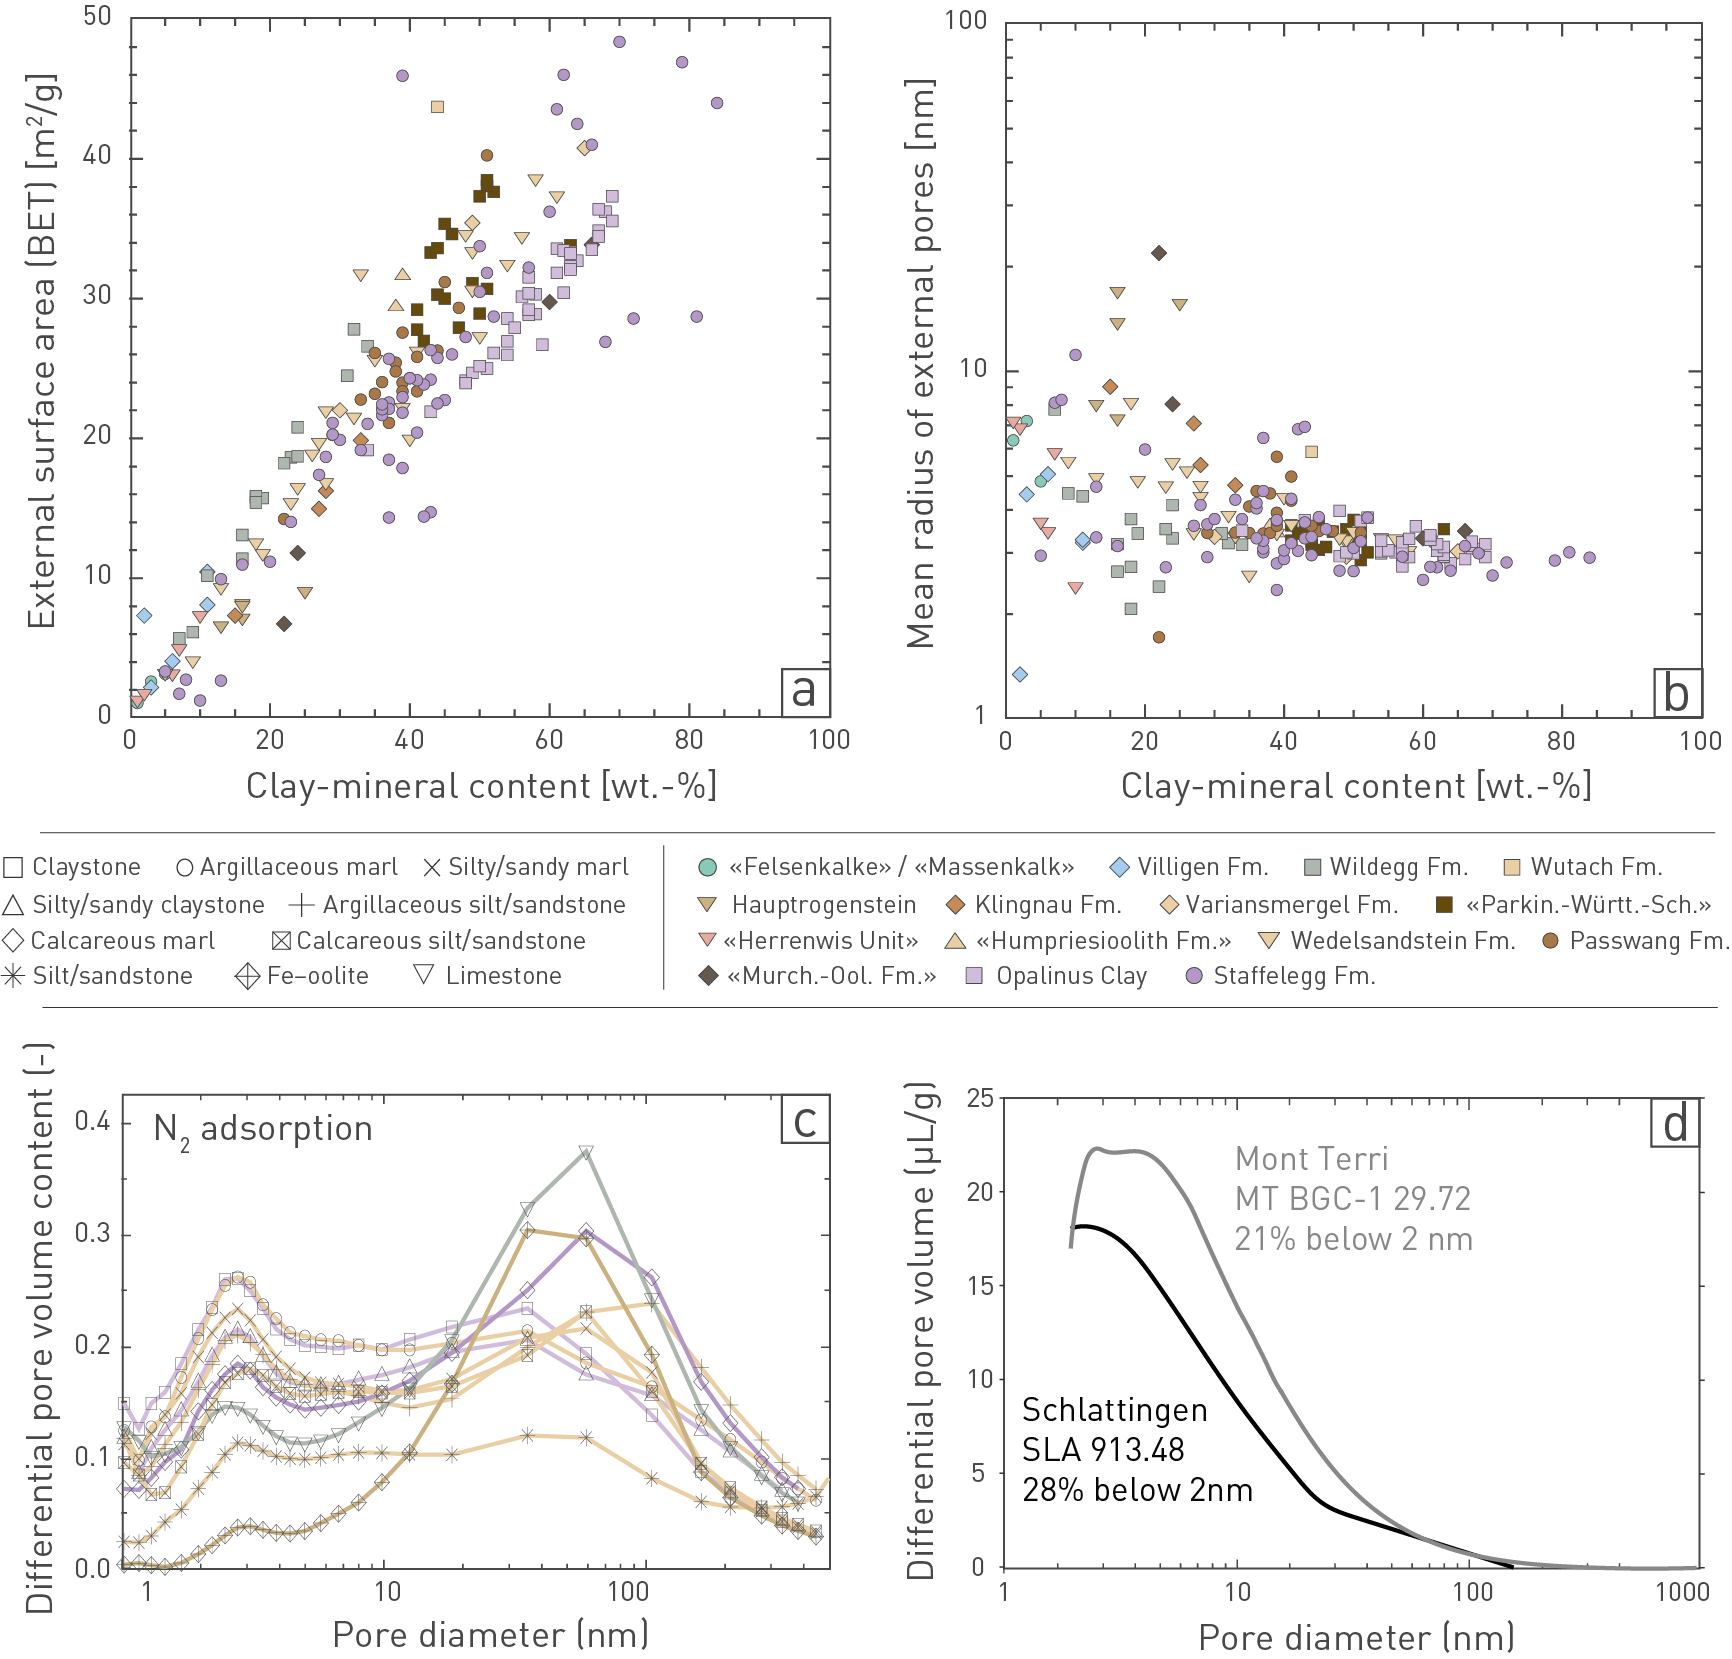
Fig. 5‑15:Mineral surface areas and pore-size distributions in the Jurassic profile
(a) External (BET*) surface area as a function of clay-mineral content.
(b) Mean radius of external pores as a function of clay-mineral content.
(c) Examples of pore-size distributions based on the N2 adsorption branches, normalised to the water content of the samples (BJH** algorithm). Claystone = TRU1 923.34, Opalinus Clay, «Clay-rich sub-unit»; Argillaceous marl = BUL1 808.92, «Parkinsoni-Württembergica-Schichten»; Silty/sandy claystone = BUL1 965.46, Opalinus Clay, «Mixed clay-silt-carbonate sub-unit»; Argillaceous silt/sandstone = TRU1 788.76, Wedelsandstein Formation; Silty/sandy marl = STA3 748.38, Wedelsandstein Formation; Calcareous marl = MAR1 717.76, Staffelegg Formation, Rietheim Member; Limestone = BOZ1 323.16, Wildegg Formation, Effingen Member; Calcareous silt/sandstone = MAR1 588.40, Wedelsandstein Formation; Silt-/sandstone = TRU1 812.24, Wedelsandstein Formation; Fe-rich oolite BOZ2 313.13, Hauptrogenstein, Spatkalk.
(d) Pore-size distribution for two samples of the Opalinus Clay obtained from NMR cryo-porometry. Adapted from Fleury et al. (2022).
* Method to derive the (external) surface area of solid materials based on gas adsorption (typically N2). BET stands for the names of the developers of the method (Brunauer, Emmet, Teller).
** Barrett – Joyner – Halenda algorithm (a procedure for calculating pore volumes and pore-size distributions from experimental isotherms, using the Kelvin equation).
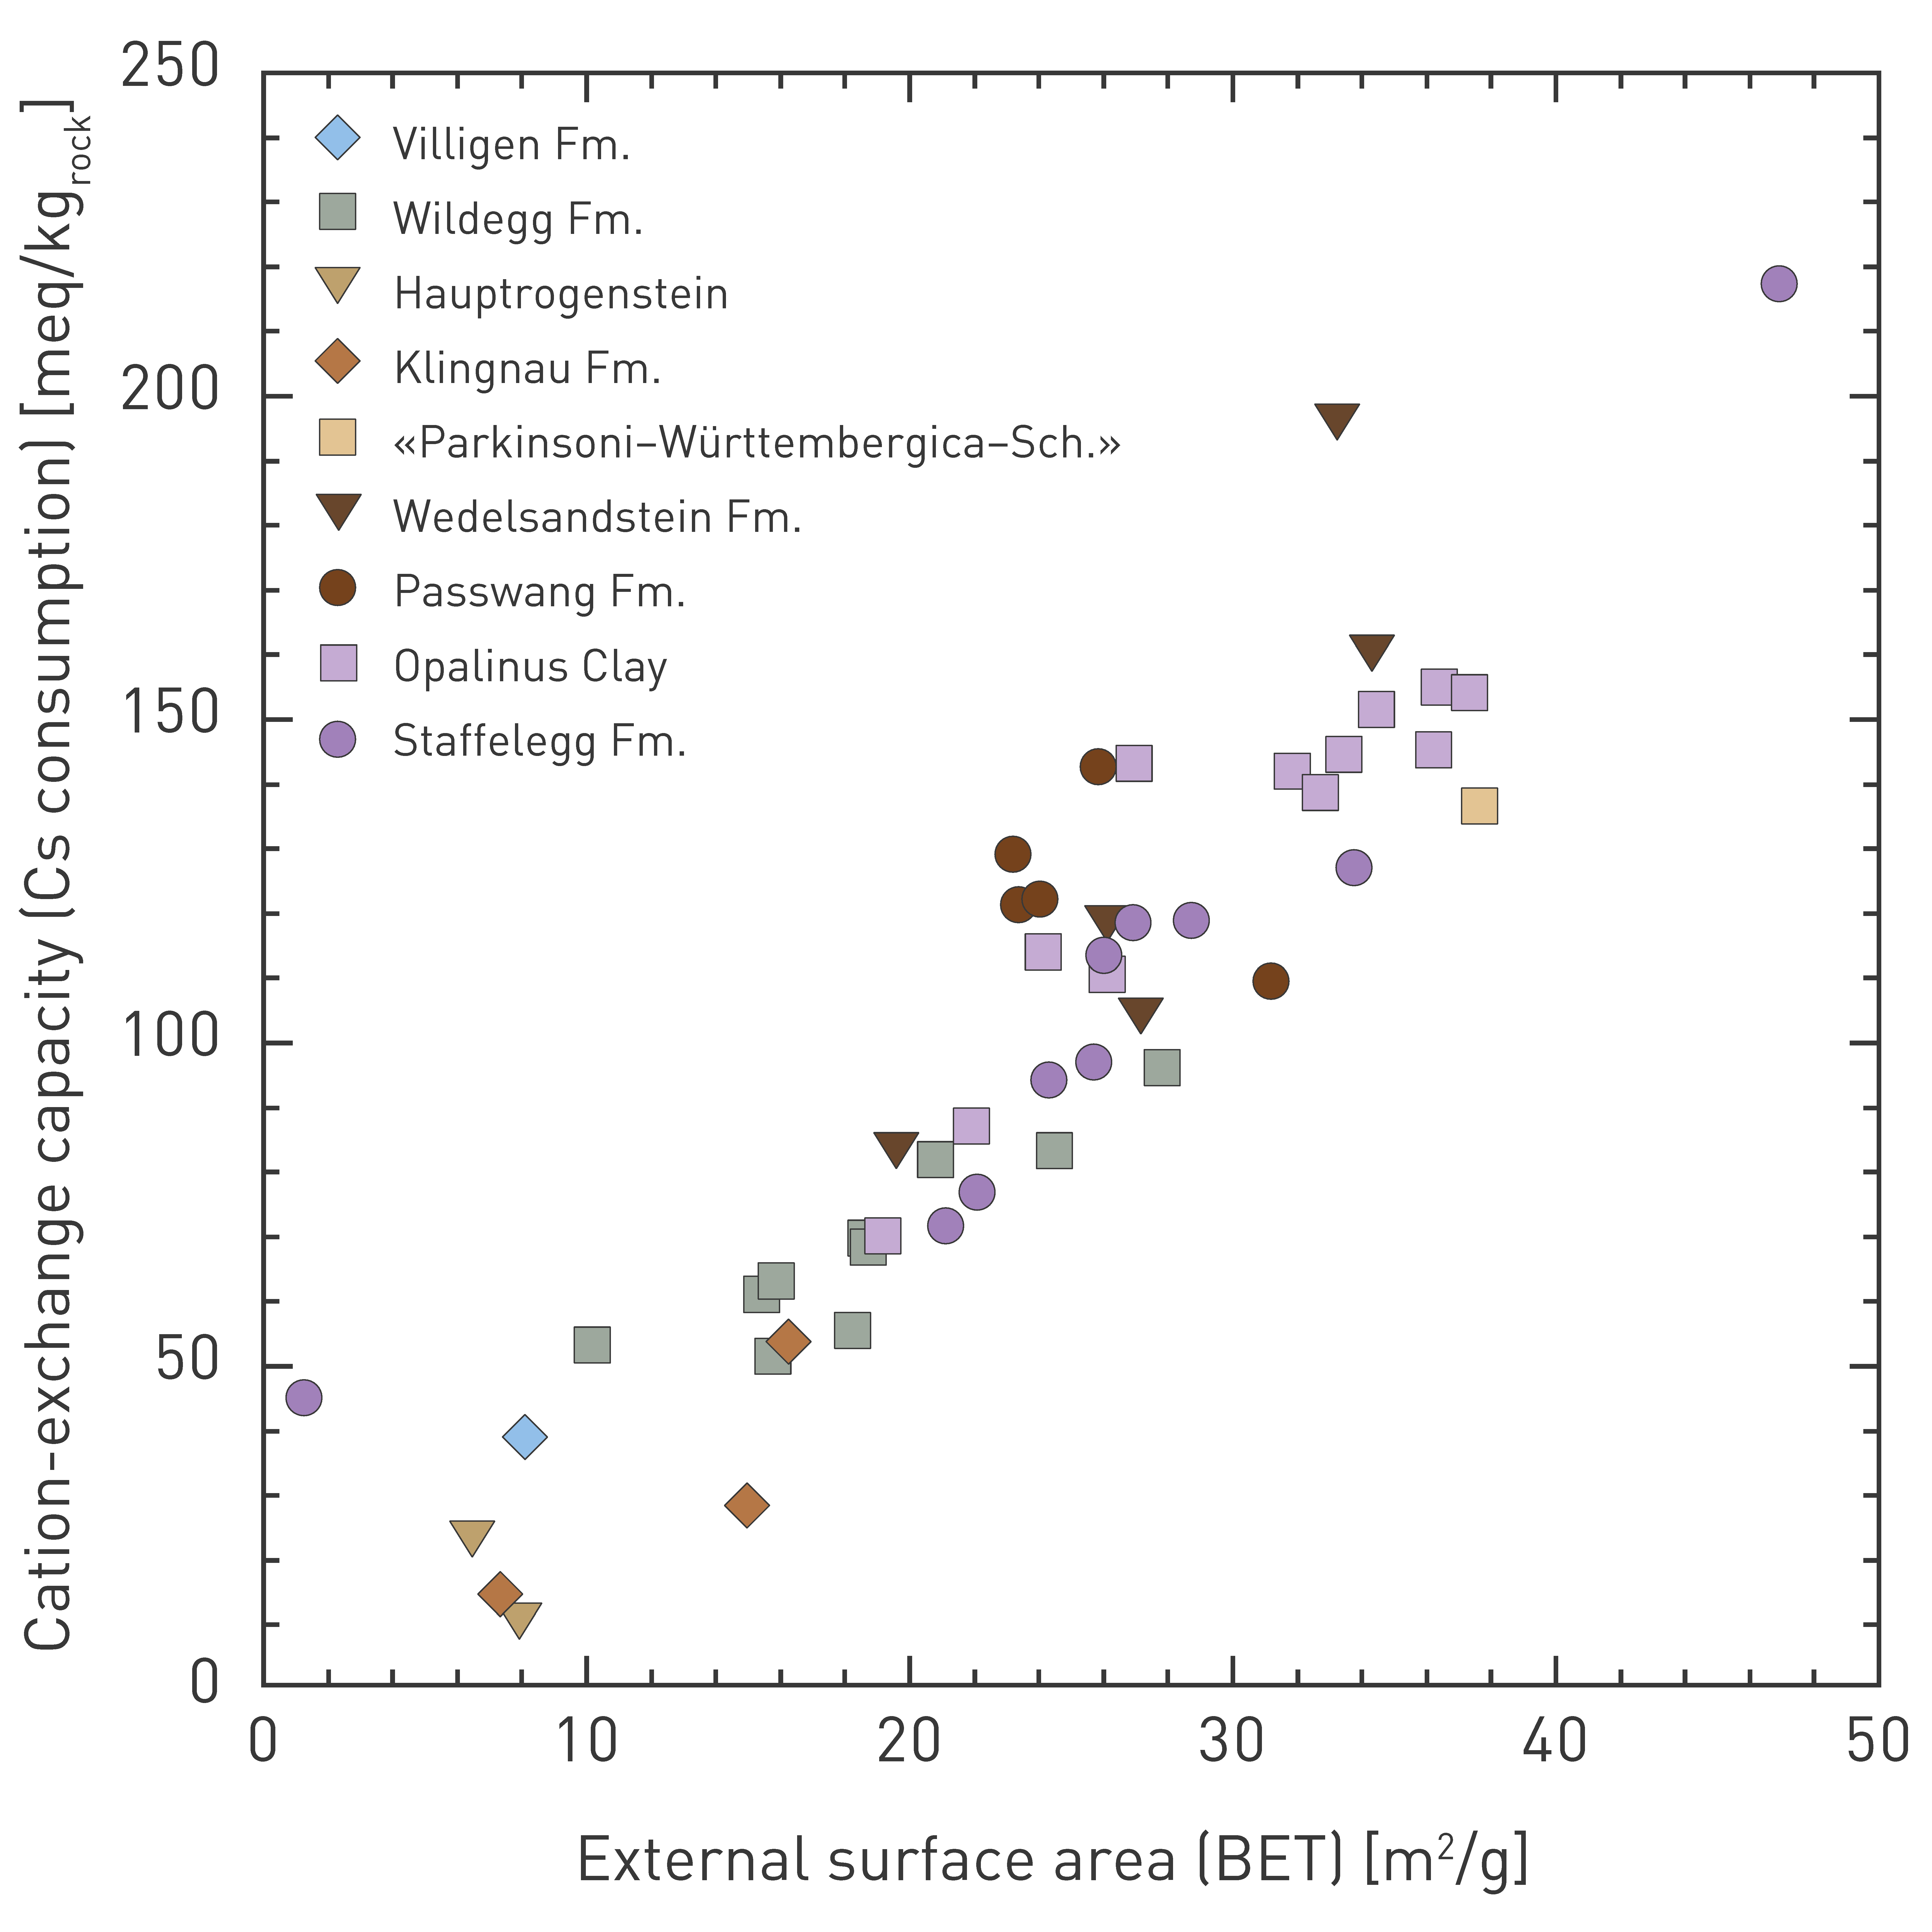
Fig. 5‑16:Correlation between external surface area and cation-exchange capacity based on Cs consumption
Only data for the Jurassic profile are shown. Cs data from Baeyens & Fernandes (2022). BET: see explanations in Fig. 5‑15.