
Reference porewaters used for safety assessment are commonly defined at standard temperature and pressure conditions (i.e. 25 °C, 1 bar). Thus, porewater chemistry data obtained from laboratory experiments at room temperature closely reflect such conditions. In-situ temperatures and hydrostatic pressures of the Opalinus Clay porewater, however, are higher, and may reach up to 50 °C and 90 bar, depending on the location and depth of the repository.
Thermodynamic equilibria are rather insensitive to temperature in the range of interest (in-situ temperature 30 – 50 °C) as indicated by both experimental and modelling studies from the French programme (Beaucaire et al. 2012, Gailhanou et al. 2017) and modelling of the Opalinus Clay porewaters (Wersin et al. 2020, Mäder & Wersin 2023). An example of a modelling exercise is illustrated in Fig. 5‑20 in which the effect of temperature on the reference porewater composition (Mäder & Wersin 2023) is shown in the range of 25 – 80 °C. The main aqueous components Na, Ca, Mg, Cl and SO4 show very little change within this temperature range. The largest change is indicated for pH and pCO2, which is because of the change in CO2 solubility and the dissociation constant of H2O with temperature. Thus, pH is shifted to about 0.5 units lower values when passing from 25 to 50 °C.
The effect of pressure on the Opalinus Clay porewater composition has also been evaluated by thermodynamic modelling (Wersin et al. 2020). In these calculations, it was shown that an increase in pressure up to 90 bars results in only very minor changes in the composition in spite of the higher solubility ofCO2.
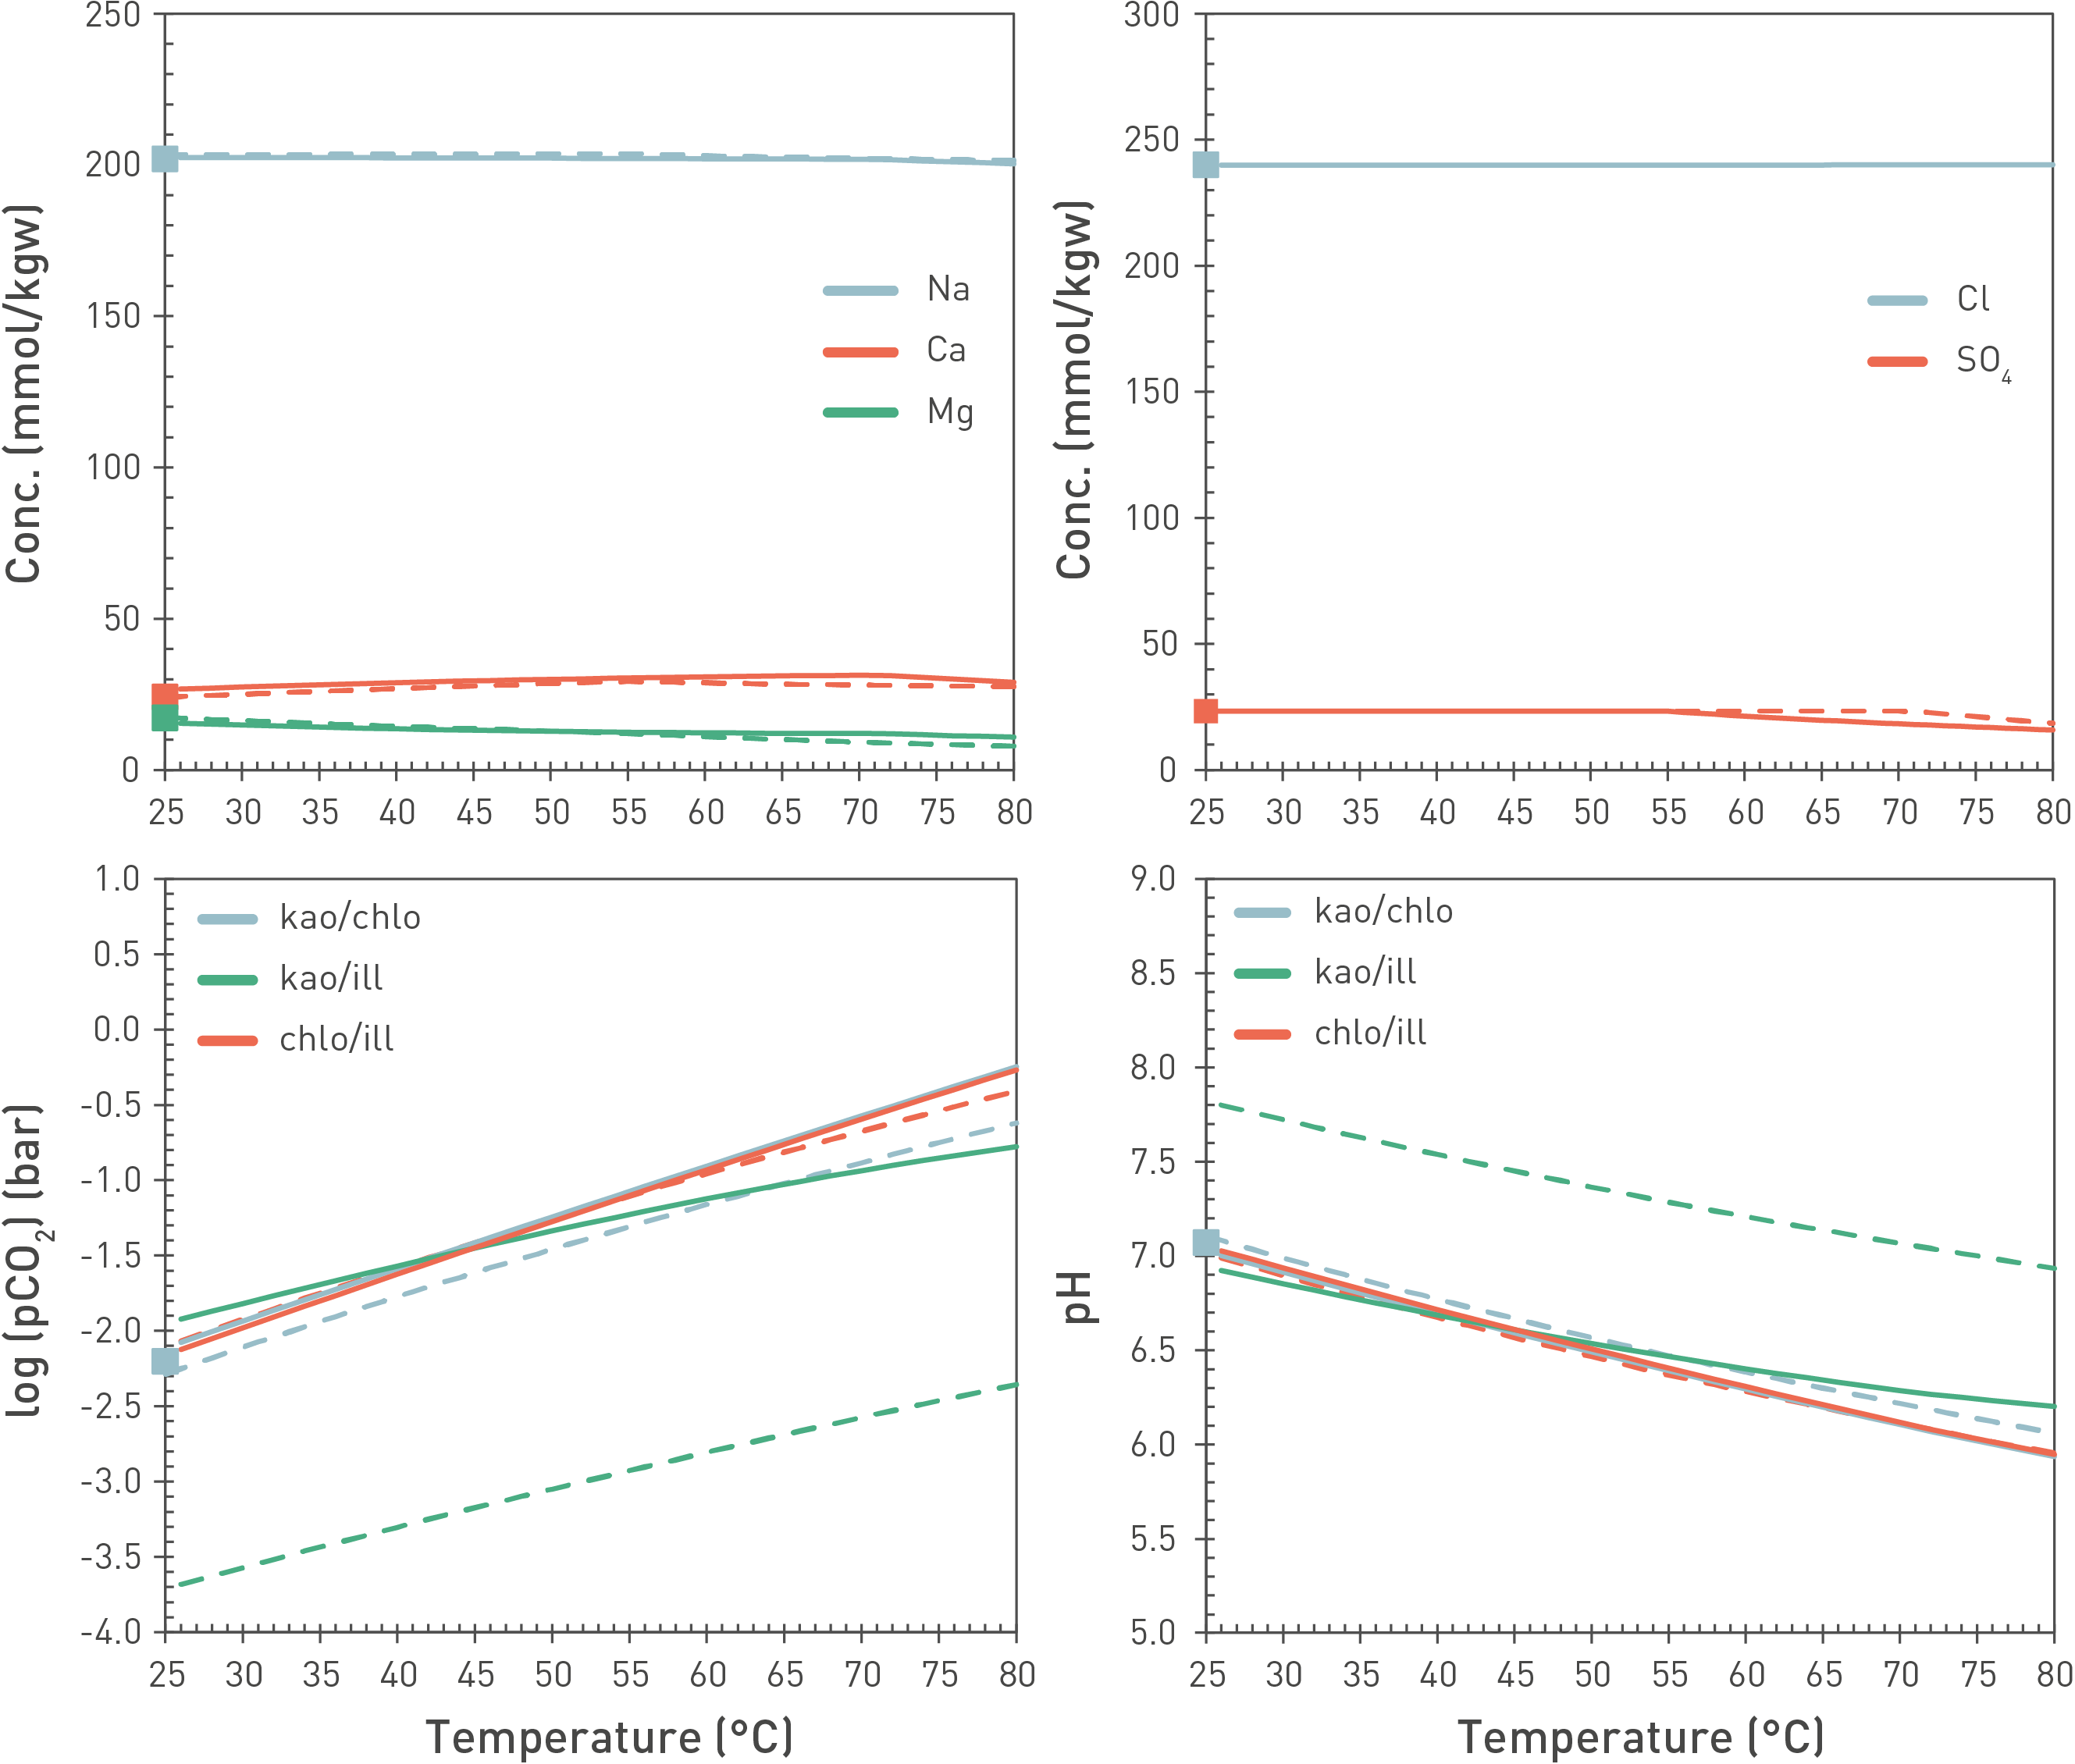
Fig. 5‑20:Modelled concentrations of main porewater components (upper panel) as well as log(pCO2) (bar) and pH (lower panel) as a function of temperature using an alternative porewater model including clay mineral phases (curves)
Squares allow comparison to the reference model (25 °C, fixed pCO2 = 10-2.2 bar; Mäder & Wersin 2023).
Model runs performed for three different sets of clay-mineral equilibria: kaolinite/chlorite, kaolinite/illite, chlorite/illite. Solid lines: The PSI Thermodynamic Database (Hummel & Thoenen 2023), dashed lines: ThermoChimie (Giffaut et al. 2014, Rodriguez et al. 2022). Both databases indicate very similar results in ion composition but some differences regarding simulated pH/pCO2. The latter point is related to different thermodynamic data of clay minerals used in the two databases.