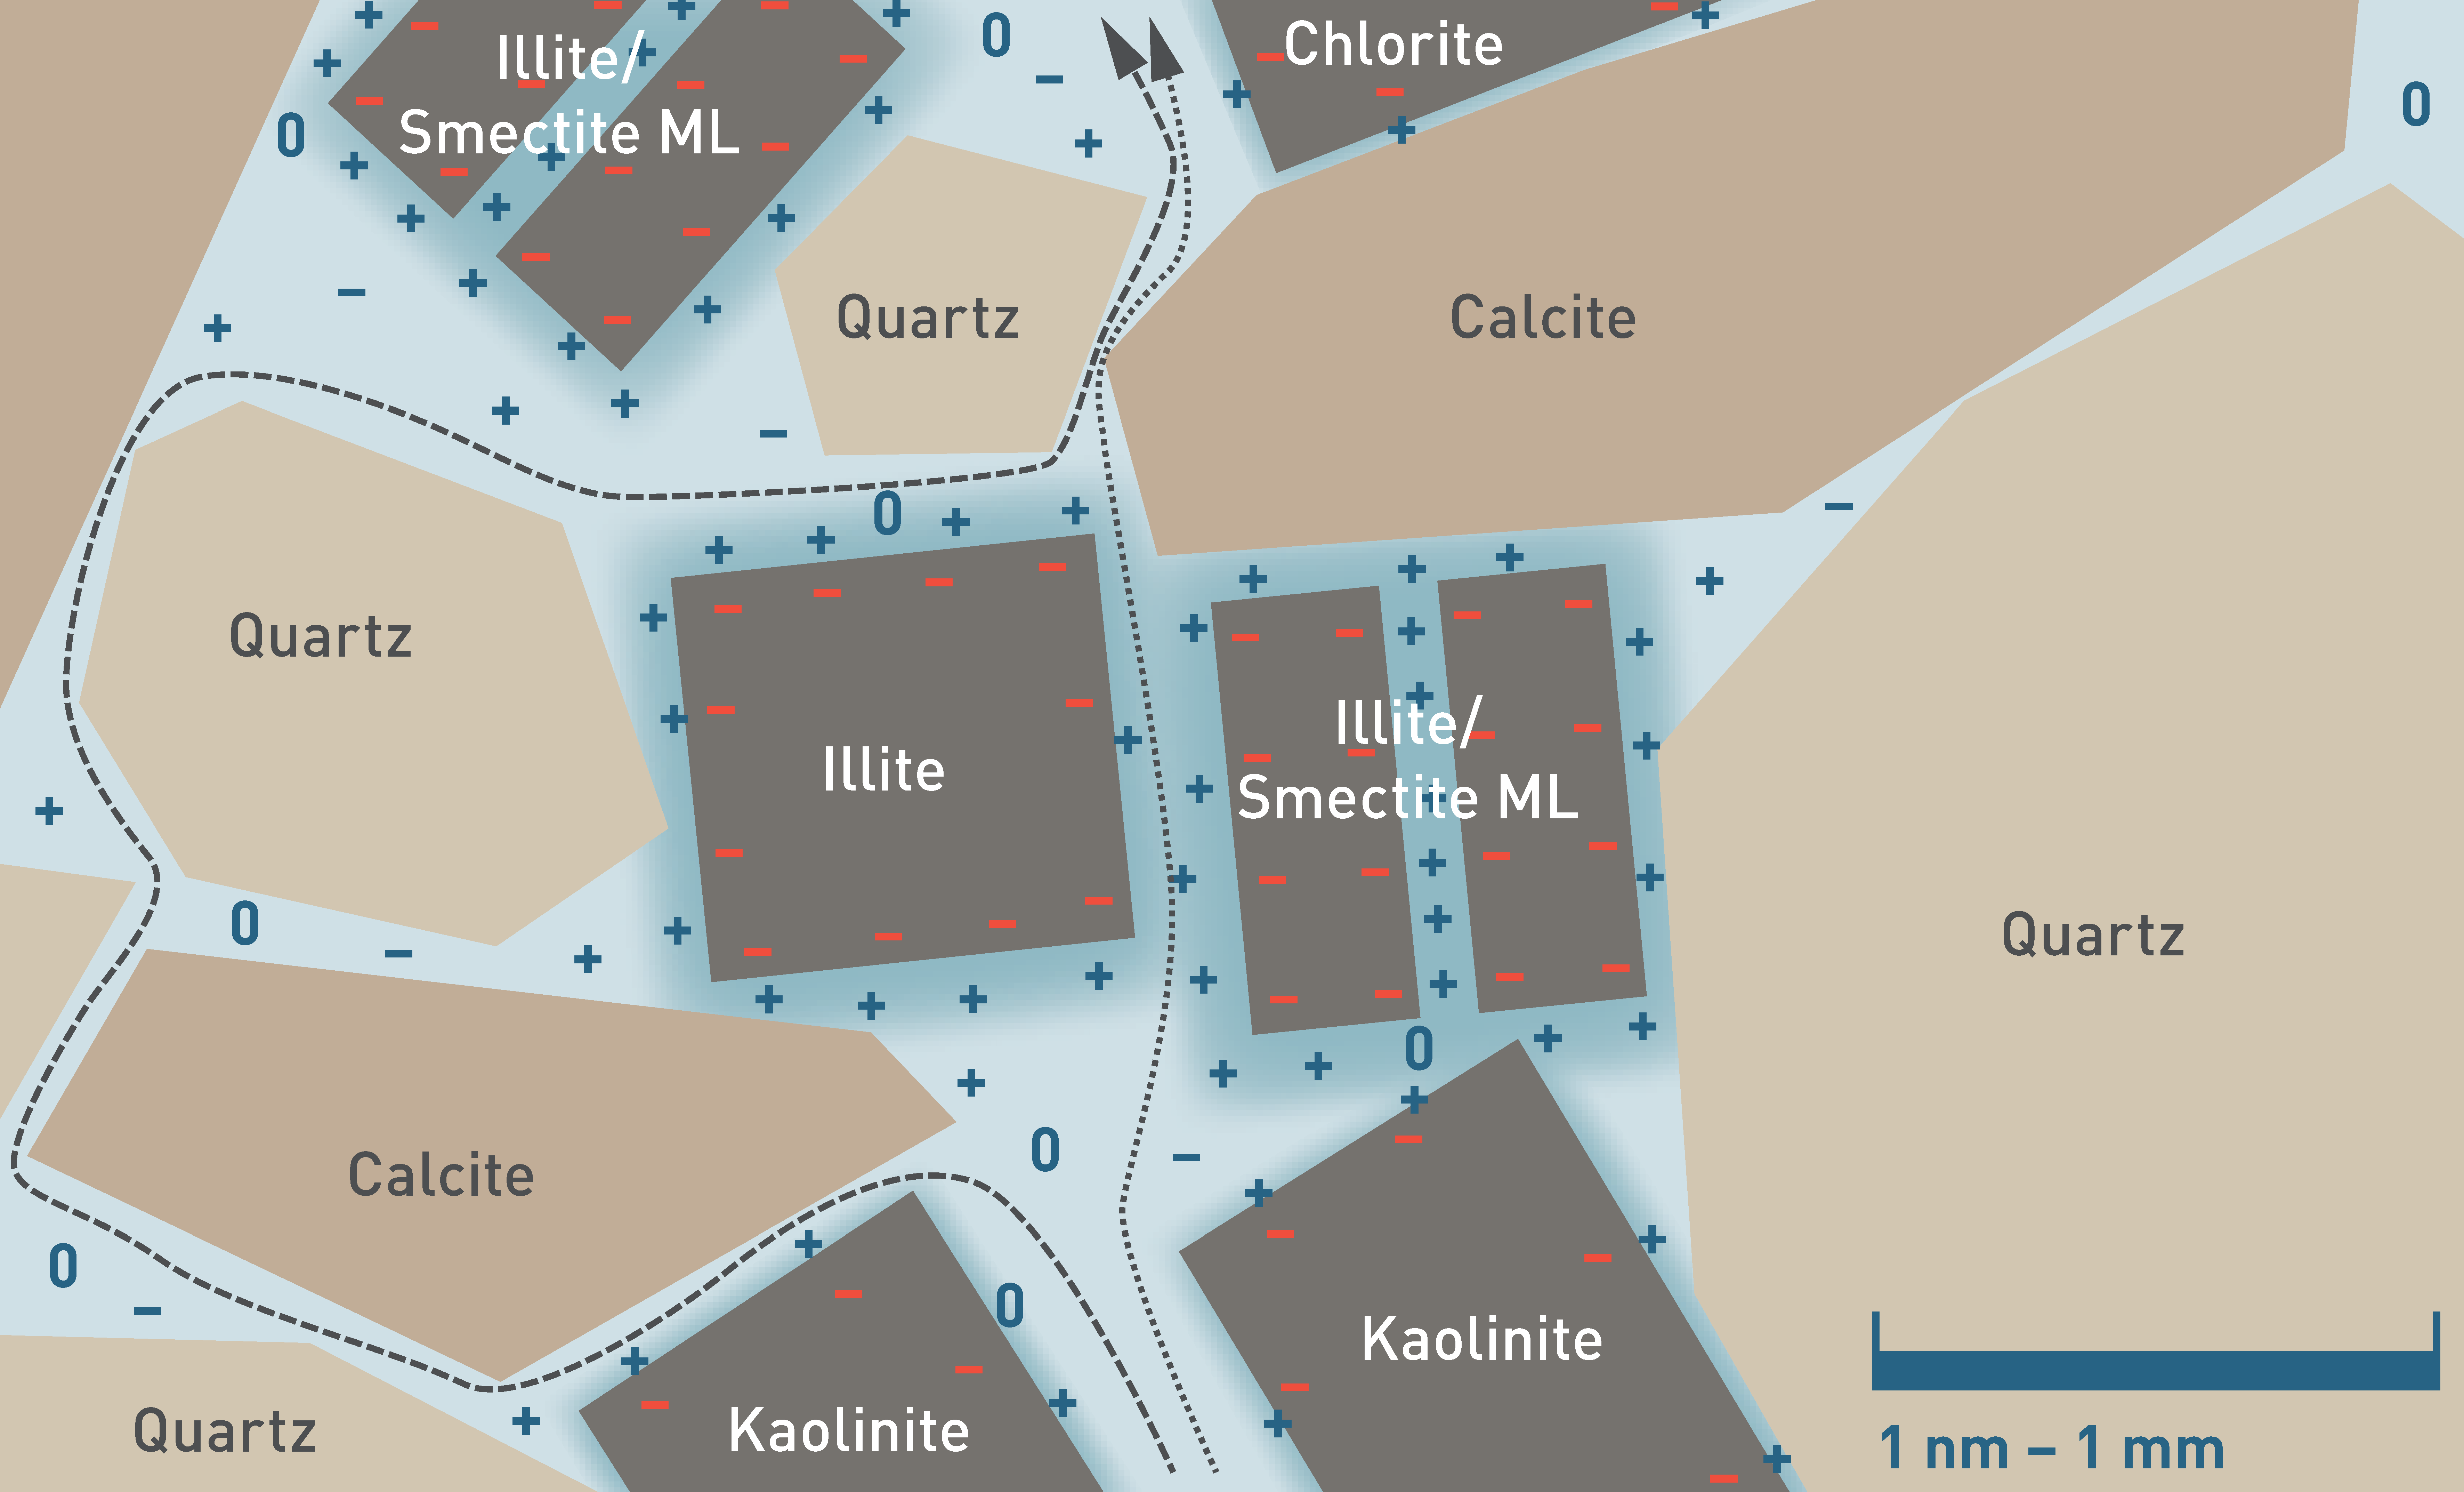
The pore space of clay-rich rocks has a nanometric architecture (see also Mazurek et al. 2023a), with clay-mineral grain and interlayer surfaces representing a substantial part of the water – mineral contact (Fig. 5‑17). These surfaces interact with the solutes of the porewater. Most of these clay-mineral surfaces are negatively charged, which leads to the repulsion of anions and to the attraction of cations that balance the surface charge. In contrast, the electrostatic force does not affect neutral species. Generally, the concentration of anions increases with increasing distance to the negatively charged surface until, at a certain distance, a charge-balanced electrolyte solution persists, which is often termed free porewater (Bresler 1973, Tournassat & Steefel 2021) (white in Fig. 5‑17). The spatial distribution of the ions in the remaining fraction of the porewater affected by charged surfaces (blue in Fig. 5‑17) is complex and depends on various parameters, such as the charge of the ion itself, the charge density of the clay surfaces (electrostatic potential), the ionic strength of the free porewater and the microstructure (e.g. Tournassat & Steefel 2019, 2021, Wigger 2017, Appelo et al. 2010). This anion-depleted porosity may constitute a large fraction of the total porosity, such that a significant portion of the pore space is barely accessible to anions (Pearson 1999).

Fig. 5‑17:Conceptual model of anion-accessible porosity (white), anion-depleted porosity (blue), cations, anions, neutral species (+, -, 0, in dark blue) and the negative charge on clay mineral surfaces (red)
Model is not to scale. To illustrate the effect on transport, the dashed line indicates a hypothetical diffusion path of an anion and the dotted line for a neutral species, respectively. Note that the schematic abstraction covers a range of scales, given the fact that the bound, anion-depleted water layer has a thickness in the order of 1 nm, while the grain size of calcite and quartz is more likely in the range of µm to mm.
Diffusive transport is further explained in Section 5.8.
Profiles of anion concentrations across clay-rich lithologies contribute to the understanding and quantification of diffusive transport between clay-rich formations and the bounding aquifers (Section 4.6.3) but require the concentrations in the free porewater for obtaining local concentration gradient and the computation of solute-mineral equilibria. In order to scale the concentrations of anionic tracers determined for the bulk porewater (blue and white zones in Fig. 5‑17) to the free porewater concentration, a scaling factor termed anion-accessible porosity fraction (fa) is required. This factor accounts for the overall anion depletion present in the rock. It can be approximated as the ratio of the anion concentration in the bulk porewater determined by aqueous extraction divided by the concentration in the free porewater obtained by advective displacement (AD), high pressure squeezing (SQ) or borehole sampling (Zwahlen et al. 2024, Wersin et al. 2020). Alternatively, fa can be inferred from species-specific porosities obtained from through-diffusion experiments, e.g. for 36Cl and HTO (Van Loon et al. 2023).
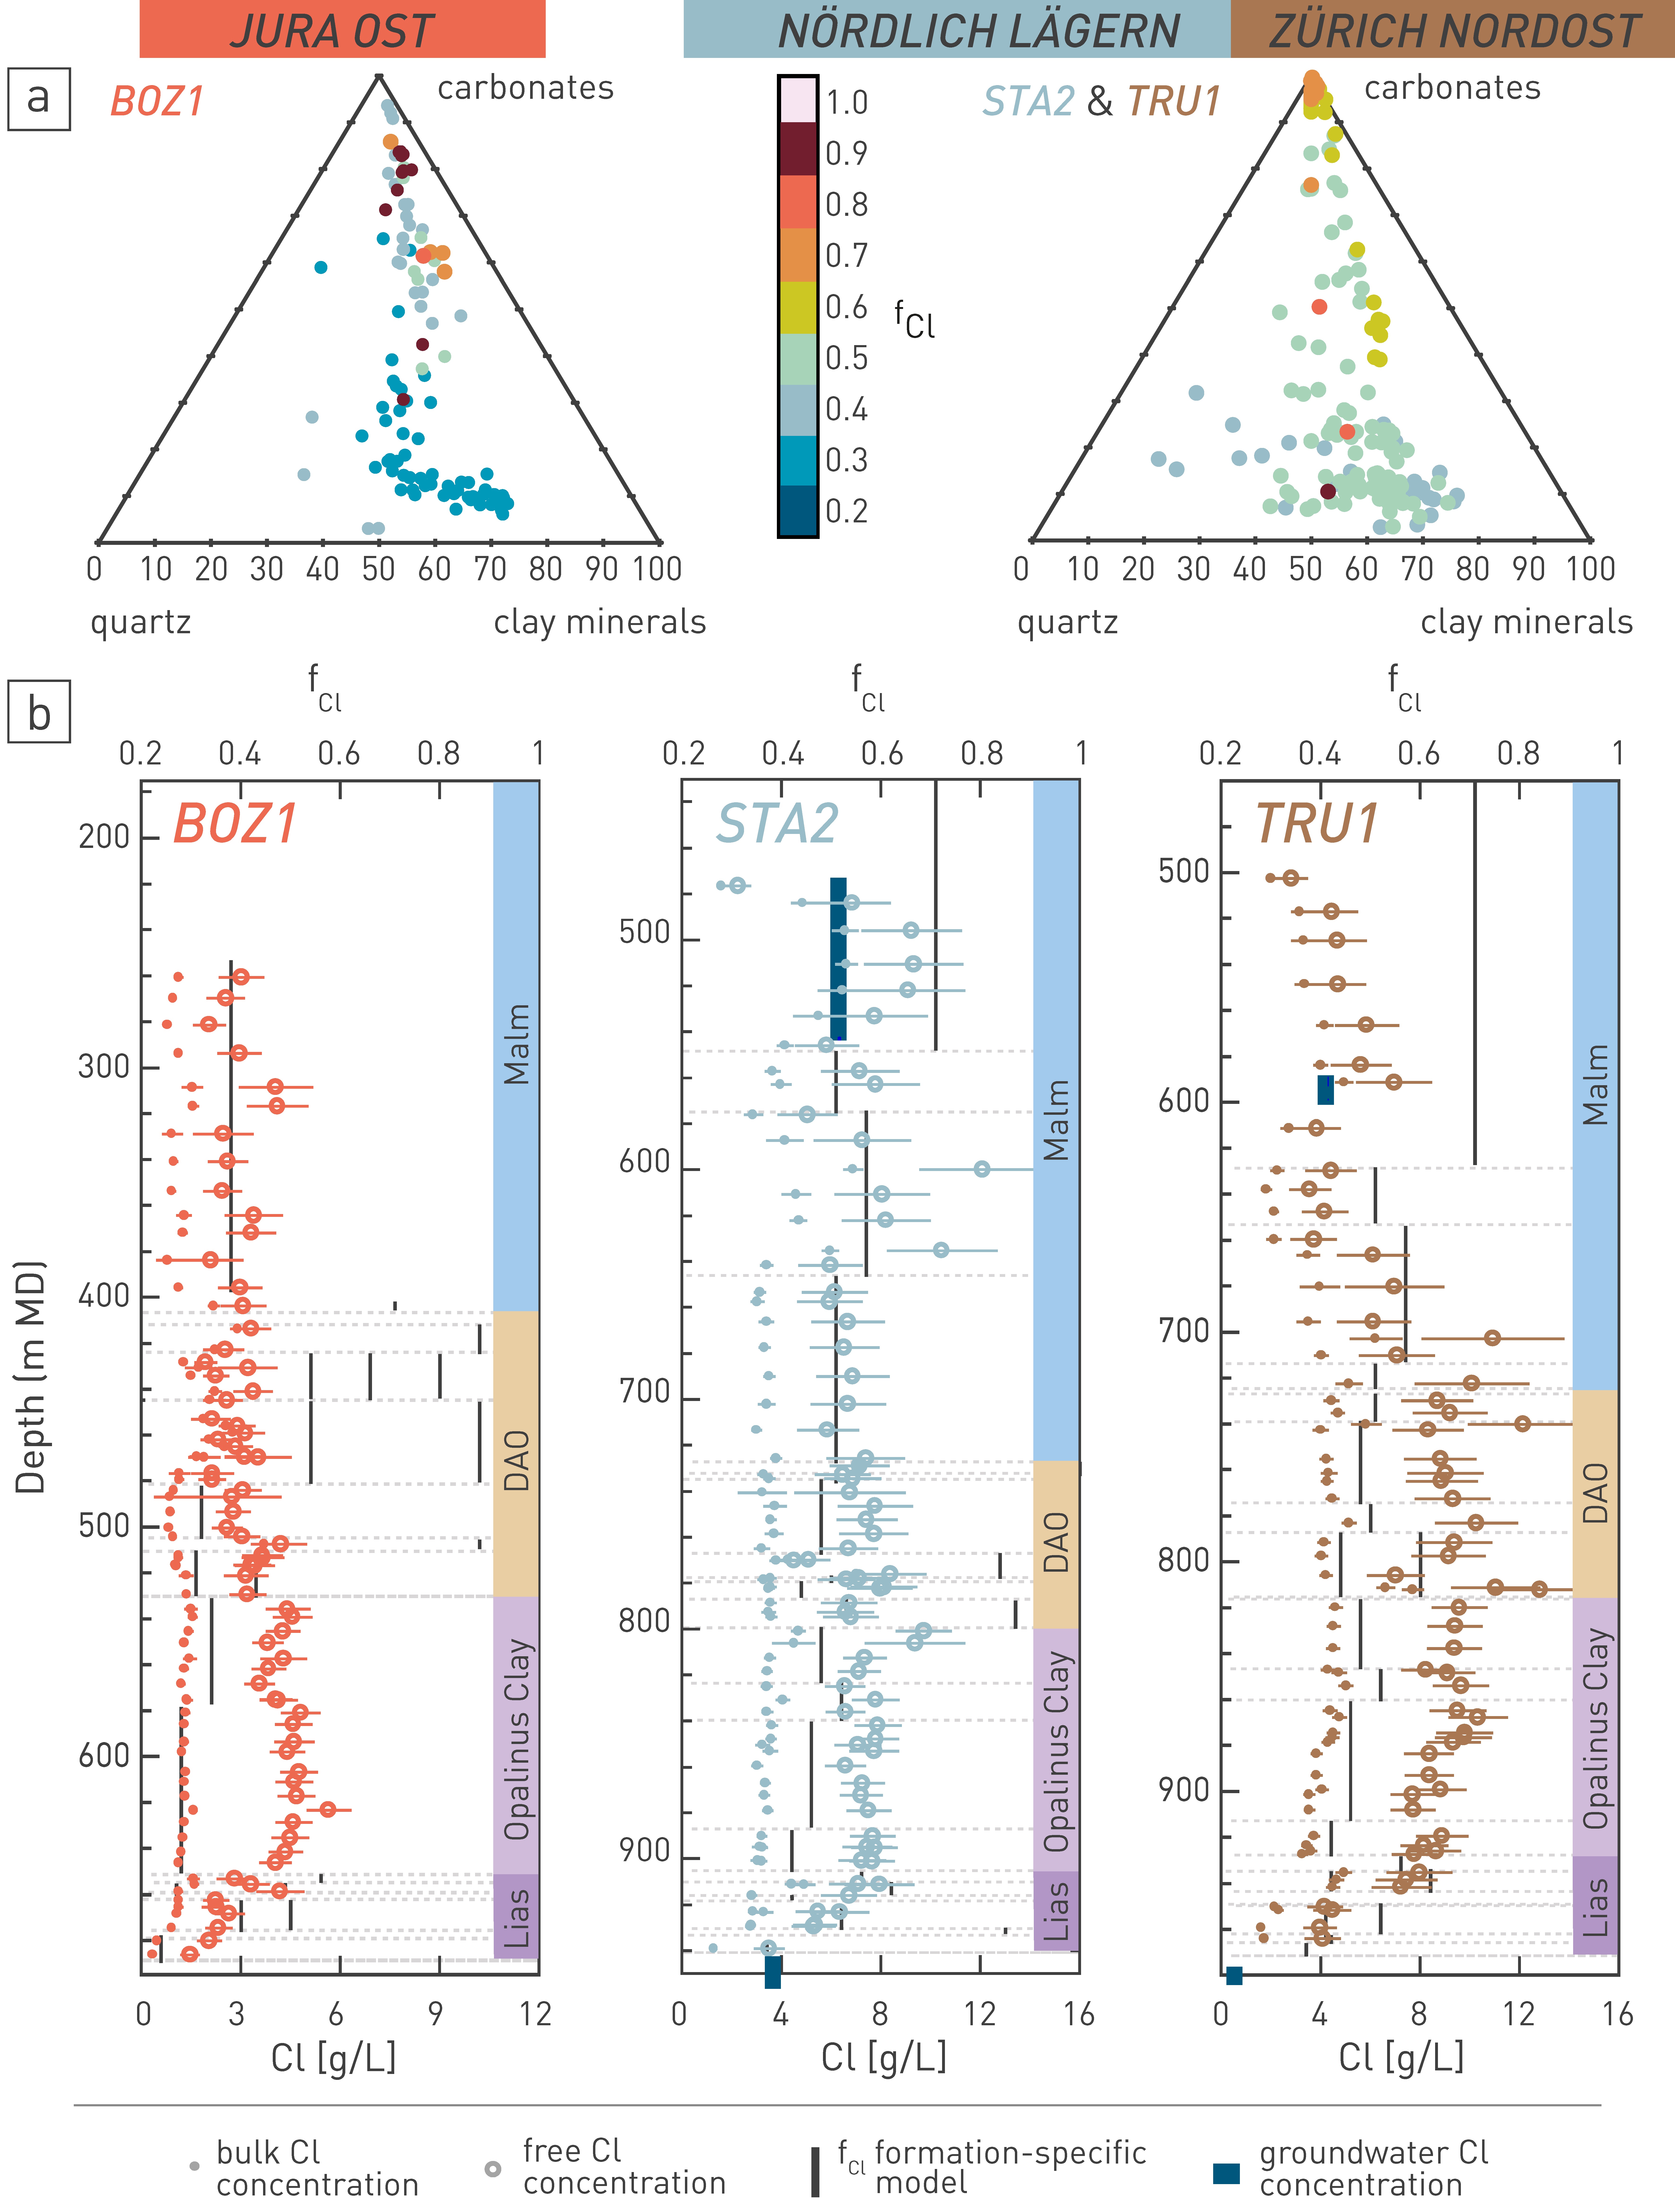
Zwahlen et al. (2024) compiled a large dataset of experimentally derived chloride-accessible porosity fractions (fCl) for the sedimentary sequence in the three siting regions. Two empirical models for extrapolating the experimental fCl values of the entire profiles were tested. The first model is based on the clay-mineral content of the rock (e.g. Wersin et al. 2013, 2016, Mäder & Wersin 2023) while the second model considers formation-specific averages of the experimental data. In heterogeneous formations, several formation-specific averages are calculated based on mineralogical constraints. Both models present two different sets of fCl values, one for JO and one for ZNO & NL, because of the differences in ionic strength of the free porewater (Fig. 5‑18a). The second model was found to be more suitable because of the impact of the rock texture on the extent of anion exclusion, in particular evident for lithologies with a low clay-mineral content. The comparison of these models underlines that clay-mineral content is an important, but not the only, factor that determines anion accessibility in the pore space. For the Opalinus Clay, the recommended fCl values in JO range from 0.28 to 0.34 and in NL and ZNO from 0.42 to 0.52. Examples of scaled Cl profiles as obtained from measured bulk Cl concentrations and the formation-specific fCl values are detailed in Fig. 5‑18b.

Fig. 5‑18:Chloride-accessible porosity fraction (fCl)
a) Mineralogical composition and fCl values of samples from JO (BOZ1), NL (STA2) and ZNO (TRU1) in the left and right triangle, respectively. b) Formation-specific fCl values (black lines) used to scale bulk Cl concentrations (filled circles) derived by aqueous extraction to free porewater Cl concentrations (hollow circles).

