
In this section, the sedimentological and stratigraphic evolution of the study area for selected units is interpreted with respect to changing tectonic and climatic conditions and associated processes such as sea-level variations and ocean currents. The geological conditions of the investigated area during the Permo-Carboniferous, following the Variscan orogenesis, were dominated by regional crustal extension and erosion (refer also to Chapter 3 for further context). The troughs were filled with fine- to coarse-grained sediments in a terrestrial depositional environment under mostly arid and partly humid climate conditions. During the Mesozoic, the break-up of Pangaea and the opening of the North Atlantic Ocean and the Piemont – Liguria Ocean led to extension-dominated tectonics in Northern Switzerland. Accommodation space for sediments was created by subsidence in the Central European Basin. In a shallow marine epicontinental sea to partly terrestrial setting, 800 to 900 m10 of predominantly argillaceous to calcareous sediments were deposited under subtropical climate conditions (Fig. 4‑2). The characteristics of the specific depositional environments (Fig. 4‑3) and later diagenesis of the sediments deposited in the study area have determined many of their fundamental barrier properties (e.g. lithology and the vertical as well as lateral variability). The spatial and temporal characteristics of the sedimentary processes and the resulting rock units furthermore provide the basis for a better understanding of the similarities and differences between the siting regions (Fig. 4‑4, Fig. 4‑5, Fig. 4‑6).
This section is divided into further subsections arranged from older to younger selected lithostratigraphic units. The Opalinus Clay and its confining units below and above are especially emphasised because of their importance as the host rock and barriers of the repository system. Additionally, the regional Muschelkalk and Malm aquifers are discussed. The sections are divided into the following paragraphs: introduction, facies and lithostratigraphy, variability, chronology, and depositional evolution. Interpreted timelines are given as red dashed lines in this section (e.g. Fig. 4‑2). Information on the other lithostratigraphic units below and above the regional Muschelkalk and Malm aquifers can be found in Chapter 3 and the literature cited therein.
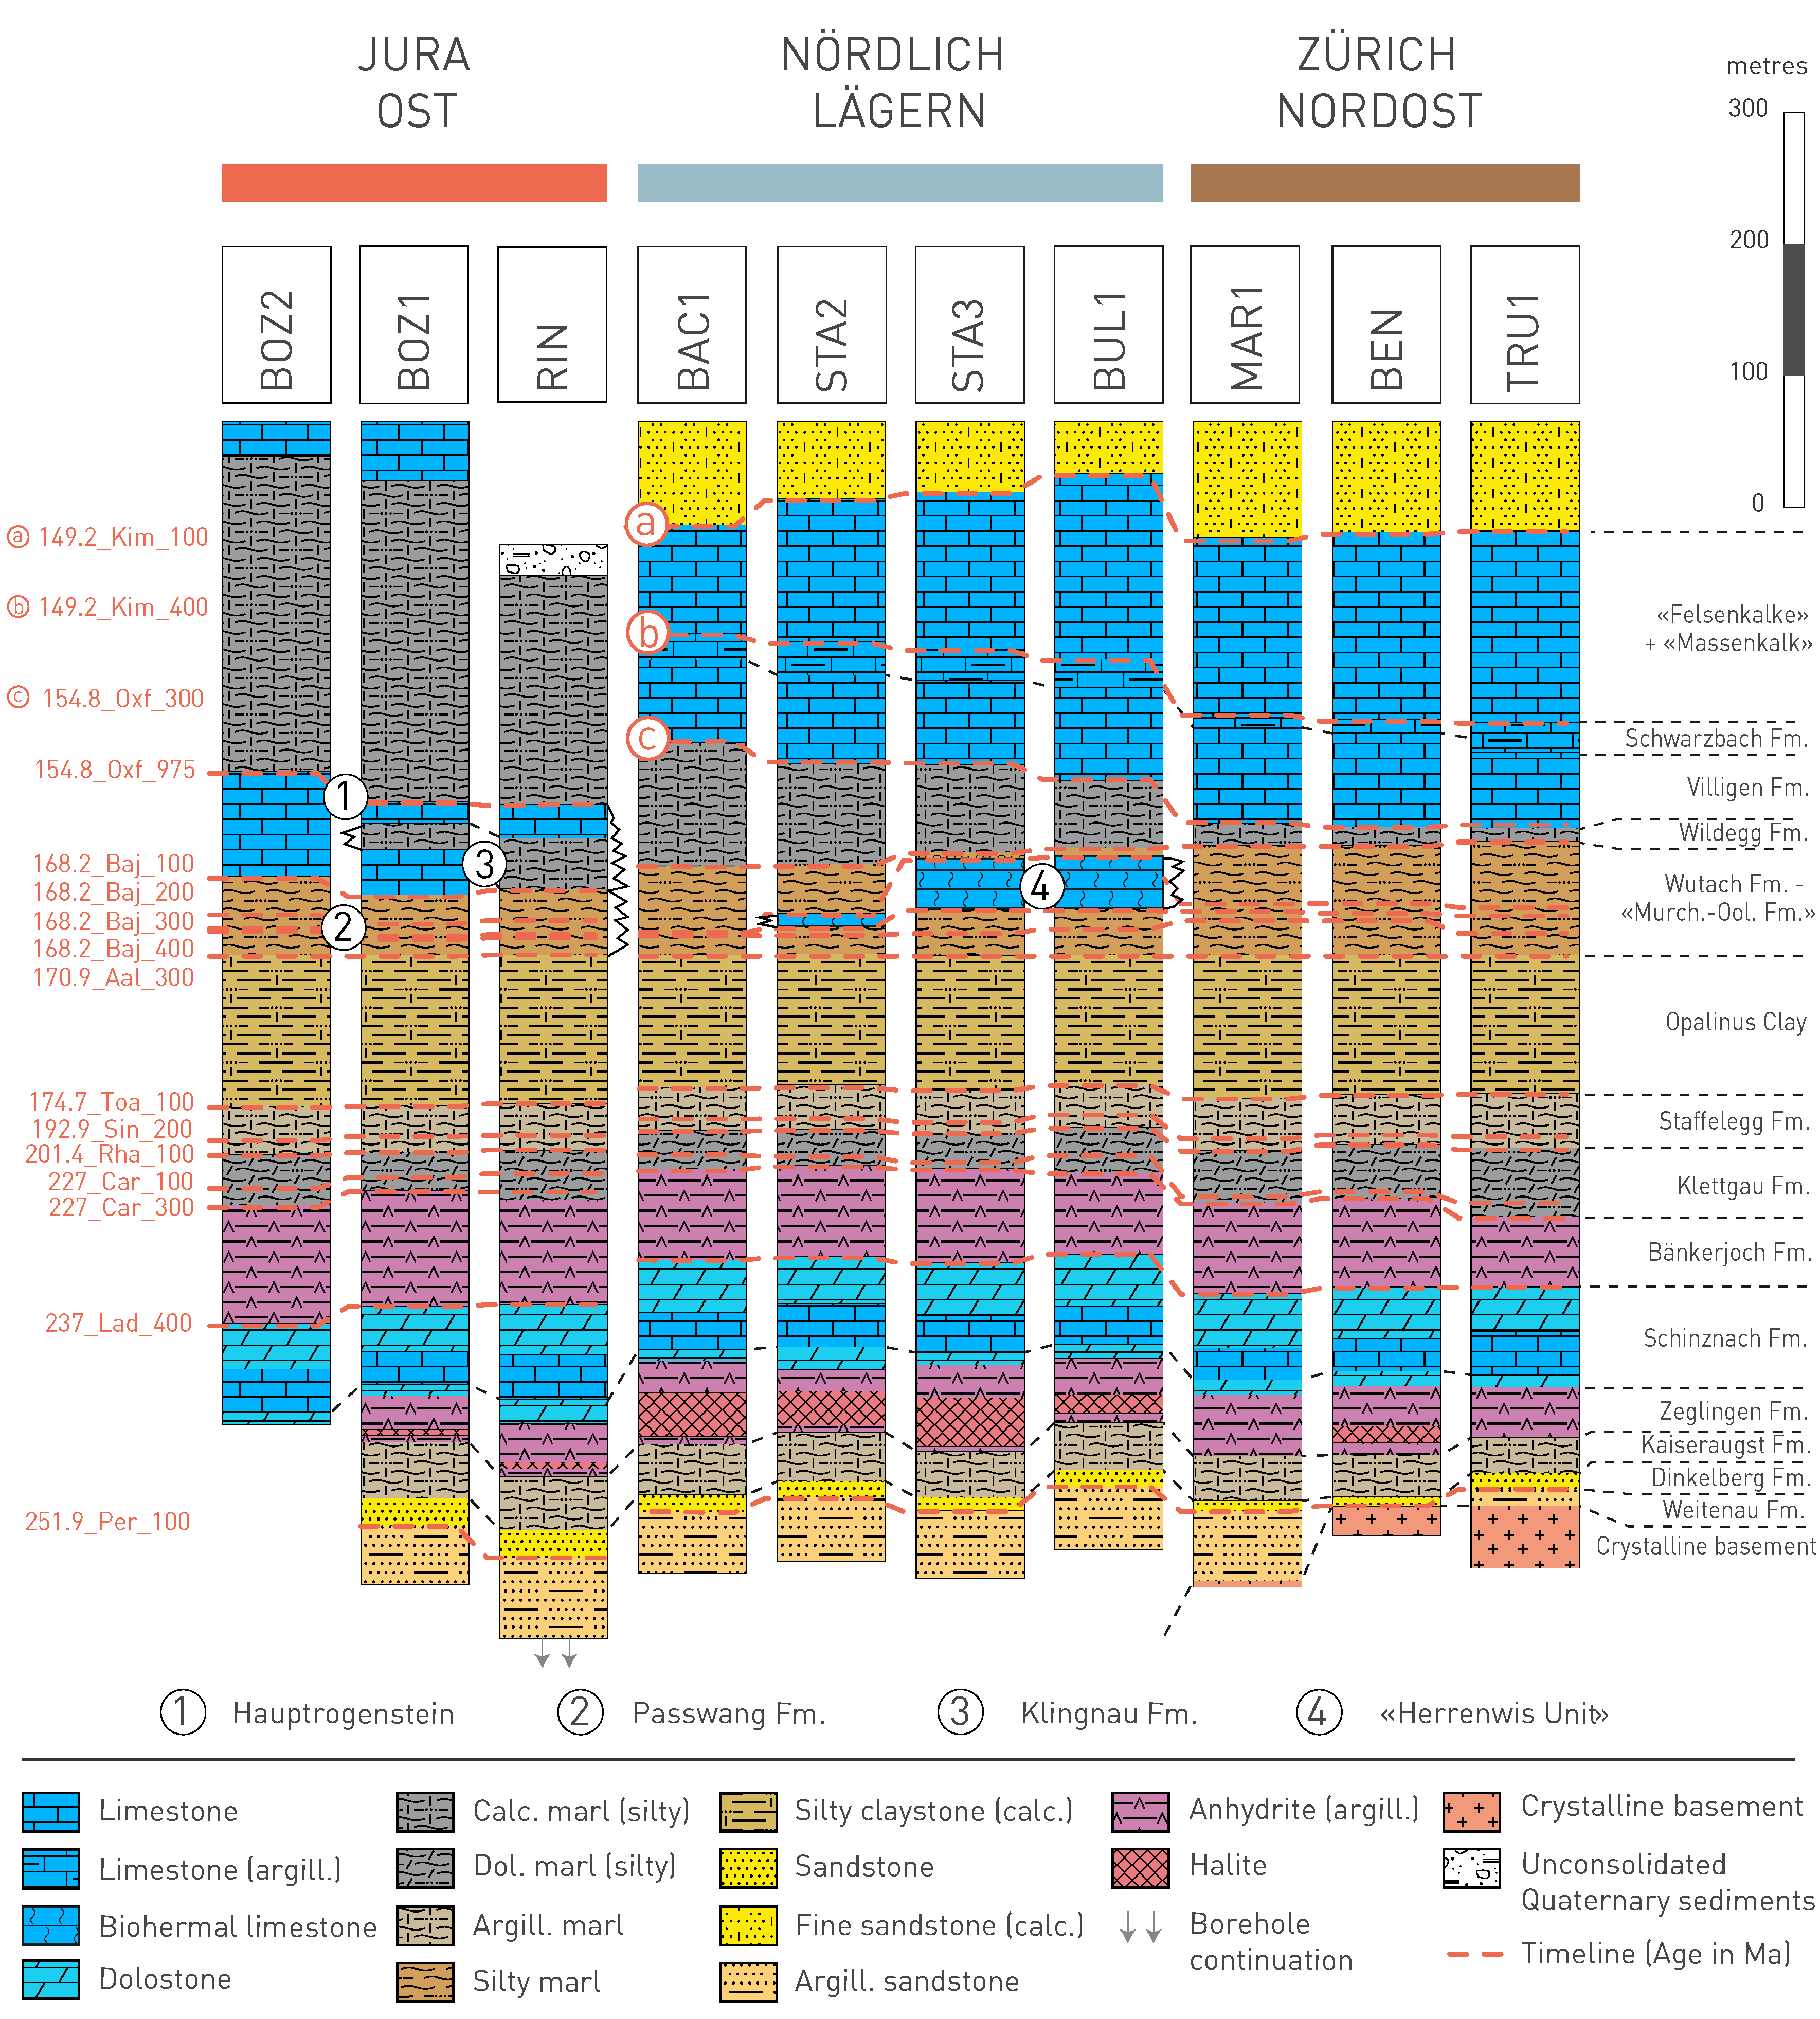
Fig. 4‑2:Lithological overview correlation with the focus on Mesozoic sedimentary rocks of the three siting regions
Boreholes are aligned to Top Opalinus Clay. Simplified lithological legend according to Naef et al. (2019). Black dashed lines indicate lithostratigraphic boundaries. Red dashed lines indicate timelines. Their names consist of three elements (e.g. 170.9_Aal_300): 1) start age of the corresponding chronostratigraphic stage (International Chronostratigraphic Chart, v 2022/10, e.g. 170.9 Ma for start of the Aalenian), 2) name of corresponding chronostratigraphic stage and 3) three-digit number. The given age in the name should therefore not be understood as depositional age but rather as a general temporal orientation based on the corresponding chronostratigraphic stage. The temporal resolution or number of timelines was chosen regarding potential horizons in seismic interpretation and for a basic stratigraphic analysis. Therefore, many more timelines could be identified, and the three-digit numbers are not sequential but were chosen to enable later additional picking of lines without changing the numbering scheme.
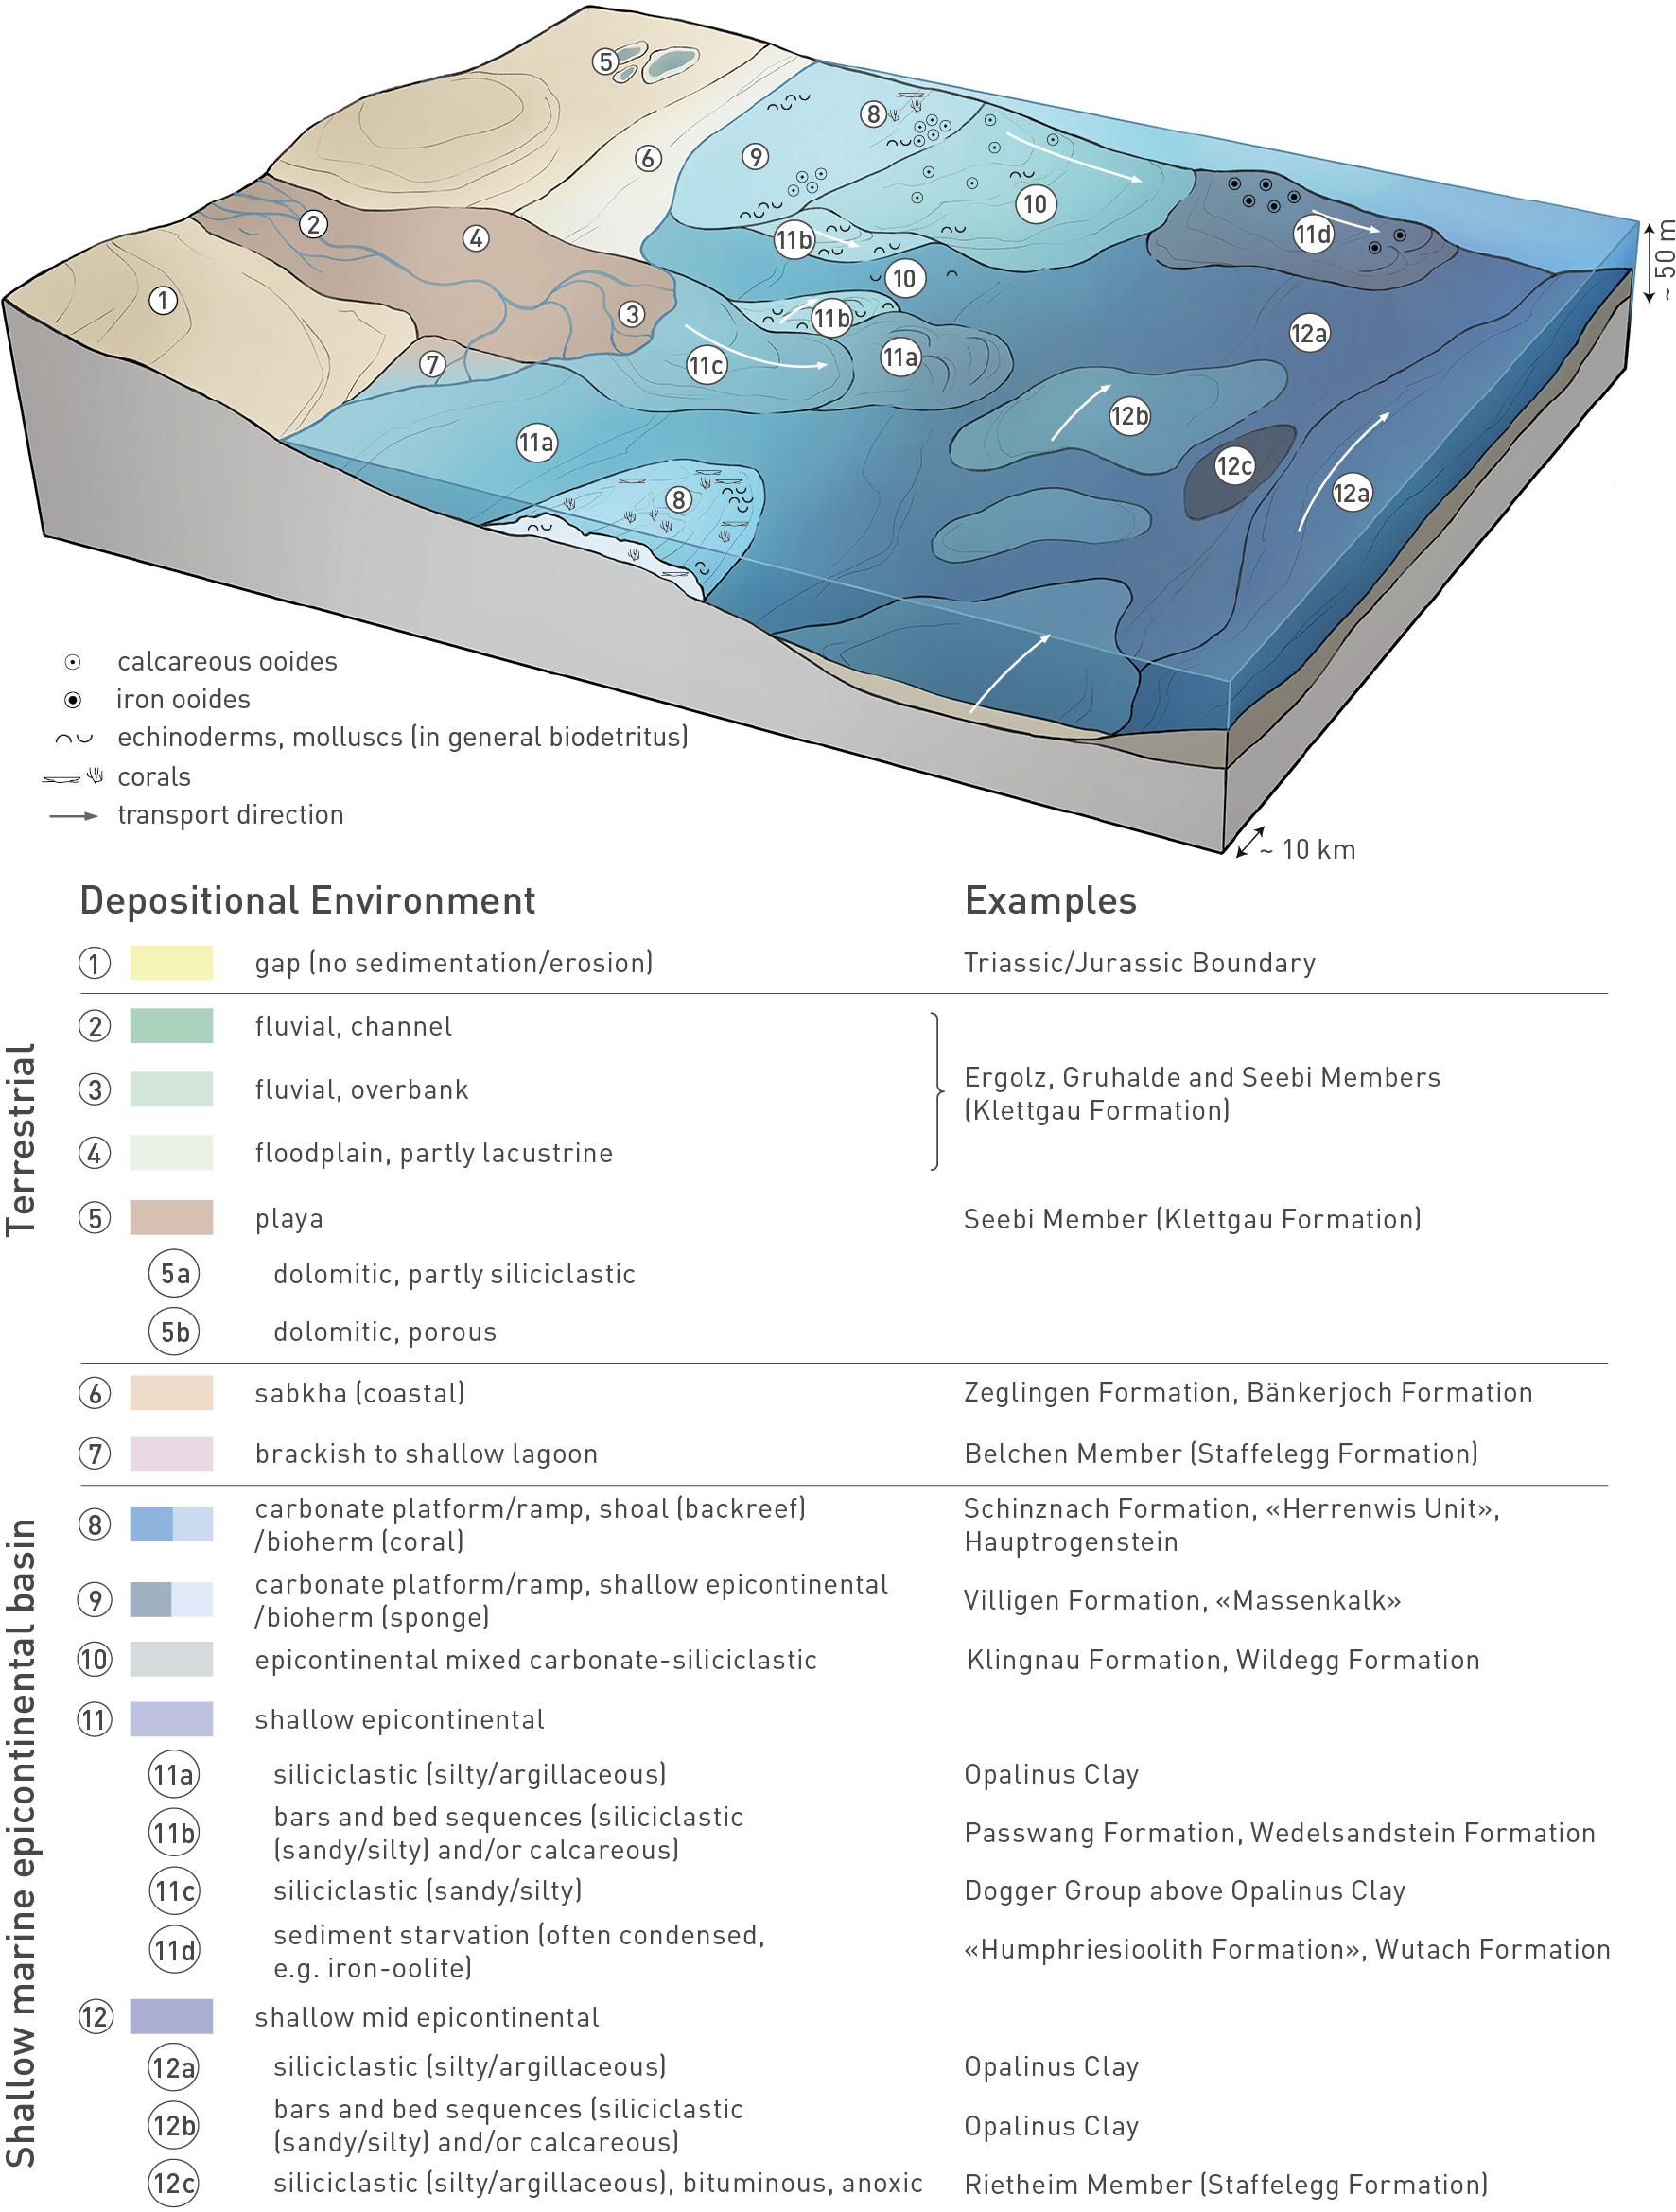
Fig. 4‑3:Schematic representation of depositional environments of Mesozoic sedimentary rocks in Northern Switzerland
This sketch conceptually summarises the main characteristics of depositional environments and serves as an orientation for the respective maps below. Note that the sketch is strongly vertically exaggerated.
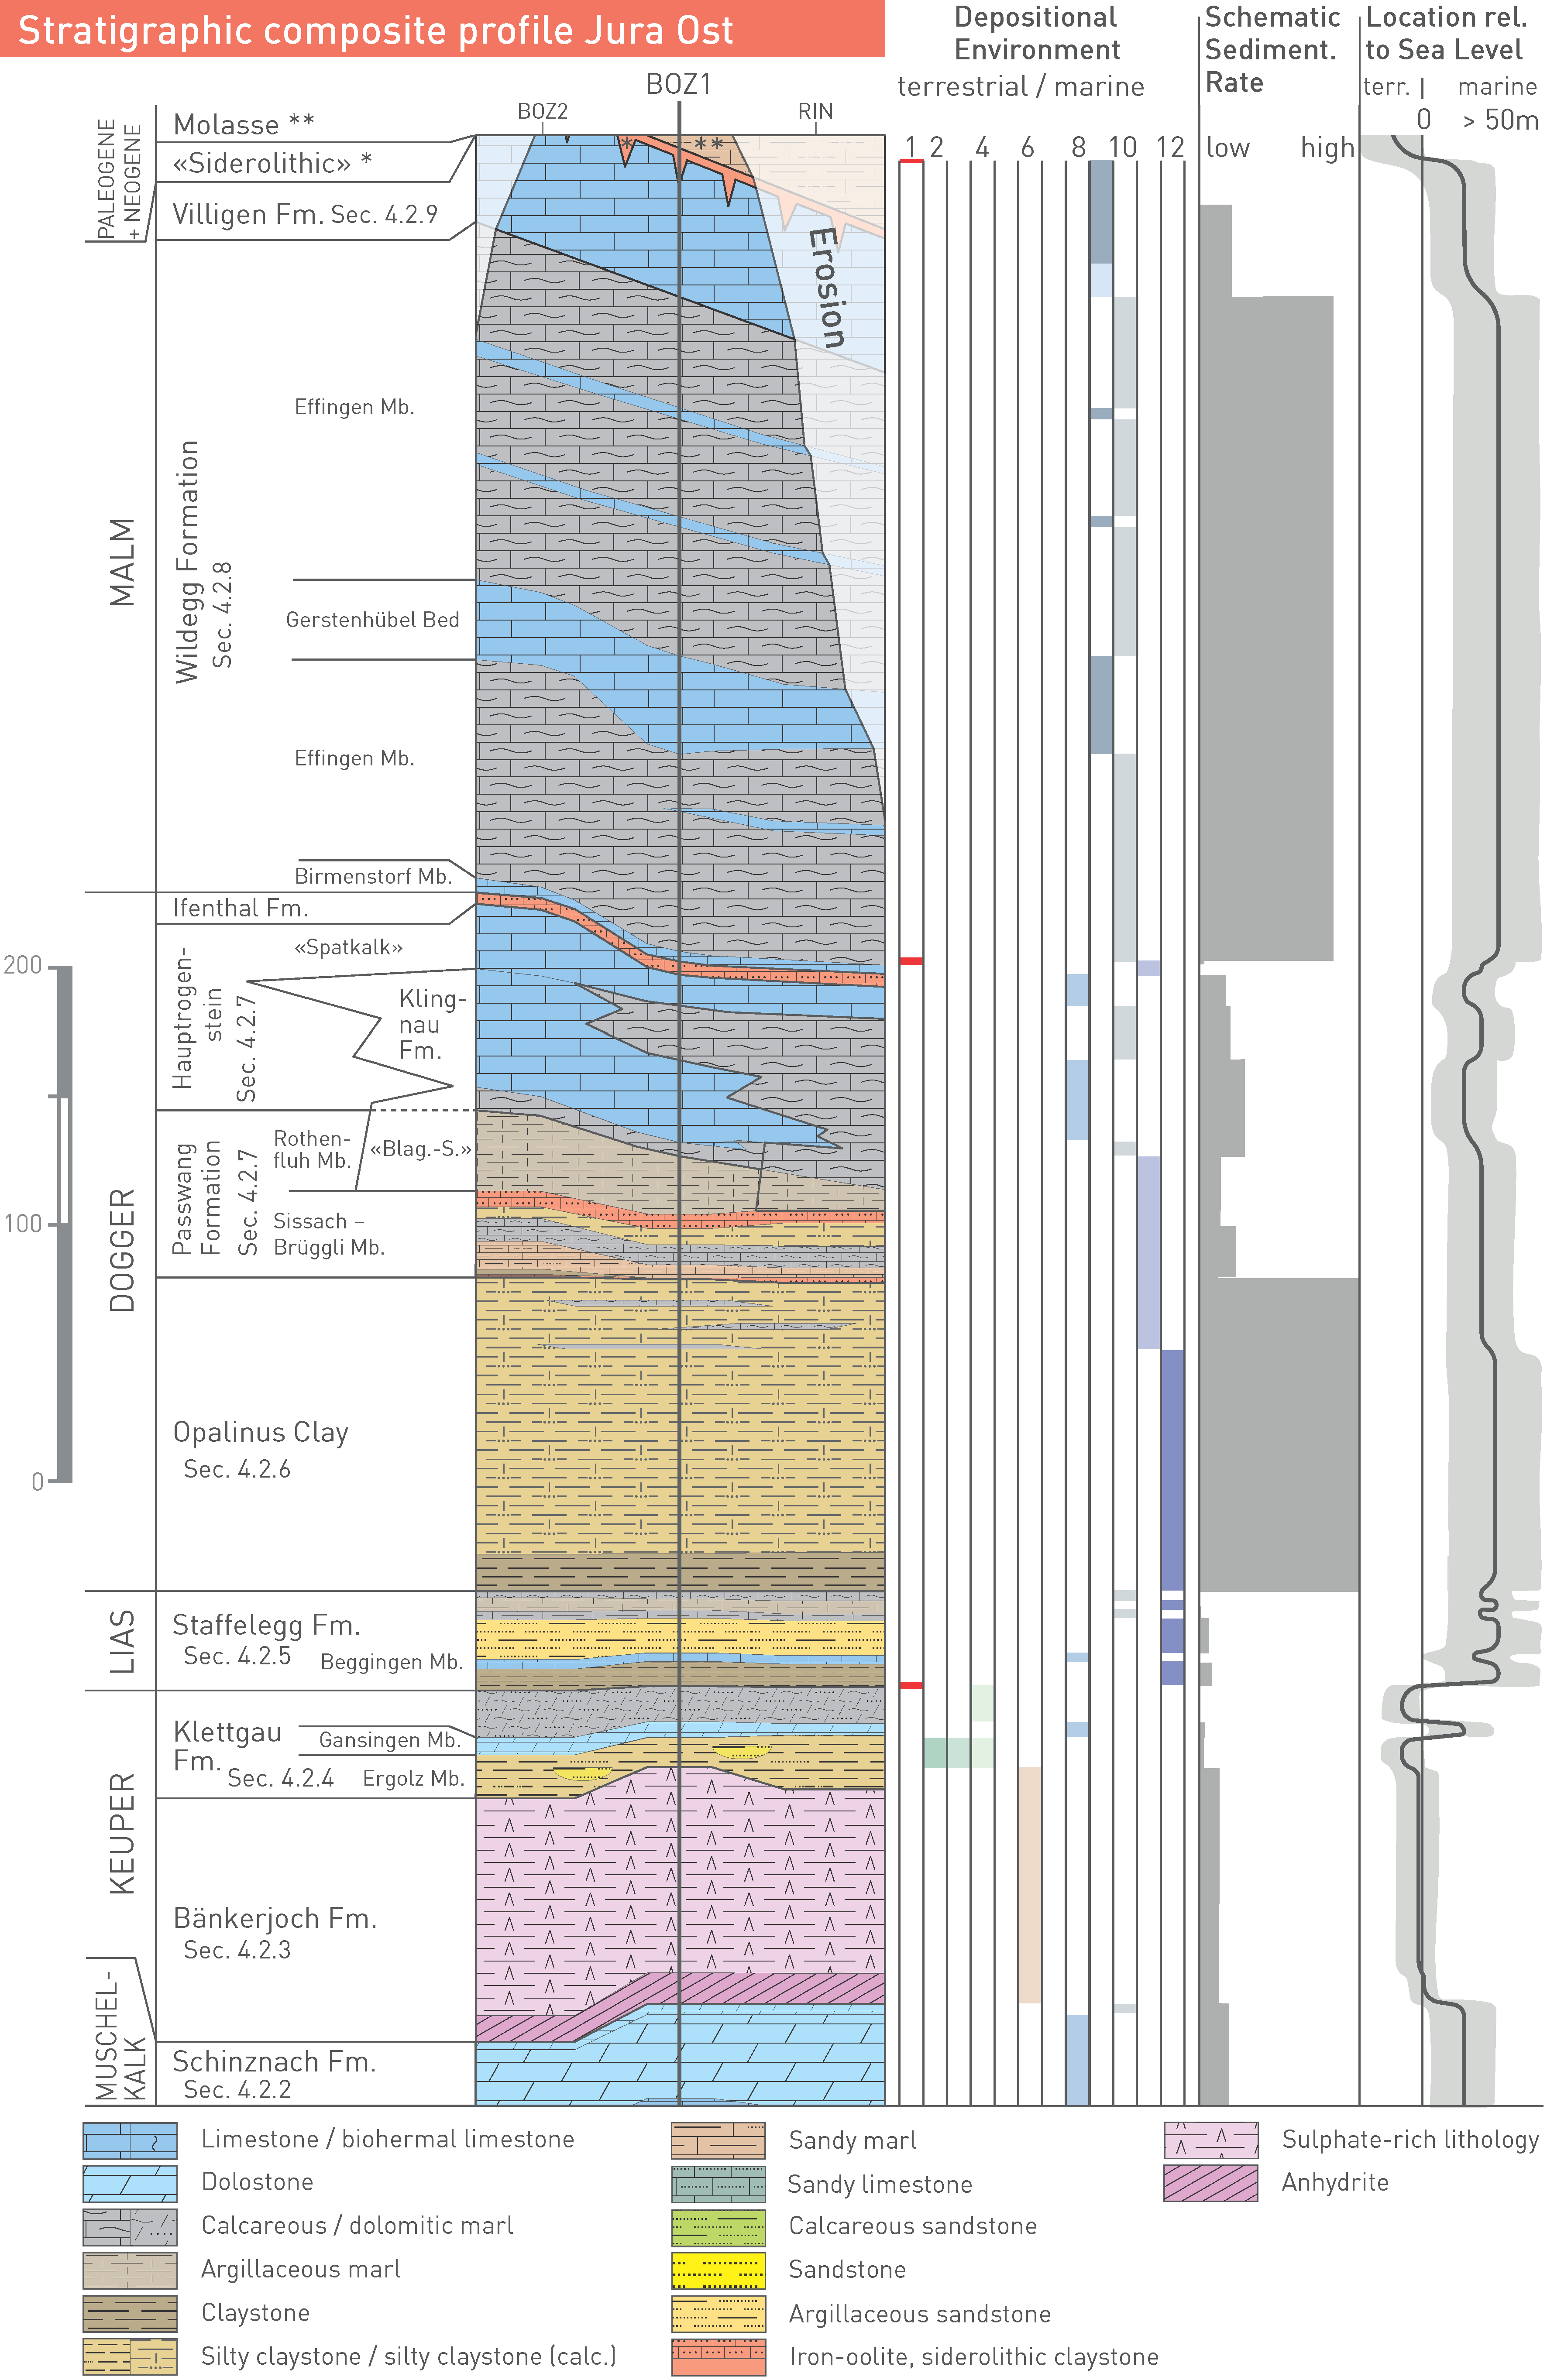
Fig. 4‑4:Schematic lithostratigraphic column for JO with depositional environments, schematic sedimentation rates and estimated location relative to sea level
Refer to Fig. 4‑3 for depositional environments. Boreholes are aligned to the base of the Opalinus Clay. Stratigraphic thicknesses in three right panels according to BOZ1. Sedimentation rates were estimated by dividing the thickness by the deposition period (including hiatuses) of a unit. Fm. = Formation, Mb. = Member.
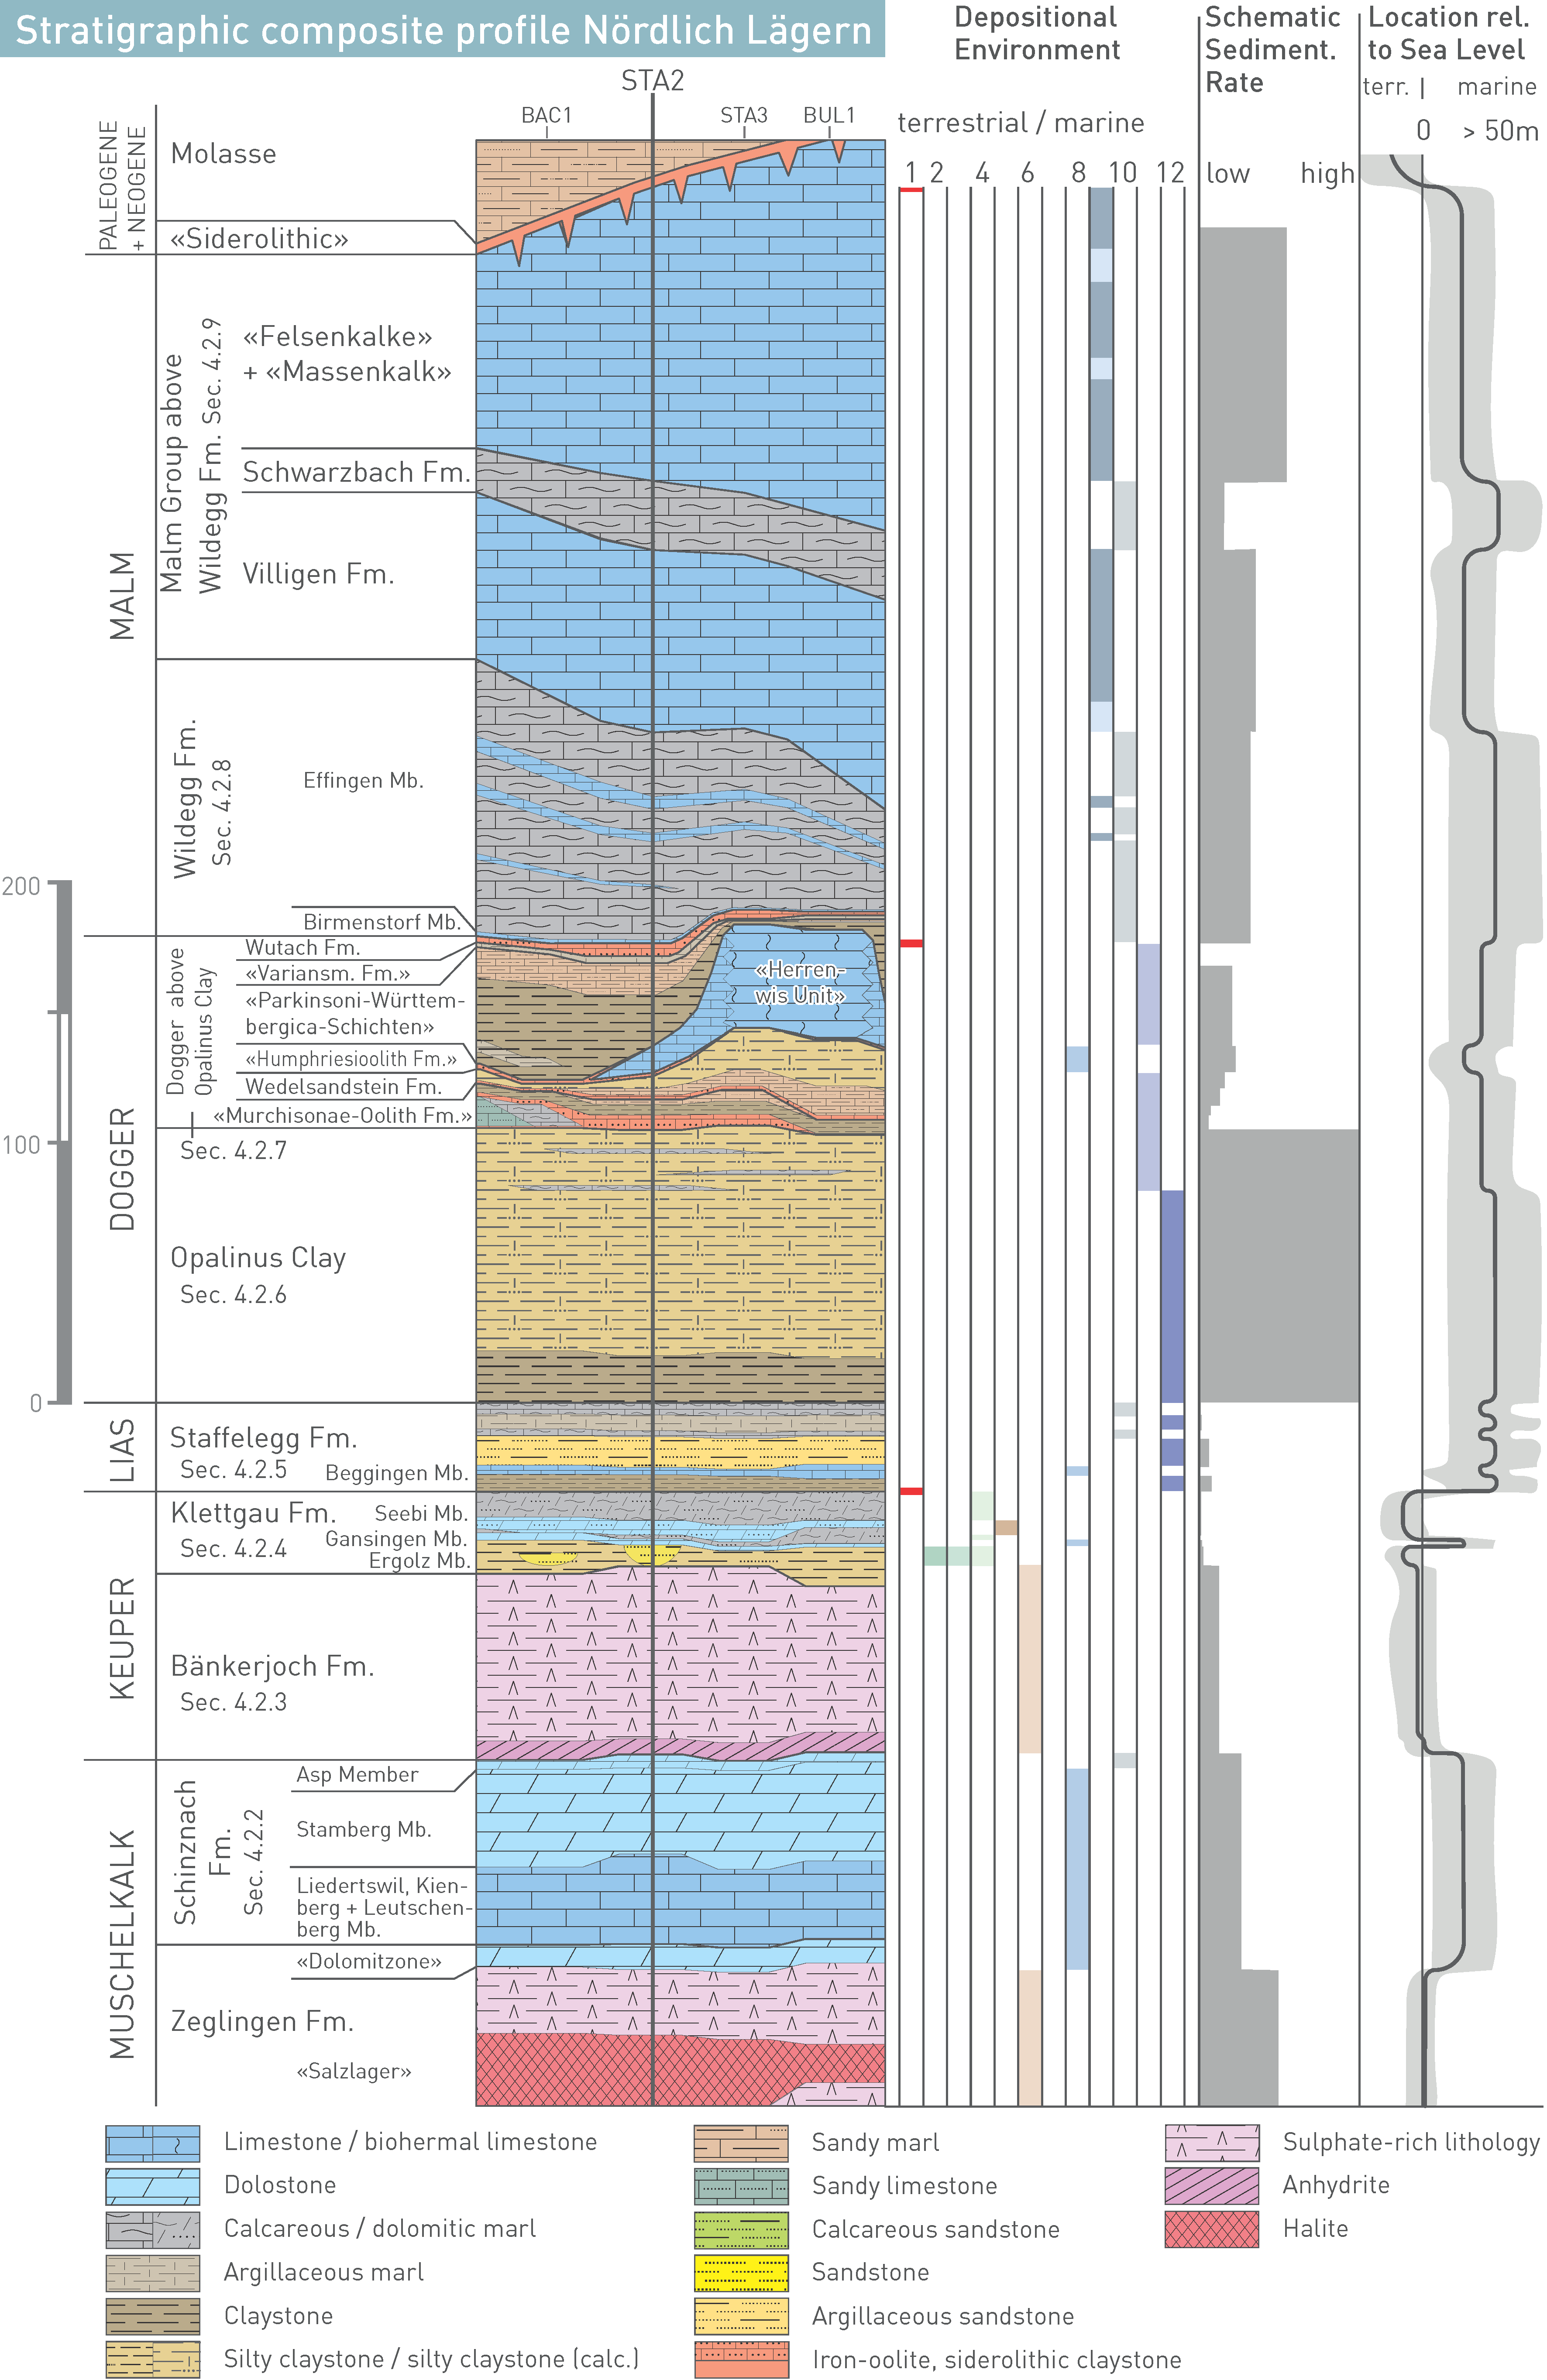
Fig. 4‑5:Schematic lithostratigraphic column for NL with depositional environments, schematic sedimentation rates and estimated location relative to sea level
Refer to Fig. 4‑3 for depositional environments. Boreholes are aligned to the base of the Opalinus Clay. Stratigraphic thicknesses in three right panels according to STA2. Sedimentation rates were estimated by dividing the thickness by the deposition period (including hiatuses) of a unit. Fm. = Formation, Mb(s). = Member(s).
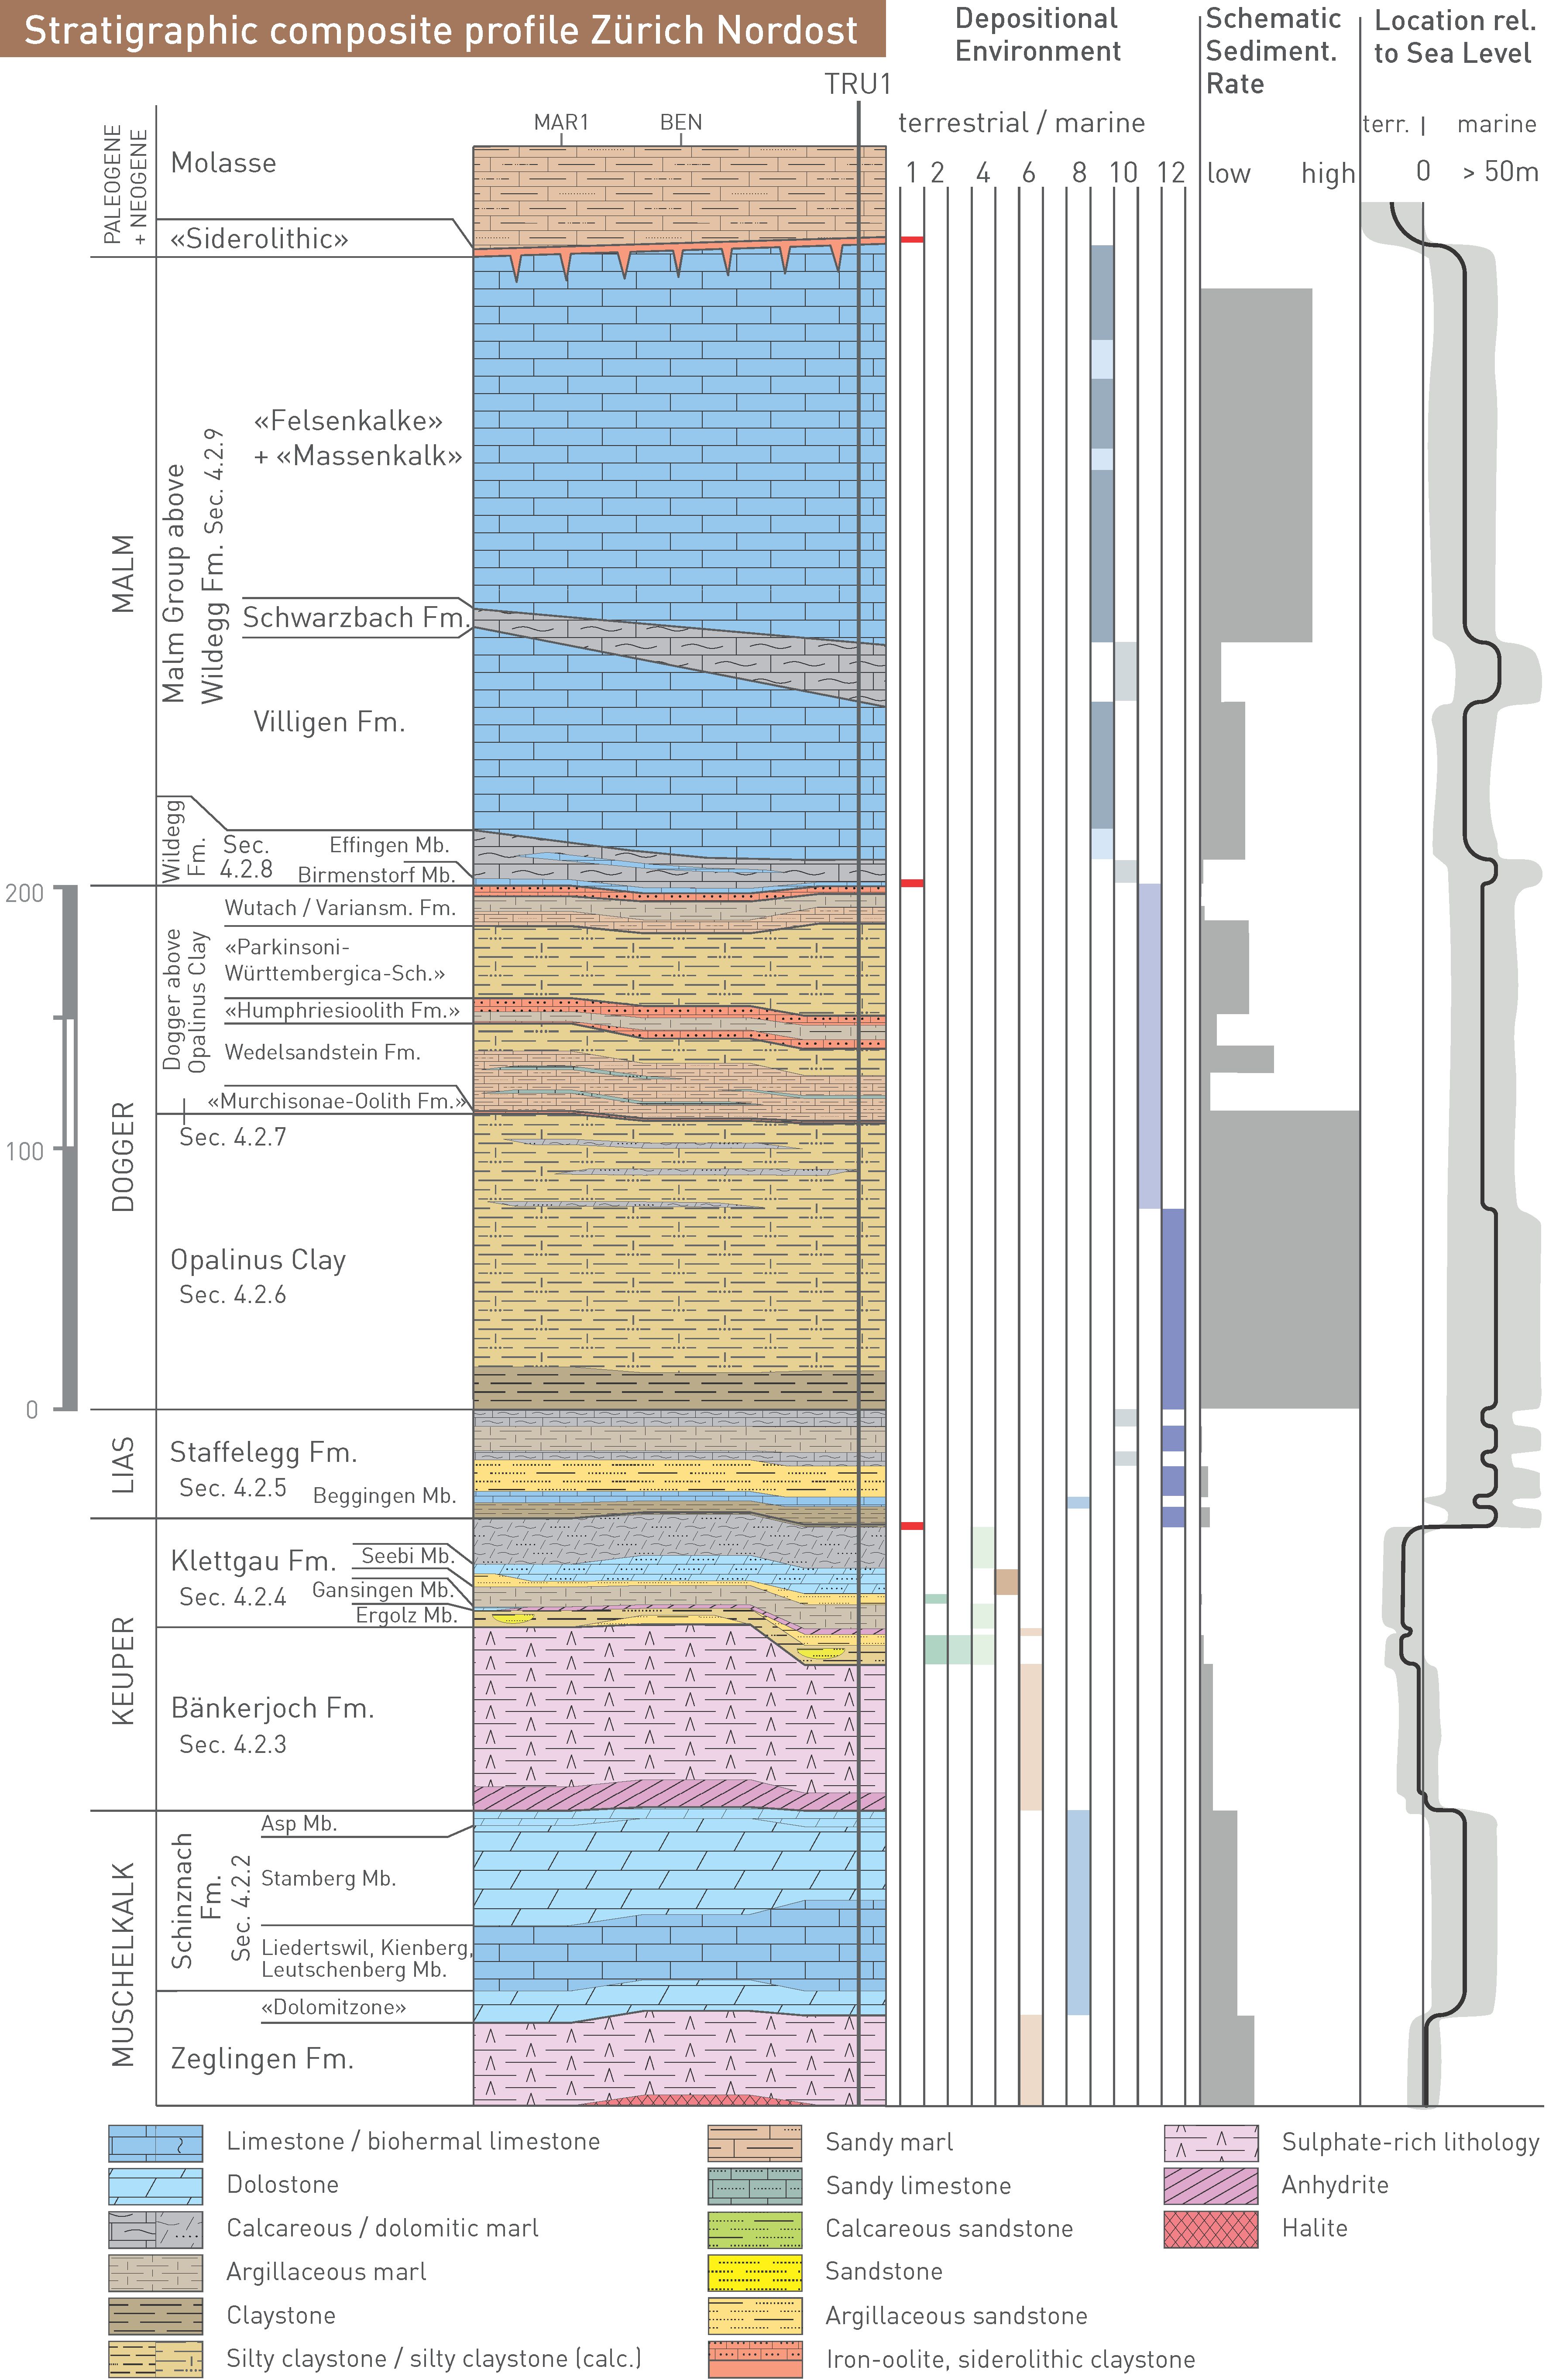
Fig. 4‑6:Schematic lithostratigraphic column for ZNO with depositional environments, schematic sedimentation rates and estimated location relative to sea level
Refer to Fig. 4‑3 for depositional environments. Boreholes are aligned to the base of the Opalinus Clay. Stratigraphic thicknesses in three right panels according to TRU1. Sedimentation rates were estimated by dividing the thickness by the deposition period (including hiatuses) of a unit. Fm. = Formation, Mb. = Member.
800 – 900 m refers to the current compacted thickness of sedimentary rocks. ↩