
Profiles of chloride in porewater
The chloride profiles across the sampled Jurassic and Triassic sequence of the eight TBO boreholes and the BEN borehole are depicted in Fig. 4‑124. Looking at the Opalinus Clay porewaters, which generally reflect maximum Cl concentrations and salinities, the lowest Cl concentrations occur in JO boreholes (~ 2 - 5 g/L; Fig. 4‑124), whereas the Cl concentrations from the NL and ZNO boreholes are higher, in the range of ~ 7 - 14 g/L, the highest concentrations being encountered in the BUL1 borehole. In general, porewater data from aqueous leachates scaled with the anion accessibility derived from diffusion data are shown, as well as data directly obtained from advective displacement (AD) or from squeezing (SQ). A scaling of aqueous leachate data based on the anion accessibility from the combined AD and SQ data leads to almost identical results for the profiles in the NL and ZNO regions. For the JO profiles with the lowest salinities, however, the different scalings lead to different results, and both derived porewater datasets are shown (only for the Opalinus Clay, as no AD and SQ data are available for the other formations).
All boreholes exhibit similar Cl patterns, in particular across the Jurassic sequence, where continuous profiles, albeit with some scatter, are manifested. This is in line with the corresponding δ18O and δ2H profiles. Further similar features of the chloride profiles and the stable water isotope profiles are evident:
-
Porewater concentrations mostly agree well with those of groundwaters in the same area.
-
Profile shapes are influenced to different degrees by the Keuper aquifer in a similar way to those of the stable water isotopes where three types were defined (see above). Thus, BUL1, STA3 and BAC1 profiles show flat shapes down to the lower part of the Keuper (type 1). Conversely, BOZ1, BOZ2, TRU1, MAR1 and BEN show a clear curvature towards the Keuper aquifer (type 3). STA2 lies somewhere in between, displaying less prominent curvature towards the Keuper aquifer (type 2).
The Cl profiles also indicate some dissimilar features and generally more scatter with regard to the profiles of stable water isotopes, mostly related to the uncertainties in the anion-accessible porosity fraction, as also exemplified by the different scalings shown for JO (see Section 5.4.2). Furthermore, relative errors in water contents increase in low-porosity rocks, in particular for lithologies with small-scale heterogeneity. For example, some variation is manifested in the upper confining units which are both vertically and laterally more heterogeneous than the Opalinus Clay. In this context, the «Herrenwis Unit» in the middle Dogger Group, a low porosity limestone with strong variations in clay-mineral content, is noteworthy. Considerable scatter is also seen in the lithologically heterogeneous Triassic rocks in the lower part of the sequence. Despite this scatter, different trends between the lower Keuper and the Muschelkalk aquifer can be discerned (e.g. decreasing with depth in BAC1, STA2 and STA3, increasing in BOZ1 and BUL1).
The different trends in the lower Triassic section are related to compositional differences in the Muschelkalk aquifer, in which Cl concentrations in the groundwater vary between < 1 g/L to 86 g/L. In contrast, variations in stable water isotope signals are small in this aquifer, all suggesting a strong meteoric component. Available porewater data below the Muschelkalk aquifer point to high Cl concentrations. Locally, the Cl data in the lower part of the Triassic and groundwater data in the Muschelkalk aquifer indicate the influence of halite dissolution from the laterally heterogeneous salt layer in the Zeglingen Formation. This is corroborated by the Br/Cl ratios (see below) and the δ37Cl data (Wersin et al. 2023).
Overall, the ensemble of Cl profiles suggests diffusive exchange between the porewaters and the bounding aquifers in a similar way as indicated for the data of stable water isotopes.
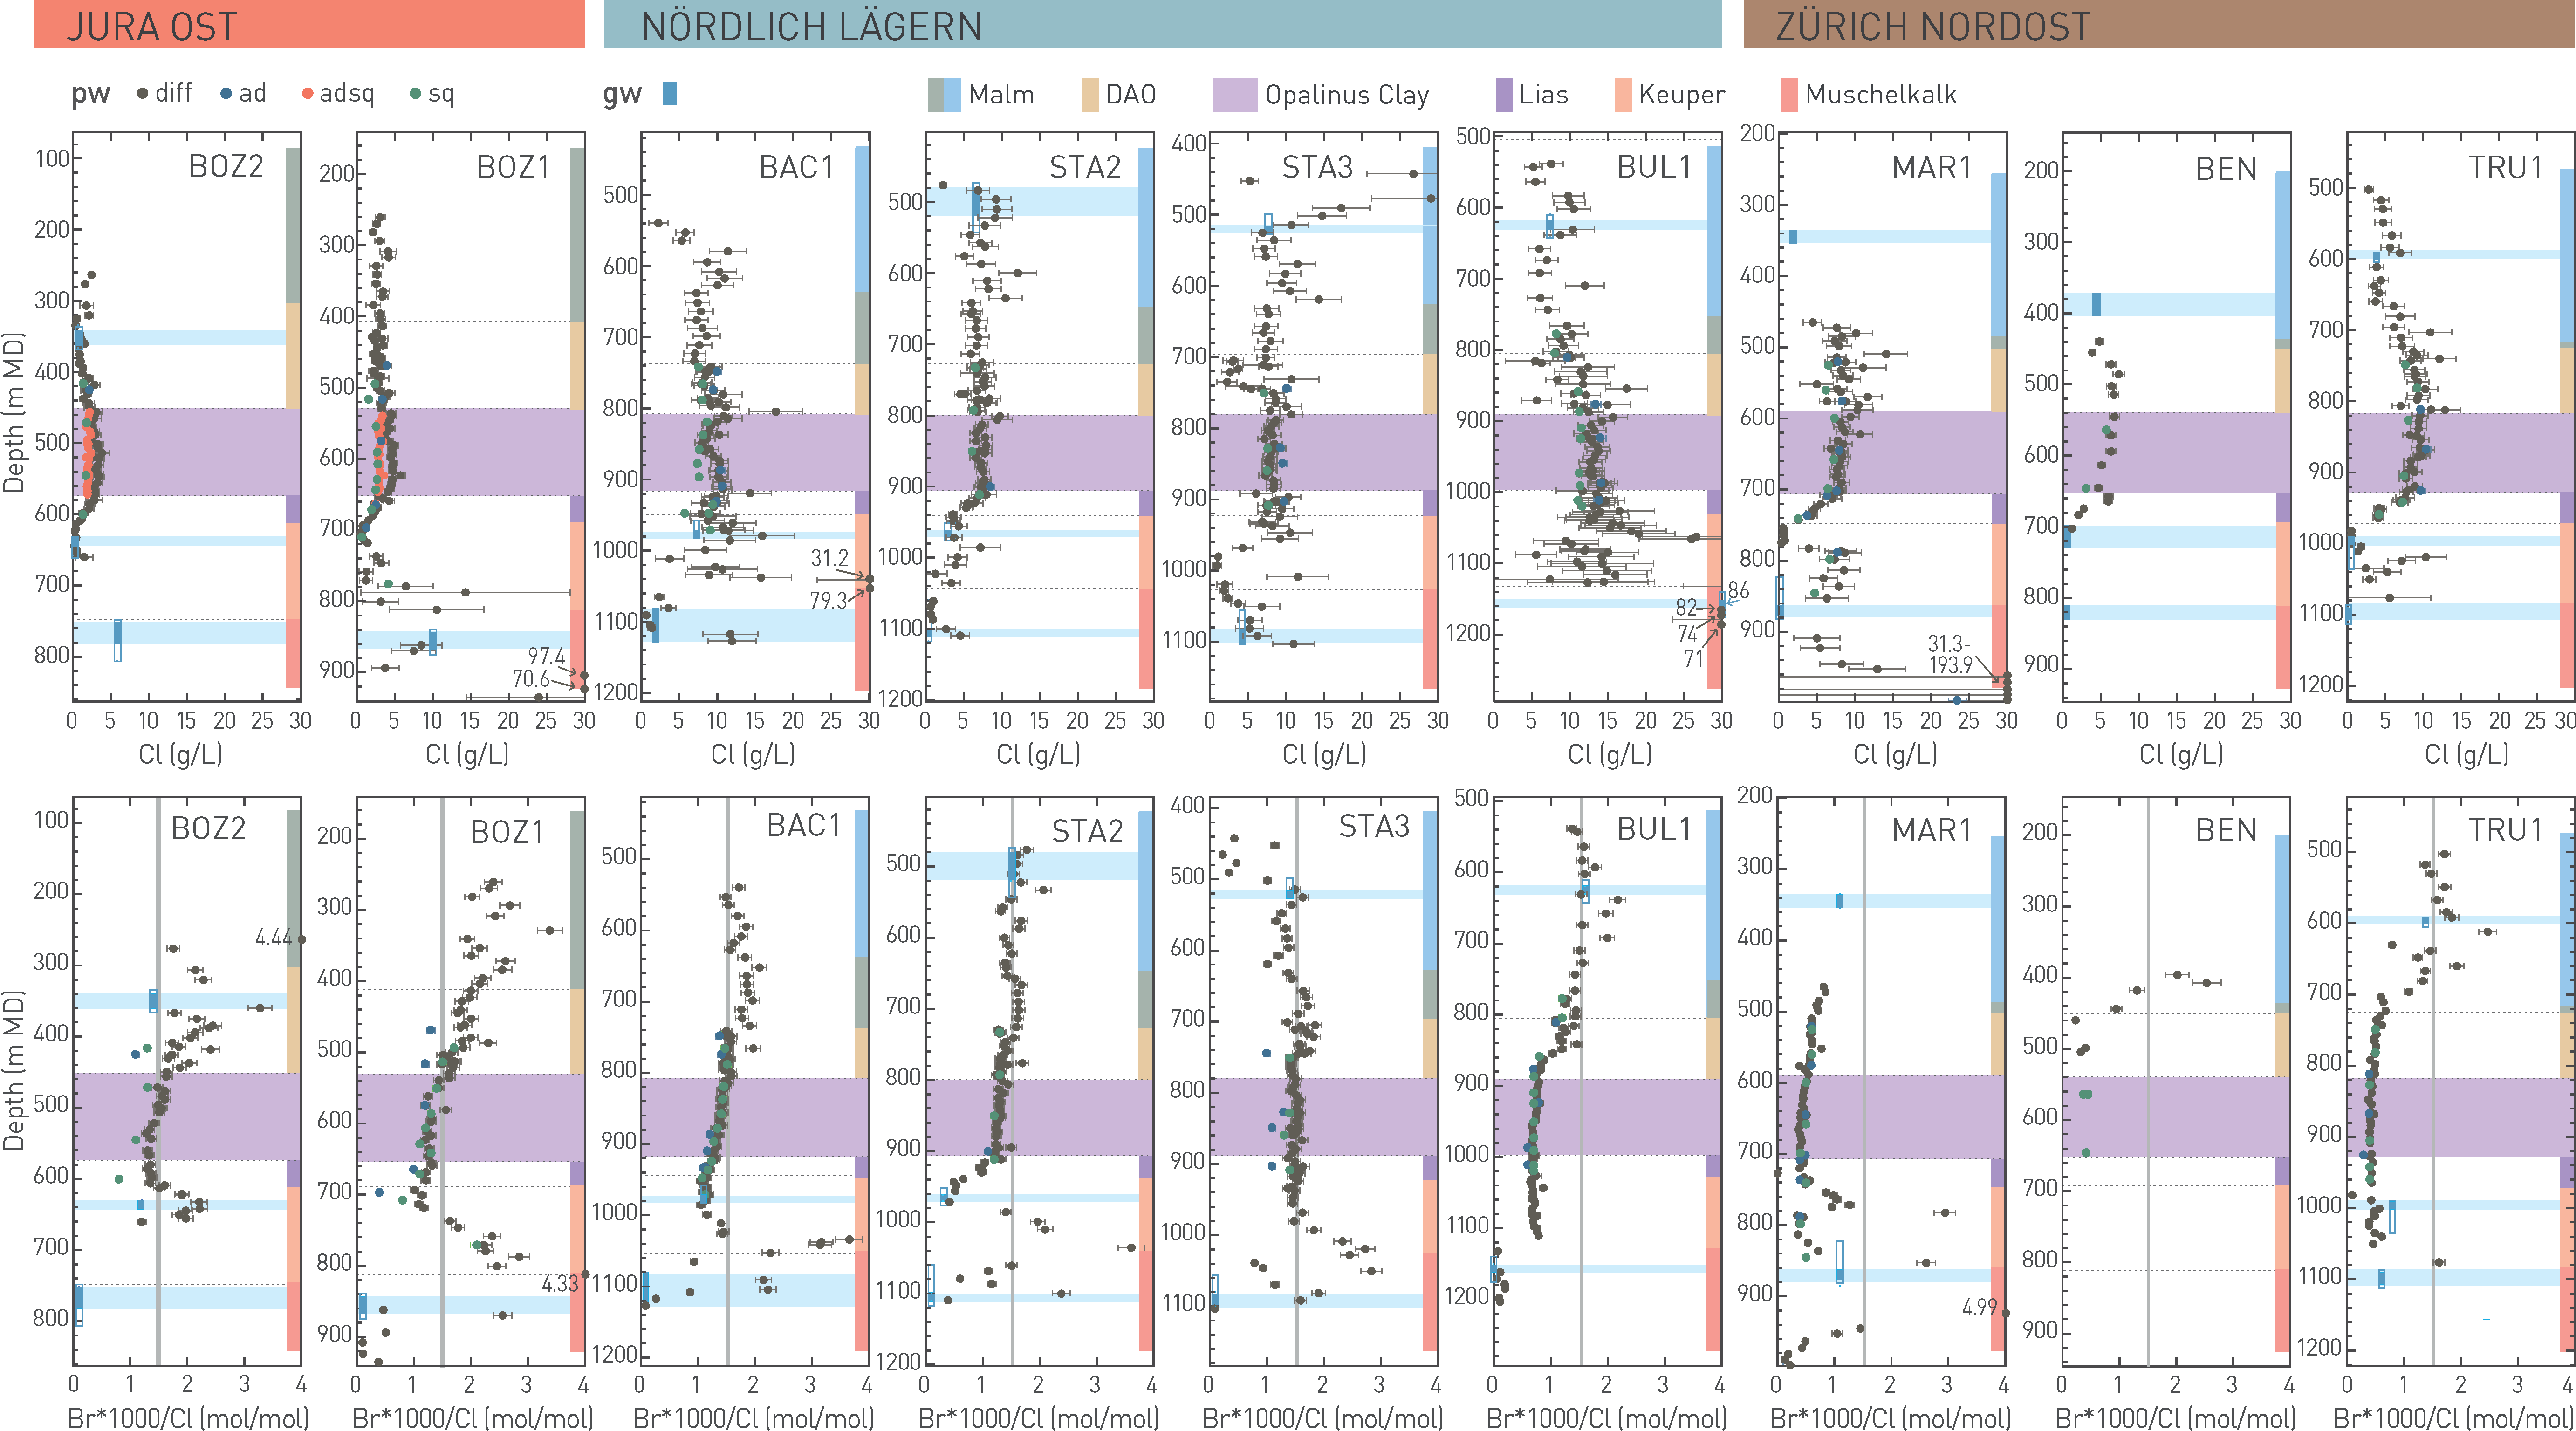
Fig. 4‑124:Profiles of chloride (top row) and Br/Cl ratios (bottom row; grey vertical lines indicate seawater ratio) in porewater of the different boreholes
Porewater data were derived from aqueous leaching and scaled based on diffusion data (diff) or based on advective displacement and squeezing data (adsq), or directly from advective displacement (ad) or squeezing (sq) data. For groundwater samples (gw), open rectangles show packer intervals, closed rectangles and light blue bars most likely inflow zones. DAO: Dogger Group above Opalinus Clay. Light blue background indicates location of transmissive zone in the aquifers.
Profiles of Br/Cl ratio of porewater
The Br/Cl profiles (Fig. 4‑124) are much smoother and uncertainty ranges are smaller when compared to the single anion profiles. This is because the ratios can be calculated directly from the aqueous extraction data without scaling to the accessible pore space.
The agreement between porewater and adjacent groundwater is again evident in most cases, but in some cases differences occur. Moreover, the continuity of the Br/Cl ratios across the largest part of the profiles, and particularly in the Opalinus Clay, is manifested. This further supports the very similar diffusion behaviour of Cl and Br in the porewater. Regional differences in the Br/Cl ratios can be observed and a trend with Br/Cl ratios in the Opalinus Clay and confining units close to that of seawater in the west (comprising BOZ2, BOZ1, BAC1, STA2, STA3), shifting to ratios below seawater in the east (BUL1, MAR1, TRU1) can be inferred.
The top part of the sequence in the Malm displays Br/Cl ratios close to seawater for all boreholes except for MAR1 (note, however, that for this borehole no porewater data are available in most of the Malm section).
In the centre of the low-permeability sequence, the porewater of the Lias and Dogger (sometimes extending into the upper Keuper) shows a trend from marine Br/Cl ratios in the western boreholes to lower values in the east. There is no obvious correlation with the chloride concentration, the occurrence of halite in the lower Muschelkalk or the hydrogeological conditions in the adjacent aquifers. The Br/Cl ratio in the Opalinus Clay probably reflects conditions that predate the current hydrogeochemical environment in the embedding aquifers. The scatter of the data in this section is conspicuously low, and the Br/Cl values are constant or show only limited trends with depth.
In the lower part of the sequence, there is a tendency towards lower Br/Cl ratios but strong variations with positive anomalies in the anhydrite-bearing Bänkerjoch Formation (BOZ1, BAC1, STA2, STA3, MAR1) can be seen in most of the boreholes, sometimes reaching the upper Schinznach Formation (STA3, MAR1). Br/Cl ratios in the Muschelkalk aquifer are well below the marine value, further supporting the influence of dissolution of halite from the underlying Zeglingen Formation (which has a very low Br/Cl ratio, see Kharaka & Hanor (2014). This interpretation is supported by δ37Cl data, which yielded similar values for the underlying halite in the three siting regions where analyses were performed (BOZ1, STA3, BUL1). Note that mixing of the groundwater by dilute meteoric water hardly affects the Br/Cl signals.
Results of modelling
The modelling of the Cl profiles followed the same procedure as that described above for the water tracers, also with initial conditions set to approximately maximum values in the central parts of the profiles. However, the evolution times were not fitted. Instead, the times derived from the stable water isotopes were directly applied for Cl and Br/Cl. For BOZ2, the two different variants of the porewater data were considered: the one with the anion accessibility based on diffusion data, the other based on advective displacement and squeezing data. The differences between the two sets simply represent the uncertainty of the porewater data.
The modelling of four example profiles is presented in Fig. 4‑125. Approximate matches with the data could be obtained in all cases for transport by diffusion. For BOZ2, however, the timing had to be slightly adjusted compared to that obtained from the water isotopes when modelling the Cl and Br/Cl porewater contents based on the accessibilities obtained from diffusion experiments. Also, compared to the stable isotopes of water, considerable deviations between data and simulations appear in some zones, especially where Cl or Br show a large scatter (e.g. drop to low Cl concentrations in the «Herrenwis Unit» or above the Muschelkalk for STA3). As these zones
do not show any peculiarities, either in the stable isotope values or in the Br/Cl ratios or in the He values, it is believed that these deviations are mainly related to an increased uncertainty in the porosity and the anion-accessible fraction for the more heterogeneous limestone formations, and/or because of contributions from fluid inclusions.
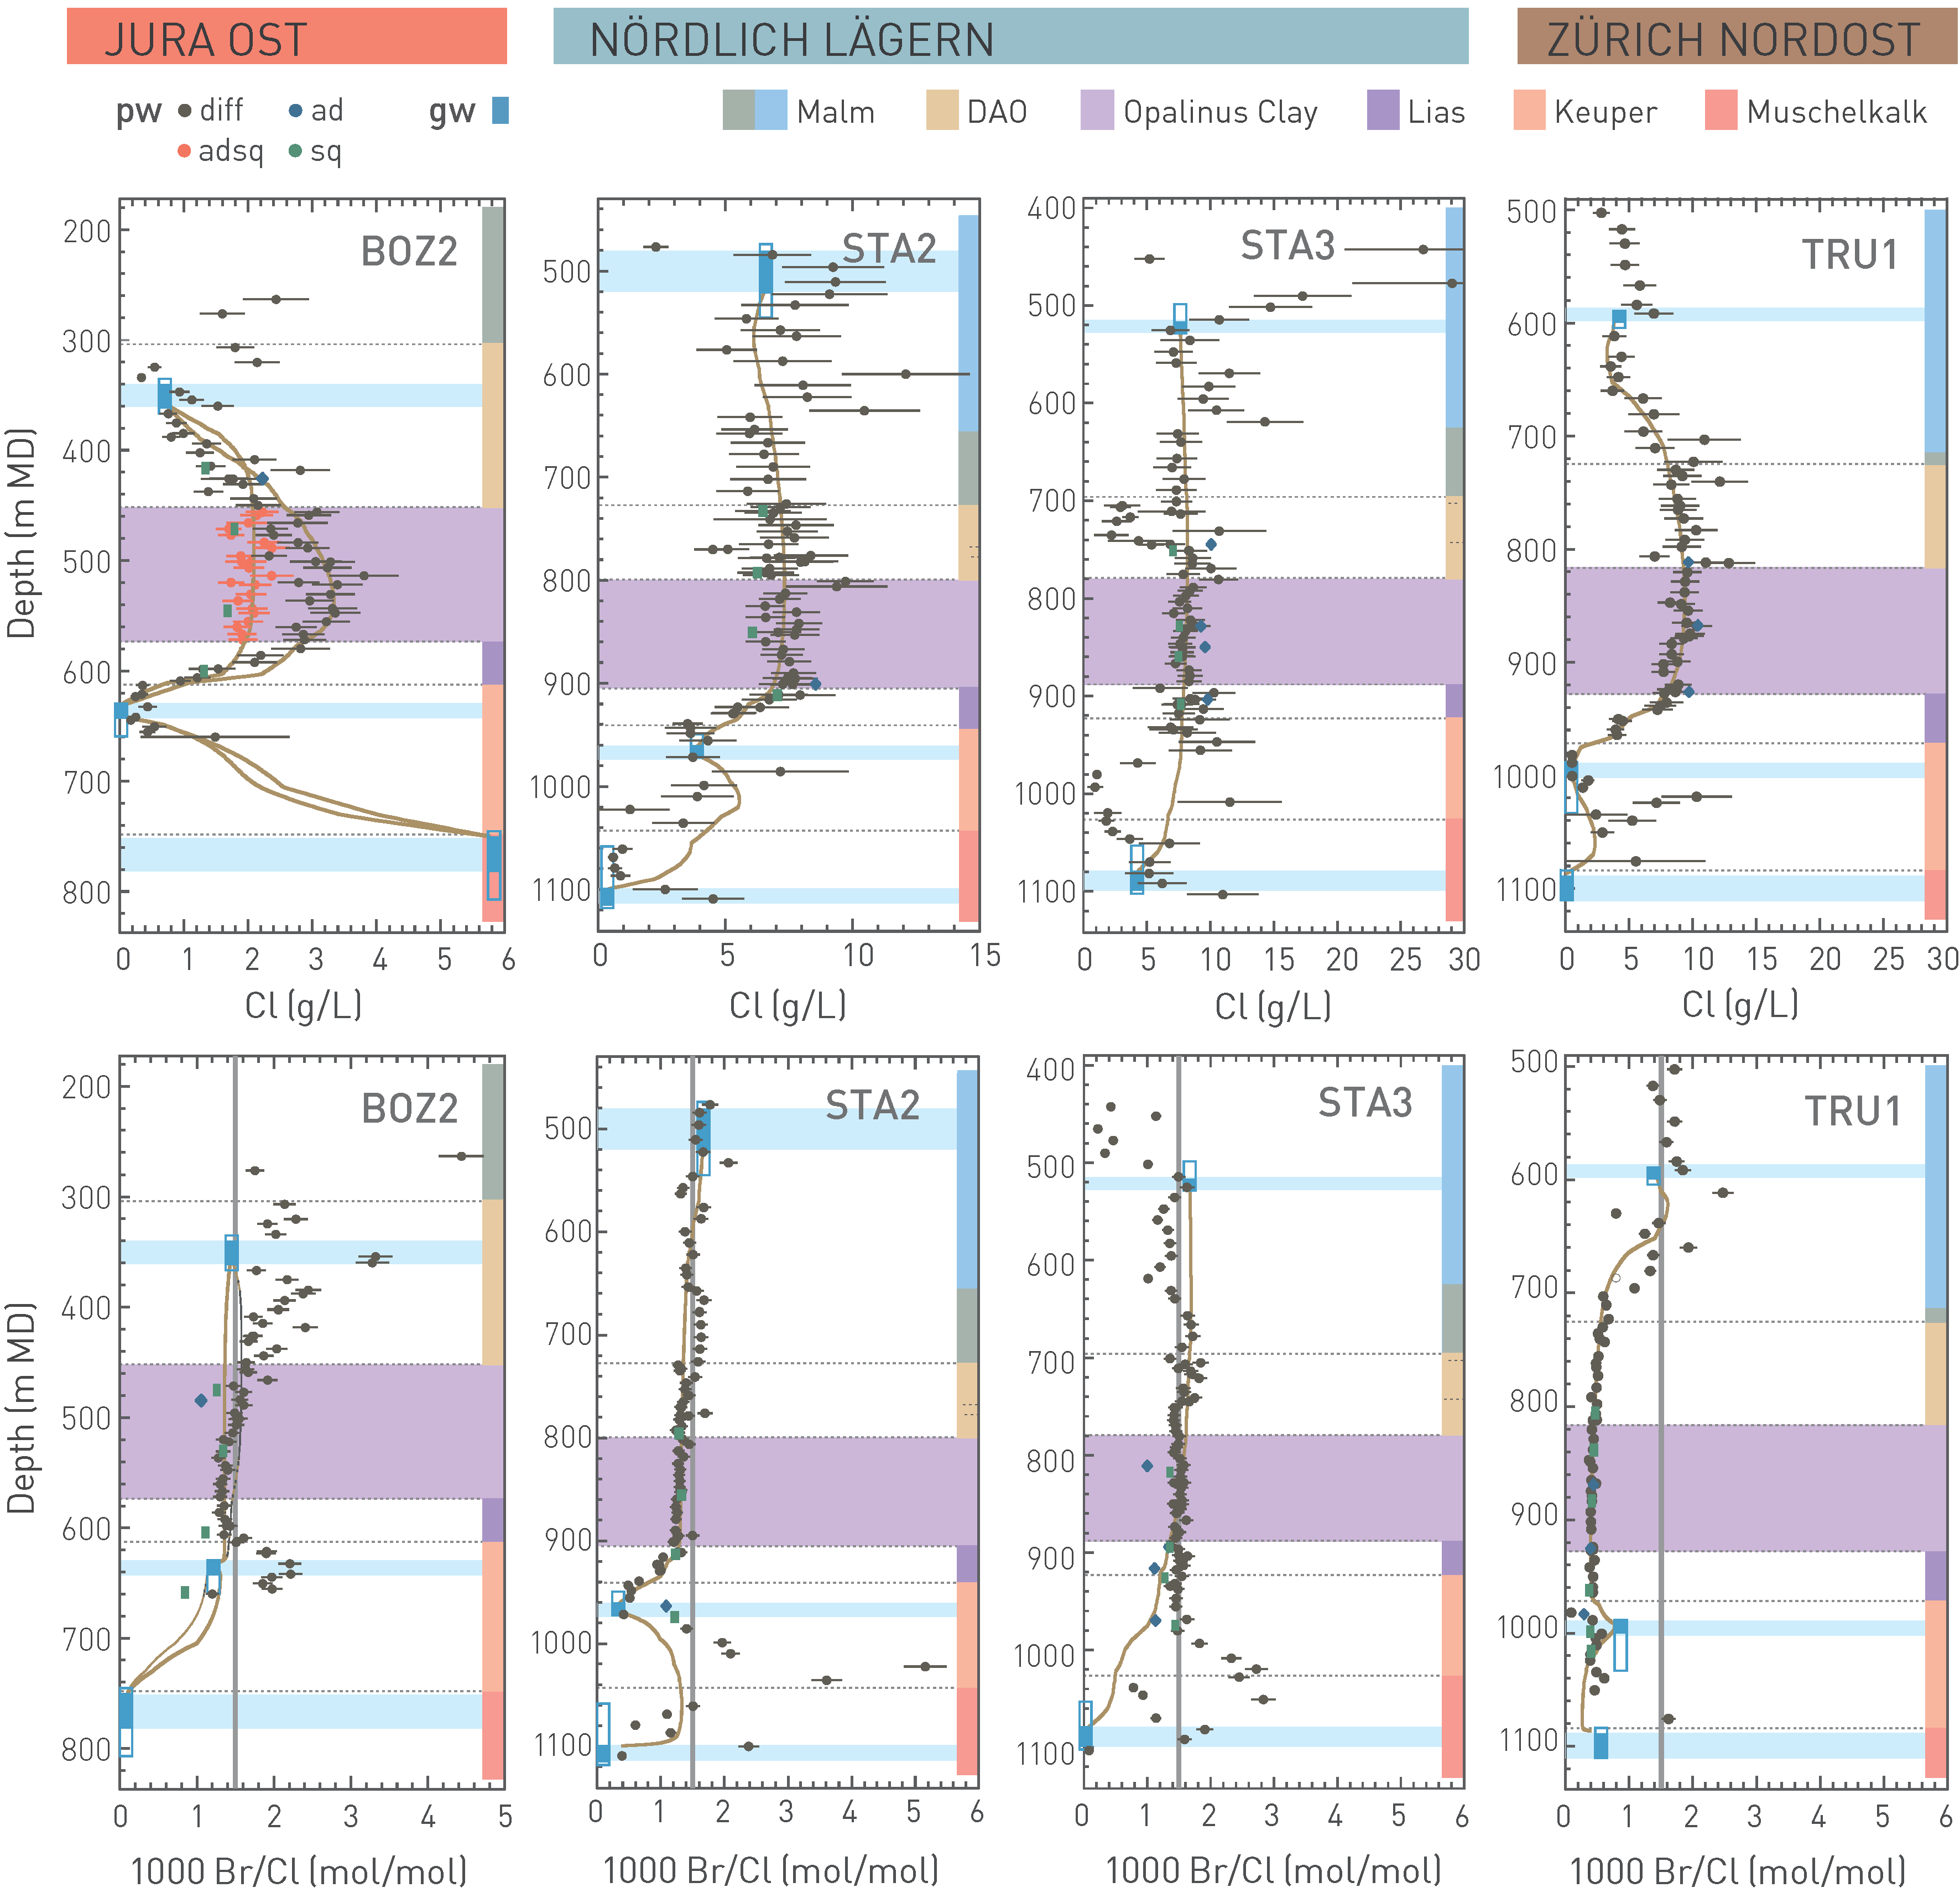
Fig. 4‑125:Comparison of measured and simulated profiles of chloride (top row) and of the Br/Cl ratio (bottom row; grey vertical lines indicate seawater ratio) at BOZ2, STA2, STA3 and TRU1
The brown solid lines show the simulation results (data and simulations for two variants for BOZ2, see text). Porewater (pw) data were derived from aqueous leaching and scaled based on diffusion data (diff) or based on advective displacement and squeezing data (adsq), or directly from advective displacement (ad) or squeezing (sq) data. Where groundwater (gw) could be sampled, open rectangles show packer intervals, closed rectangles and light blue bars most likely inflow zones. DAO: Dogger Group above Opalinus Clay. Light blue background indicates the location of the transmissive zone in the aquifers.