
General observations
The measured depth profiles of stable isotopes of water (δ2H, δ18O; Gimmi et al. 2024) of the eight sites of the TBO campaign with vertical boreholes together with the BEN borehole are presented in Fig. 4‑119 and Fig. 4‑120. The data show trends which are thought to be indicative of diffusive transport (Gimmi et al. 2007). The scatter and uncertainties are largest in regions of low porosity such as in the Malm limestones, in the heterogeneous «Herrenwis Unit» of the Upper Dogger, or in the anhydrite-bearing zones of the lower part of the Keuper (Bänkerjoch Formation). This is mainly because of experimental difficulties associated with these lithologies (Aschwanden et al. 2024). Scatter is much smaller in clay-mineral-rich units with larger porosity, such as in the Opalinus Clay.
Porewater isotope results for depth intervals of the aquifers generally agree well with those obtained for corresponding groundwater samples (when available). This corroborates the quality of the porewater dataset, as local equilibrium in these intervals can be assumed (diffusion is fast over short distances, and groundwater residence times are generally > 10 kyr; Section 4.5.5). In some intervals with potential aquifers, no groundwater could be sampled during packer tests because the hydraulic conductivity was too low. This was the case in the Malm in BAC1, in the Hauptrogenstein in BOZ1, and in the Keuper in BOZ1, STA3, BUL1 and MAR1.
The profile shapes of δ2H and δ18O can be roughly classified into three types. Type 1, exemplified by those of BAC1, STA3 and BUL1, is characterised by more or less linear profiles down to the lower part of the Keuper. Type 3, the other endmember type, is characterised by clearly curved profiles or profile parts, especially towards the top of the Keuper. This group includes the profiles from BOZ2, STA2, TRU1, and BEN. Type 2 is intermediate, with less pronounced curved profiles towards the top of the Keuper. It includes BOZ1 and MAR1. Note that this classification is based on the profiles of δ2H and δ18O. The profiles of Cl or Br at the latter two sites exhibit more pronounced curvatures compared to the hydrogen and oxygen isotopes of the water.
Interactions with groundwater in aquifers
The distinction of the three profile types is clearly related to the occurrence of flowing groundwater in aquifers. Notably, Keuper groundwater could be sampled in all clearly curved profiles of type 3 (BOZ2, STA2, TRU1 and BEN; see Section 4.5). In contrast, no Keuper groundwater could be sampled in two of the three more or less straight profiles of type 1 (STA3, BUL1). Interestingly, the hydraulic conductivity was also too low to sample groundwater in the Keuper packer interval in the intermediate type 2 profiles (BOZ1, MAR1) with a weak excursion only, while sampling was possible in the type 1 profile of BAC1 showing hardly any curvature towards the Keuper. Type 1 profiles (no excursion towards the Keuper) are found in NL, type 2 and type 3 profiles are found in all study areas, with most strongly curved profiles in the ZNO region (Section 4.5).
The observations regarding the influence of flowing groundwater in the Keuper are consistent with the general understanding of this aquifer. They corroborate the lateral variability in this aquifer mentioned earlier (Gimmi & Waber 2004, Gimmi et al. 2007) when presenting the tracer profiles from the BEN borehole. The variability is related to the regionally changing lithofacies of this formation (more sheetlike water-conducting structures in ZNO, more sandy fluvial channels in NL, probably a dolomitic member in JO; Section 4.5.3.10). As a result, hydraulic conductivity and flow velocity are locally very variable, in particular in NL, leading to the different profile types.
Groundwater in the Malm (or in the Hauptrogenstein in the case of BOZ2) could be sampled in all profiles except BOZ1 and BAC1. This groundwater clearly influenced the shape of the upper part of these profiles (in MAR1, the porewater dataset is limited as only the lowermost part of the Malm was cored). In BAC1, no Malm groundwater could be sampled, but the uppermost porewater values start to decrease again upwards; it is possible that water flow occurred further above. The transmissive zones in the Malm are generally (except for BEN) located above the Schwarzbach Formation (Section 4.5.3.3), that is near to or above the uppermost porewater data point of BAC1.
The profile trends towards the Malm aquifer are mostly relatively flat, less curved than towards the Keuper groundwater. This indicates long-term stable boundary conditions and comparatively long interaction times (as diffusion coefficients are not especially large in these massive limestones; Van Loon et al. 2023), probably longer than those towards the Keuper groundwater. A prominent exception is TRU1, where a possibly more recent change in the Malm groundwater composition may have caused the bending of the upper part of the δ18O (but not δ2H) profile towards higher values. To a lesser degree, STA2 and possibly also STA3 show a similar feature. The curvature towards the Hauptrogenstein groundwater in BOZ2 is relatively steep, indicating a shorter interaction time compared to those for the interaction with the Malm groundwater at the other sites (assuming diffusion coefficients are of similar order). In BAC1, the comparatively flat profile above the Keuper groundwater could indicate a longer interaction time between groundwater and porewater but, combined with the less negative groundwater signature in the Keuper than at other sites, it could also hint at a comparably small volume of interacting groundwater because of slow flow of groundwater and/or a small extent of the transmissive zone (consistent with a zone away from the main water flow, Section 4.5), both leading to stronger alteration of the groundwater signature by exchange with the porewater.
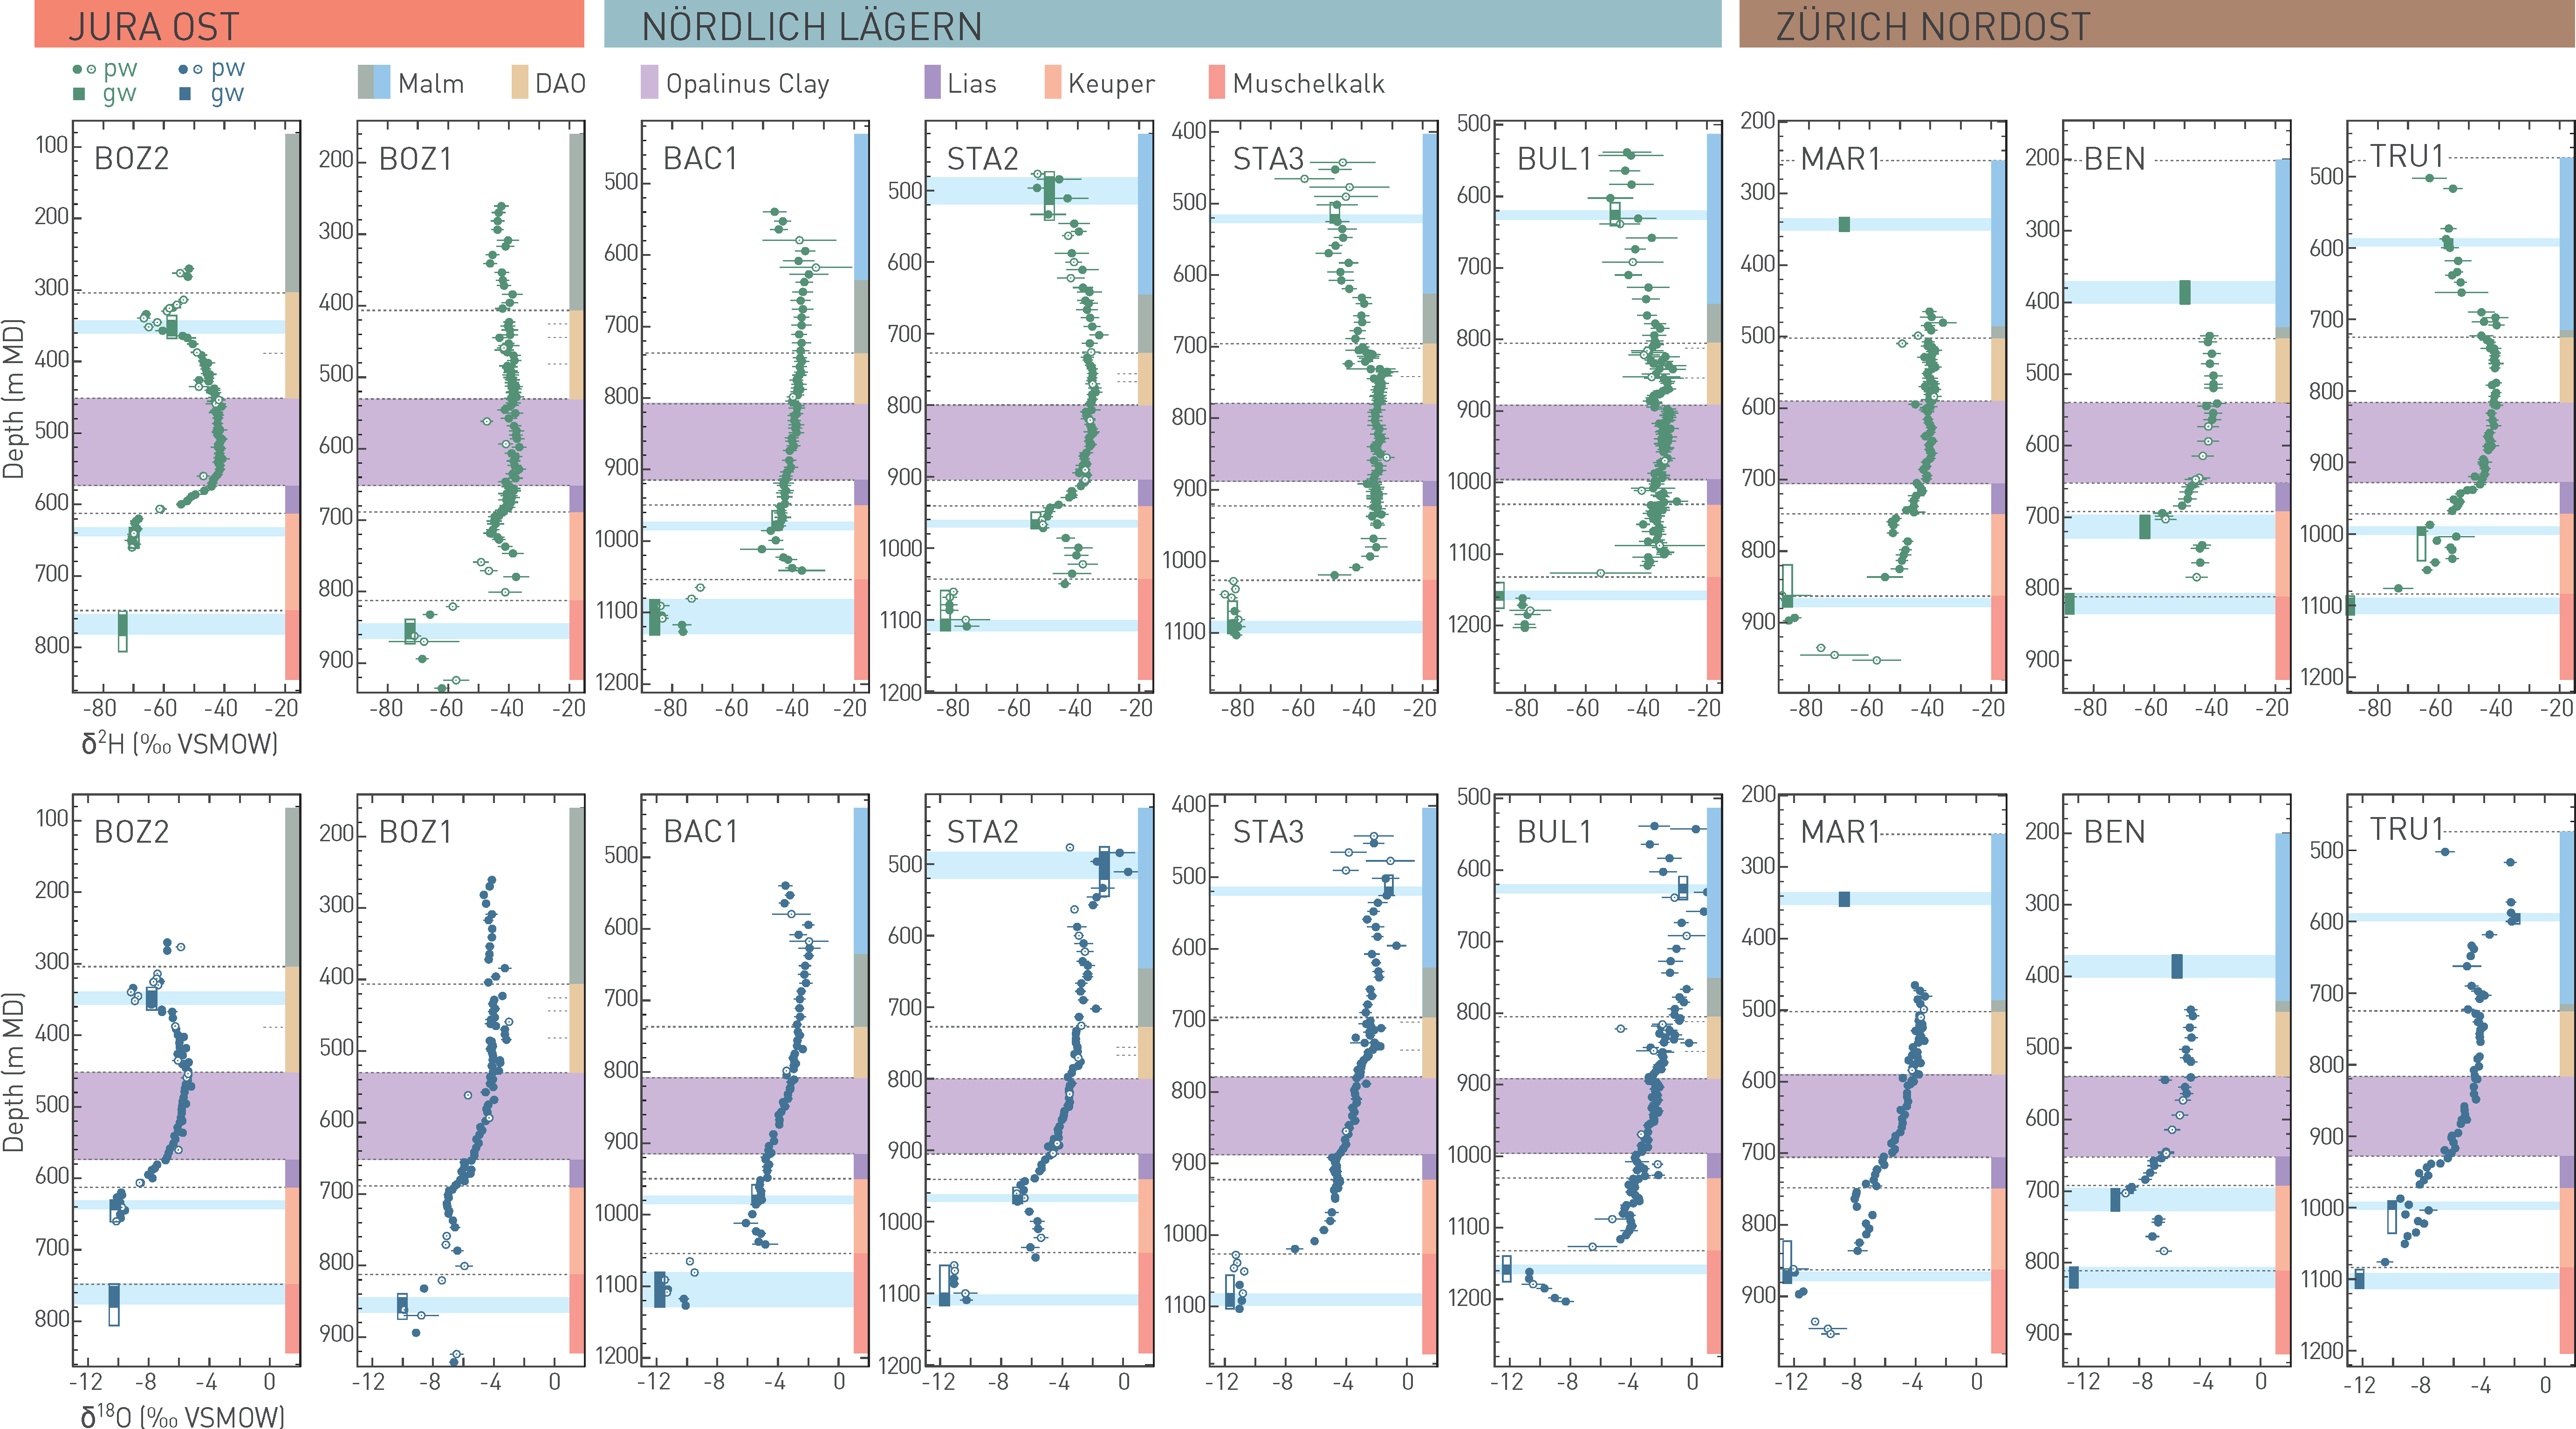
Fig. 4‑119:Profiles of δ2H (top row) and δ18O (bottom row) in porewater (pw) and groundwater (gw) in the different siting regions
Porewater data were derived from diffusive isotope exchange experiments; open symbols: less reliable (potential artefacts or contamination with drilling fluid). Where groundwater could be sampled, open rectangles show packer intervals, closed rectangles and light blue bars most likely inflow zones. DAO: Dogger Group above Opalinus Clay. Light blue background indicates the location of the transmissive zone in the aquifers.
At depth, all profiles are then clearly influenced by groundwater in the Muschelkalk aquifer, where minima of δ2H and δ18O are observed. The steep gradients of porewater δ2H and δ18O towards the most negative values in the Muschelkalk aquifer indicate a comparatively late change of the signature in this aquifer, and/or very low diffusion coefficients in the overlying Bänkerjoch Formation (containing clay-bearing to massive anhydrite beds; Section 4.2.3, Mazurek et al. 2023a).
Relationship between δ2H and δ18O values
The δ2H and δ18O pore- and groundwater data can be compared with respect to their position relative to the Global Meteoric Water Line (GMWL). This provides information regarding the origin of – and interactions between – pore- and groundwaters. The Malm groundwaters plot distinctly to the right of the GMWL (see Fig. 4‑121 with ground- and porewater of four boreholes; see also Fig. 4‑104 in Section 4.5.5.2 for Malm groundwater in all boreholes). This indicates generally long residence times (see discussion in Section 4.5.5). The Hauptrogenstein, Keuper and Muschelkalk groundwaters are located on or near the GMWL (see also Fig. 4‑109, Fig. 4‑110, Fig. 4‑112 and Fig. 4‑121). Keuper waters – except at BAC1 and STA2 – have a modern recharge signature, indicating recharge under climatic conditions similar to recent conditions (e.g. during an interglacial period in the Quaternary). The values slightly to the right of the GMWL in BAC1 and STA2 could indicate a more pronounced interaction with the aquitard porewaters, for instance because of a lower thickness of transmissive zones and/or lower water flow velocity. Muschelkalk waters in JO have a modern recharge signature, while those in NL and ZNO indicate a colder recharge temperature than at present. The porewater values evolve from the Malm or Hauptrogenstein through an intermediate peak in the lower Malm, Dogger Group above Opalinus Clay or the Opalinus Clay with maximum δ2H values (but not maximum δ18O values, Fig. 4‑121) towards the Keuper or Muschelkalk waters. The curved depth trends demonstrate that the porewater data in the aquitard represent a transient situation and not a steady tracer distribution between the bounding aquifers. This also means that the values in the aquitard (and especially in the central part) do not originate from the presently measured groundwater values, but from an earlier evolution.
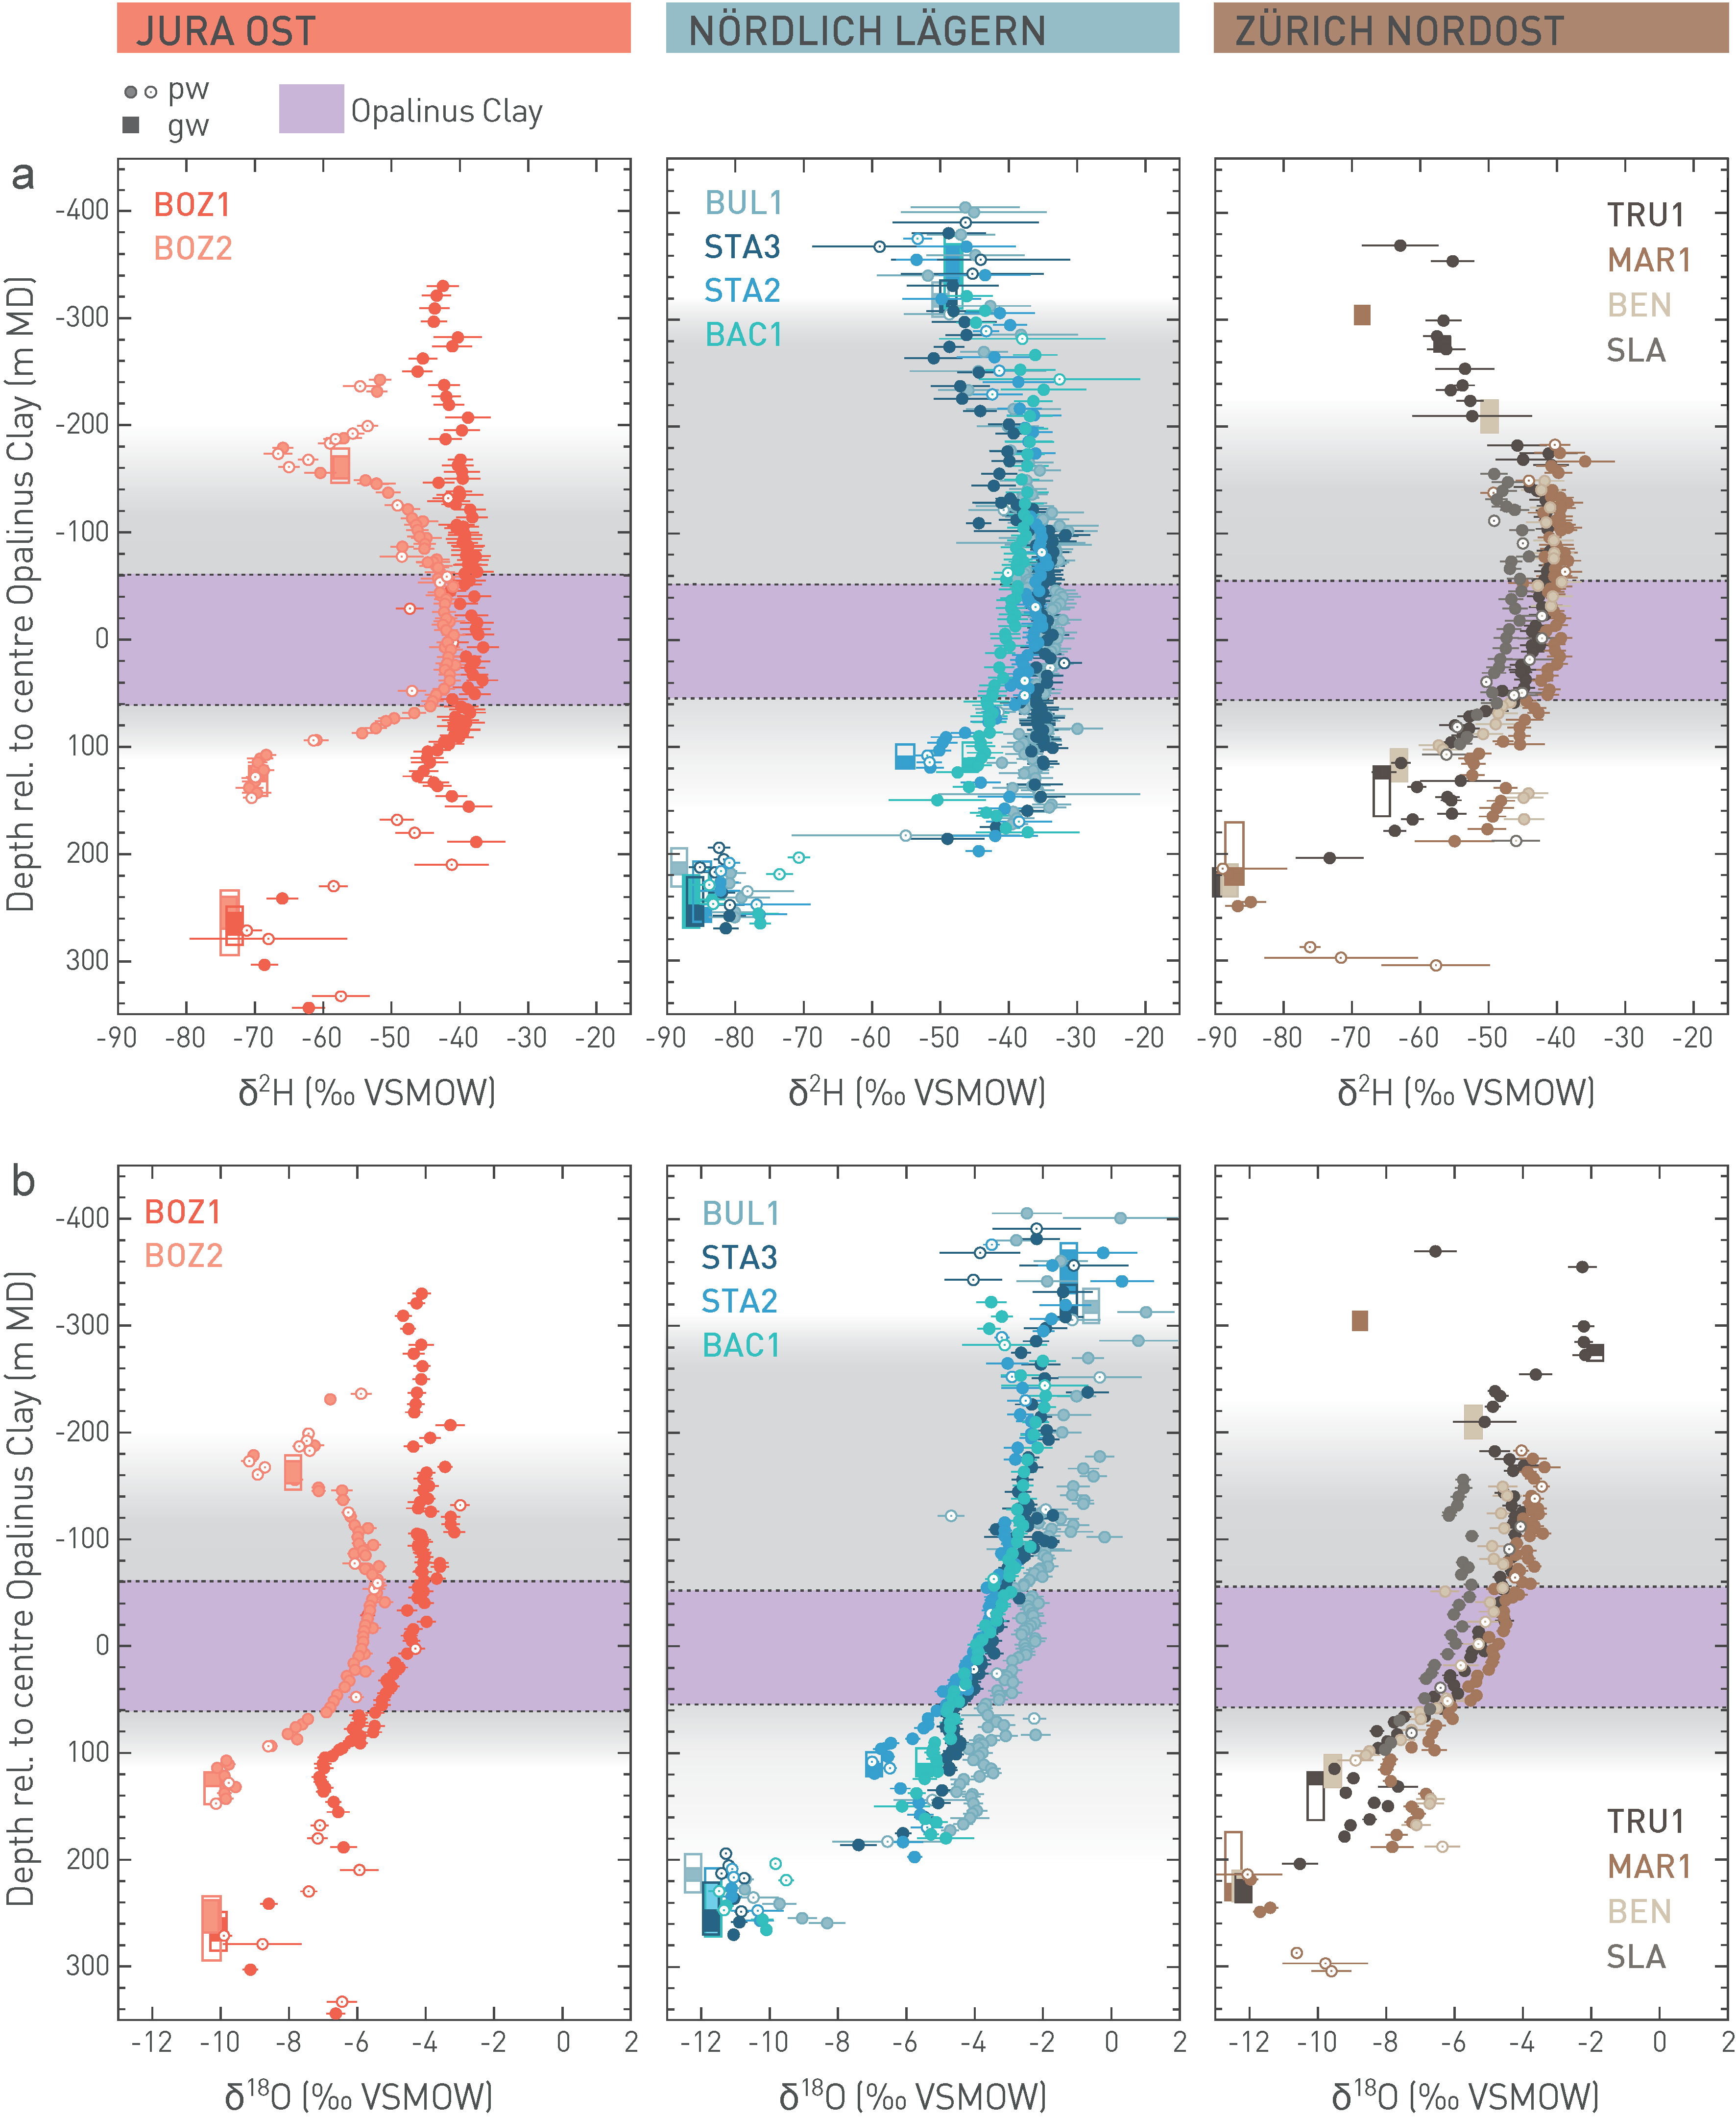
Fig. 4‑120:Comparison of profiles of δ2H (a) and δ18O (b) in porewater (pw) and groundwater (gw) of the different geological siting regions
For the groundwater, open rectangles show packer intervals, closed rectangles most likely inflow zones. Porewater data were derived from diffusive isotope exchange experiments; open symbols denote less reliable data (because of potential artefacts or contamination with drilling fluid). The grey background illustrates in an approximate way the extent of the low-permeability sequence between bounding aquifers in each region.
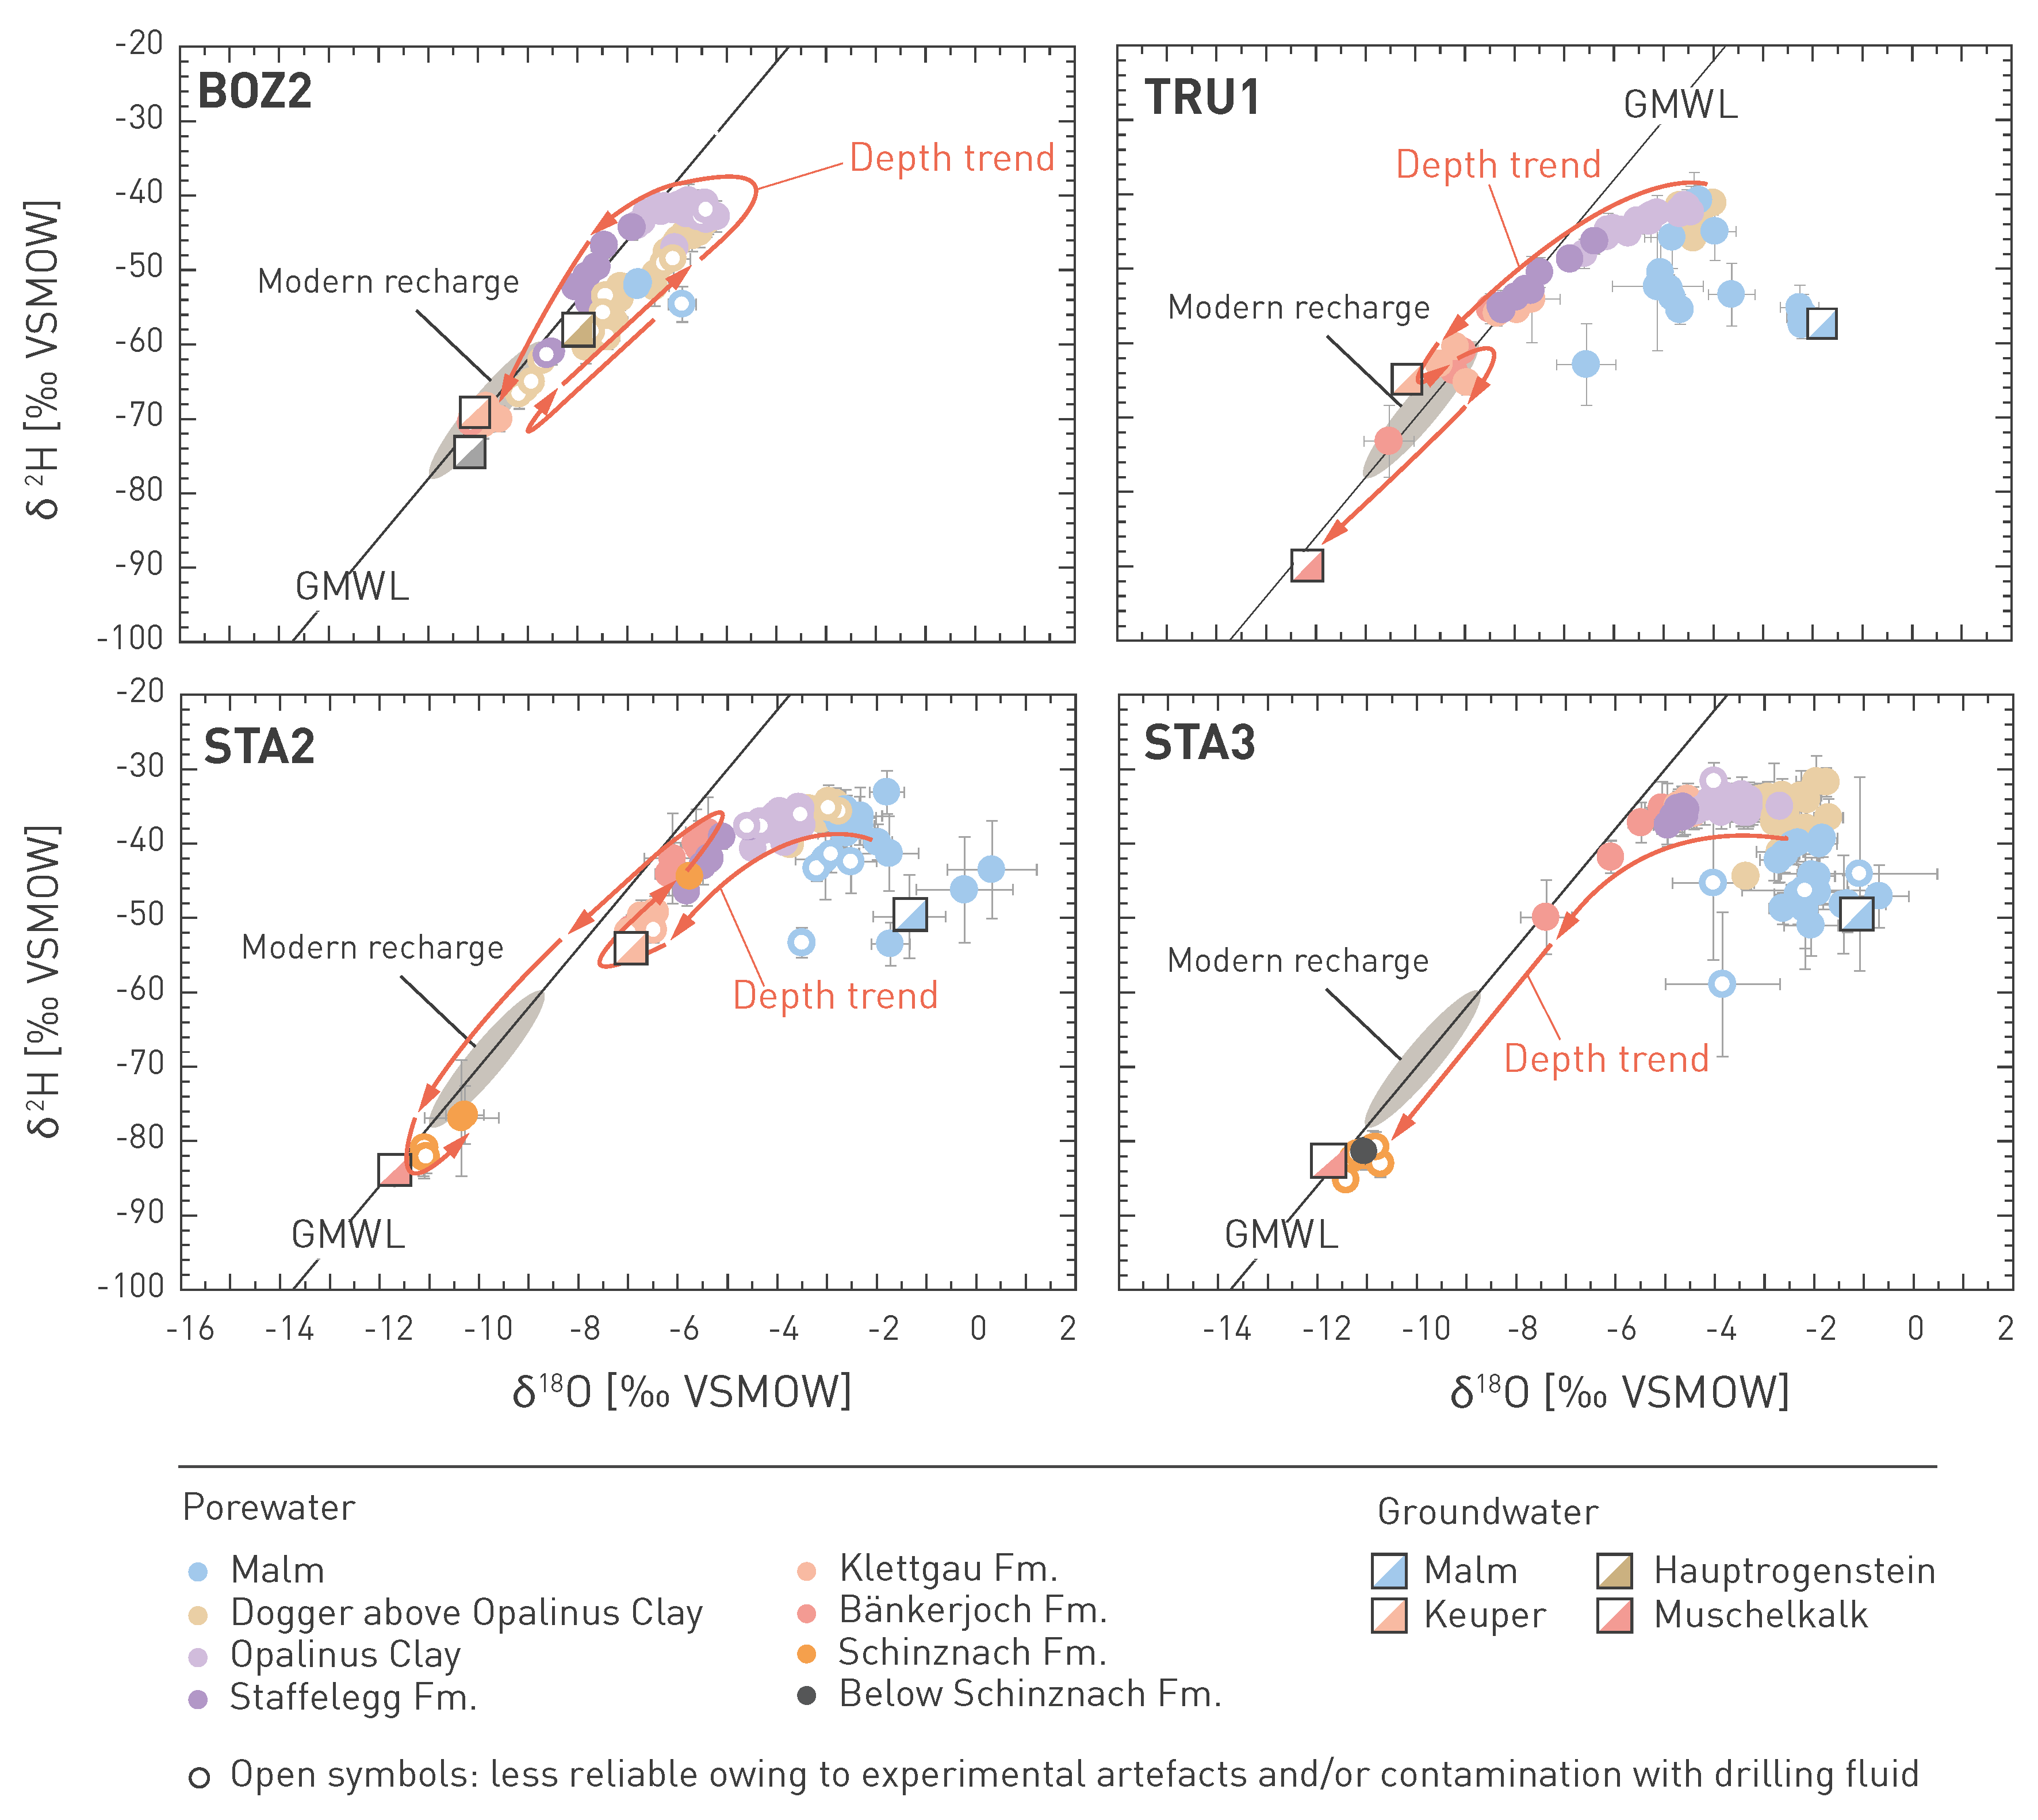
Fig. 4‑121:Signatures of stable water isotopes for BOZ2, STA2 and TRU1 (all influenced by Keuper groundwater) as well as for STA3 (no Keuper groundwater)
Graphs show the evolution from the Malm groundwater (STA2, STA3, TRU1) or the close to meteoric Hauptrogenstein groundwater (BOZ2) towards meteoric, modern recharge groundwater (BOZ2, TRU1) or a mixture of meteoric and older groundwater (STA2) in the Keuper aquifer (if present), and then towards modern recharge groundwater (BOZ2) or colder climate meteoric water (TRU1, STA2, STA3) in the Muschelkalk aquifer.
Qualitative interpretation of the profiles of δ2H and δ18O
The good similarities between the different siting regions in terms of maximum observed δ2H or δ18O values and ‘background’ trends in the central parts become obvious in Fig. 4‑120, as well as the similarities and differences in terms of bounding aquifers. The similarities demonstrate that the isotopic signatures in the different siting regions share a largely common evolution. The area has been continental probably since the Late Cretaceous (except for the short Upper Marine Molasse Group period) and erosion occurred down into the karstified Malm limestones (Section 3.4.2). The contact with meteoric water at the surface during that time led to negative isotope values as observed today in the central parts of the aquitard sequence. The later deposition of the Upper Marine Molasse Group (OMM, which has affected the groundwaters in the Malm aquifer in the NL and ZNO siting regions, see Section 4.5.5.2) probably had only a minor influence on the isotope signatures in the deeper aquitard sequence. The more recent evolution of the profiles was triggered by contact with flowing groundwater in aquifers. The specific evolution is related to the timing of events in the groundwater (such as the activation of flow by erosion in the recharge and/or discharge areas), to the specific local groundwater values in each aquifer, as well as to the thickness of the low-permeability sequence, which is schematically shown as grey background in Fig. 4‑120. The thickness is largest for NL and smallest for JO. This difference, as well as the difference in hydrogeological situation and topography, may partly be responsible for the generally lower isotope values of the profiles in JO compared to those in other areas, and also for their comparatively low Cl contents (Section 4.6.3). However, for instance for BOZ2, the isotope gradients towards the Keuper and Hauptrogenstein are steep, and it appears that the maximum values in the central part are not yet affected by the present-day boundary conditions. This means that the lower values in the central part in BOZ2 and also in BOZ1 compared to those in other profiles cannot be the result of the present-day boundary conditions, but probably evolved at earlier times. This also becomes evident when plotting only the values from the Opalinus Clay in a δ2H – δ18O diagram (Fig. 4‑122). Slightly different trends are seen in the different areas. The data in NL start from values furthest to the right of the GMWL, while the data in JO and in ZNO start at values closer to the GMWL. At the same time, the lowest values in JO and ZNO reach or nearly reach, respectively, the GMWL, while the lowest values in NL still remain to the right of the GMWL. The trend lines for NL and ZNO are also similar, while that for JO has a shallower slope.
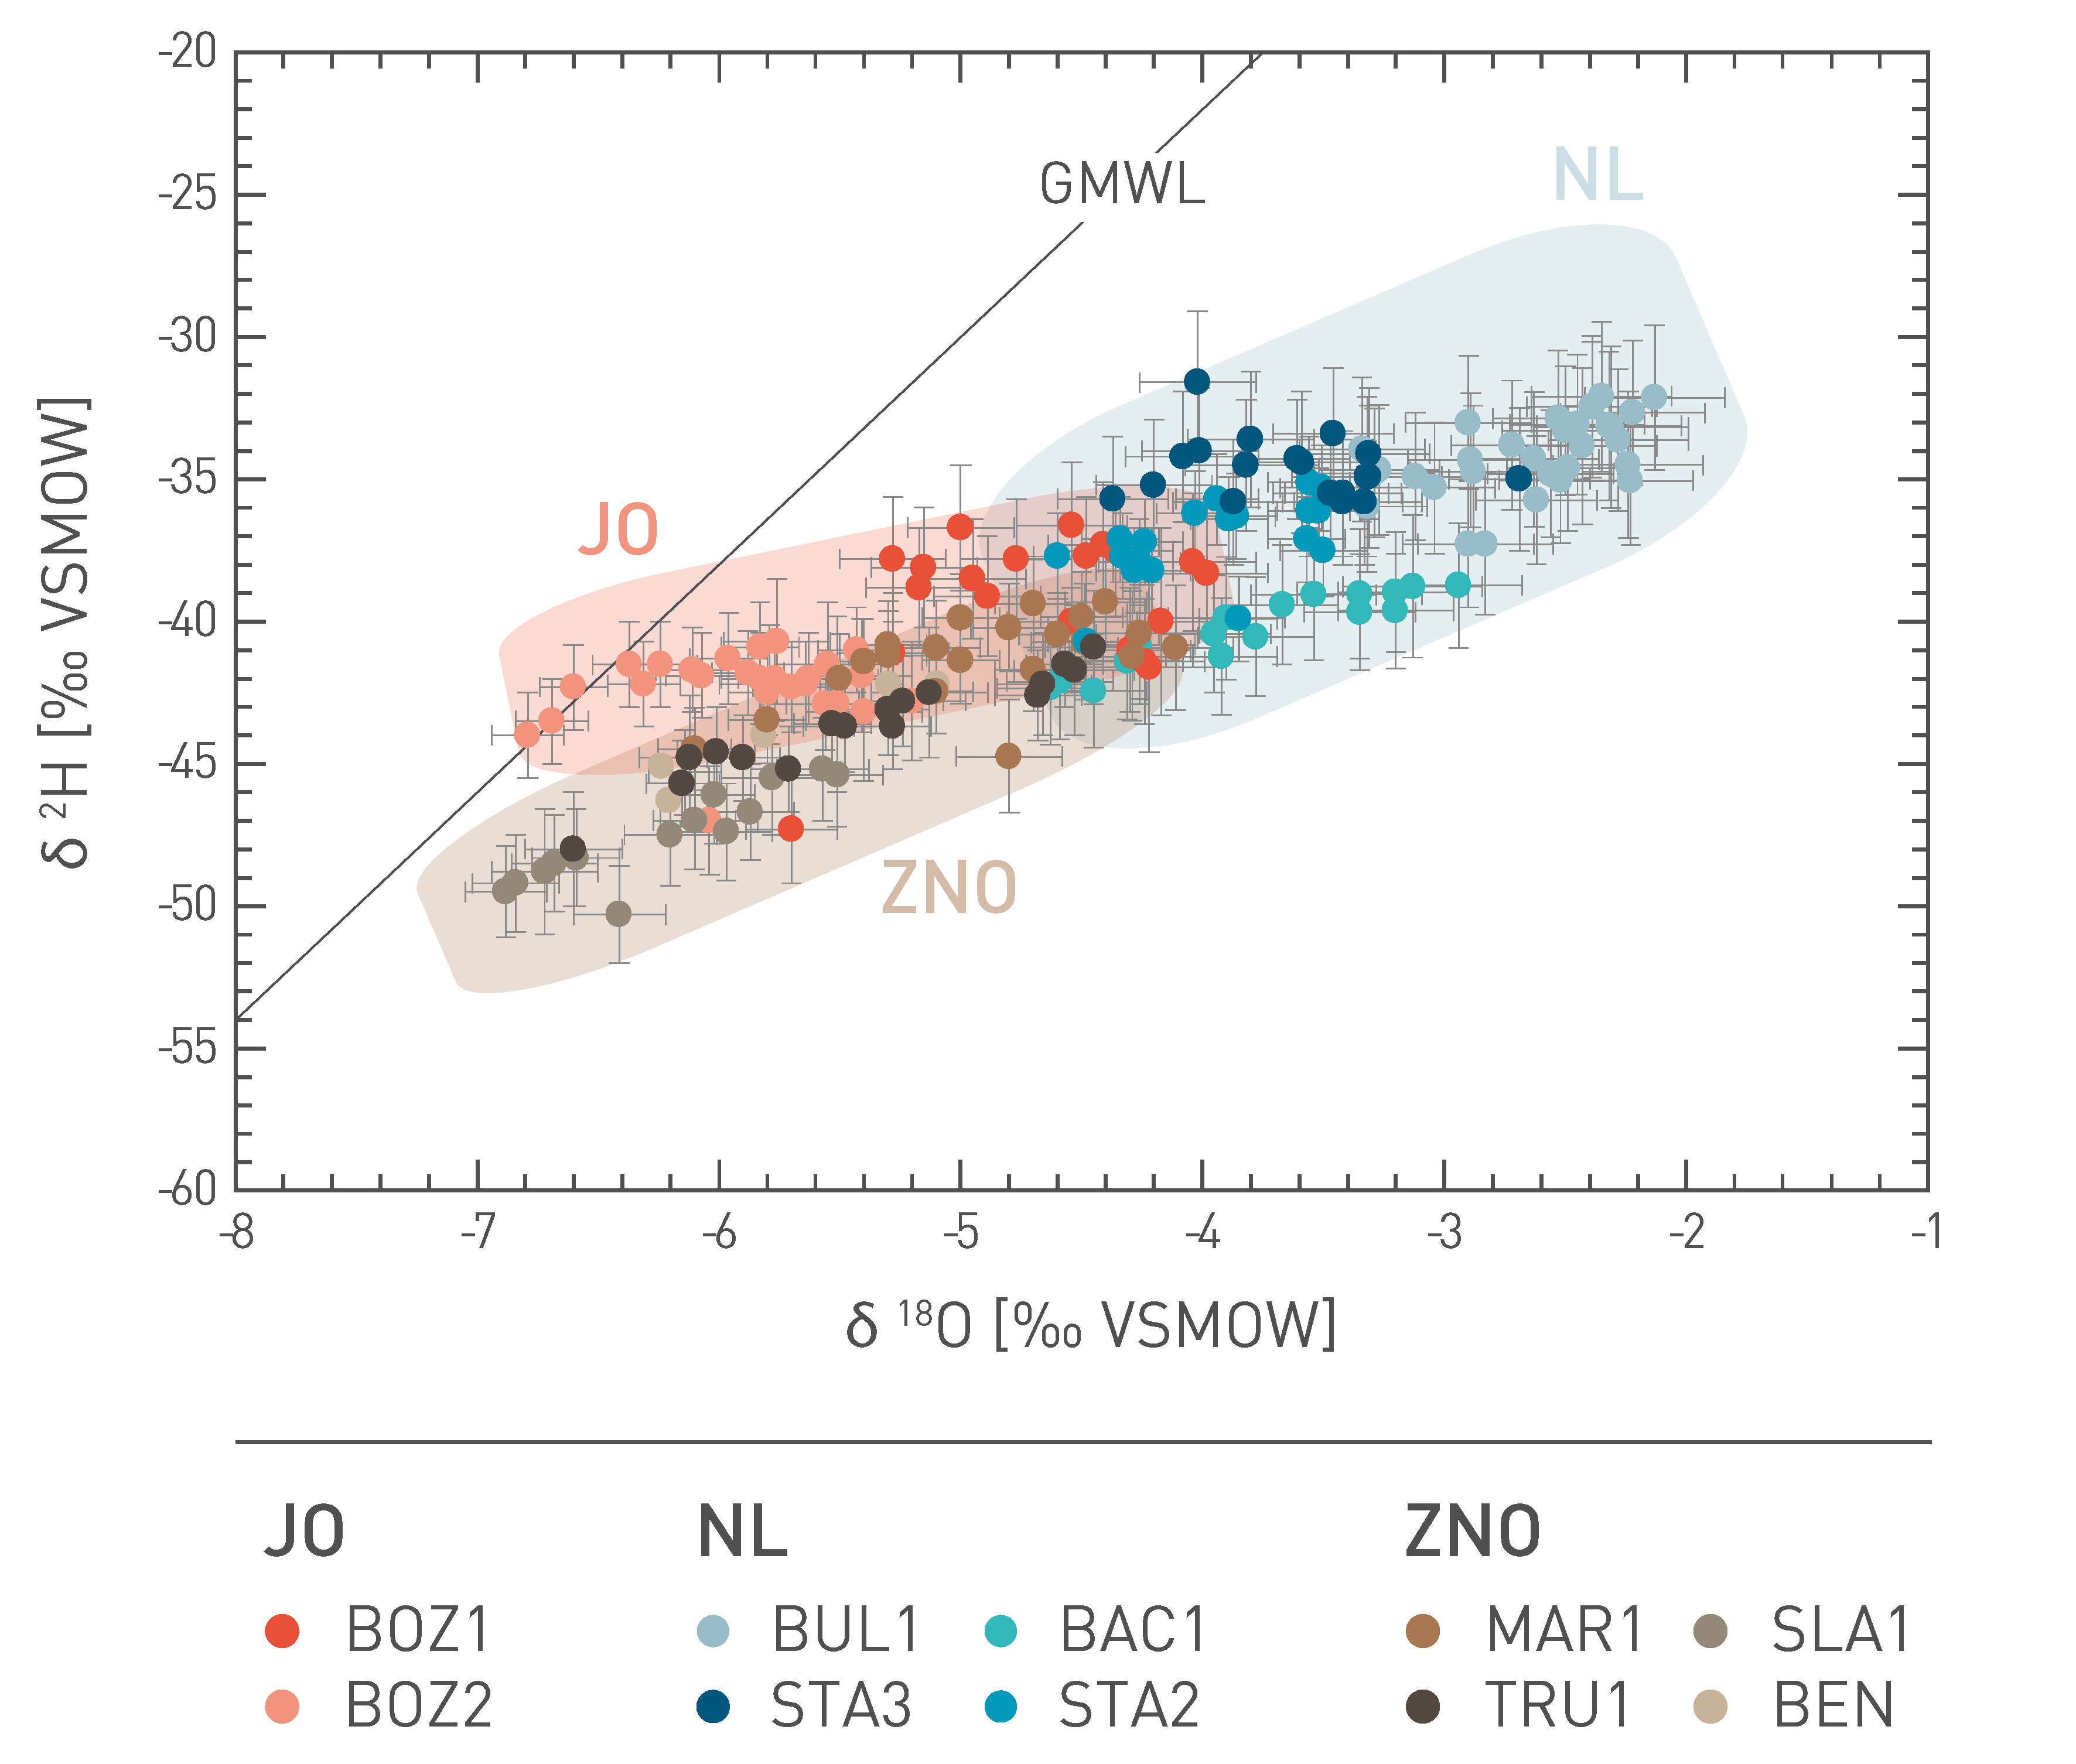
Fig. 4‑122:Signatures of stable isotopes in porewater of the Opalinus Clay in the different siting regions
For groundwater values, see Fig. 4‑121.
Results of modelling of the profiles of δ2H and δ18O
As noted in Section 4.6.1, modelling concentrated on the more recent evolution (the last ~ 10 Myr), starting from constant values with depth (δ2H) or values slightly decreasing with depth (δ18O) that match the trends in the central parts of the profile. The boundary values at each aquifer were then changed in a single step to present-day values (or, in a few cases only, in two steps, to account for observed trends). The times of the changes, that is the evolution times, were fitted for each aquifer in order to obtain a good match between simulations and measurements.
The simulations for pure diffusion match the data well, especially in the part between the Malm or Hauptrogenstein and Keuper aquifer, as shown for four examples in Fig. 4‑123. Evolution times in the range of ~ 1.5 – 3 Myr were obtained for the Malm aquifer in NL and ZNO (when ignoring the second step) or of 0.45 Myr for the Hauptrogenstein aquifer in JO of ~ 0.1 – 0.7 Myr for the Keuper aquifer (where present), and of ~ 0.02 – 0.15 Myr for the Muschelkalk aquifer (Tab. 4‑2).
Tab. 4‑2:Evolution times derived from the modelling of the δ2H and δ18O profiles
* Second step. ** Poorly constrained, no data in lower part.
|
Evolution times [Myr] based on modelling of the δ2H and δ18O profiles | ||||
|---|---|---|---|---|
|
JO BOZ2 |
NL STA2 |
NL STA3 |
ZNO TRU1 |
|
|
Malm aquifer |
1.6 |
2.65 |
2.15 0.15* |
|
|
Hauptrogenstein aquifer |
0.45 |
|||
|
Keuper aquifer |
0.15 |
0.1 |
0.65 |
|
|
Muschelkalk aquifer |
0.05** |
0.08 |
0.15 |
0.02 |
The derived evolution times for all aquifers depend to some degree on the initial conditions selected and the local diffusion coefficients (which are uncertain for the Bänkerjoch Formation above the Muschelkalk). However, in general, the simulations indicate that changes in the Malm occurred at earlier times than those in the Keuper, while the Muschelkalk boundary only changed comparably late in its history to present-day values.
These results are in line with those from earlier simulations for the BEN profile in the ZNO siting region (Gimmi et al. 2007), where diffusive evolution times of ∼ 0.55 Myr were estimated for the signature towards the Keuper. The estimated time for TRU1 in this work is well within the range of 0.2 − 1.5 Myr given by Gimmi et al. (2007) when considering various uncertainties for the less comprehensive dataset at BEN.
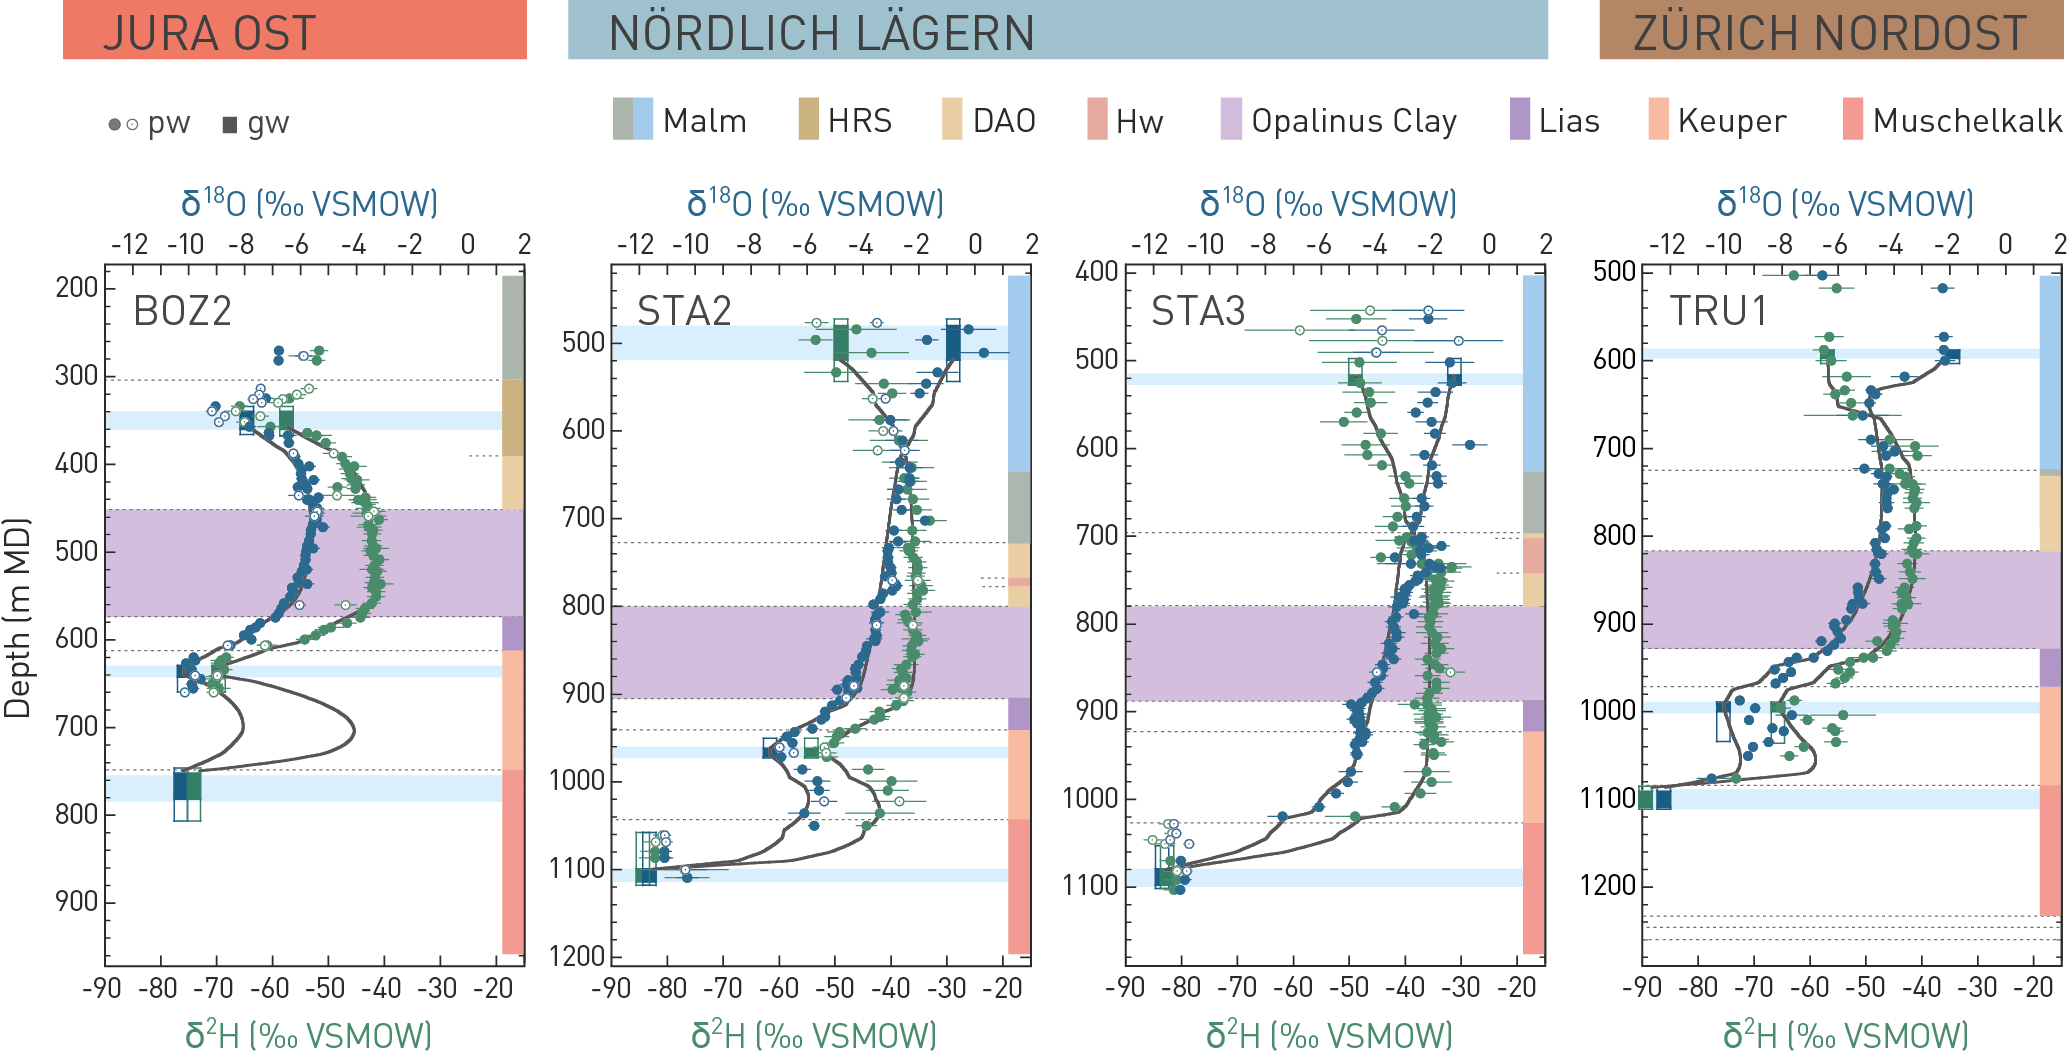
Fig. 4‑123:Comparison of measured and simulated profiles of stable water isotopes in BOZ2, STA2, STA3 and TRU1
The solid black lines show the simulation results. Porewater data were derived from diffusive isotope exchange experiments; open symbols: less reliable (potential artefacts or contamination with drilling fluid). Where groundwater could be sampled, open rectangles show packer intervals, closed rectangles and light blue bars most likely inflow zones. DAO: Dogger Group above Opalinus Clay, HRS: Hauptrogenstein, Hw: «Herrenwis Unit». The evolution times used for the simulations are shown in Tab. 4‑2. Light blue background indicates the location of the transmissive zone in the aquifers.
The example simulations demonstrate typical results for evolution times towards the aquifers. While specific evolution times derived for each profile and each aquifer vary to some degree (also depending on the assumed initial conditions and local diffusion coefficients), the observed general tendencies appear plausible. For instance, the evolution times for the Malm and Keuper signature in ZNO and NL could relate to the creation of new recharge and discharge zones related to the eastward migration of the Aare – Rhine catchment including diversion of the initially eastward flowing Alpenrhein through the Klettgau Valley (Section 3.4.5). Also, the variability of the local Keuper aquifer properties (Section 4.5.3.10) is reflected in the broad range of the evolution times. In addition, the hydraulic situation in the more western JO area is different from that in the more eastern regions, influenced by topography and the tectonic situation.
The tendency of having mostly longer evolution times for the Malm boundary condition, intermediate times for the Keuper boundary condition and shortest time for Muschelkalk appears also to be plausible. The short times derived for the Muschelkalk boundary condition could be related to the diversion of the Wutach River (Section 3.5) and infiltration of glacial melt water. However, the large uncertainty in the diffusion coefficients for the lowest part of the profile (anhydrite with possibly very low diffusion coefficients) propagates into large uncertainties for the Muschelkalk evolution times.