
The vertical stress Sv is estimated by integrating the bulk density of the drilled formations. Microhydraulic fracturing (MHF) tests were performed in vertical boreholes to provide quantitative information on the SHmin magnitude, and in a few cases also served to independently verify values of Sv from logs (Nagra 2024o). In comparison to previous stress testing campaigns (e.g. Nagra 2001), dry sleeve reopening (SR) tests on previously induced fractures were also performed to derive values of the SHmax magnitudes (Nagra 2024o for details).
From the 139 successful MHF tests in eight of the nine new boreholes and the following SR tests, 121 reliable SHmin magnitudes and 65 reliable SHmax magnitudes were estimated. In addition to the new tests, two measurements from the Benken borehole were also re-analysed (Nagra 2024o). This unique dataset from the three siting regions has increased the number of stress magnitude data by an order of magnitude since 2019 (Fig. 2‑3).
A representative example of the stress data obtained is shown for the STA3 borehole in Fig. 4‑77. The figure shows that values of SHmin are close to values for Sv in the shallow subsurface but become increasingly lower than Sv with greater depth. Similarly, SHmax values are greater than Sv closer to the surface while becoming lower than Sv as depth increases. This can be explained by topographic effects (Nagra 2024o).
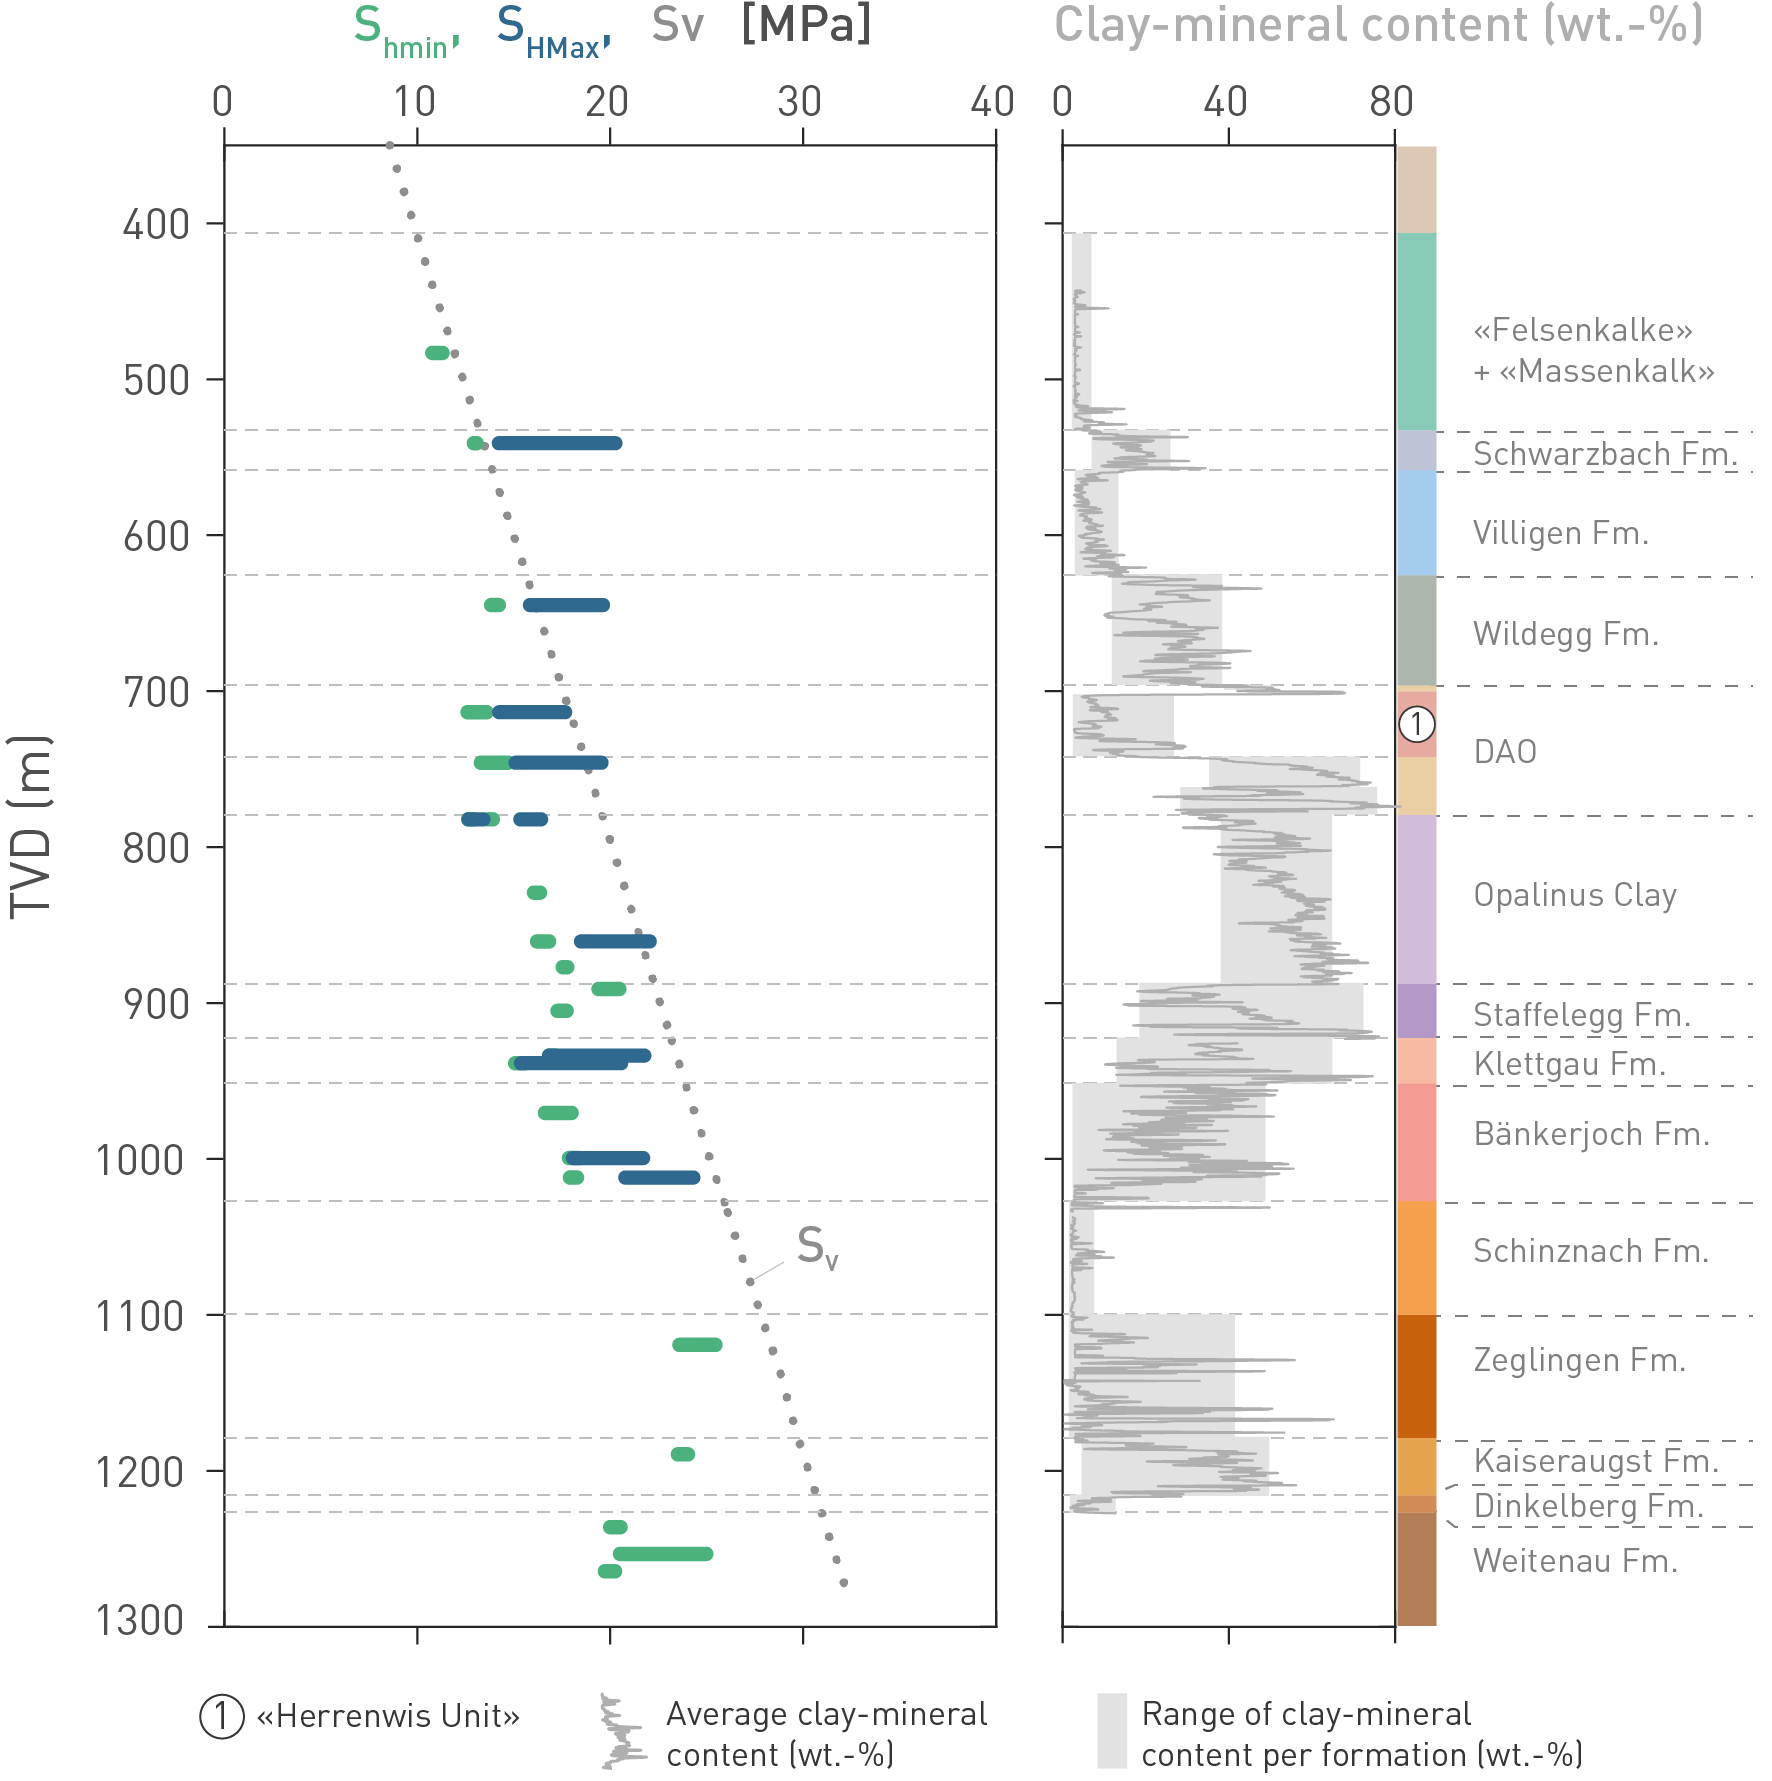
Fig. 4‑77:Stress magnitudes and comparison to clay-mineral content (proxy for layer stiffness)
Shown are data for the STA3 borehole (Nagra 2024o). Continuous line of average clay-mineral content is from Becker & Marnat (2024), and ranges per formation in grey represent the P5 to P95 interval according to Nagra (2024m). Fm.: Formation, DAO: Dogger Group above Opalinus Clay.
Hence, depth exerts an important control on the absolute stress magnitudes. It is noted that the value bands for SHmax (blue bars) are always wider than those of SHmin, because the method used to determine SHmax implies a range at least three times that of SHmin (Nagra 2024o).
Another important control on the stress magnitudes stems from mechanical stratigraphy. This is illustrated by the clay-mineral content in Fig. 4‑77 showing clear variations between formations. Formations with lower clay-mineral content, e.g. the limestones of the «Felsenkalke» and «Massenkalk» or the anhydrite-dominated Zeglingen Formation have a different gradient of SHmin (closer to Sv) than the clay-mineral-rich units of the Opalinus Clay and adjacent formations.
MHF and SR tests sample stresses of the formation on a metre scale. Hence, variability of material properties within the formation and relative contrasts between formations also impact the resulting stress magnitudes. This is highlighted in Fig. 4‑78, which summarises all obtained SHmin values as gradients of SHmin, i.e. magnitudes normalised by depth per formation and siting region. The figure indicates a relatively large variation of SHmin gradients in the Klettgau, Bänkerjoch and Zeglingen Formations. This is also consistent with the larger variation in stiffness compared to other formations (Fig. 4‑77). For the Bänkerjoch Formation two ranges were estimated to account for the bimodal nature of the data because of strongly contrasting bands of weak clay-rich rocks and stiffer anhydrites. The latter is also responsible for the Bänkerjoch and Zeglingen Formations standing out with some SHmin gradients above typical gradients for the vertical stress (24 to 25 MPa/km), whereas the Schinznach Formation exhibits consistently very low values. In the shallower formations above the Opalinus Clay, SHmin gradients tend to increase significantly, as effects of shallow burial superimpose the effects of mechanical layering, especially in the Malm limestones in the NL region, and the Hauptrogenstein and Wildegg Formation in JO.
The sketch in Fig. 4‑79 highlights how absolute depth and mechanical layering can exert a fundamental control on the stress field at different stages of tectonic loading in a highly simplified, alternating limestone and claystone sequence. With only gravitational loading (uniaxial strain condition) and assuming an elastic model, the horizontal stress Sh increases by u/(1- u)*Sv, where u is the Poisson’s ratio (e.g. Thiercelin & Plumb 1994). Since u is greater in the claystone than in the limestone, the gradient of Sh is smaller in the latter, leading to initially lower Sh values than for claystone at the formation boundaries (Fig. 4‑79a). However, with lateral tectonic loading (e.g. Miocene times, Section 3), Sh grows proportionally to the Young’s moduli in each layer, leading to much larger stress increments in the limestone than in the claystone for the same amount of lateral shortening (Fig. 4‑79b). With further tectonic loading, this initially leads to a homogenisation in stress magnitudes across the different lithologies, and eventually to a reversal of the initial situation, where the Sh values in the limestone are greater than those in the claystone. Fig. 4‑79c also highlights that Sh can exceed Sv in the shallow subsurface, as is observed with the high gradients in the Malm limestones in the NL siting region and in the Hauptrogenstein in the JO siting region (Fig. 4‑78). The simplified model also illustrates that Sh in competent layers at greater depth remains lower than Sv, even with stronger tectonic loading, as the depth effect still dominates, i.e. the shift of Sh by tectonic loading is less than the difference from initial gradients.
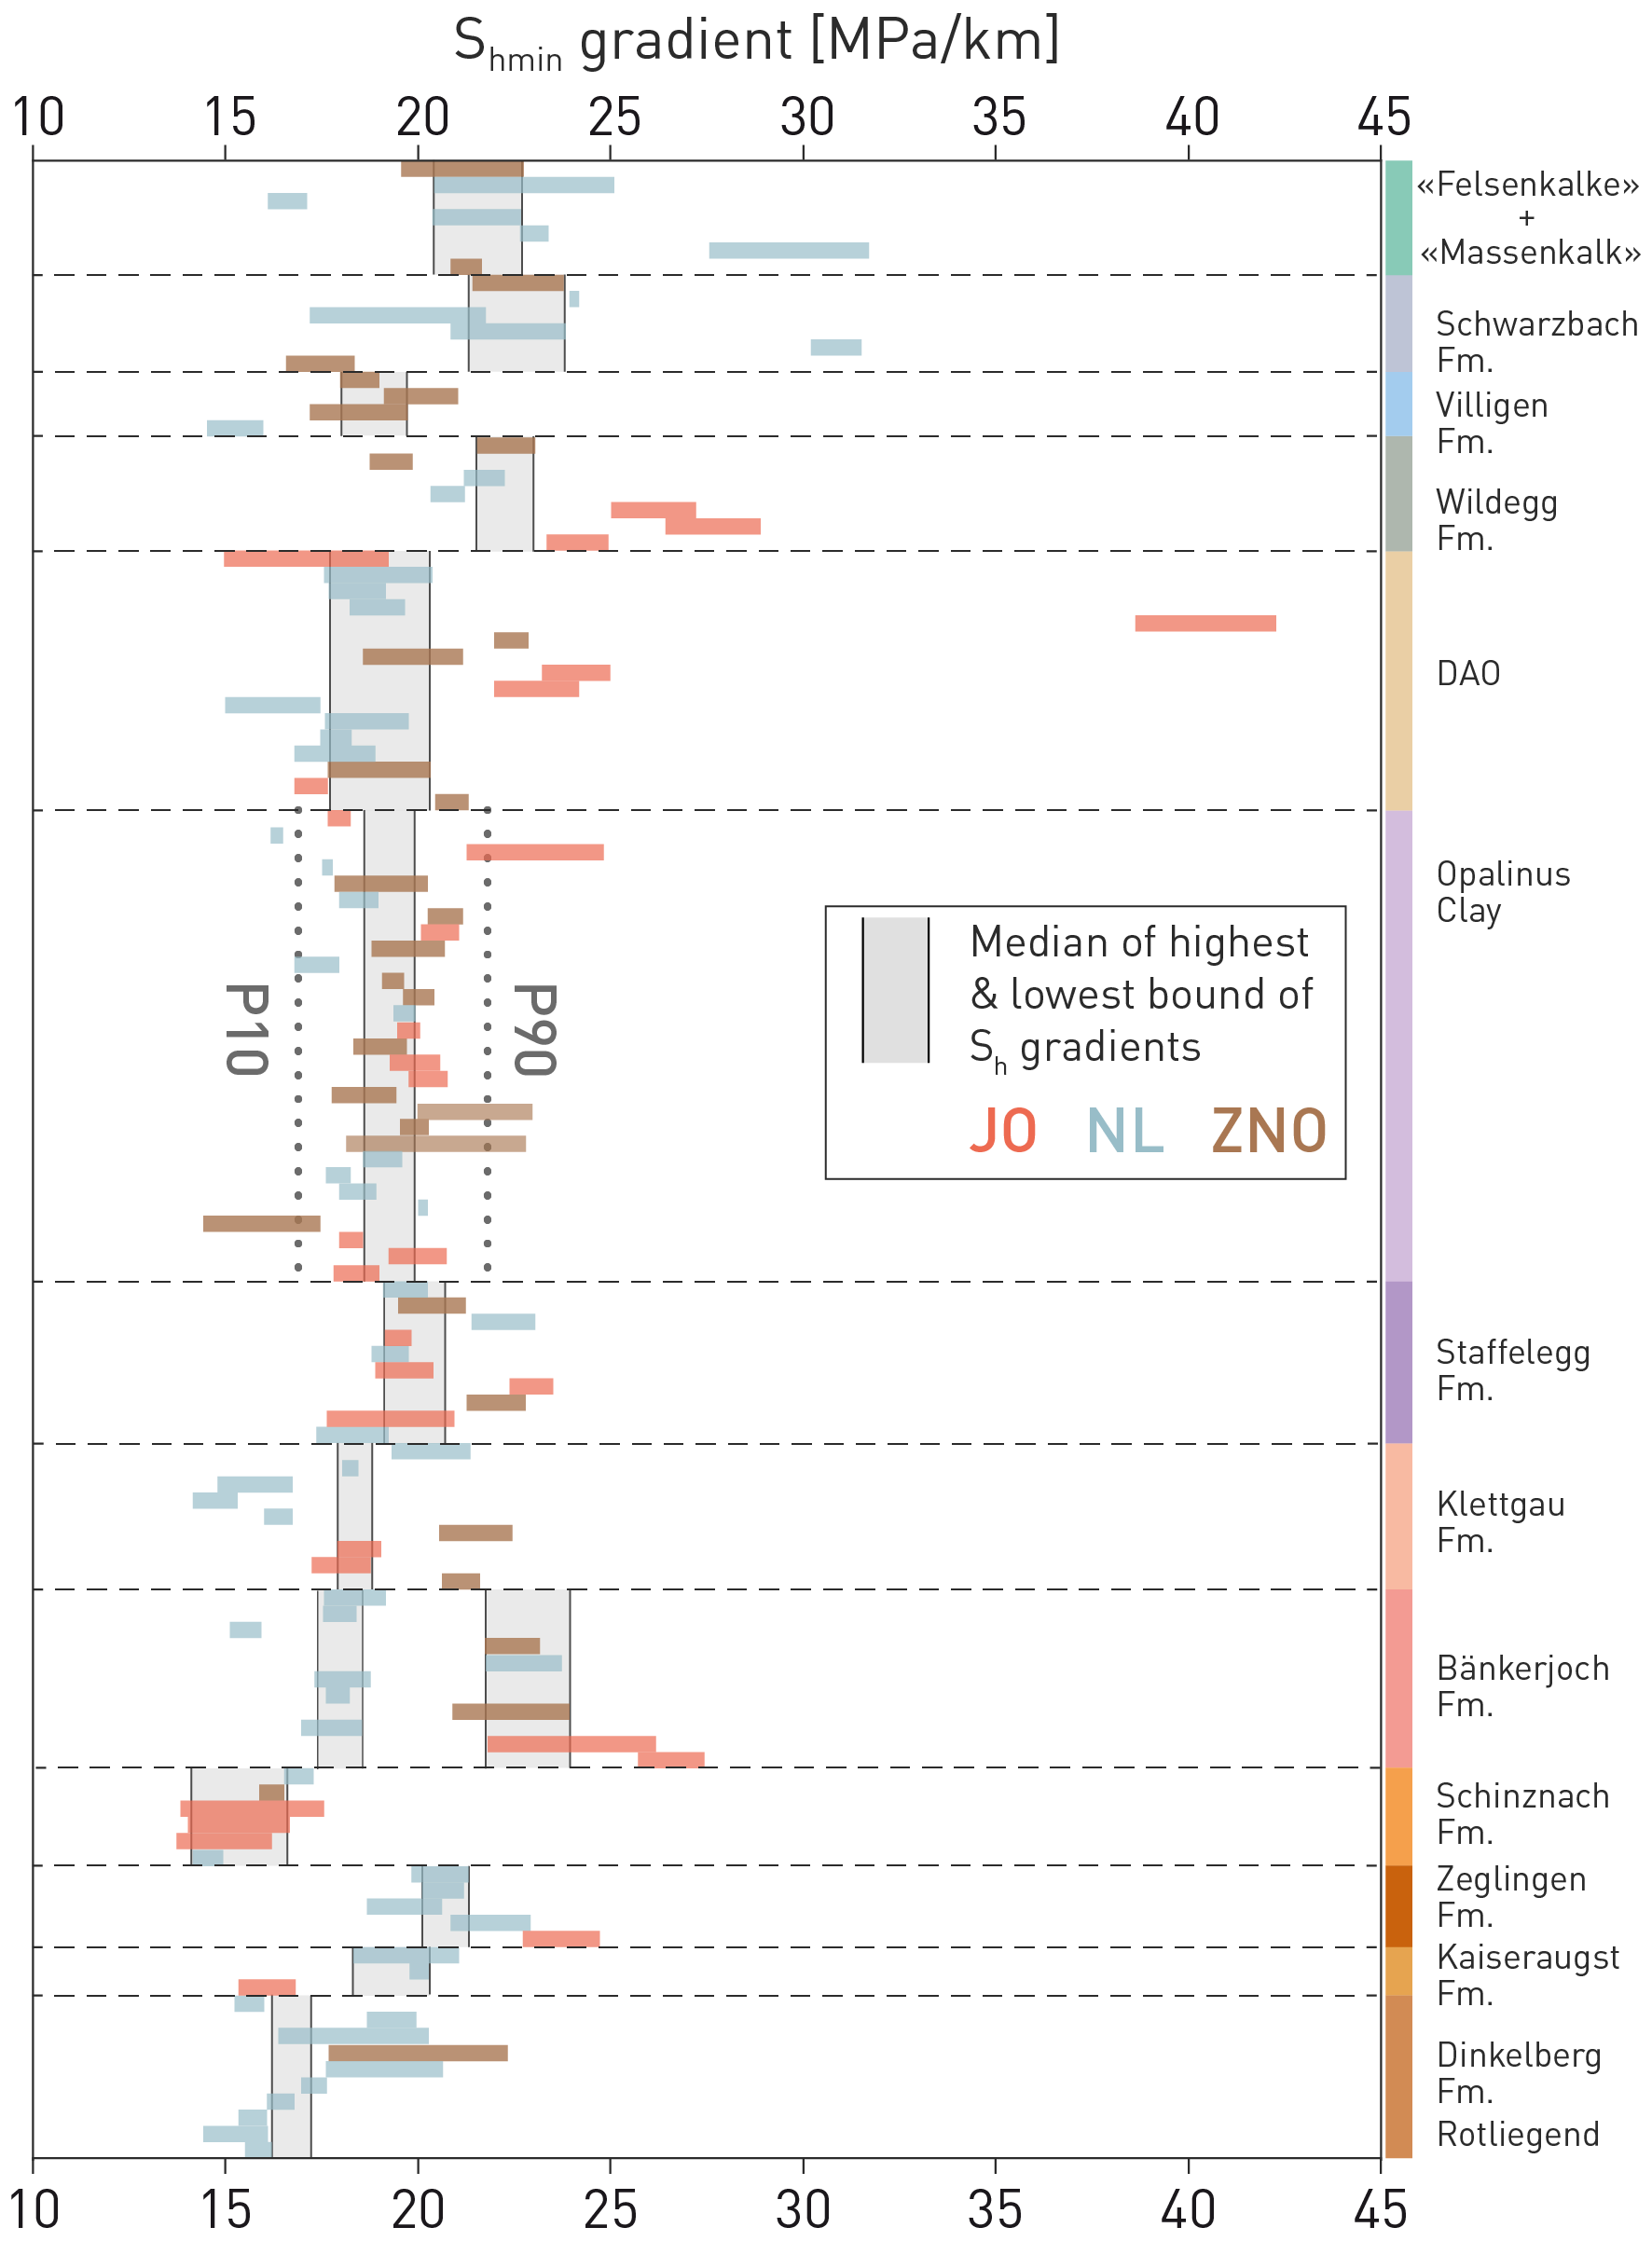
Fig. 4‑78:Control of mechanical layering on stress magnitude data
This figure displays the gradients of 121 reliable measurement of SHmin from MHF tests from the TBO campaign and two reanalysed MHF tests for the Opalinus Clay from the Benken borehole. Data are grouped by the three siting regions and sorted according to the distance to the top of each formation. Grey vertical bars show the range between the medians of the upper and lower bounds of the SHmin gradients for each formation. For the Bänkerjoch Formation two ranges are estimated. The vertical axis does not show absolute depth, just relative depth. The very high gradient of one measurement in JO in the Upper Dogger comes from a very stiff section of the Hauptrogenstein and is not representative of the entire formation.
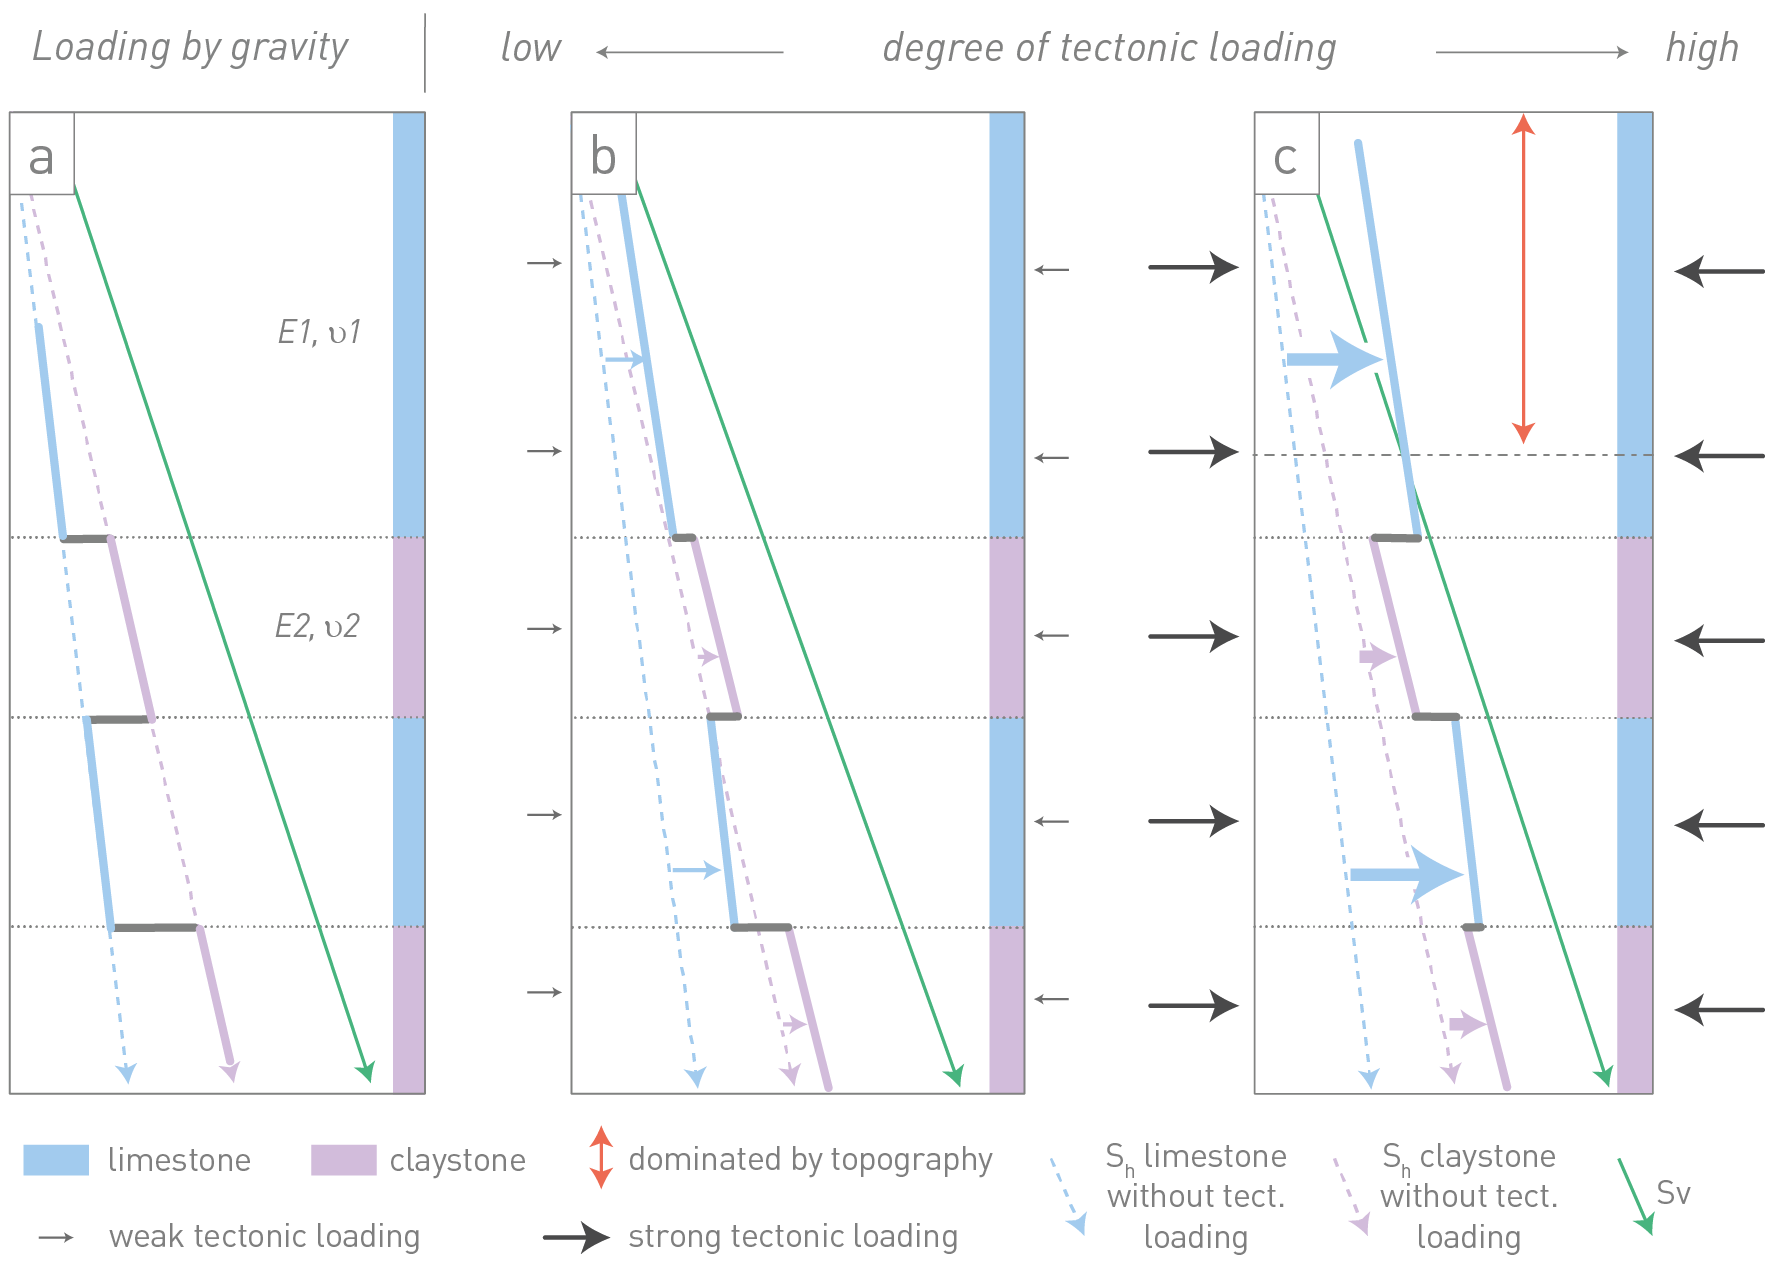
Fig. 4‑79:Conceptual sketch of the evolution of the horizontal stress magnitude Sh in a mechanically layered limestone – claystone sequence
(a) Overburden stress (Sv) is translated laterally through Poisson’s ratio, which is higher in claystones than in limestones (ν2 > ν1), leading to a steeper gradient (higher Sh values) in claystones in comparison to limestones. (b) Uniform horizontal tectonic loading leads to larger Sh increments in limestones because of larger stiffness (E1 > E2), and eventually to homogenisation of Sh values across the layers. (c) Further tectonic loading can lead to higher Sh values in limestones than claystones, and to Sh > Sv in the shallow subsurface.
In the Opalinus Clay, the stress measurements show a consistent linear trend with increasing depth, irrespective of the siting region (Fig. 4‑80). In other words, the gradient of SHmin is similar for all sites. The magnitude of SHmin in the Opalinus Clay is clearly lower than Sv, and the ratios of SHmin/Sv range between approximately 0.6 and 0.9. Measurements close to or outside the bounds depicted in Fig. 4‑80 can be explained as local outliers and are discussed in Nagra (2024o). Note that MHF and SR tests sample on a metre scale and thus Sv is generally the largest of the principal stress magnitudes in the Opalinus Clay, followed by SHmax and SHmin. Given the larger bandwidth of SHmax, it cannot be ruled out that in some cases SHmax reaches a value similar to Sv or, in rare cases, even larger than Sv. Overall, this translates into a stress regime that is dominated by normal faulting to strike-slip faulting in the Opalinus Clay.
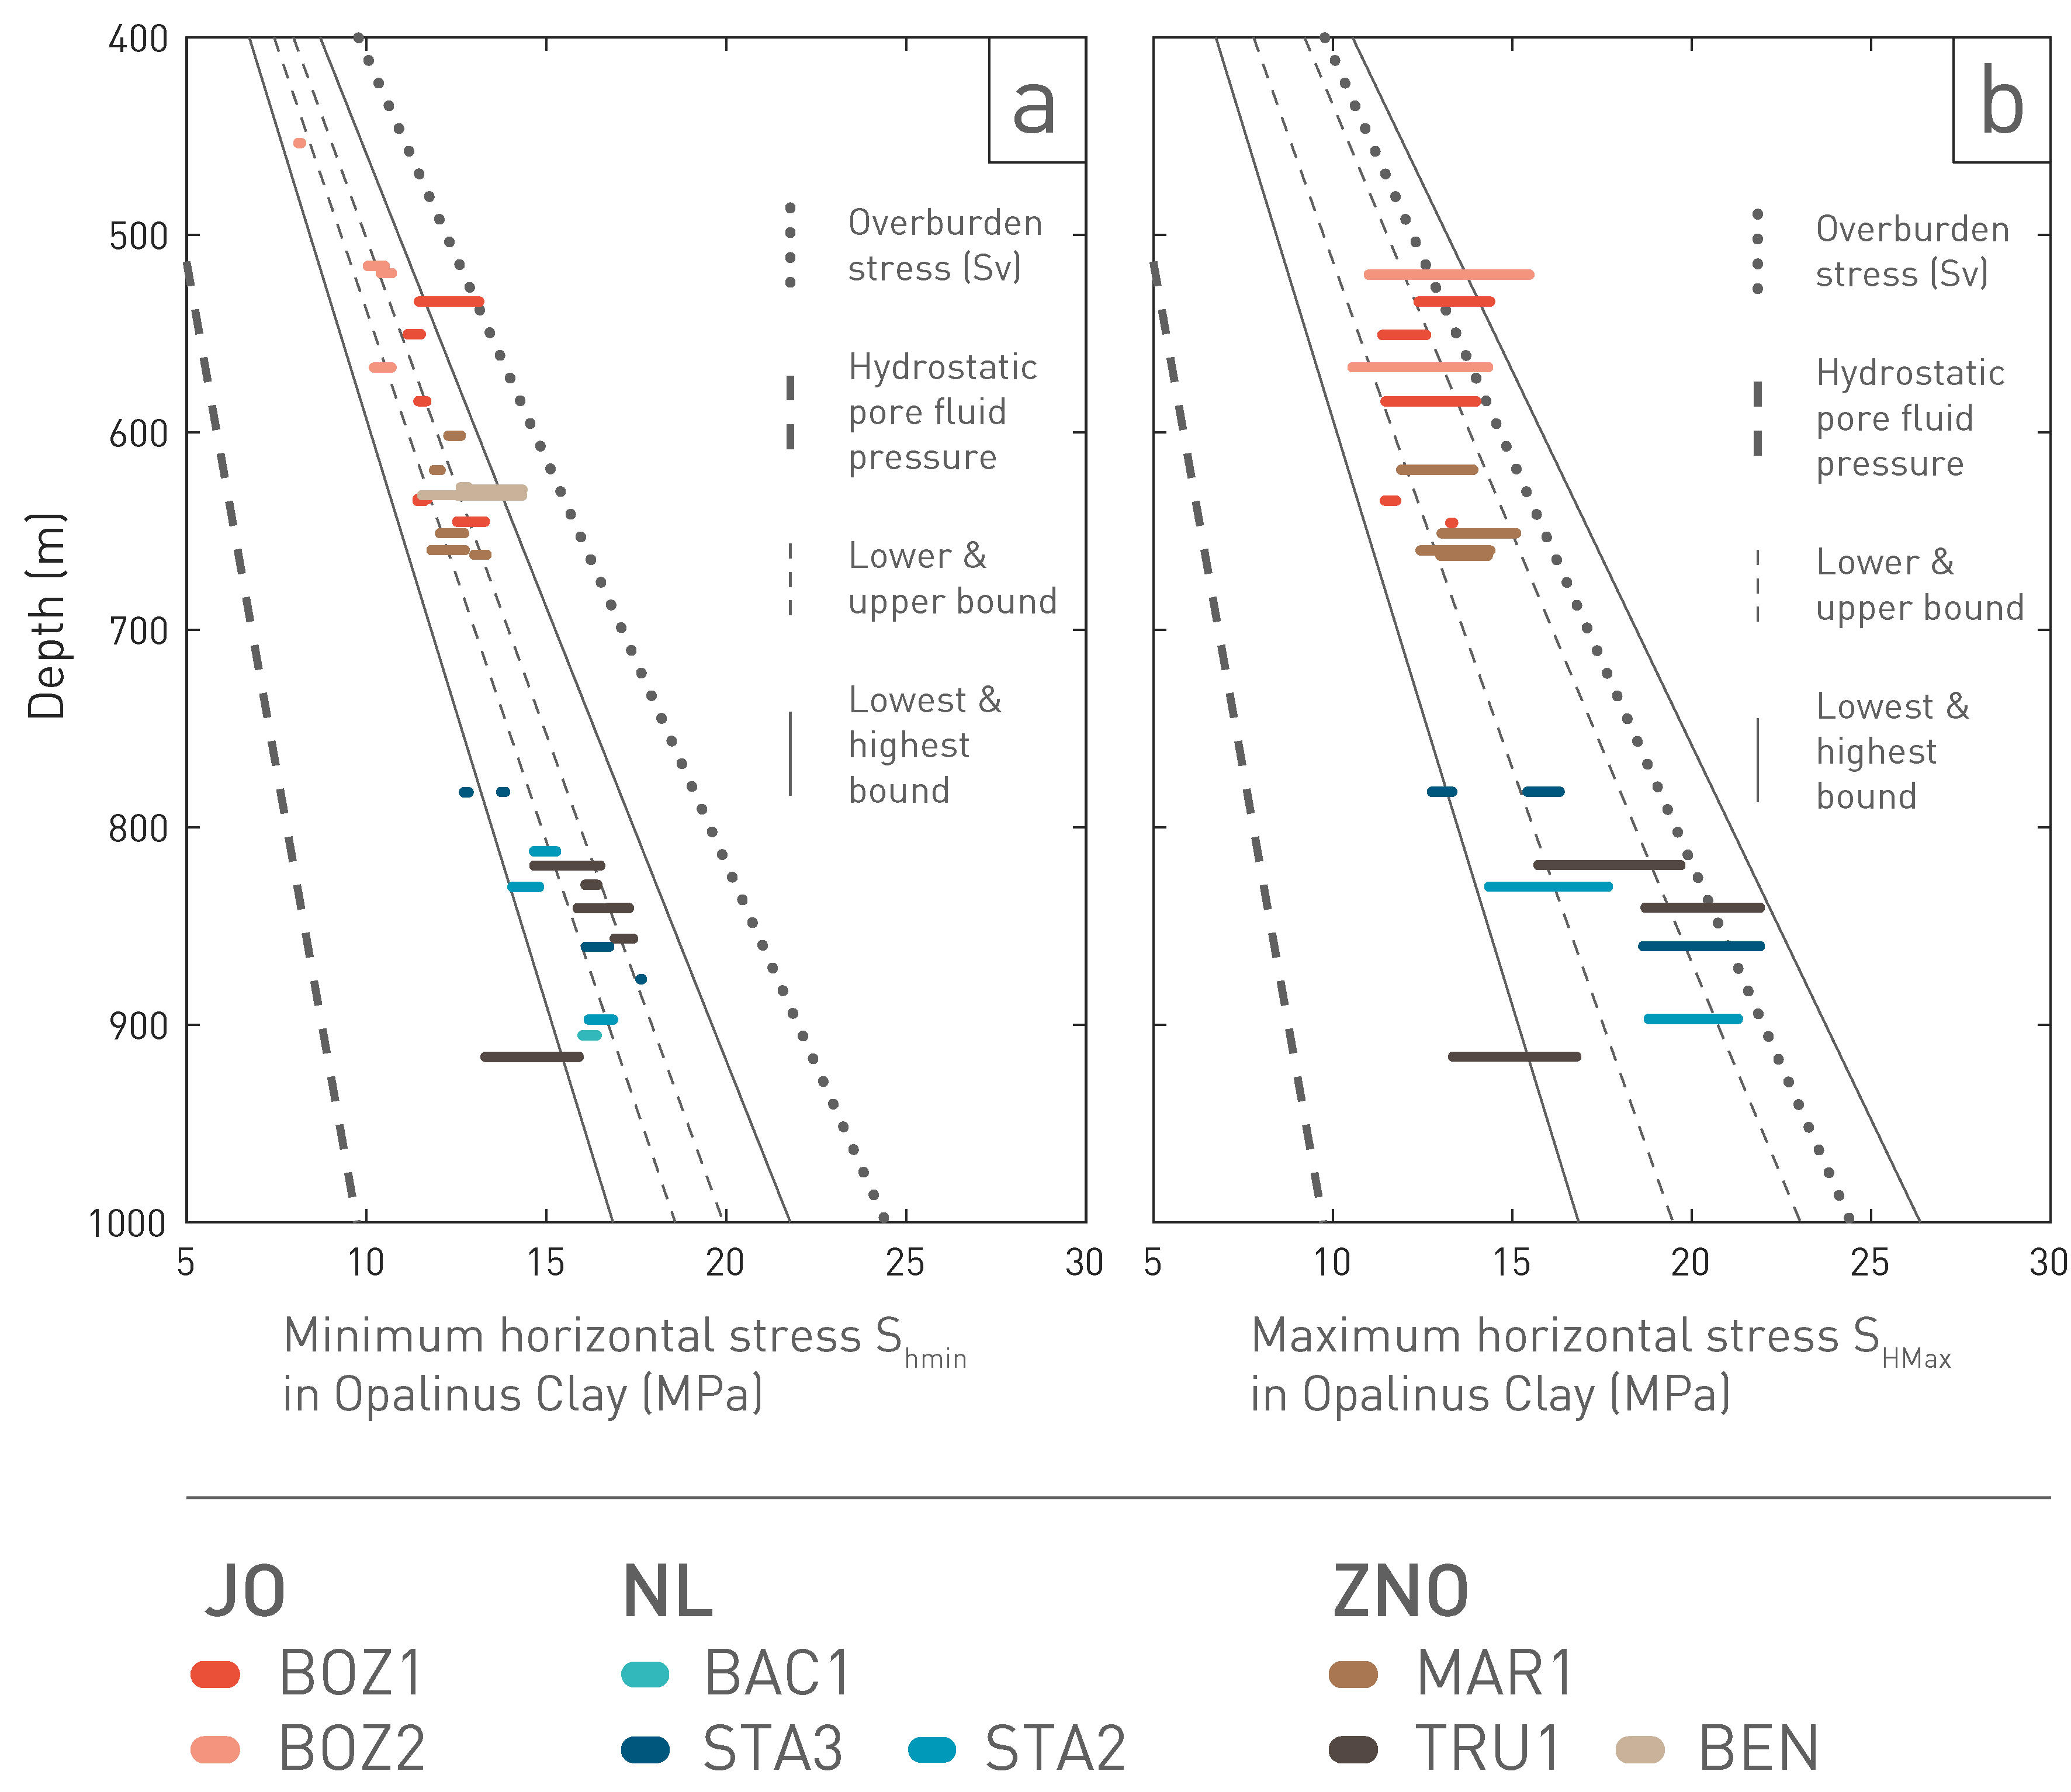
Fig. 4‑80:Compilation of stress magnitude data in the Opalinus Clay across siting regions
Bars denote values of SHmin (a) and SHmax (b) for the various stations including the value range from test interpretation. Lower and upper bounds refer to the median of the lower and upper values of the estimated range, and lowest and highest bounds to the P10 and P90 percentile range of all measurements. Pore fluid pressure and vertical stress Sv are approximated with constant densities (1'000 kg/m3 and 2'450 kg/m3, respectively).