
As shown in the previous section, the siting regions are located away from major deformation zones and are bounded by regional fault zones (Section 4.3.3, Fig. 4‑54). The central part of all the siting regions is characterised by gently SSE-dipping to flat-lying Mesozoic strata (Fig. 4‑56, Fig. 4‑57, Fig. 4‑58, and Fig. 4‑59). The central areas are typically several square kilometres in size.
In the following section, the inventory of structures encountered in the siting regions is described from west (JO) to east (ZNO). The focus is on the interpretation of the seismic reflection data and the data from retrieved core material.
Jura Ost
Within Jura Ost, the Jura Main Thrust and the Mandach Thrust delimit the southern and the northern border of the siting region, respectively (Fig. 4‑54, Fig. 4‑56, Fig. 4‑61). In between, the Mesozoic units form a less deformed block of gently SSE dipping strata (Diebold et al. 2006). Fault trace maps based on the interpretation of 3D seismic reflection data (Fig. 4‑61) show a limited number of discrete, seismically mappable faults in the less deformed block. Furthermore, they show a higher number of fault segments at the Near Top Muschelkalk Group horizon compared to the Near Top Lias Group and Top Opalinus Clay horizons (Fig. 4‑61). Similarly, fracture frequency measured in the BOZ1 and BOZ2 boreholes shows higher values in the mechanically competent units (e.g. Muschelkalk Group) and lower ones in the less competent units (clay-mineral-rich units, e.g. Opalinus Clay). Small-scale faults (referred to as fault zones in Nagra (ed.) 2022a and 2022b, Dossier V) were encountered predominantly in the Triassic units (9 out of 16 in BOZ2 and 18 out of 30 in BOZ1, Fig. 4‑61). The observation of a higher number of low-angle small-scale faults in the Triassic evaporites supports the concept of a décollement horizon within the Triassic evaporites allowing strain from the Alpine orogeny to be transferred NNW-wards.
Of the micro faults observed in the two boreholes 69% show reverse shear sense indicators. Normal faulting was described for 27% of the micro faults, whereas strike-slip dominated movement was found in 4% of the cases (Fig. 4‑61). The predominance of thrust-related structures encountered in the boreholes is associated with the shortening related to the formation of the Jura Fold-and-Thrust Belt overprinting the precursor geological history.
The Jura Main Thrust, which is exposed in the southernmost portion of JO, represents the northern boundary of the Internal Jura (Fig. 4‑60). As it is located close to the margin of the 3D seismic perimeter, the fault geometry is not well imaged within the 3D seismic volume; therefore, its interpretation is based on regional 2D seismic reflection lines and surface mapping (Fig. 4‑61). The Jura Main Thrust consists of an imbricate fan soling out in the Triassic evaporites (Fig. 4‑56). It accommodated 2 to 5 km of shortening during Jura-related folding and thrusting, as estimated from balanced geological sections. These also show that the shortening decreases towards the east (Jordan et al. 2015). The Jura Main Thrust is roughly located over the southern border fault of the western segment of the Konstanz – Frick Trough (Diebold et al. 1991, Madritsch et al. 2018). East of JO, the Lägern Anticline, located south of NL, represents the eastern continuation of the Jura Main Thrust (Fig. 4‑60).
The Mandach Thrust is known from surface mapping (Diebold et al. 2006, Bitterli-Dreher et al. 2007). It is located approximately 6 km north of the Jura Main Thrust and strikes roughly E-W. It can be traced at the surface for ~ 15 km (Diebold et al. 2006, Bitterli-Dreher et al. 2007). In the fault trace maps obtained from seismic reflection data, fault traces associated with the Mandach Thrust can be mapped up to the Near Top Lias Group but not above, mainly due to near-surface effects altering the seismic reflection image (Fig. 4‑61; Nagra 2024a). The Mandach Thrust is interpreted as a thrust ramp splaying out from the Muschelkalk Group evaporite décollement (e.g. Laubscher 1985, Nagra 2019b). Consequently, the strata above the décollement and south of the Mandach Thrust are considered as detached (i.e. part of the External Jura). About 500 m of shortening was accommodated by the Mandach and the Mettau Thrusts located further to the north during folding and thrusting of the Jura (Fig. 4‑60; Malz et al. 2020). The Mandach Thrust is located along the northern edge of the Paleozoic graben. The northern boundary fault of the Konstanz – Frick Trough within JO also offsets the Base Mesozoic unconformity, as a result of Paleogene extensional reactivation (Laubscher 1986). The step below the décollement level (i.e. Muschelkalk evaporites) appears to have localised later deformation, in particular by controlling thrust ramp development at this site (Fig. 4‑62).
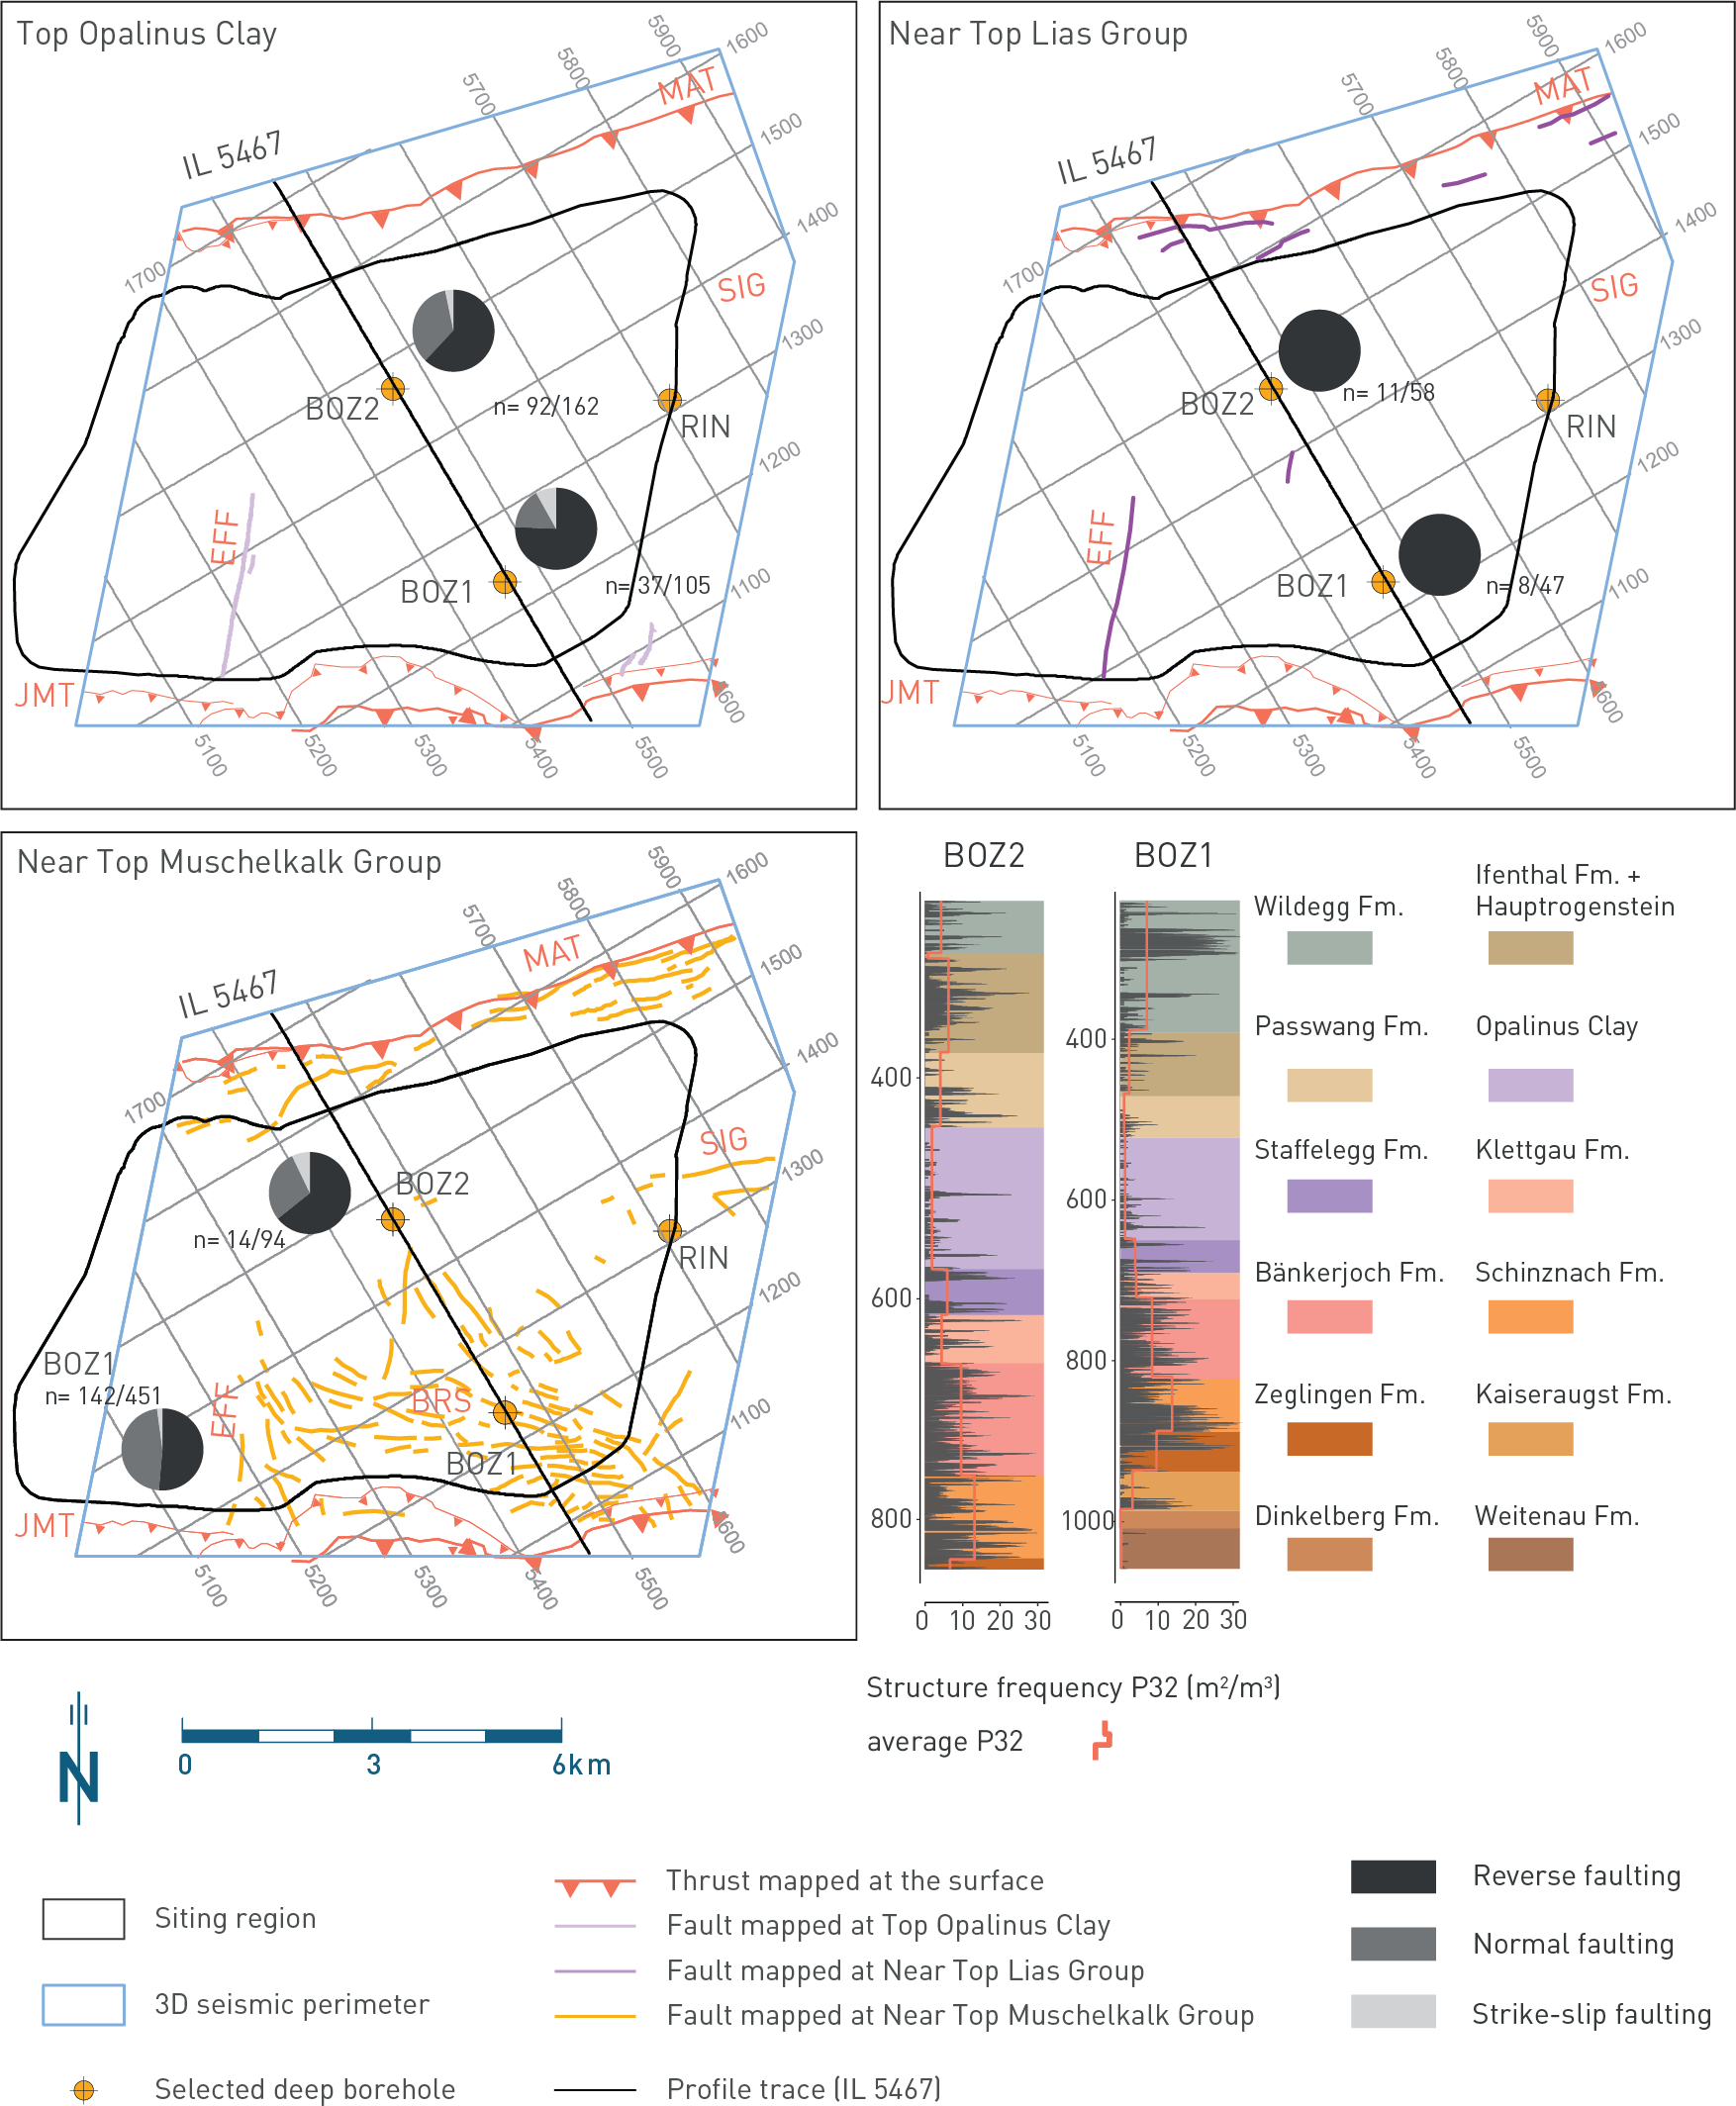
Fig. 4‑61:Fault map for JO (shown on three stratigraphic levels) and fracture frequencies in the recent deep boreholes
Fault maps based on seismic reflection interpretation reported in Nagra (2024a). Pie charts show the distribution of shear sense indicators within the Opalinus Clay, the Lias Group and the Muschelkalk Group, respectively. The numbers after 'n=' represent the total number of micro faults with shear sense indication ratio to total number of micro faults. Reverse faulting encompasses all dip-slip upward movements. P32 values refer to the fracture area in a unit volume, i.e. the intersection area of the plane with the cylindrical core and, as such, represents a non-directional intrinsic measure of the degree of rock mass fracturing, incorporating both a frequency measure and a fracture-size component (Ebert & Decker 2019, Dershowitz 1985, Dershowitz & Herda 1992). MAT: Mandach Thrust; SIG: Siggenthal Anticline, EFF: Effingen Fault: JMT: Jura Main Thrust, BRS: "Brugg Strukturzone".
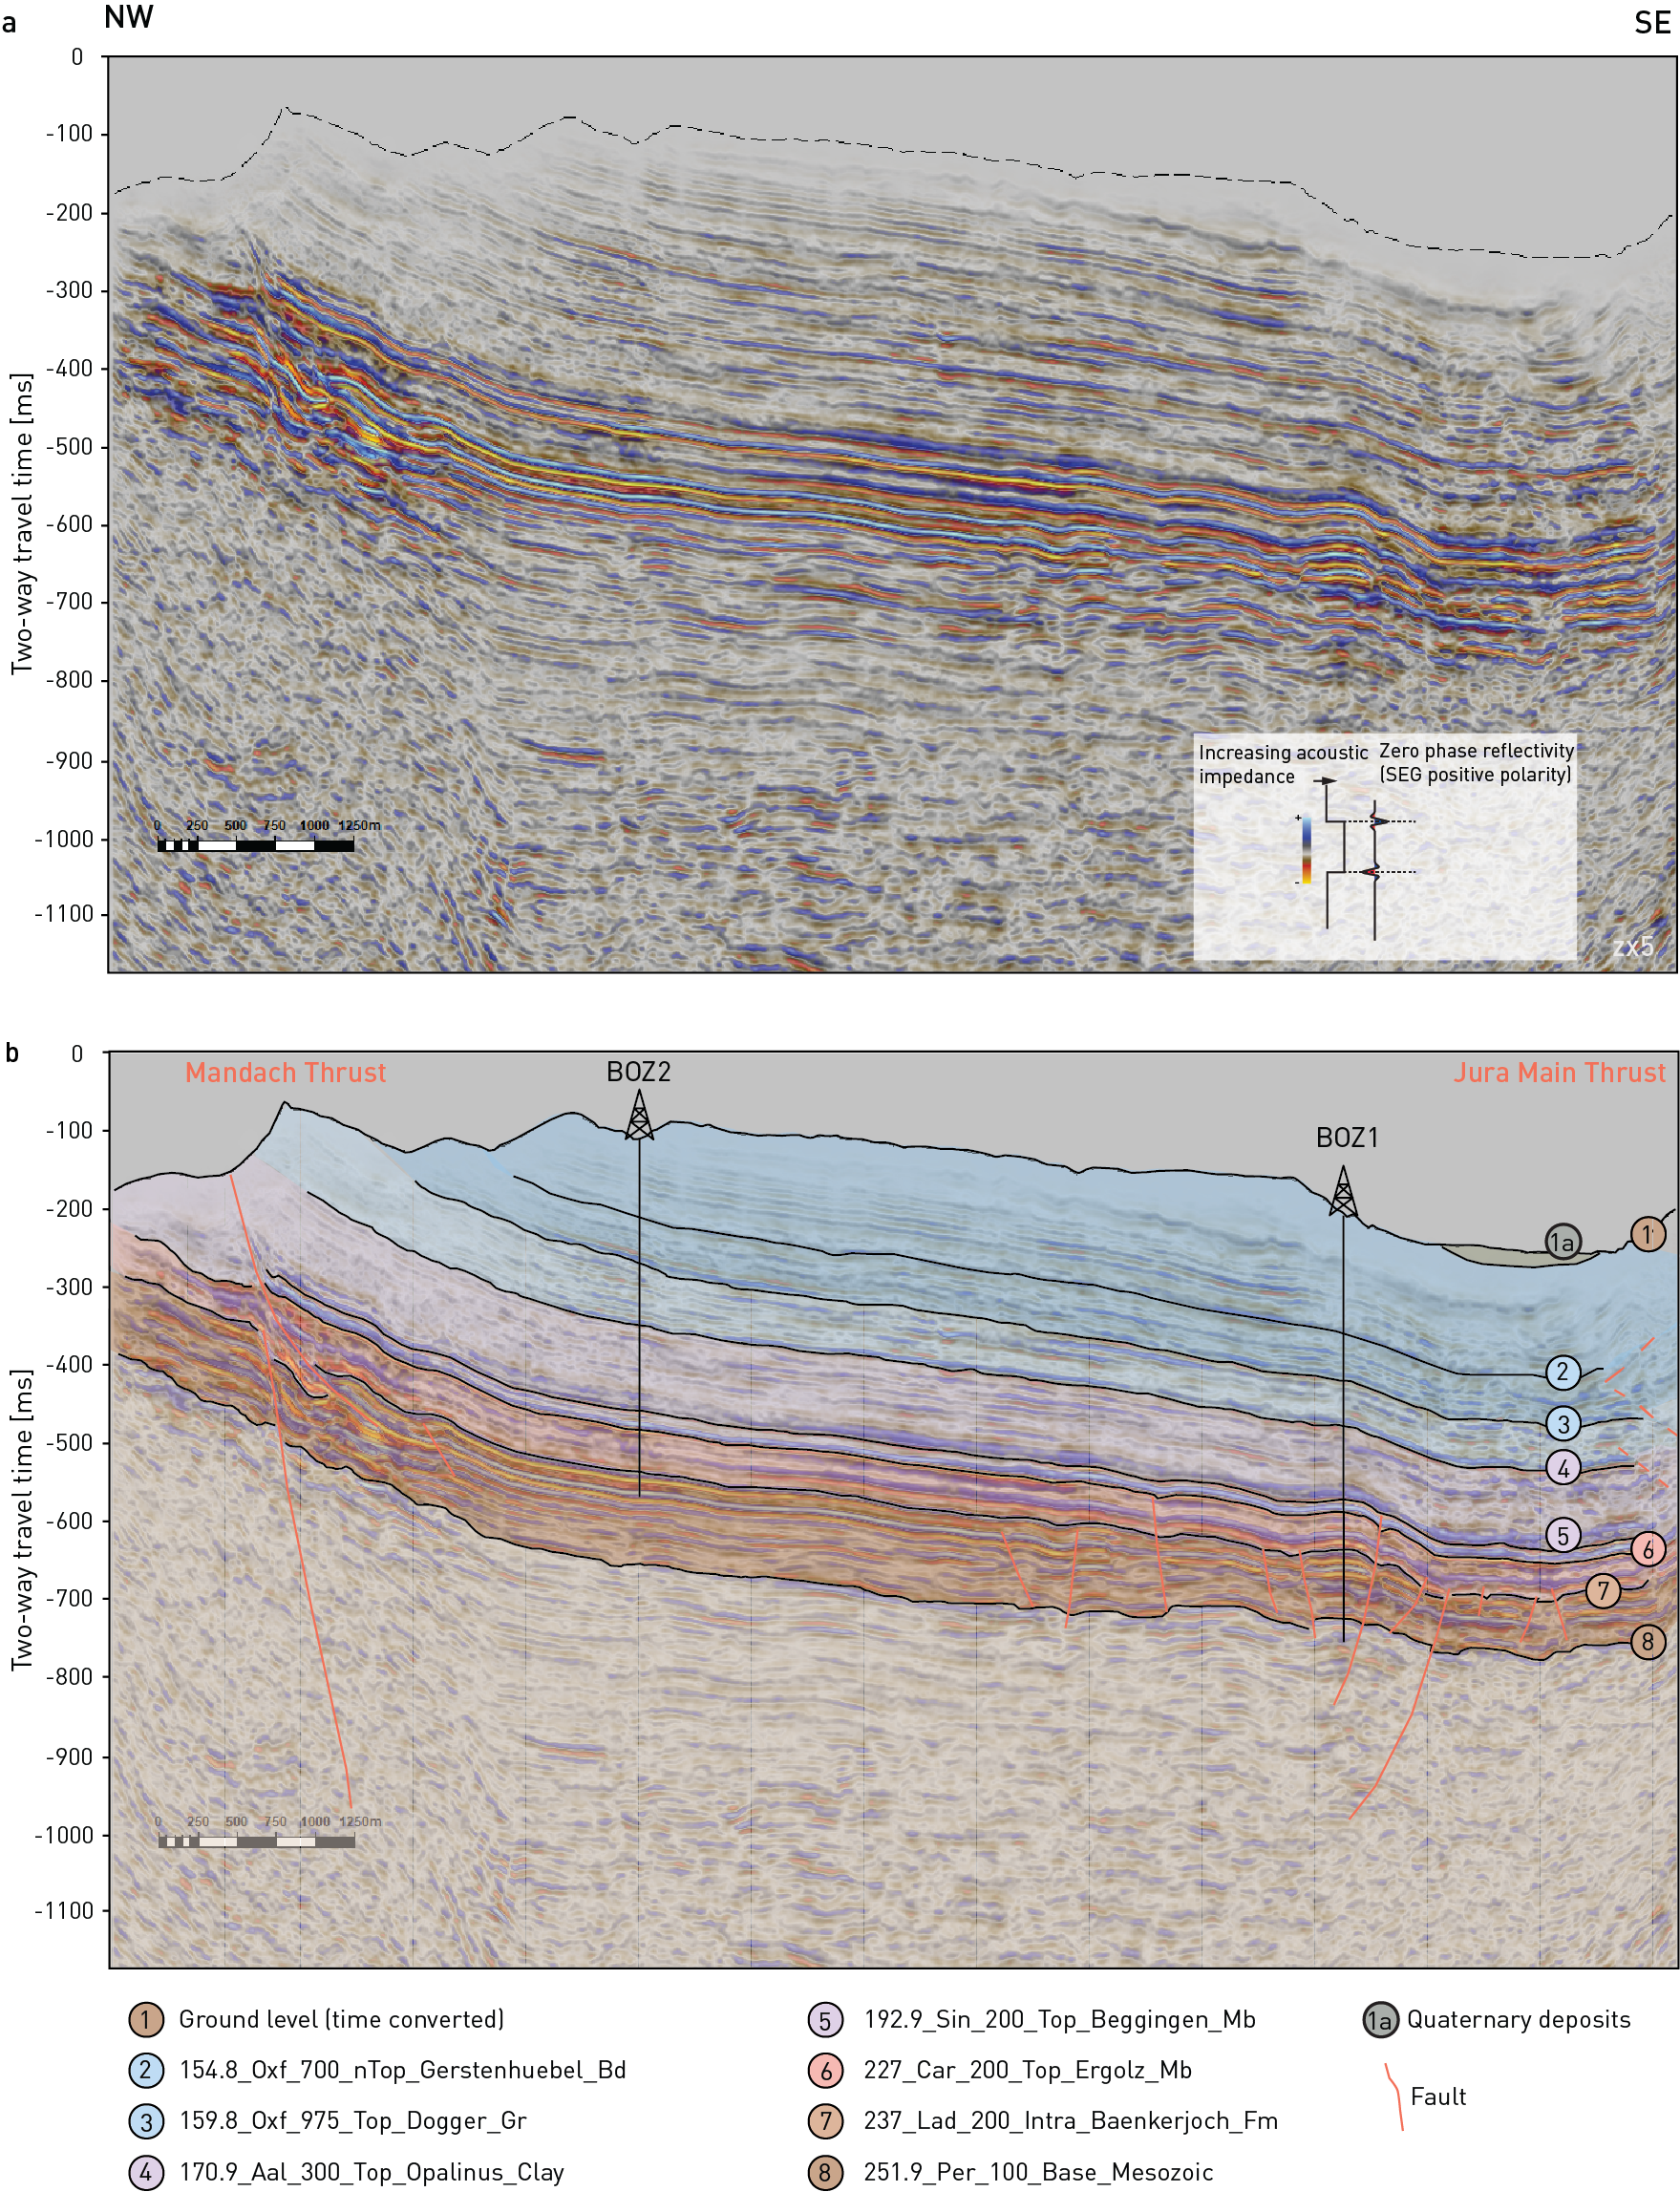
Fig. 4‑62:NW-SE cross-section in time domain extracted from 3D seismic reflection data through Jura Ost
View is along acquisition inline 5467, modified after Nagra (2024a). (a) Uninterpreted. (b) Interpreted. Note that the recognition of fault signatures within the Opalinus Clay is strongly hampered by the presence of multiples. The vertical axis was stretched 5 times (Z × 5). Seismic display is PreSTM-ref reflectivity with an overlay of relative acoustic impedance. Profile trace shown in Fig. 4‑61. Bd: Bed; Gr: Group; Mb: Member; Fm: Formation.
In the easternmost sector of JO, the western termination of the Siggenthal Anticline occurs between the Jura Main Thrust and the Mandach Thrust (Fig. 4‑61; Bitterli-Dreher et al. 2007). This structure continues – and is well exposed – east of the 3D seismic perimeter. It is a north-vergent anticline associated with a thrust ramp rooting in the Triassic evaporites (Nagra 2019b, 2024a). No major Paleozoic structures occur beneath this structure, and nucleation does not appear therefore to be controlled by inherited structures underlying the décollement (Nagra 2024a, Madritsch et al. 2024). Seismic reflection interpretation in the NE corner of JO is hampered by data quality inhibiting a more detailed analysis (Nagra 2024a). Seismically mappable fault segments associated with the Siggenthal Anticline are mapped on Near Top Muschelkalk Group and concentrate at the corner of the siting region. However, a few fault segments showing a similar orientation are mapped at a close distance from the BOZ2 borehole (Fig. 4‑61). Micro faults in BOZ2 are predominantly ENE-WSW-trending, hence displaying a similar orientation (Nagra (ed.) 2022b).
Located in the SW sector of the block, the Effingen Fault represents a major structural element in JO. It is a normal fault known from seismic reflection data interpretation and reaching from the pre-Mesozoic basement into the Wildegg Formation (Fig. 4‑63; Nagra 2019b). It strikes NNE-SSW and dips towards the E.
A cluster of faults is observed on Near Top Muschelkalk Group in the central to south-eastern part of the 3D seismic survey and grouped under the term "Brugg Strukturzone" (Fig. 4‑61; Nagra 2024a). They display only a mild expression at the level of the Near Top Lias Group (Fig. 4‑61). They encompass thrust imbricates from the Jura Main Thrust in the south as well as a NW-SE-trending zone with a change from contractional features to extensional features indicative for a strike-slip-dominated deformation. Micro faults mapped in BOZ1 within the Muschelkalk Group show comparable orientations (NW-SE-trending and subordinate NE-SW-trending) to the faults detected in the 3D seismic reflection data (Fig. 4‑61; Nagra (ed.) 2022a).
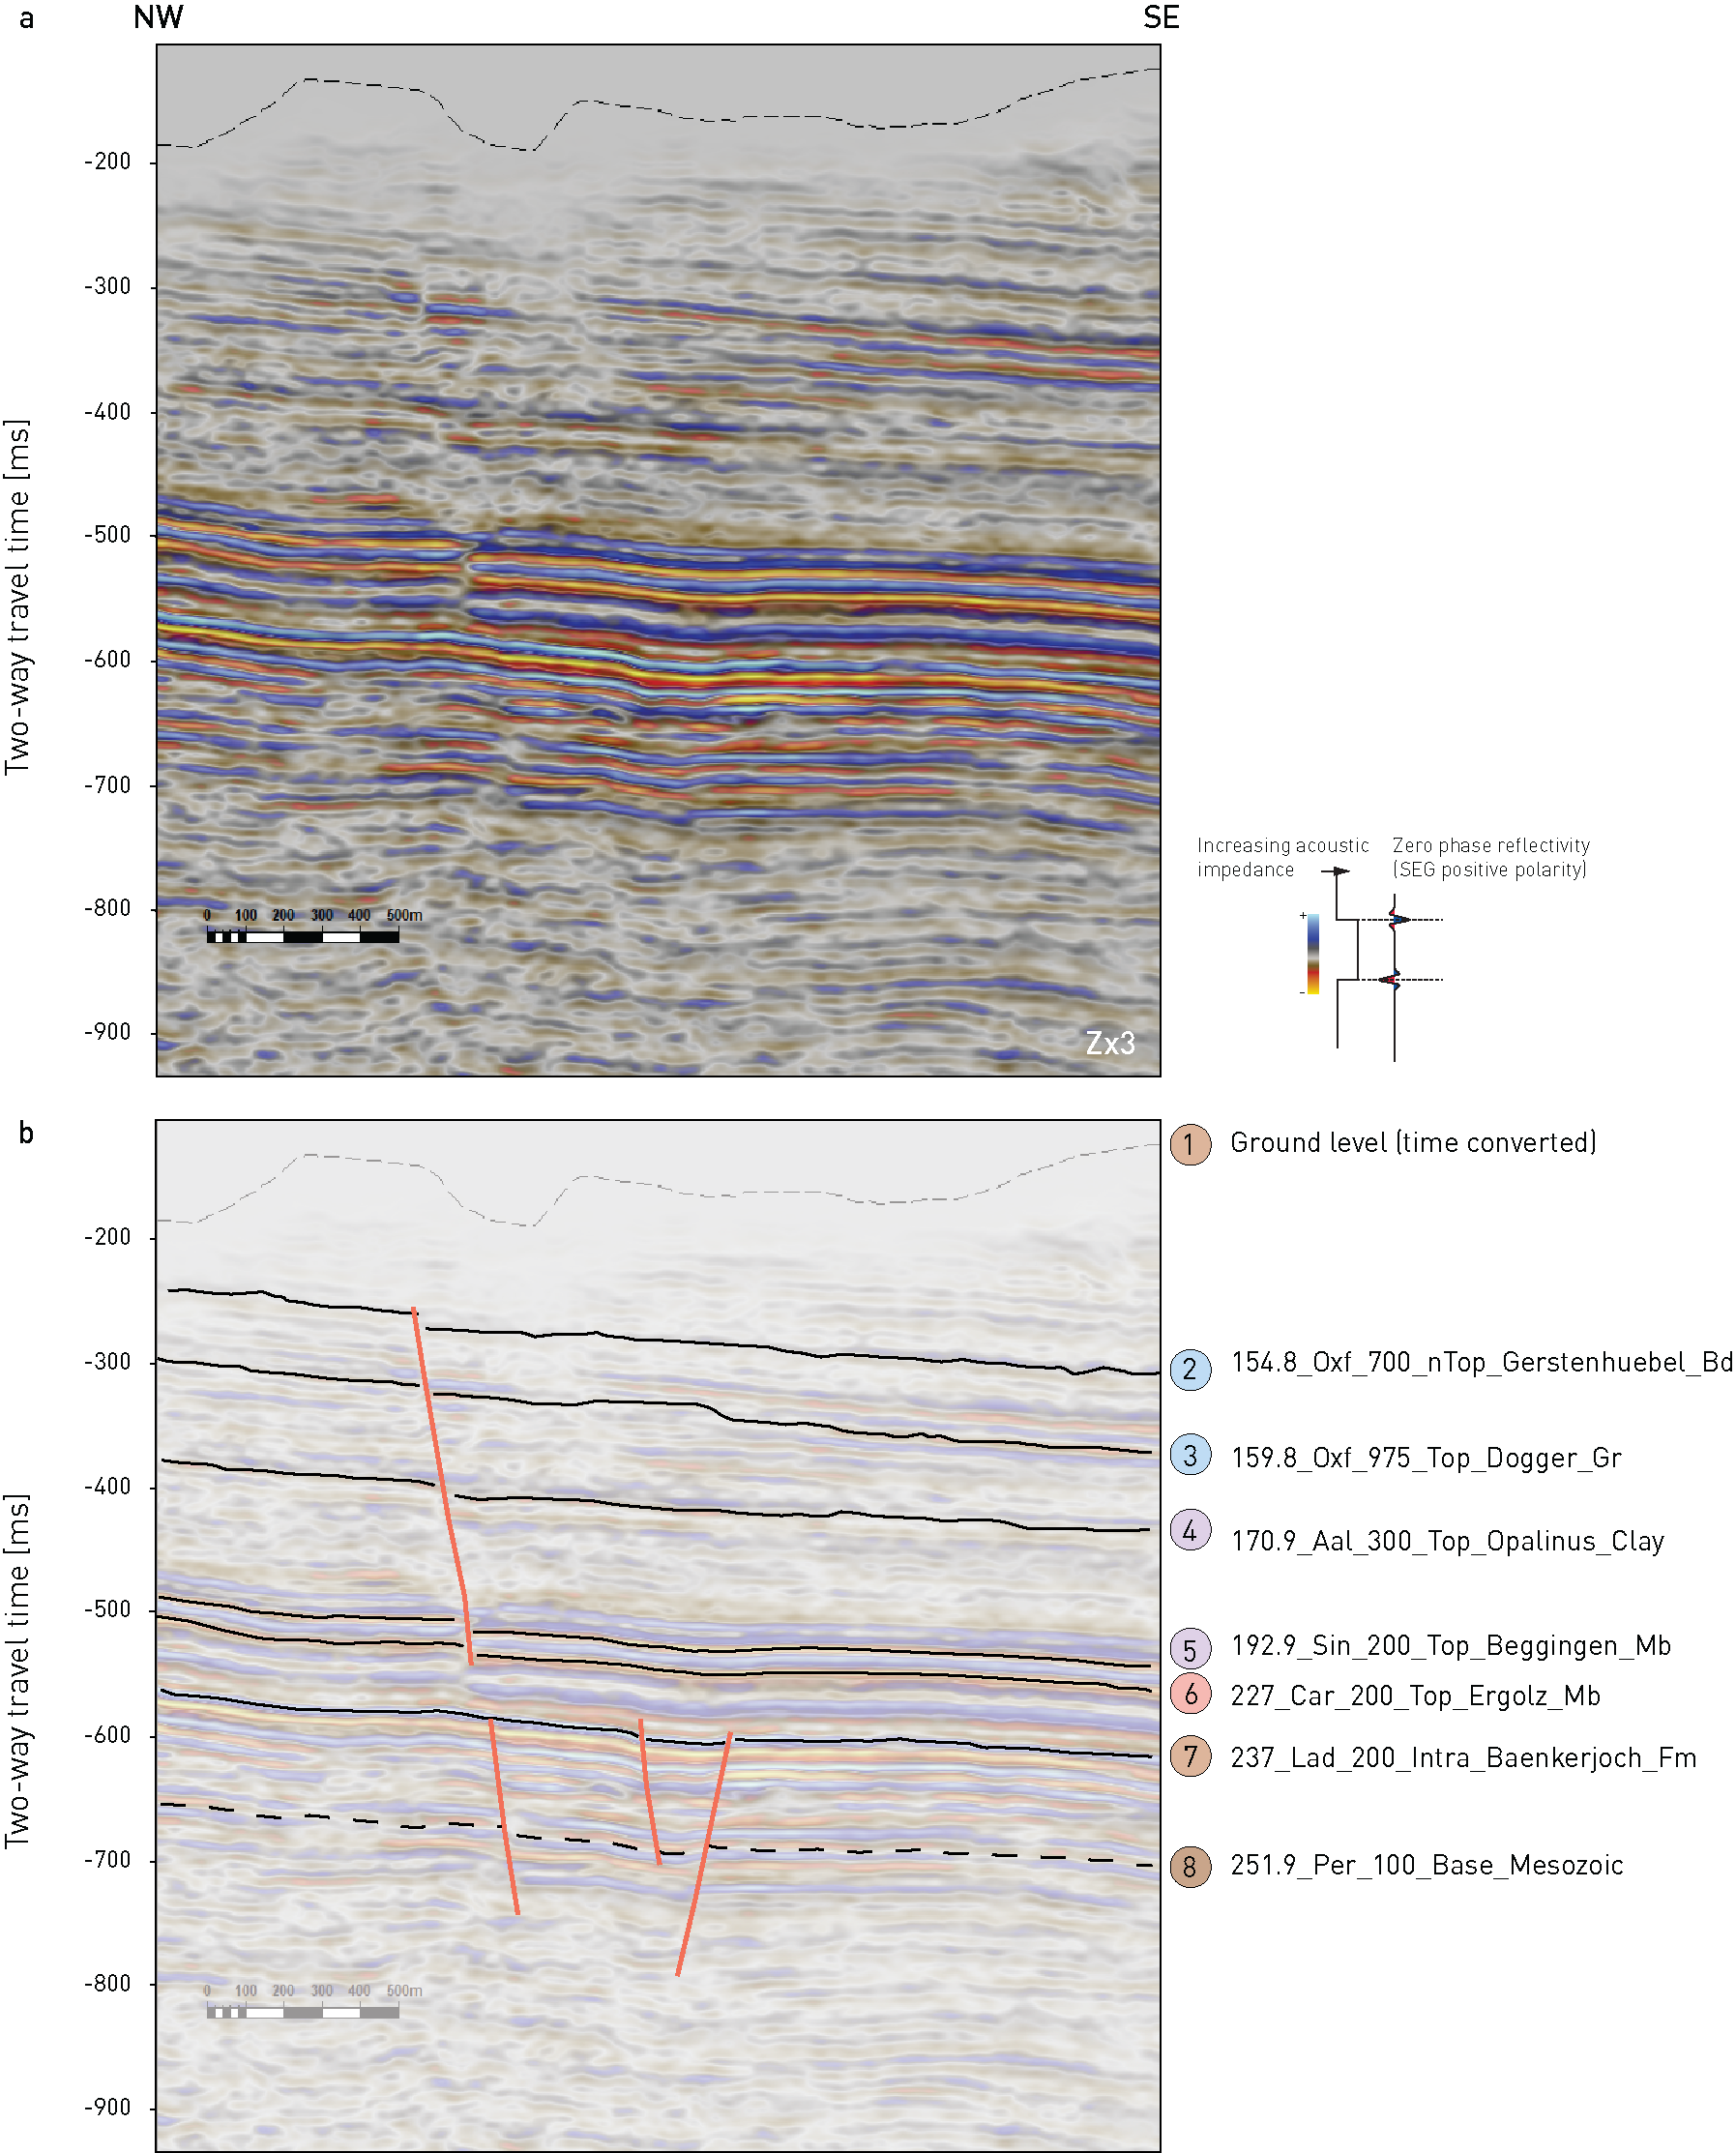
Fig. 4‑63:Cross-section extracted from 3D seismic reflection data showing the Effingen Fault
Modified after Nagra (2024a). (a) Uninterpreted. (b) Interpreted. Seismic display is PreSTM-ref reflectivity with an overlay of relative acoustic impedance. Note the slight normal fault offset along the Effingen Fault for instance at the Top Ergolz Member. The vertical axis was stretched 3 times (Z × 3). Bd: Bed; Gr: Group; Mb: Member; Fm: Formation.
Nördlich Lägern
Nördlich Lägern is characterised by a relatively large (compared to JO and ZNO) less deformed block located between the Baden – Irchel – Herdern Lineament to the south and the Weiach – Glattfelden – Eglisau Lineament to the north (Fig. 4‑64). Discrete seismically mappable faults are predominantly observed at the level of the Top Muschelkalk Group (Fig. 4‑65). Less numerous fault segments are seen in the seismic reflection dataset at Near Top Lias Group and Near Top Opalinus Clay levels. This agrees well with the observed differences in fracture frequencies in the boreholes (Fig. 4‑65). Similarly to JO, a strong influence of mechanical stratigraphy is shown by higher fracture frequencies in the competent units (e.g. Malm and Muschelkalk Groups) and lower fracture frequencies in the less competent units (clay-mineral-rich units, e.g. Opalinus Clay). Small-scale faults (referred to as fault zones in Nagra (ed.) 2023a, 2022c, 2022d, 2021a, Dossier V) were encountered predominantly in the Triassic units (9 out of 15 in BAC1, 17 out of 25 in STA2, 17 out of 31 in STA3 and 34 out of 50 in BUL1). As in JO, the observed higher number of small-scale mostly low-angle faults in the Triassic evaporites provides supporting evidence for strain localisation within the main Jura décollement level in this region.
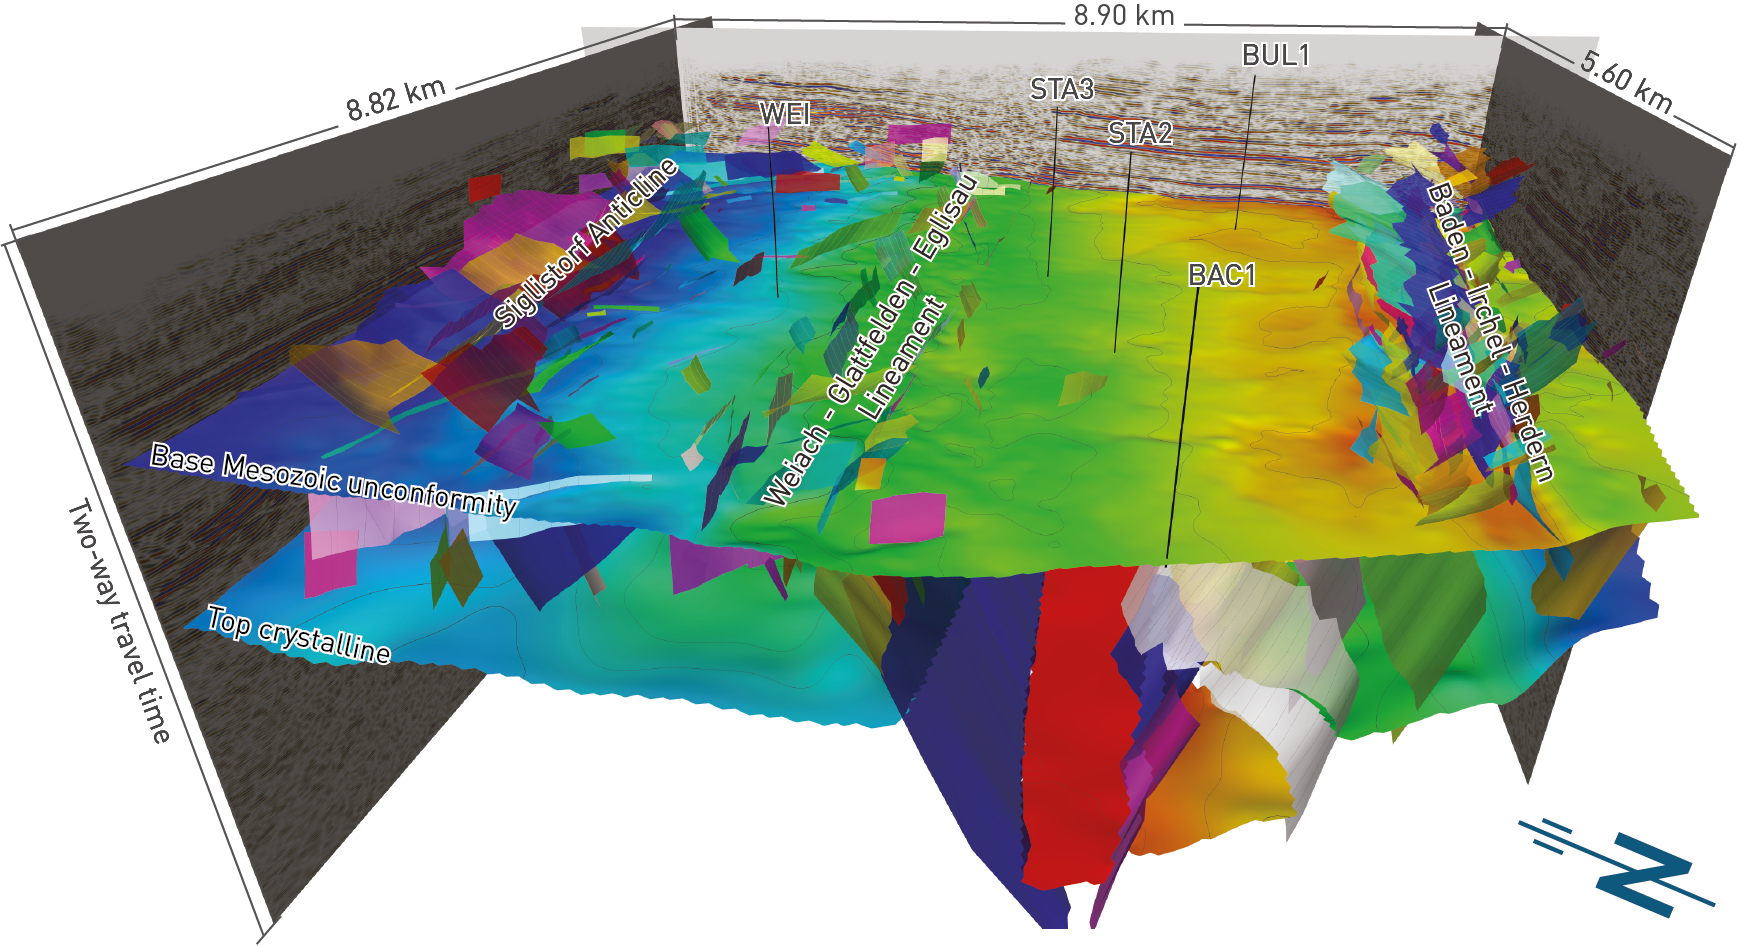
Fig. 4‑64:3D view showing the less deformed block in NL between the regional fault zones
Modified after Zambrano et al. submitted. Two horizons are shown for orientation. North is indicated by the blue arrow. Note that the z axis is in time.
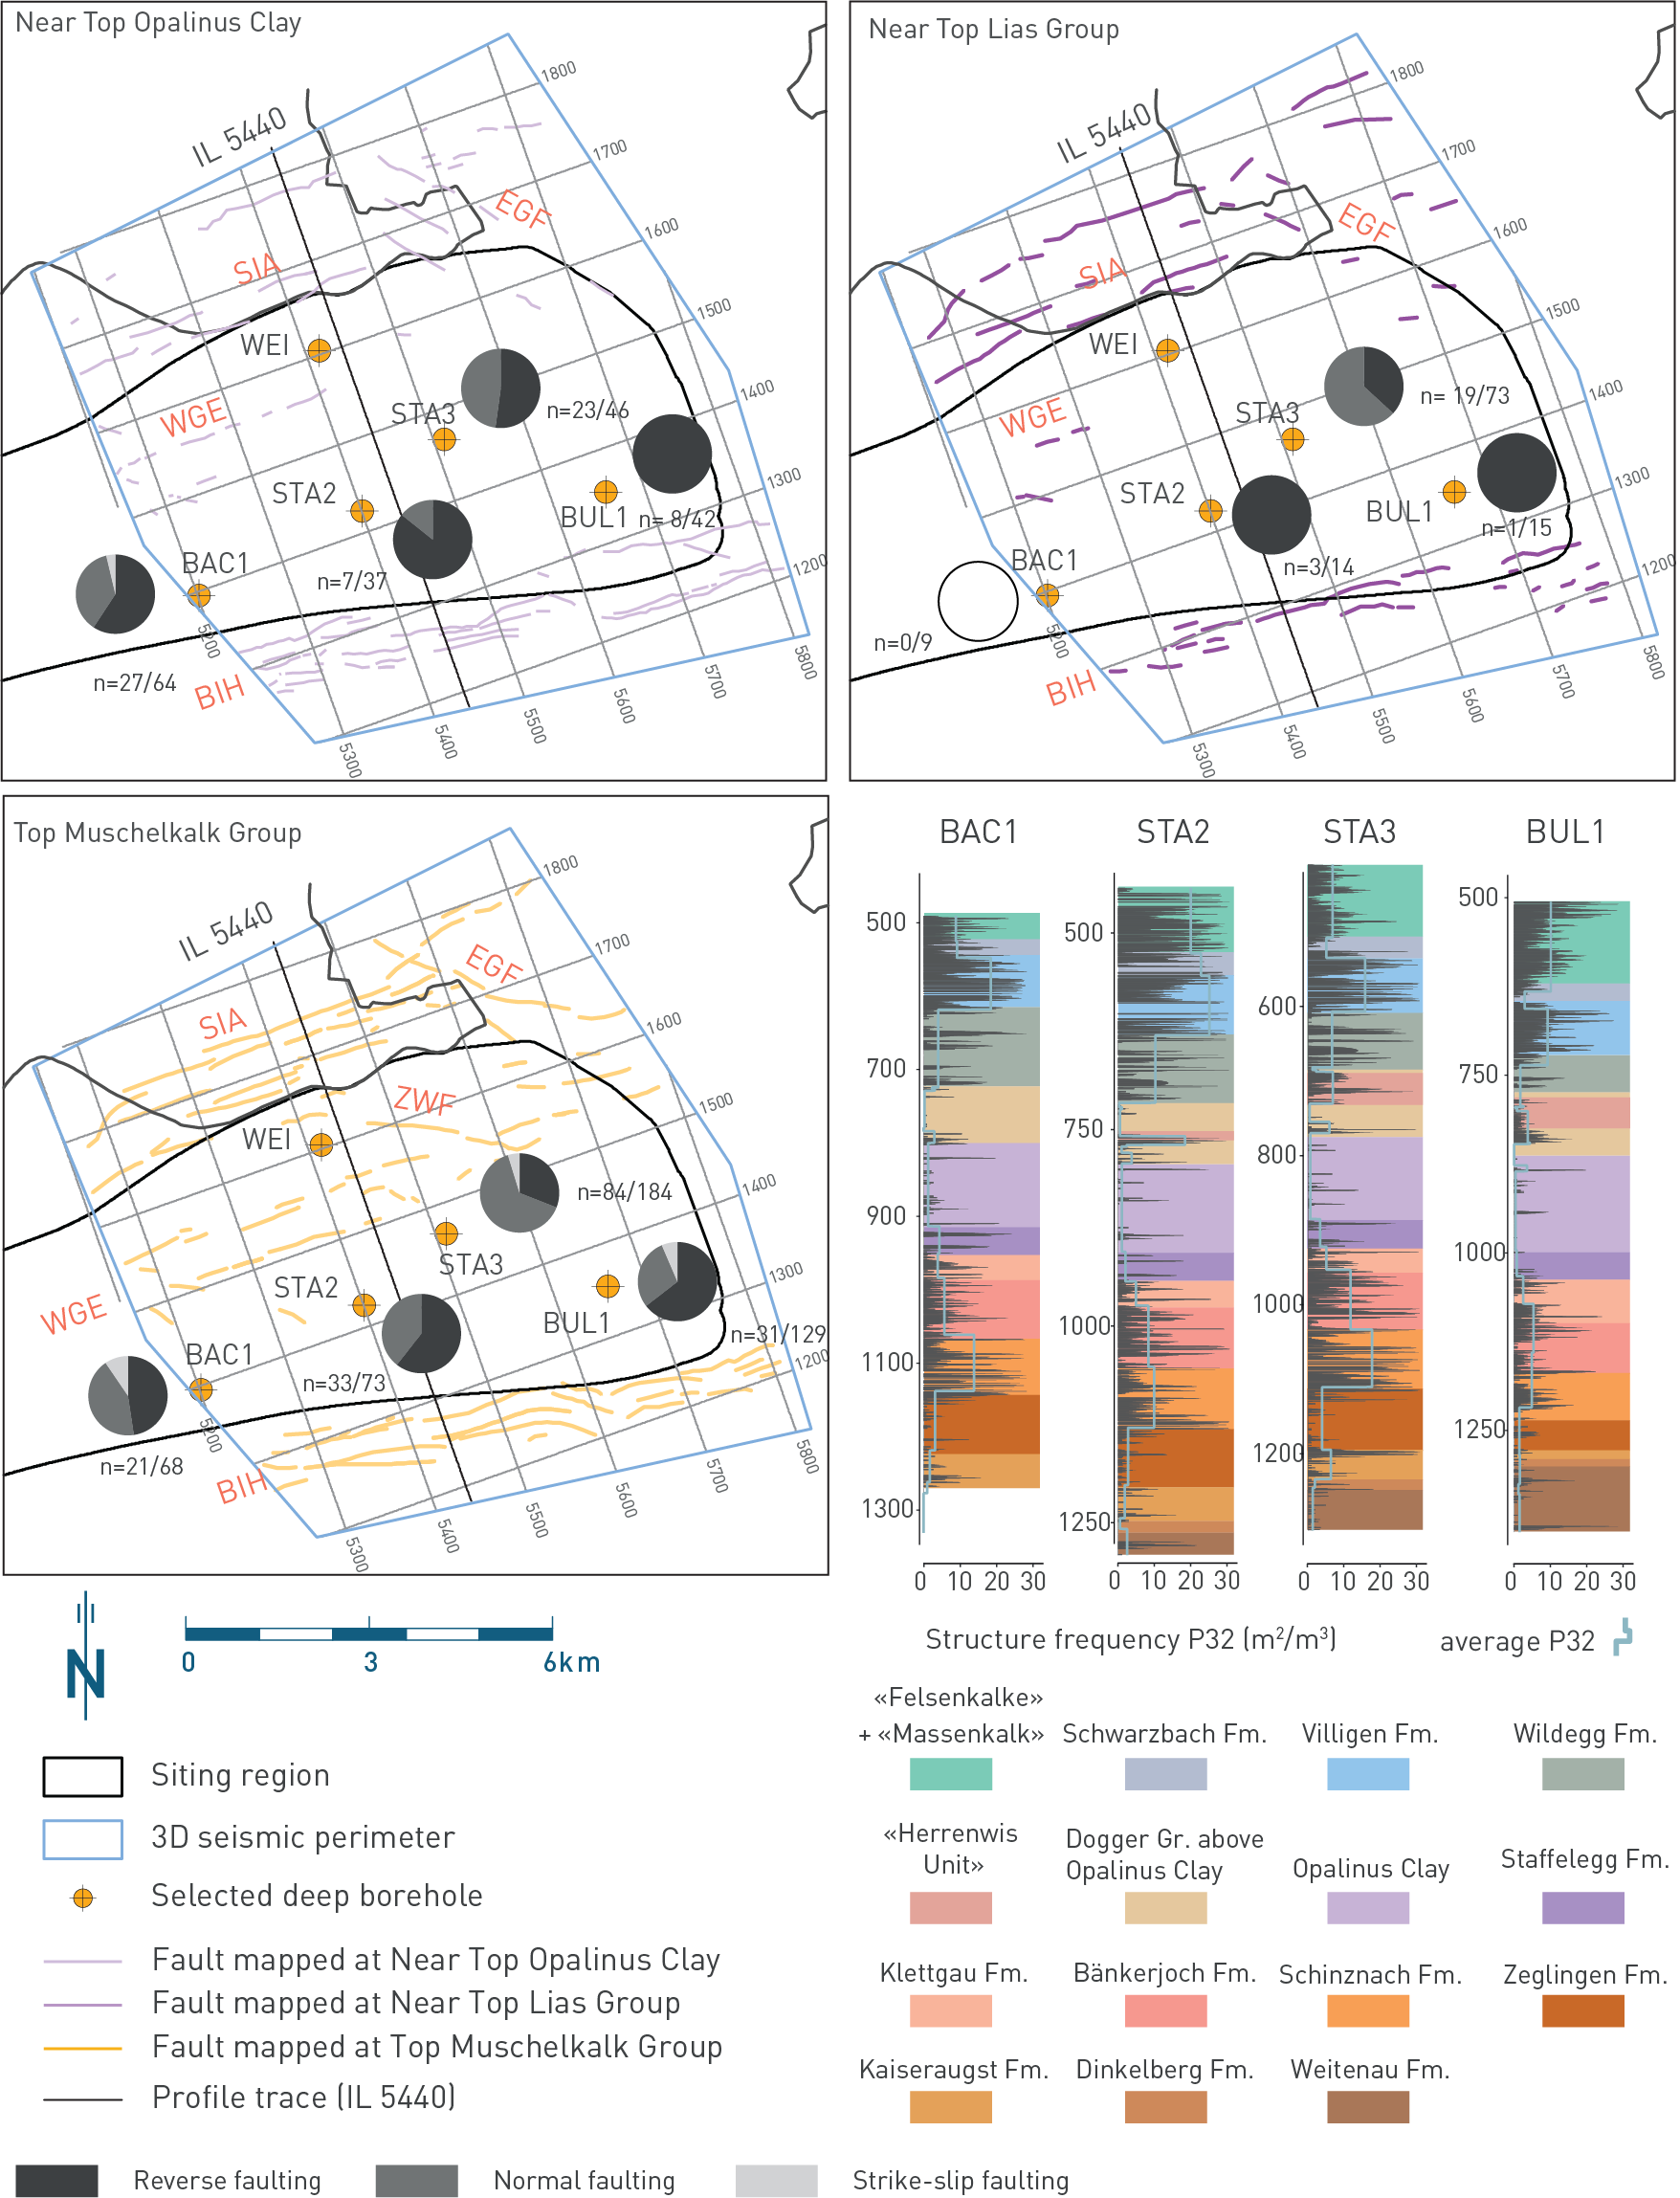
Fig. 4‑65:Fault maps for NL (shown on three stratigraphic levels) and fracture frequencies in the recent deep boreholes
Fault maps based on seismic reflection interpretation reported in Nagra (2024b). Pie charts show the distribution of shear sense indicators within the Opalinus Clay, Lias Group and Muschelkalk Group, respectively. The numbers after 'n=' represent the total number of micro faults with shear sense indication/total number of micro faults. Reverse faulting encompasses all dip-slip upward movements. P32 values refer to the fracture area in a unit volume, i.e. the intersection area of the plane with the cylindrical core and, as such, represents a non-directional intrinsic measure of the degree of rock mass fracturing, incorporating both a frequency measure and a fracture-size component (Ebert & Decker 2019, Dershowitz 1985, Dershowitz & Herda 1992). SIA: Siglistorf Anticline, EGF: Eglisau Fault, ZWF: Zweidlen Fault, WGE: Weiach – Glattfelden – Eglisau Lineament, BIH: Baden – Irchel – Herdern Lineament.
All recent boreholes were drilled within the less deformed block. Shear sense indicators on micro faults show a predominance of reverse faulting with approximately 71% reverse shear sense mapped. Normal faulting was described for 23% of the micro faults, whereas strike-slip faulting was found in 6% of the cases (Fig. 4‑65). Thrust-related features are consistent with shortening related to the formation of the Jura Fold-and-Thrust Belt. Multiple micro faults showing two different sets of striae/shear fibre lineation on a single slickenside were observed in the drill cores. This indicates two slip directions, both probably related to thrusting during the formation of the Jura Fold-and-Thrust Belt. NNE- and NNW- thrusting directions inferred from these micro faults are consistent with shortening directions reported from outcrops in Northern Switzerland (Madritsch 2015).
North of the Lägern Anticline, the Baden – Irchel – Herdern Lineament is located above faults of the underlying Konstanz – Frick Trough (Fig. 4‑66). It is composed of multiple thrusts and backthrusts arranged in a narrow, steep belt (Fig. 4‑67; Zambrano et al. submitted). Several authors have interpreted it as a composite triangle zone including a series of fish-tail structures (Laubscher 1985, Malz et al. 2016, Nagra 2024b). Within this structure, the Opalinus Clay allowed significant decoupling of the deformation between a lower competent layer (thick-bedded to massive limestones and dolostones of the Upper Muschelkalk Group) and an upper competent unit (thick-bedded to massive limestones of the Malm Group). The Opalinus Clay appears to have been shortened and locally thickened by roughly coaxial strain between the two disharmonically folded, competent rock panels located above and below it. The upper competent panel is antiformally folded, while the lower competent panel is synformally folded, resulting in a tectonically thickened Opalinus Clay in the core of both folds (Nagra 2024b). It should be noted that, although within the Baden – Irchel – Herdern Lineament the Opalinus Clay acted as a decoupling unit, no evidence was found within the siting regions along the boreholes for a décollement in the Opalinus Clay. This shows that, within the less deformed block, the Opalinus Clay did not act as décollement level.
The link of the Baden – Irchel – Herdern Lineament to the substratum (i.e. strata below the décollement in the Triassic evaporites) has been conceptualised differently over time. Malz et al. (2016) proposed an evolution of the Baden – Irchel – Herdern Lineament influenced by pre-thrusting normal faulting affecting the Base Mesozoic unconformity and overlying Mesozoic succession. These authors interpreted no faults cutting from the Paleozoic units into the Mesozoic strata. Recent structural interpretation of the 3D seismic reflection data indicated the occurrence of reverse faults offsetting both the upper part of the Paleozoic succession and Mesozoic strata, therefore cutting across the Base Mesozoic unconformity (Nagra 2024b). Consequently, the formation of the Baden – Irchel – Herdern Lineament is proposed to have occurred by post-detachment shortening involving both the Mesozoic succession and the underlying Upper Paleozoic sedimentary fill of the Konstanz – Frick Trough. This would be associated with late-stage bulk shortening triggering mild basin inversion of the Konstanz – Frick Trough (Zambrano et al. submitted).
The structural style of the Baden – Irchel – Herdern Lineament varies along strike. The contractional structure characterising the Baden – Irchel – Herdern Lineament south of NL, clearly related to Jura shortening, deamplifies progressively and fades away eastwards. South of ZNO, the composite triangle zone is no longer present, and a pronounced normal fault occurs instead in the Mesozoic succession (hard- linked with the underlying Late Paleozoic fault). This normal fault was extensionally reactivated, propagating into and offsetting the overlying Mesozoic units (Fig. 4‑60). The extensional reactivation was probably associated with the northward migration of the flexural forebulge (Chapter 3).
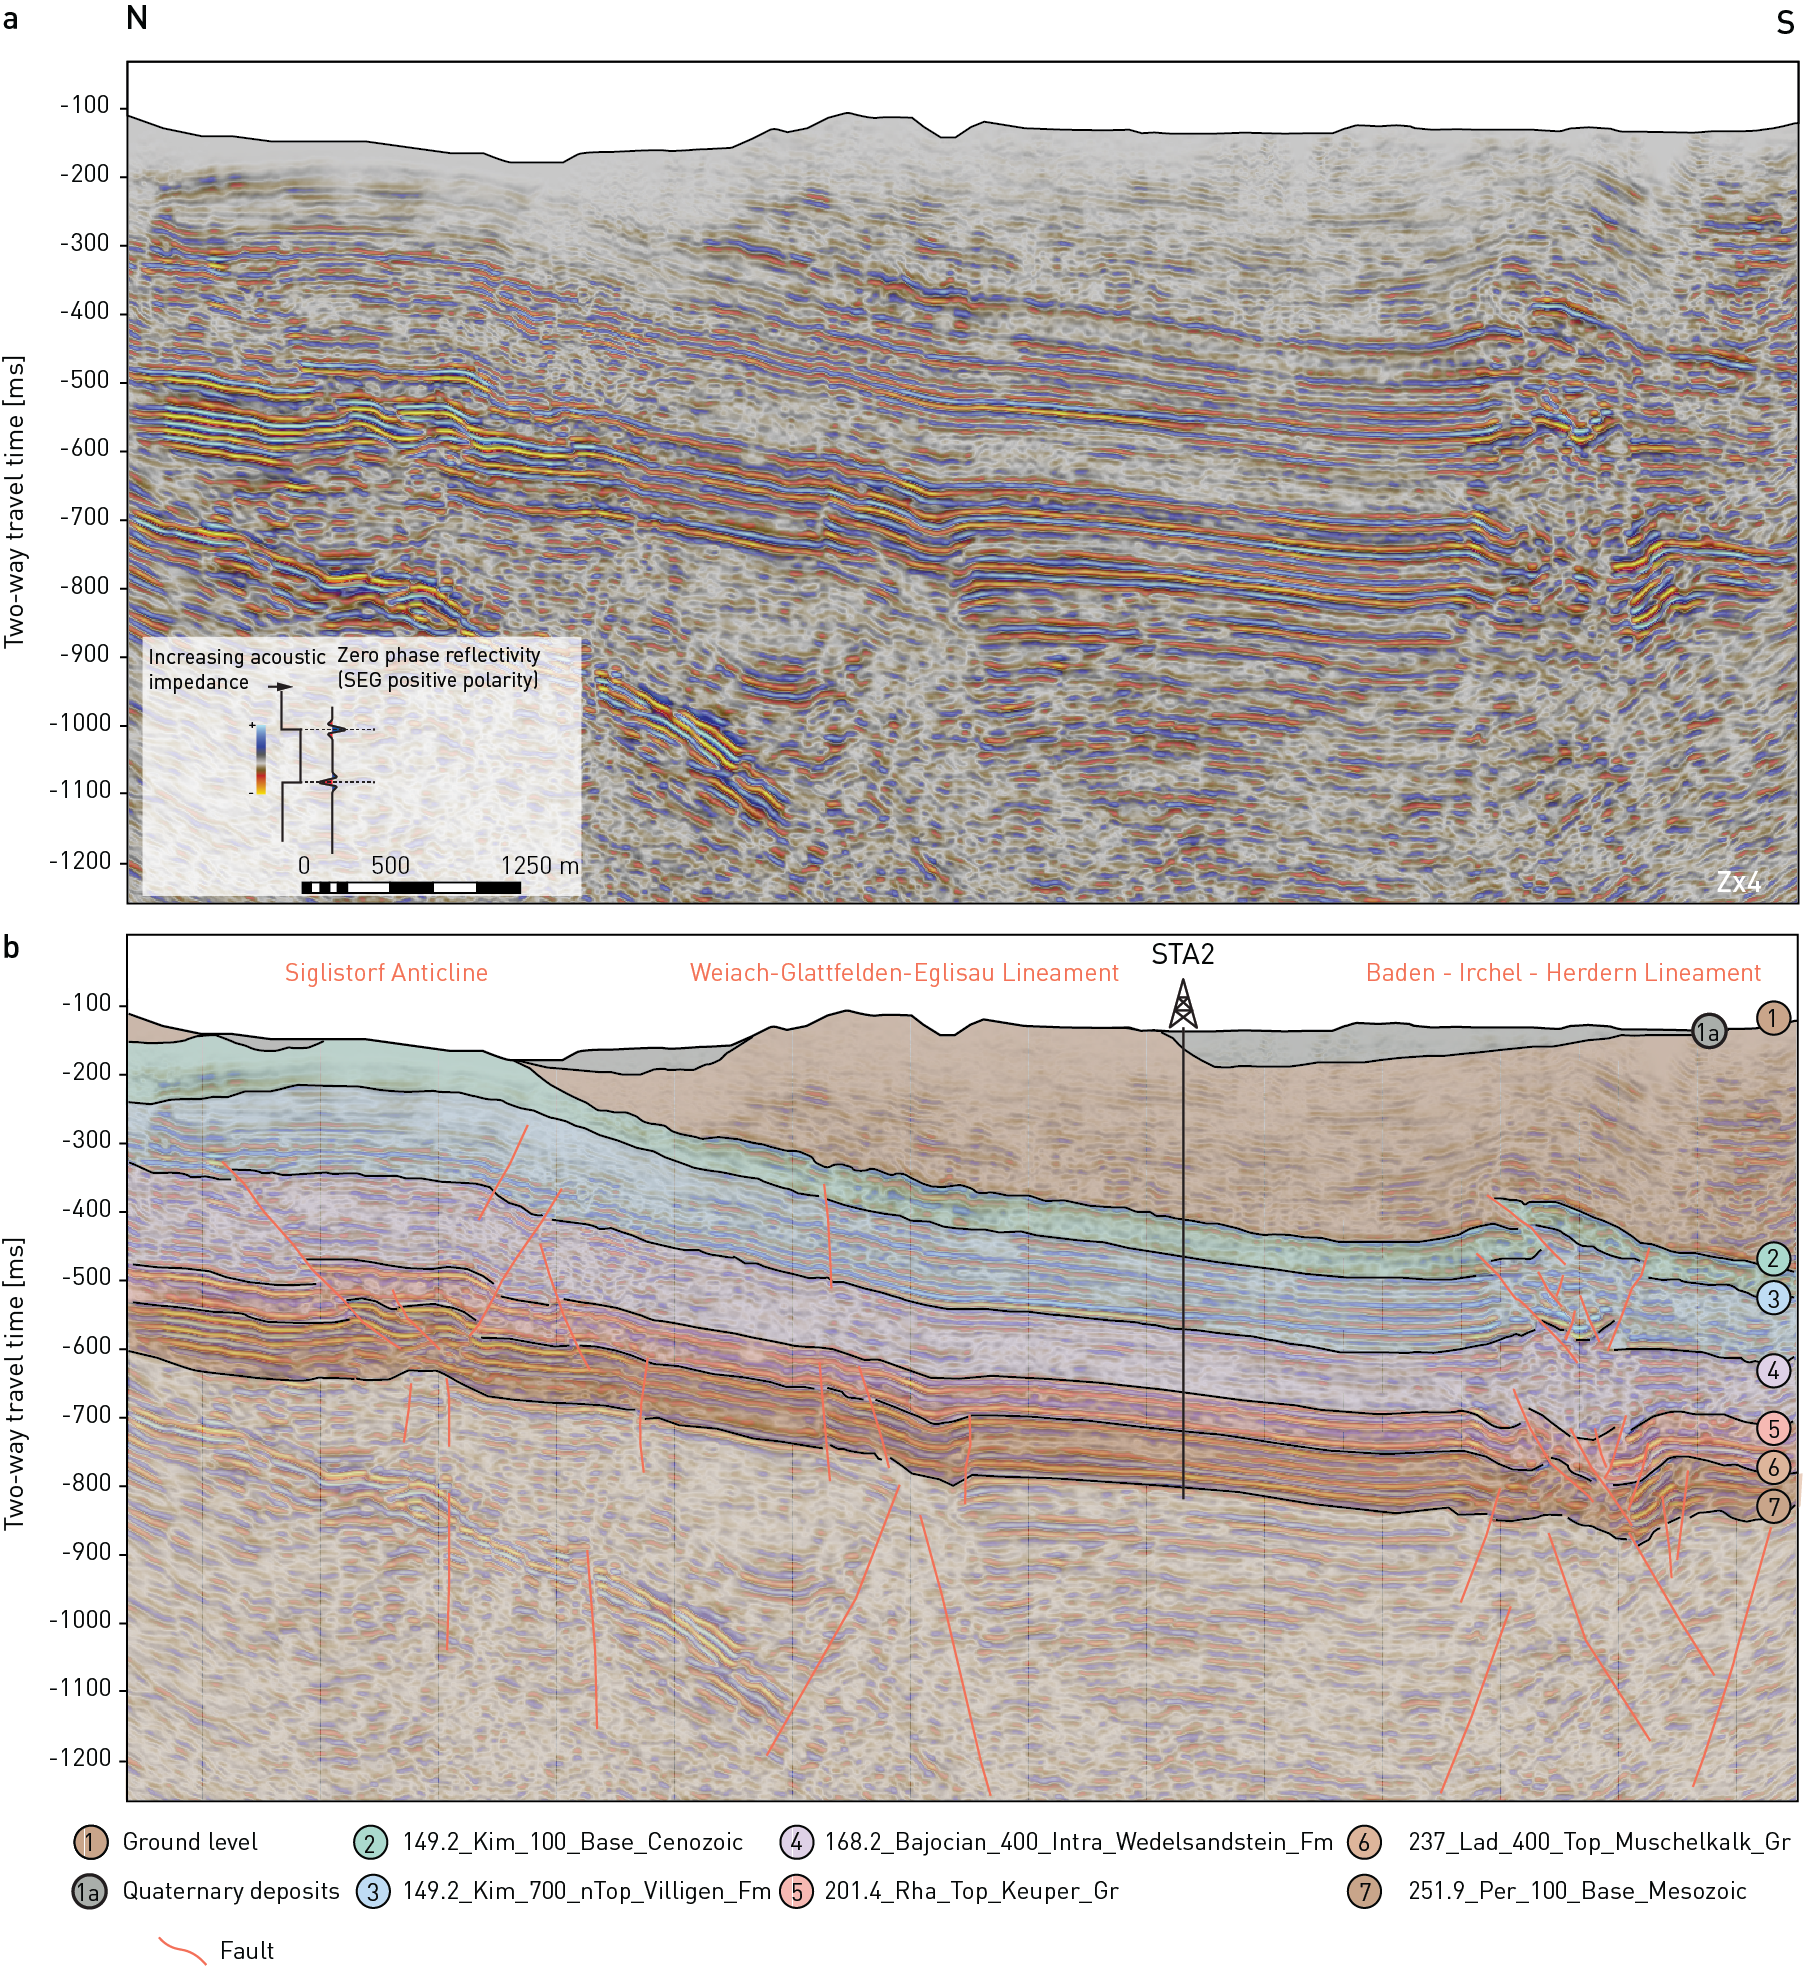
Fig. 4‑66:N-S cross-section in time domain through the 3D seismic reflection data across NL
View is along the acquisition inline 5440, modified after Nagra (2024b). (a) Uninterpreted. (b) Interpreted. Note that the recognition of fault signatures within the Opalinus Clay is strongly hampered by the presence of multiples. The vertical axis was stretched 4 times (Z × 4). Seismic display is PreSTM-ref reflectivity with an overlay of relative acoustic impedance. Note that Top Opalinus Clay could not be picked. Colour shade is given to a larger interval including clay-mineral-rich units above and below the Opalinus Clay with a similar rheology. Profile trace shown in Fig. 4‑65.
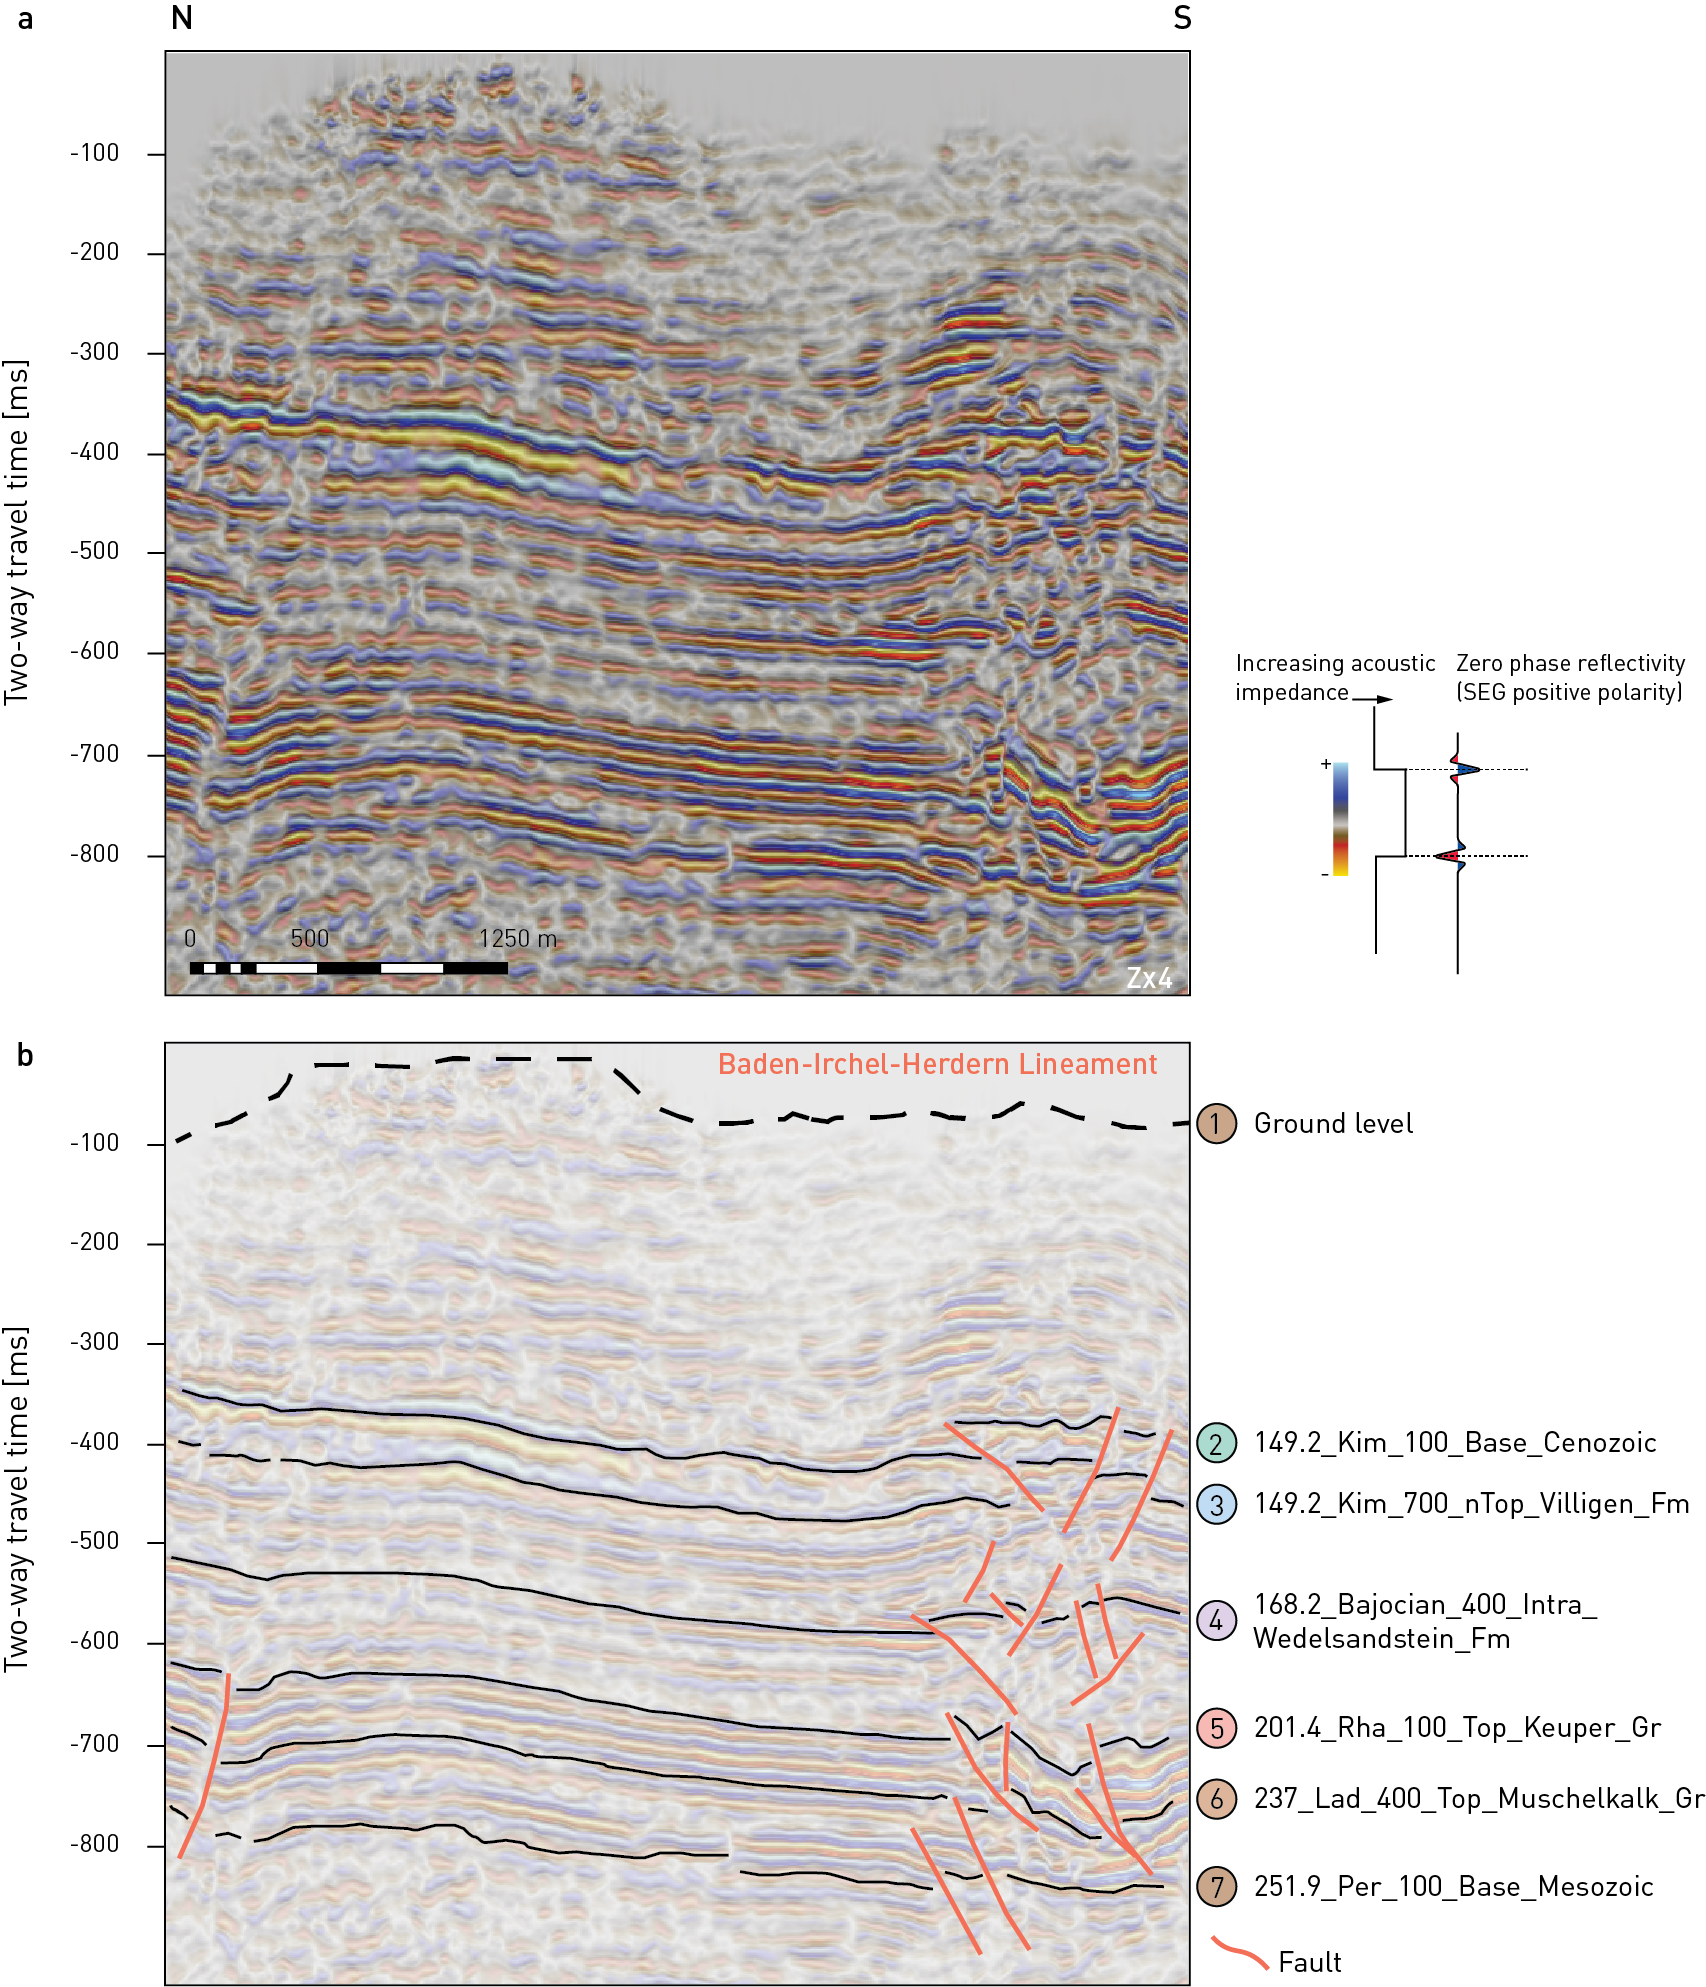
Fig. 4‑67:Focused view in time domain showing interpreted fault geometries in the Baden – Irchel – Herdern Lineament
View is along the acquisition inline 5403, modified after Nagra (2024b). (a) Uninterpreted. (b) Interpreted. Seismic display is PreSTM-ref reflectivity with an overlay of relative acoustic impedance. Note the antiform and synform above 168.2 Bajocian 400 and below 201.4 Rha 100, respectively. The vertical axis was stretched 4 times (Z × 4).
In NL, the Konstanz – Frick Trough is more symmetric than in JO (Fig. 4‑56 and Fig. 4‑57). In particular, the northern shoulder of the trough is wider and characterised by the occurrence of several normal faults (Fig. 4‑55). These faults appear to have controlled the localisation of later deformation during the Jura-related shortening episodes, which resulted in the development of multiple deformed zones including the Siglistorf Anticline and the Weiach – Glattfelden – Eglisau Lineament in the Mesozoic cover (Fig. 4‑66). Therefore, structural development in the northern sector of NL shows a striking difference with respect to JO, where a narrower deformation zone (associated with the Mandach Thrust) developed at a substratum step produced by a single normal fault of the Konstanz – Frick Trough. The Weiach – Glattfelden – Eglisau Lineament is well imaged at the Top Muschelkalk Group level (Fig. 4‑65). It is a high-angle, strongly segmented, ENE-WSW-trending fault array. From west to east, fault segments can be seismically mapped with a length ranging from 300 m to 1 km (Fig. 4‑65). Vertically, the high-angle faults mostly terminate below Near Top Lias Group. Only a few segments affect the units above the Opalinus Clay (Fig. 4‑66). Multiple seismic reflection interpretations identified a hard linkage of the Weiach – Glattfelden – Eglisau Lineament between the substratum (i.e. strata below the décollement level in Middle Triassic evaporites) and the sedimentary cover (Fig. 4‑66). This hard linkage suggests a formation of the Weiach – Glattfelden – Eglisau Lineament postdating décollement-related deformation north of it (i.e. at a distal position with respect to the Alps), as it would otherwise be transported foreland-ward during activity along the décollement.
The Siglistorf Anticline consists of an up to ~ 2-km-wide, composite pop-up including highly segmented thrust and backthrust splays (Fig. 4‑68). In the Malm Group, deformation is accommodated by folding rather than faulting (Fig. 4‑60). 2D cross-section balancing revealed shortening of approximately 200 m across it (Jordan et al. 2015). Although the control exerted by normal fault-related substratum steps on later thrust ramp development appear evident, it remains unclear to what degree the faults that controlled the localisation of the Siglistorf Anticline are linked across the Base Mesozoic unconformity. Schöpfer et al. (2024) discuss multiple scenarios involving both décollement-related deformation and deformation involving the basement. However, Nagra’s current 3D seismic reflection interpretation favours a model, where the faults in the Upper Paleozoic succession, control the localisation of the Siglistorf Anticline and the faults above the Triassic evaporites, as the geometry of the latter faults is consistent with décollement-related deformation (Nagra 2024b).
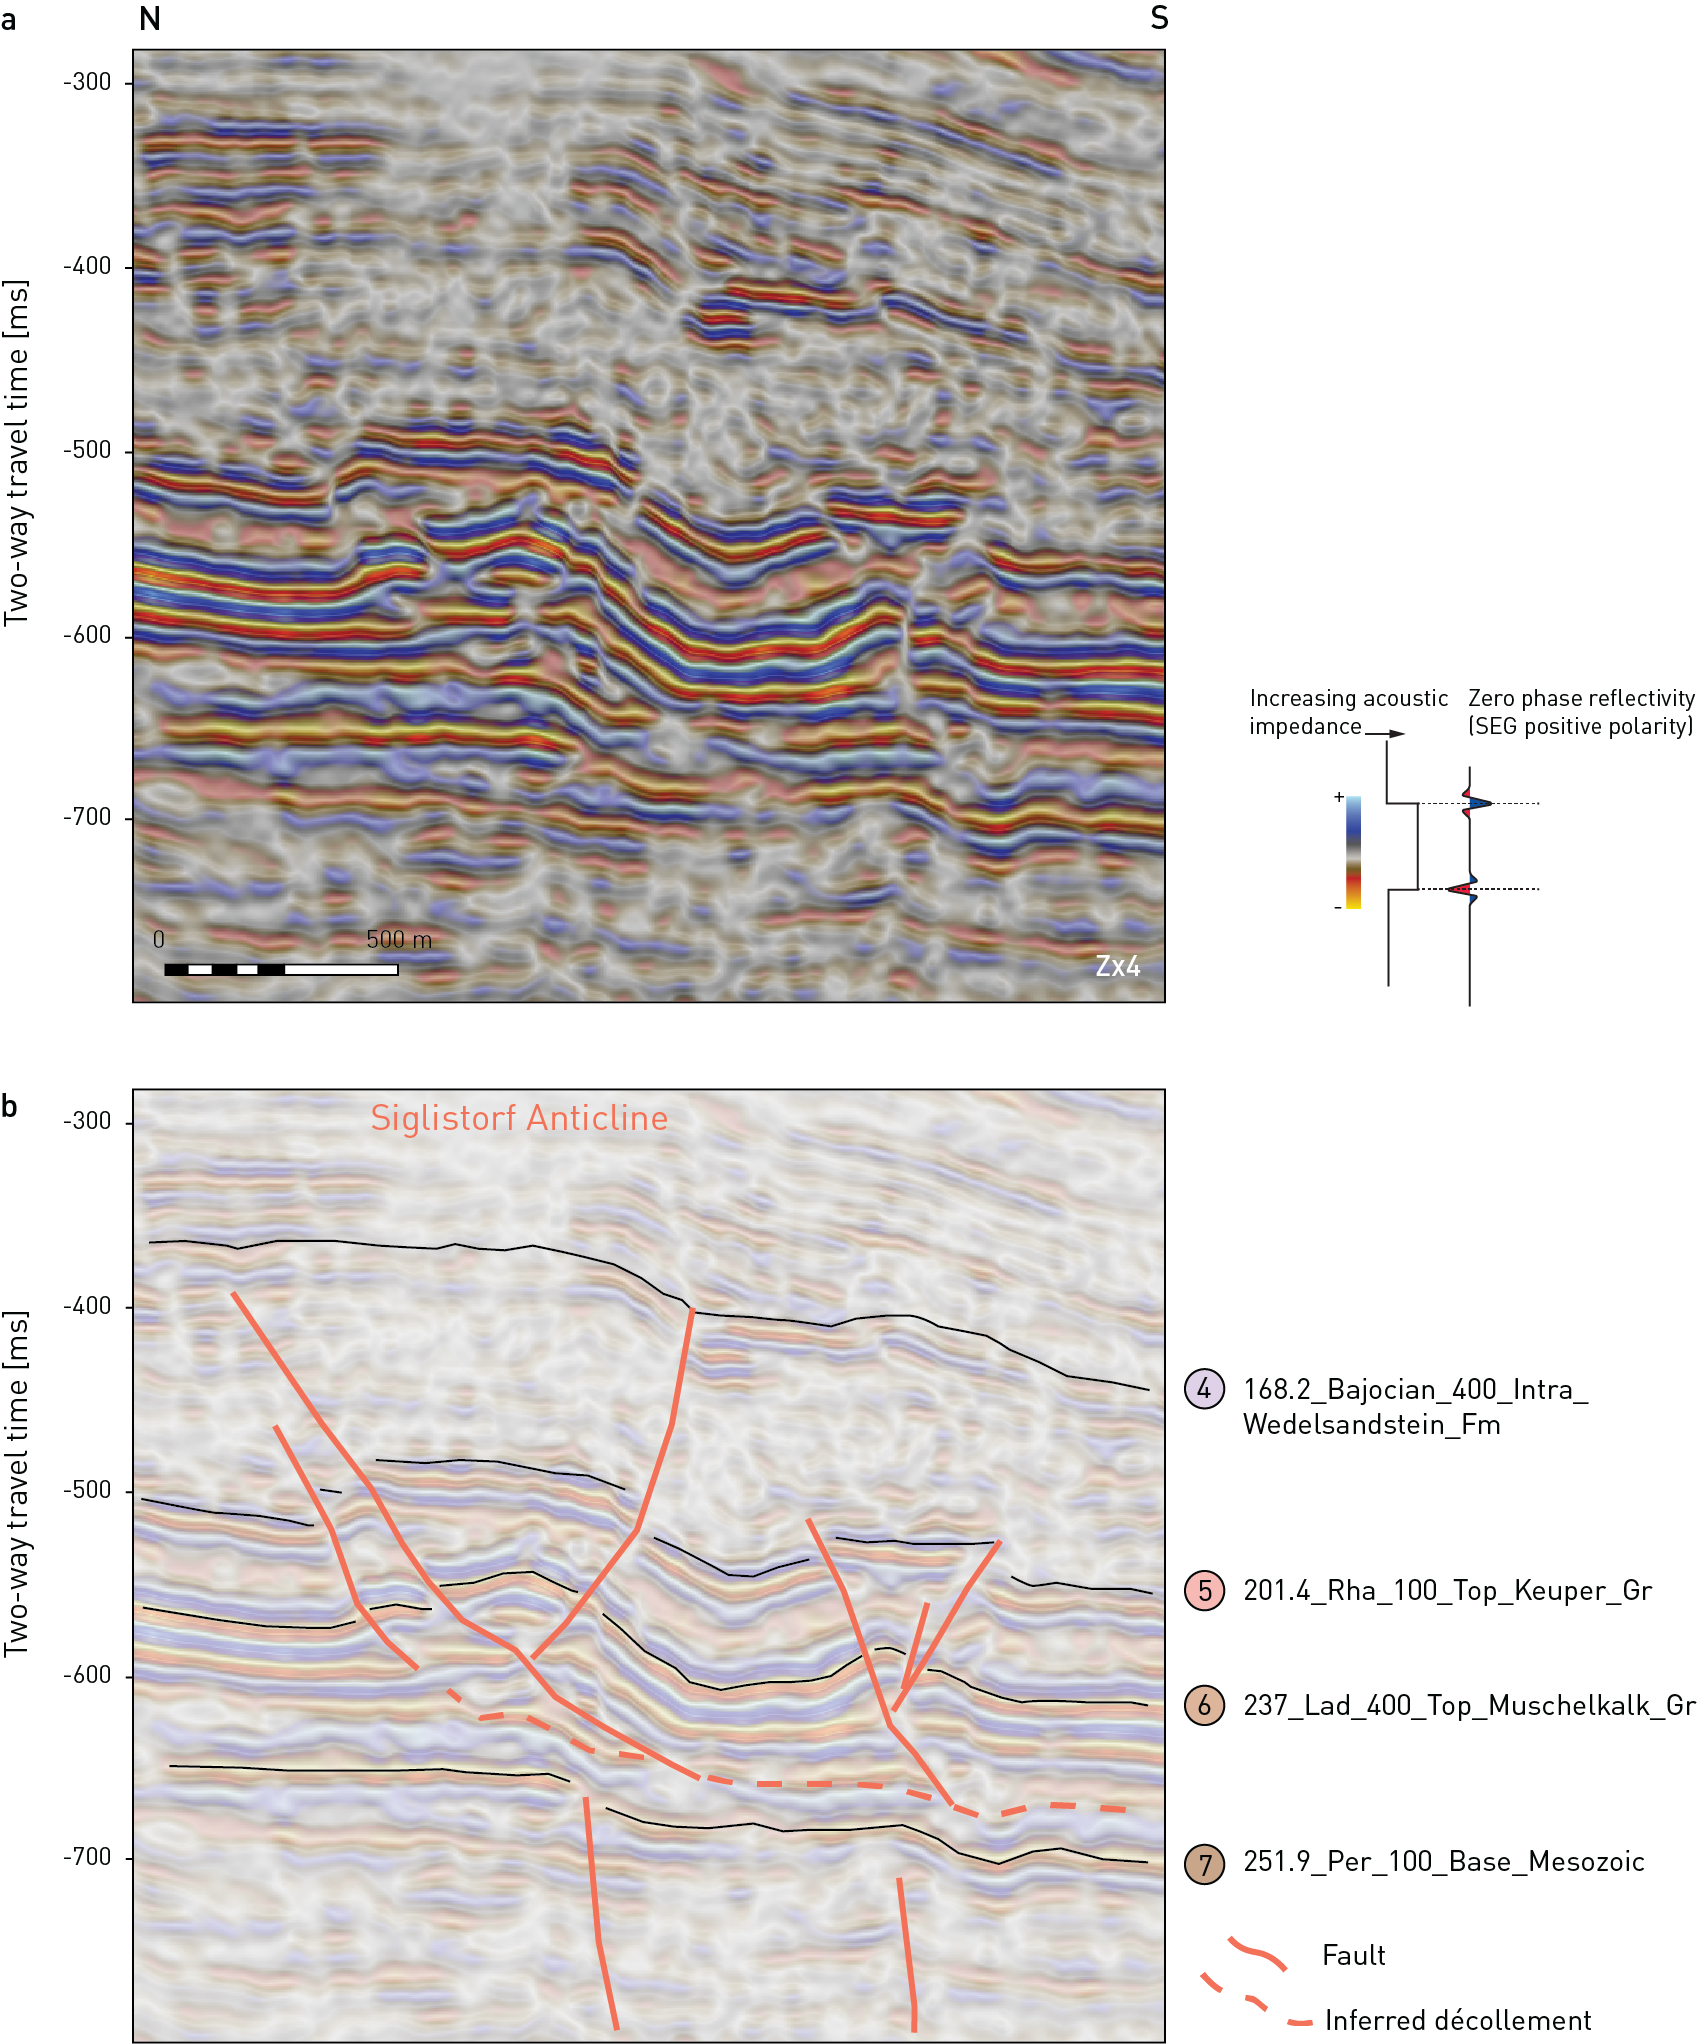
Fig. 4‑68:Focused view in time domain showing the relationship of thrusting in the Siglistorf Anticline and the underlying faults in the Paleozoic strata
View is along the acquisition inline 5239, modified after Nagra (2024b). (a) Uninterpreted. (b) Interpreted. Seismic display is PreSTM-ref reflectivity with an overlay of relative acoustic impedance. The thrust affecting the Mesozoic sequence appears to flatten within the Triassic evaporite interval. The faults in the Paleozoic strata produced the steps at the Base Mesozoic unconformity as a result of minor Paleogene extensional reactivation. The vertical axis was stretched 4 times (Z × 4).
The Eglisau Fault and the Zweidlen Fault are known only from seismic reflection interpretation (Fig. 4‑65; Nagra 2014b, 2019c). They strike roughly NW-SE in a Hercynian orientation. These structures can be traced from the pre-Mesozoic substratum into the sedimentary cover (Fig. 4‑65). This indicates a strong influence of inherited Paleozoic faults on faulting within the sedimentary cover. They are mainly expressed at Top Muschelkalk Group level, but indications are found up to Base Malm Group for the Eglisau Fault and Near Top Lias Group for the Zweidlen Fault (Fig. 4‑65; Nagra 2019c, 2024b). The Eglisau Fault can be subdivided into two segments (Nagra 2019c, Madritsch et al. 2013). The northern one (i.e. north of the Siglistorf Anticline and north of the contractional deformation front of the Alps) is a steeply dipping normal fault. The southern segment shows evidence for contractional deformation, with still observable normal faulting at the Base Mesozoic unconformity level. The Zweidlen Fault appears to terminate at its intersection with the Weiach – Glattfelden – Eglisau Lineament. It is in its present-day geometry mostly a steep reverse fault dipping towards the NE, rooting in the Paleozoic basement.
Zürich Nordost
Zürich Nordost differs tectonically from JO and NL as the Mesozoic here is mostly autochthonous (Nagra 2014b, Birkhäuser et al. 2001). However, the proximity to the Hegau – Bodensee Graben affected the siting region with transtensional deformation expressed by an increased number of high-angle faults (Fig. 4‑58 and Fig. 4‑59). Major tectonic structures are the Neuhausen Fault, which represents the northeastern boundary of the siting region, and the Rafz – Marthalen Flexure (Fig. 4‑69). The predominance of normal faulting is recorded by the shear sense indicators observed in the boreholes, mainly in the Muschelkalk Group in MAR1 (Fig. 4‑69) but also in general, with approximately 55% normal faulting observed, particularly within the Opalinus Clay (Fig. 4‑69). Reverse faulting was described for 37% of the micro faults, whereas strike-slip faults represent 8% of the cases, homogeneously distributed over the entire stratigraphic column (Fig. 4‑69). In addition to extension associated with the Hegau – Bodensee Graben, normal faulting related to the northward migration of the Alpine flexural forebulge and Miocene contraction related with folding and thrusting of the Jura in the SW corner of ZNO is also likely to have occurred within ZNO. The Rafz – Marthalen Flexure is considered the northern front of this contractional deformation (south of the deep boreholes, e.g. Birkhäuser et al. 2001, Müller et al. 2002, Marchant et al. 2005, Nagra 2019d). The mechanical stratigraphy observed in JO and NL is confirmed in ZNO. Higher fracture frequencies are observed in the competent units and lower frequencies in the less competent units (e.g. Opalinus Clay; Fig. 4‑69). Small-scale faults (referred to as fault zones in Dossier V of TBO reports, see Tab. 2‑1) were encountered predominantly in the Triassic units (21 out of 26 in MAR1, 4 out of 4 in RHE1 and 11 out of 17 in TRU1).
The Neuhausen Fault is the most prominent fault in ZNO. It is a NE-SW-trending normal fault exposed at the surface north of ZNO (Fig. 4‑70; Hofmann 1981). Its vertical offset is about 60 m (Birkhäuser et al. 2001). Kinematically linked to the Neuhausen Fault is the Wildensbuch Flexure, which is a WNW-ESE-trending normal fault (Nagra 2024c). The Wildensbuch Flexure was intensively studied as a case example of a soft-linked fault and to analyse in detail fault architecture in relation to mechanical stratigraphy (Roche et al. 2020).
The Rafz – Marthalen Flexure (Fig. 4‑60) developed in the Mesozoic strata overlying the northern rim of the Konstanz – Frick Trough or southern border of the Benken Horst (Fig. 4‑55; Nagra 2014b, Birkhäuser et al. 2001). It is expressed as a mild change in dip azimuth of the Mesozoic strata (Nagra 2024c).
Prominent local faults identified in the 3D seismic reflection data are the Rheinau Fault, the Trüllikon Fault and the Uhwiesen Fault (Fig. 4‑69; Nagra 2024c, 2019d). The Uhwiesen Fault appears as a NW-SE-trending subvertical fault mainly expressed at Near Top Muschelkalk Group and Top Lias Group levels. The Trüllikon Fault (formerly referred to as Trüllikon Anticline), is a N-S-trending fault best imaged at the Near Top Muschelkalk Group level. The orientation of micro faults observed in TRU1 in the Muschelkalk Group are well aligned with the Trüllikon Fault traces from seismic reflection interpretation (Fig. 4‑69; Nagra (ed.) 2021c).
The Near Top Muschelkalk Group is also affected by numerous fault segments, especially in the "Strukturzone von Niderholz", that are not discretely observable above the Opalinus Clay (Birkhäuser et al. 2001, Nagra 2024c, 2019d). They represent high-angle faults that might be linked to the transtensional opening of the Hegau – Bodensee Graben. The high-angle faults, producing discrete strain (i.e. displacement) accumulation mostly evident in the Muschelkalk Group, are accompanied by folds. Folding also affects unfaulted strata at higher stratigraphic levels. However, it is characterised by fold amplitudes progressively decreases at higher stratigraphic levels (Nagra 2024c).
Typically, no evidence for seismically mappable faults was observed above the Opalinus Clay for the high-angle faults, which indicates that strain was accommodated in a more distributed manner in the Opalinus Clay and above (Section 5.5). The Rheinau Fault represents an exception, as fault segments were seismically mapped also above the Opalinus Clay (Fig. 4‑72). Therefore, the segments above and below the Opalinus Clay are conceptually connected in the seismic interpretation. The Rheinau Fault, which consists of a nearly vertical fault in the competent units above (Malm Group) and below the Opalinus Clay (Muschelkalk Group), was investigated by the means of a deviated borehole (RHE1). The borehole was deviated to sample the Opalinus Clay between the two nearly vertical seismically mapped fault segments above and below the Opalinus Clay. Within the structural record of the borehole, no major faulted interval was encountered. The micro fault frequency is comparable to the vertical boreholes (TBO reports in Tab. 2‑1). At the measured depth of approximately 650 m MD, a fault with indications for oblique slip and a dip of approximately 40° was encountered. This micro fault could be kinematically related to the conceptually interpolated Rheinau Fault segments between the above and below the Opalinus Clay (Fig. 4‑72). The observations in the Rheinau borehole are consistent with the deformation behaviour of Opalinus Clay, where strain tends to be more distributed (Section 5.5.4).
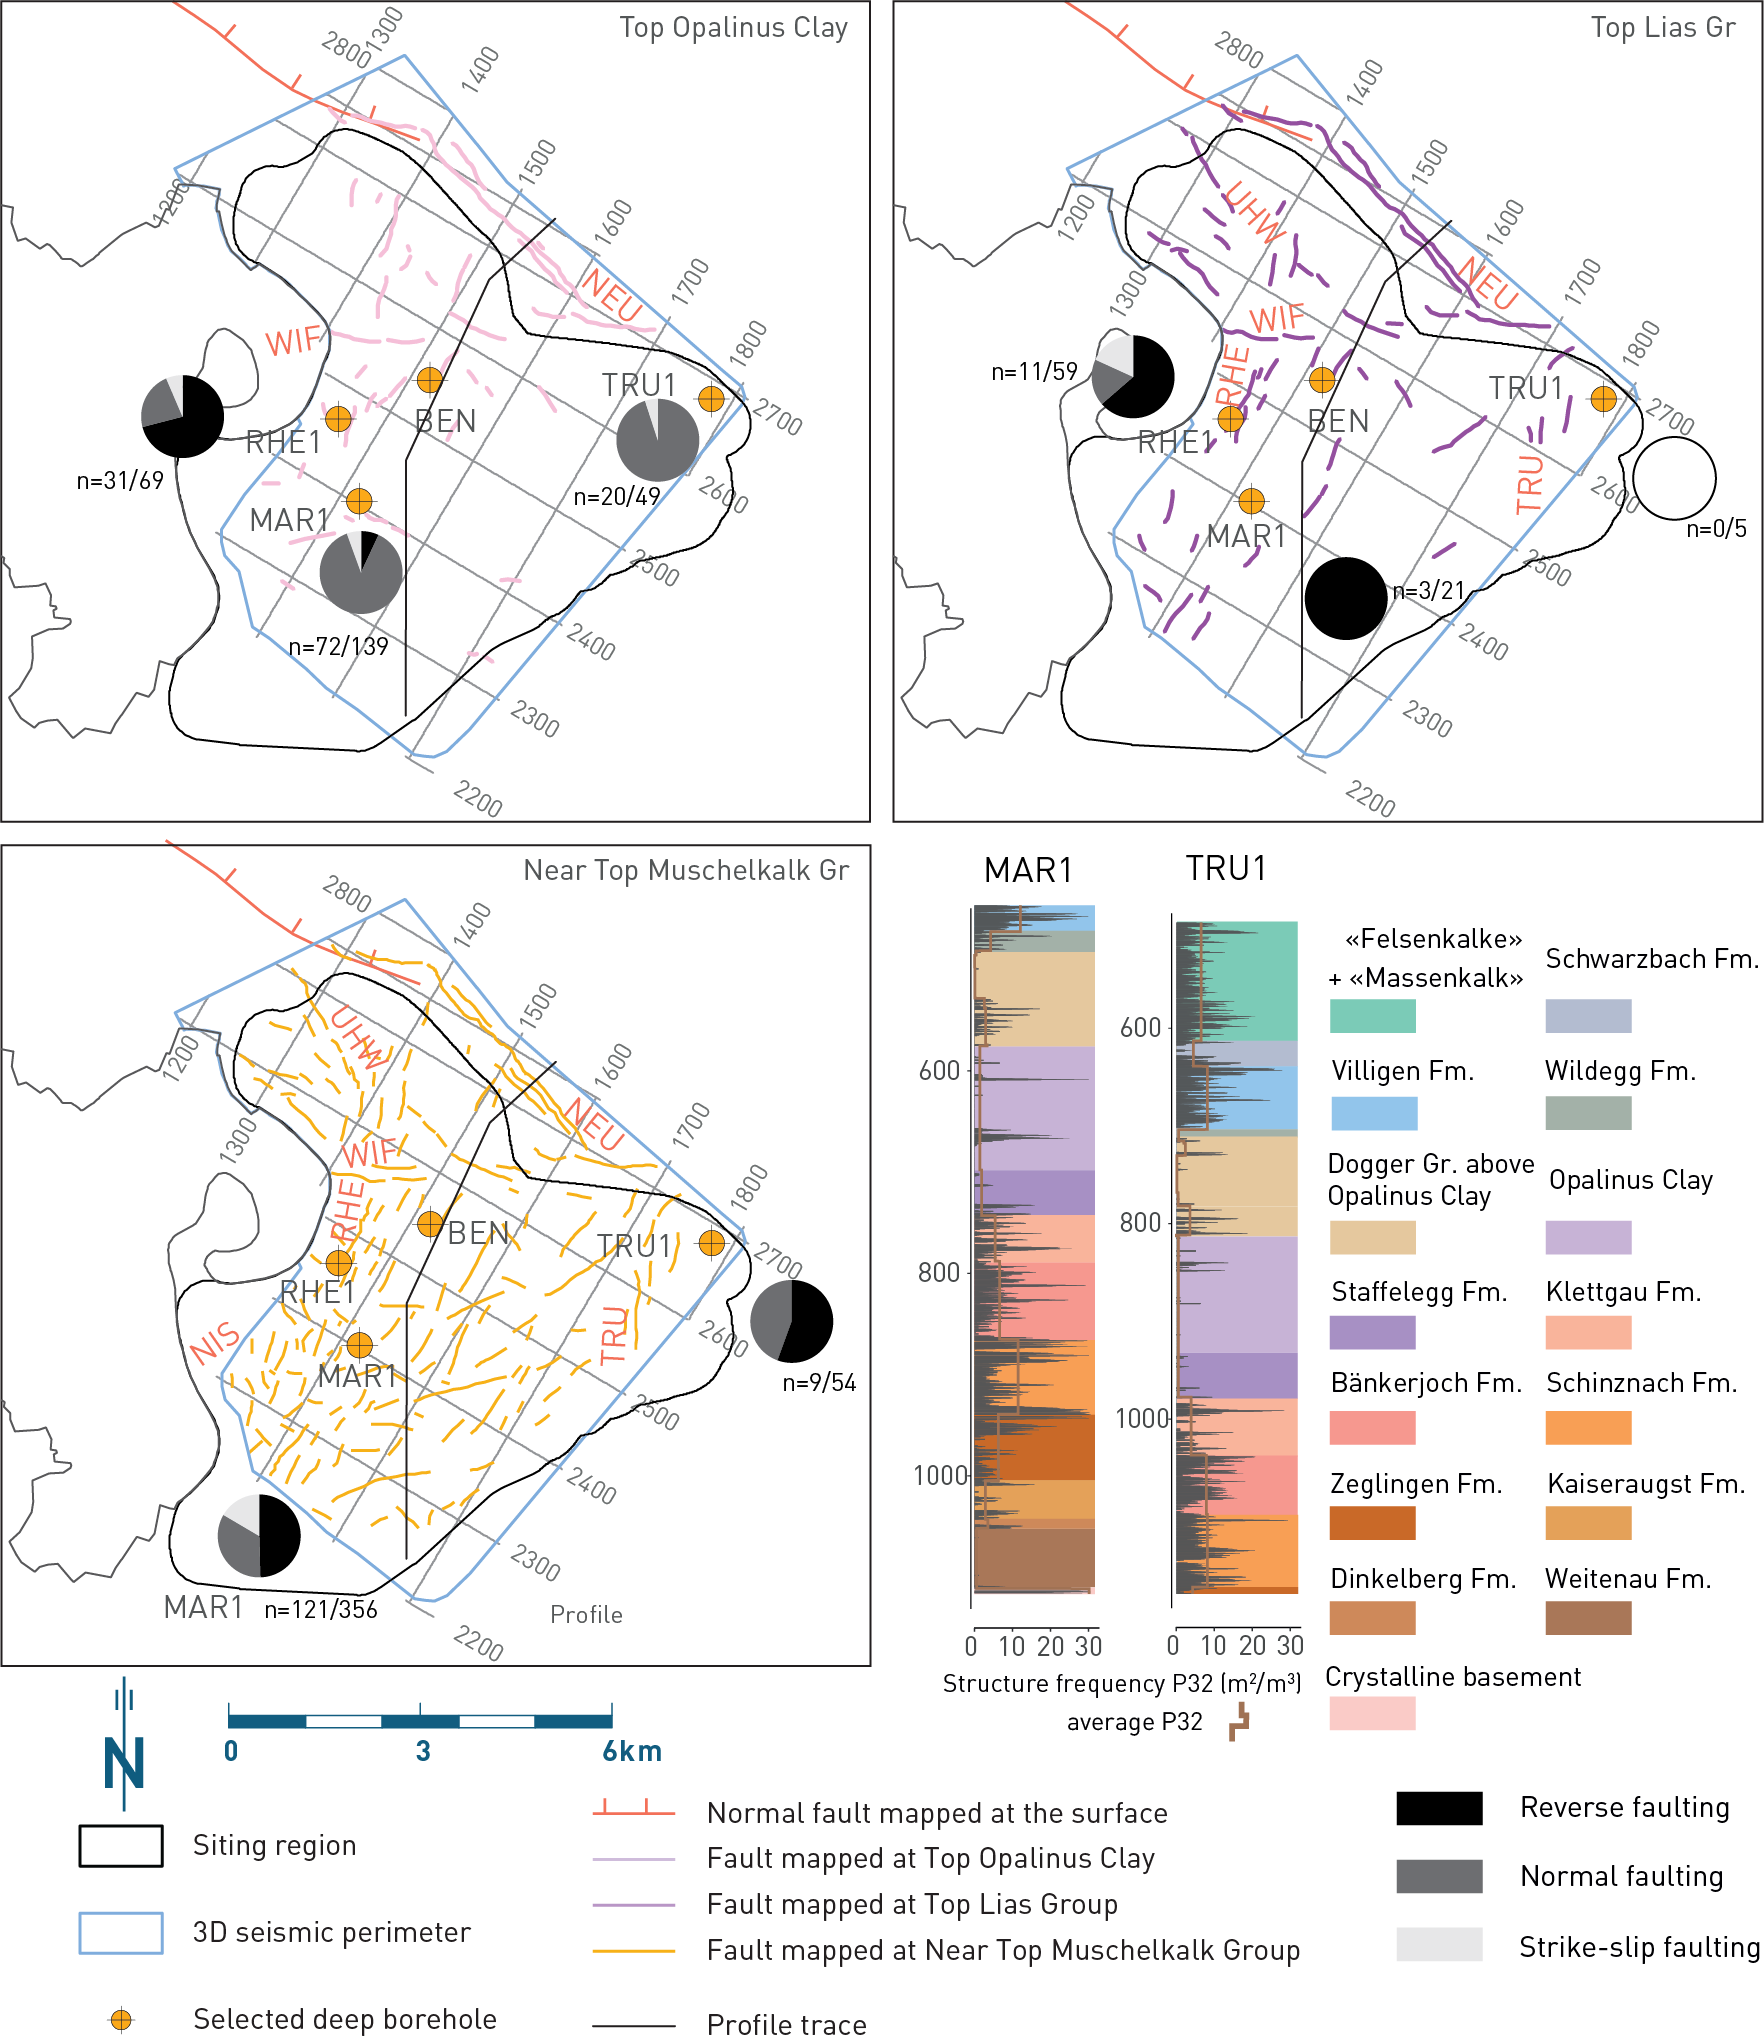
Fig. 4‑69:Fault map for ZNO (shown on three stratigraphic levels) and fracture frequencies in the recent deep boreholes
Fault maps based on seismic reflection interpretation reported in Nagra (2024c). Pie charts show the distribution of shear sense indicators within the Opalinus Clay, the Lias Group and the Muschelkalk Group, respectively. The numbers after 'n=' represent the total number of micro faults with shear sense indication / total number of micro faults. Reverse faulting encompasses all dip-slip upward movements. P32 values refer to the fracture area in a unit volume, i.e. the intersection area of the plane with the cylindrical core and, as such, represents a non-directional intrinsic measure of the degree of rock mass fracturing, incorporating both a frequency measure and a fracture-size component (Ebert & Decker 2019, Dershowitz 1985, Dershowitz & Herda 1992). NEU: Neuhausen Fault, NIS: "Strukturzone von Niderholz", RHE: Rheinau Fault, TRU: Trüllikon Fault, UHW: Uhwiesen Fault, WIF: Wildensbuch Flexure.
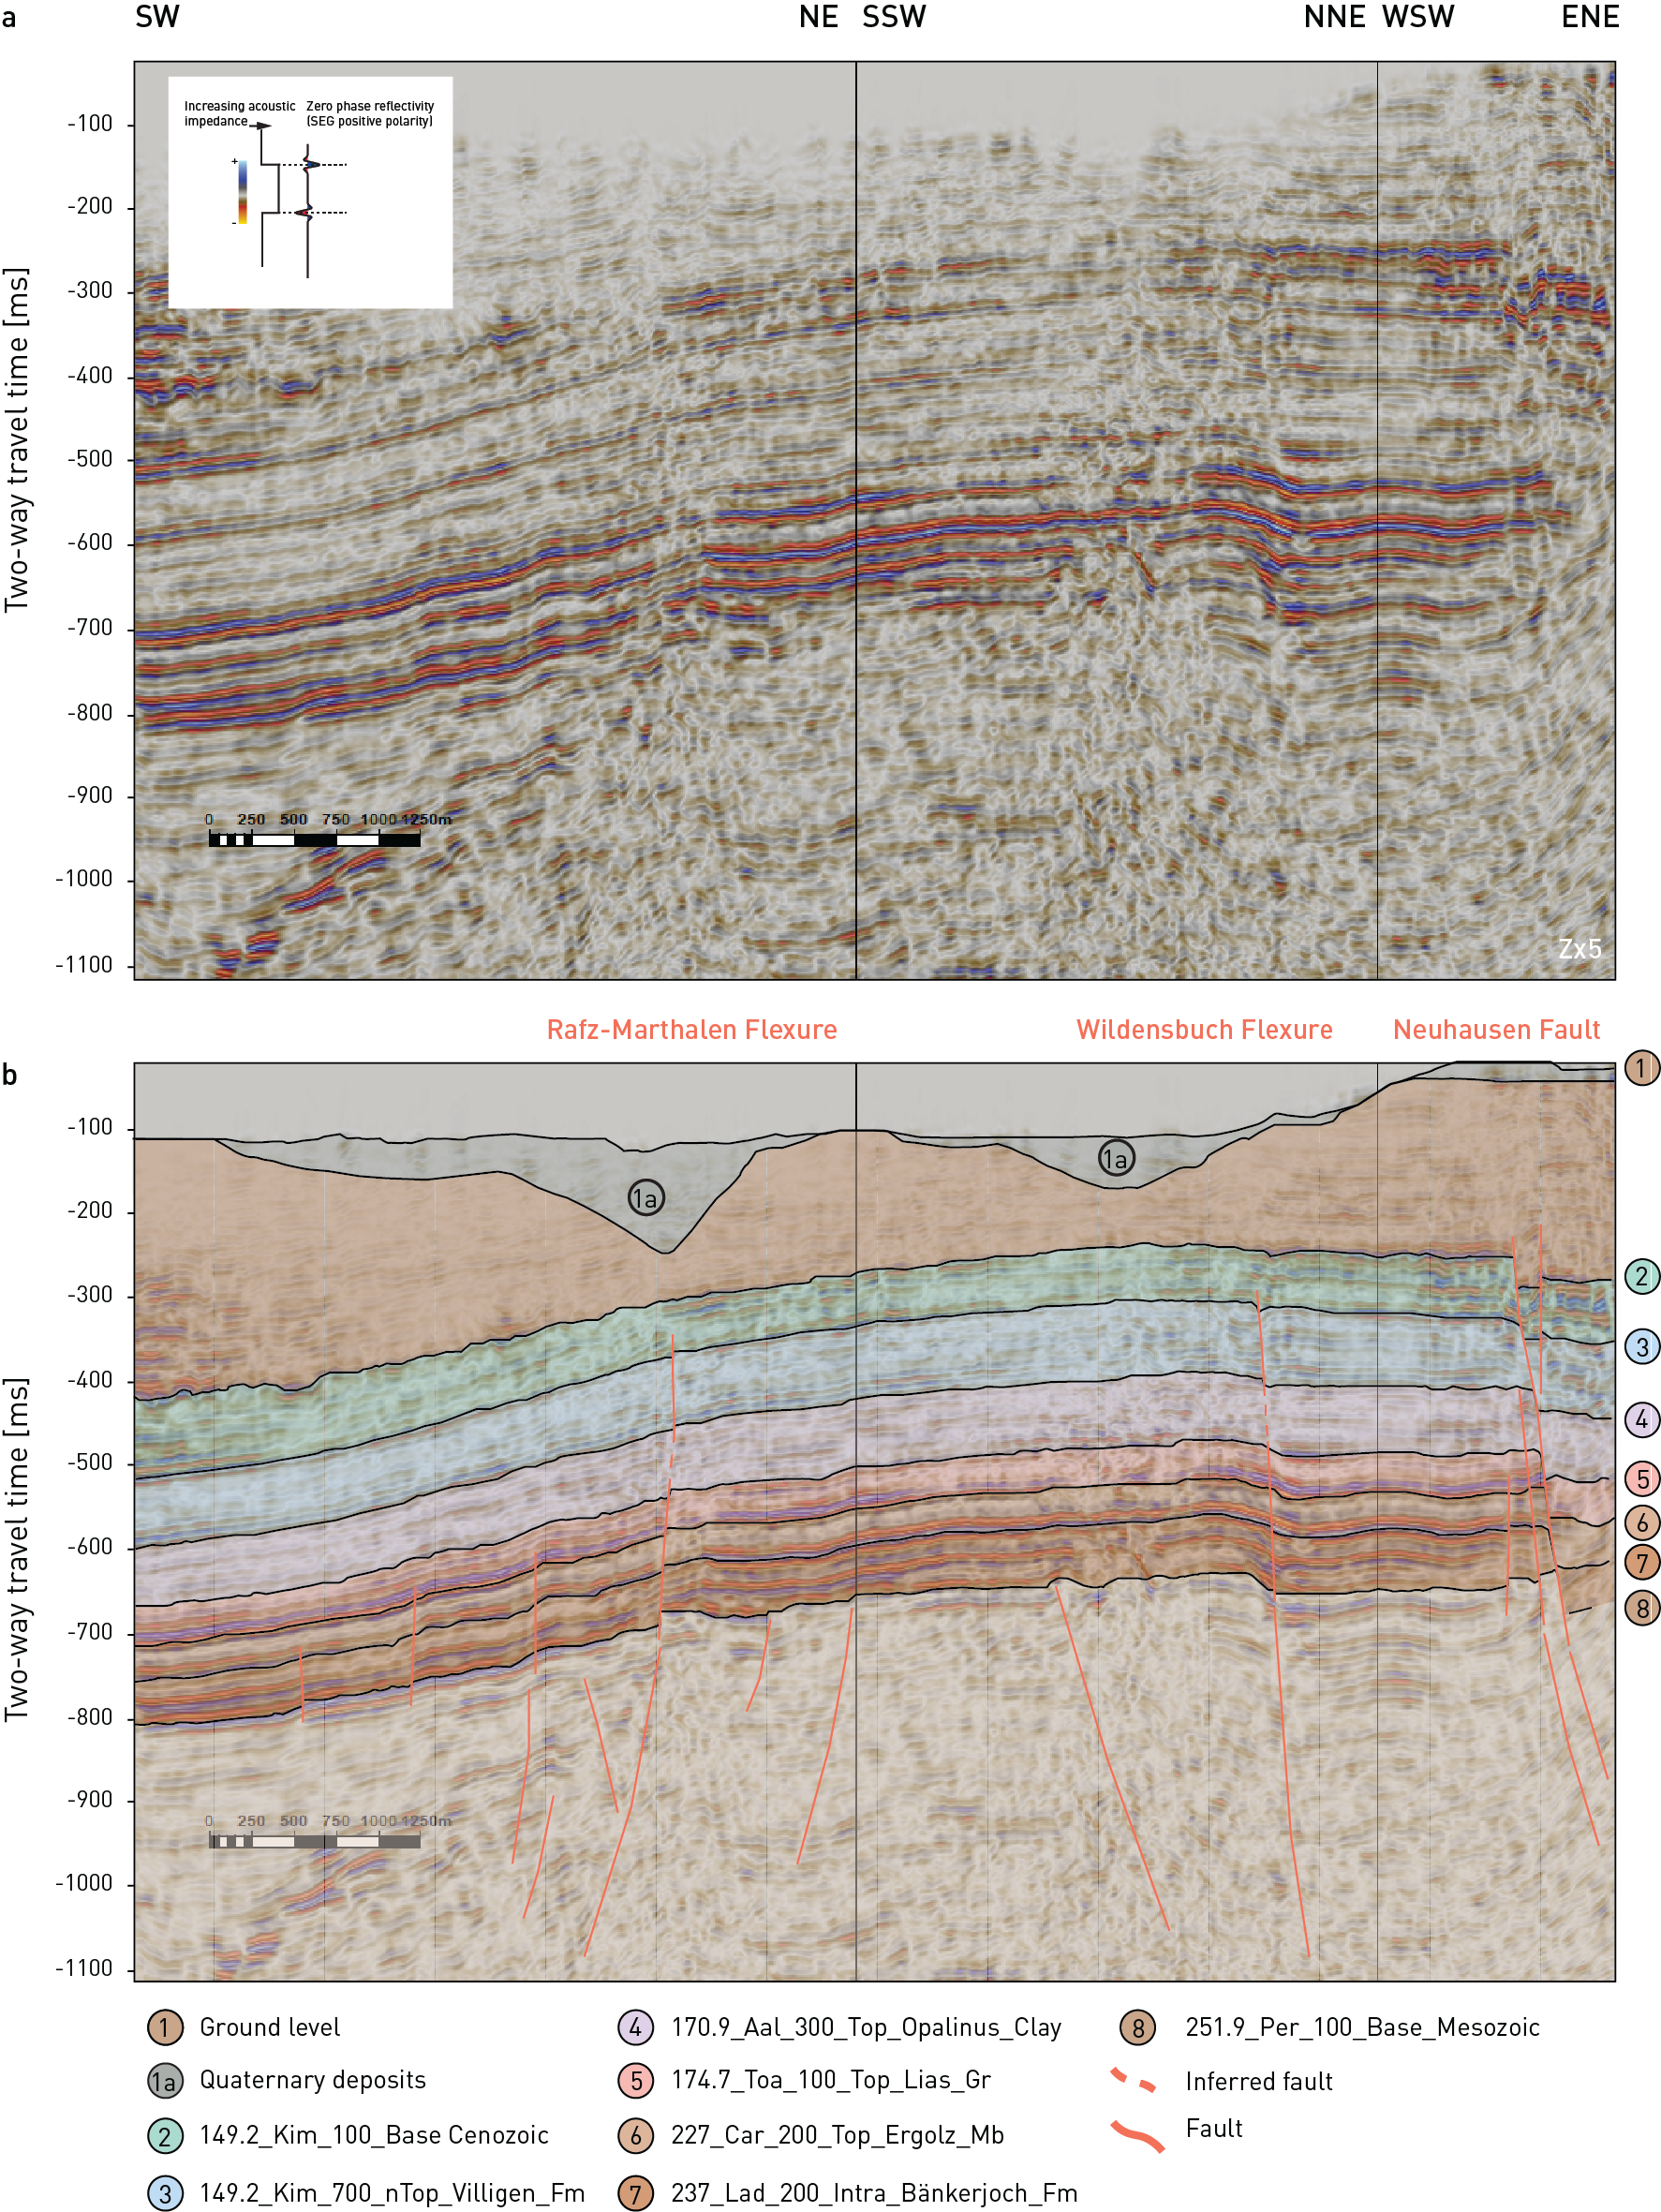
Fig. 4‑70:2D seismic reflection line extracted from 3D seismic reflection data across major structures in ZNO
Modified after Nagra (2024c). (a): Uninterpreted. (b): Interpreted. Seismic display is PreSTM-ref reflectivity with an overlay of relative acoustic impedance. Profile trace shown in Fig. 4‑69. The vertical axis was stretched 5 times (Z × 5).
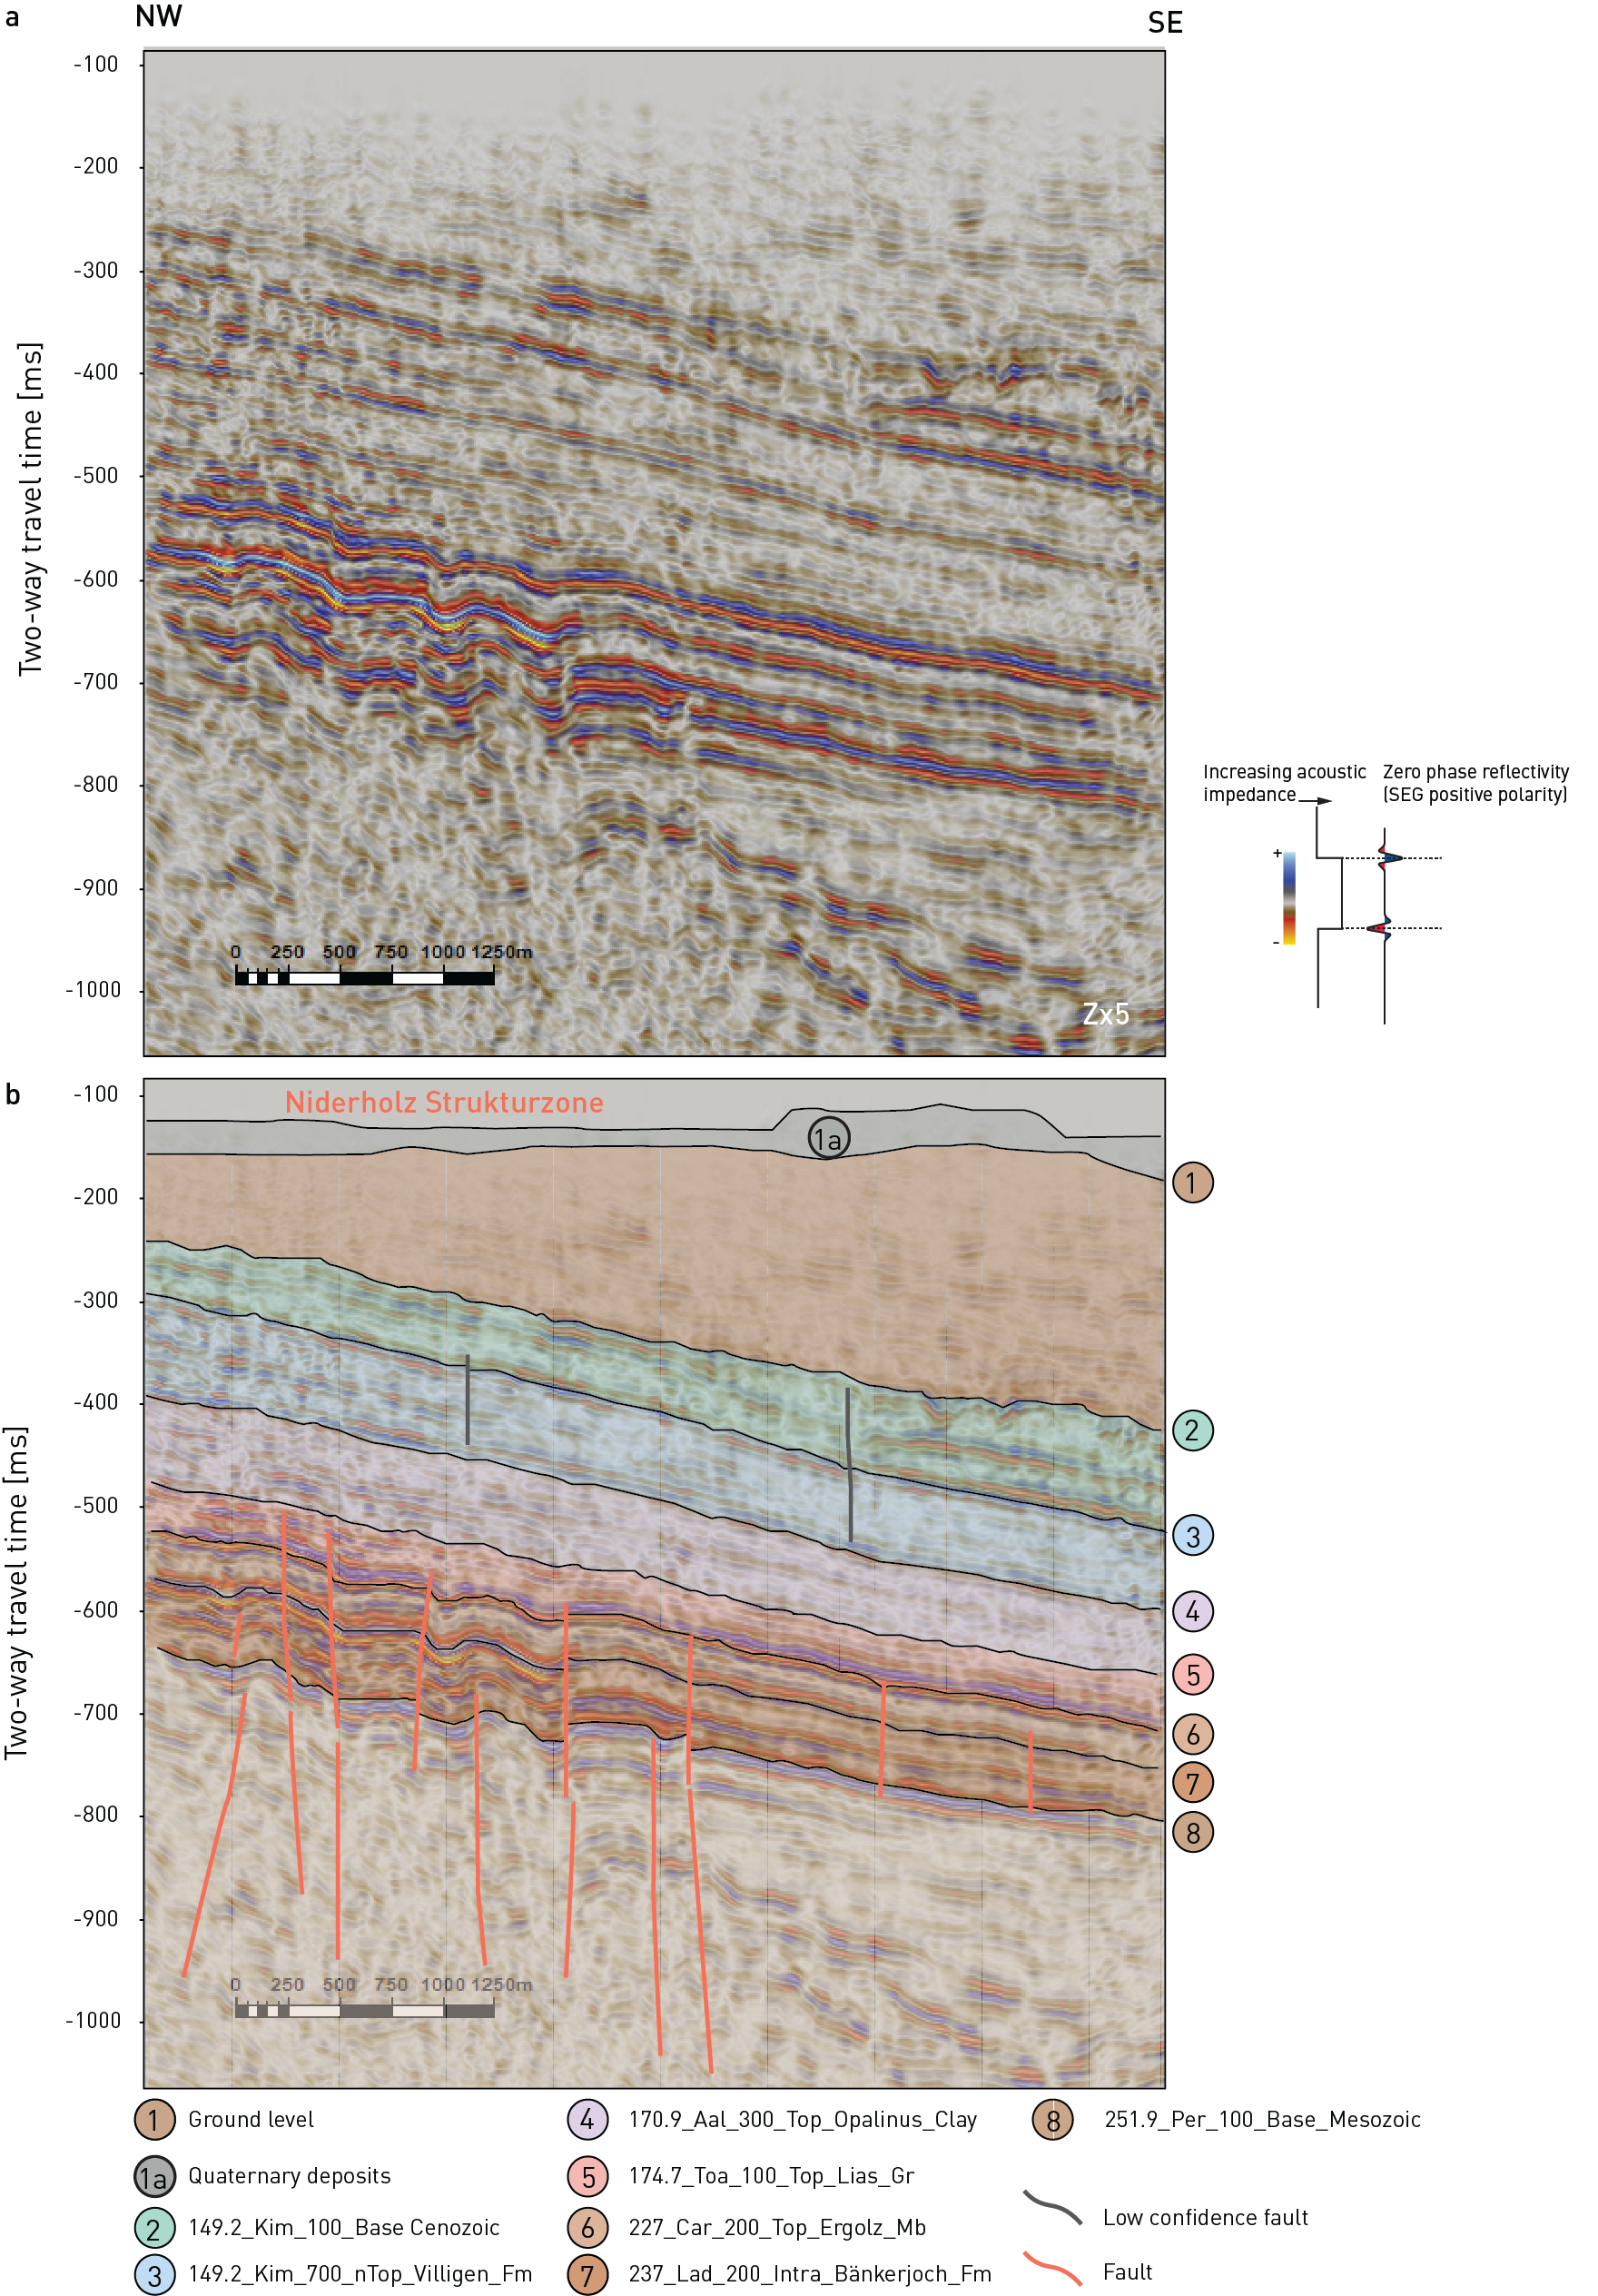
Fig. 4‑71:2D seismic reflection showing high-angle faults in the "Strukturzone von Niderholz"
View is along acquisition crossline 2320, modified after Nagra (2024c). (a): Uninterpreted. (b): Interpreted. Seismic display is PreSTM-ref reflectivity with an overlay of relative acoustic impedance. Profile trace shown in Fig. 4‑69. The vertical axis was stretched 5 times (Z × 5).
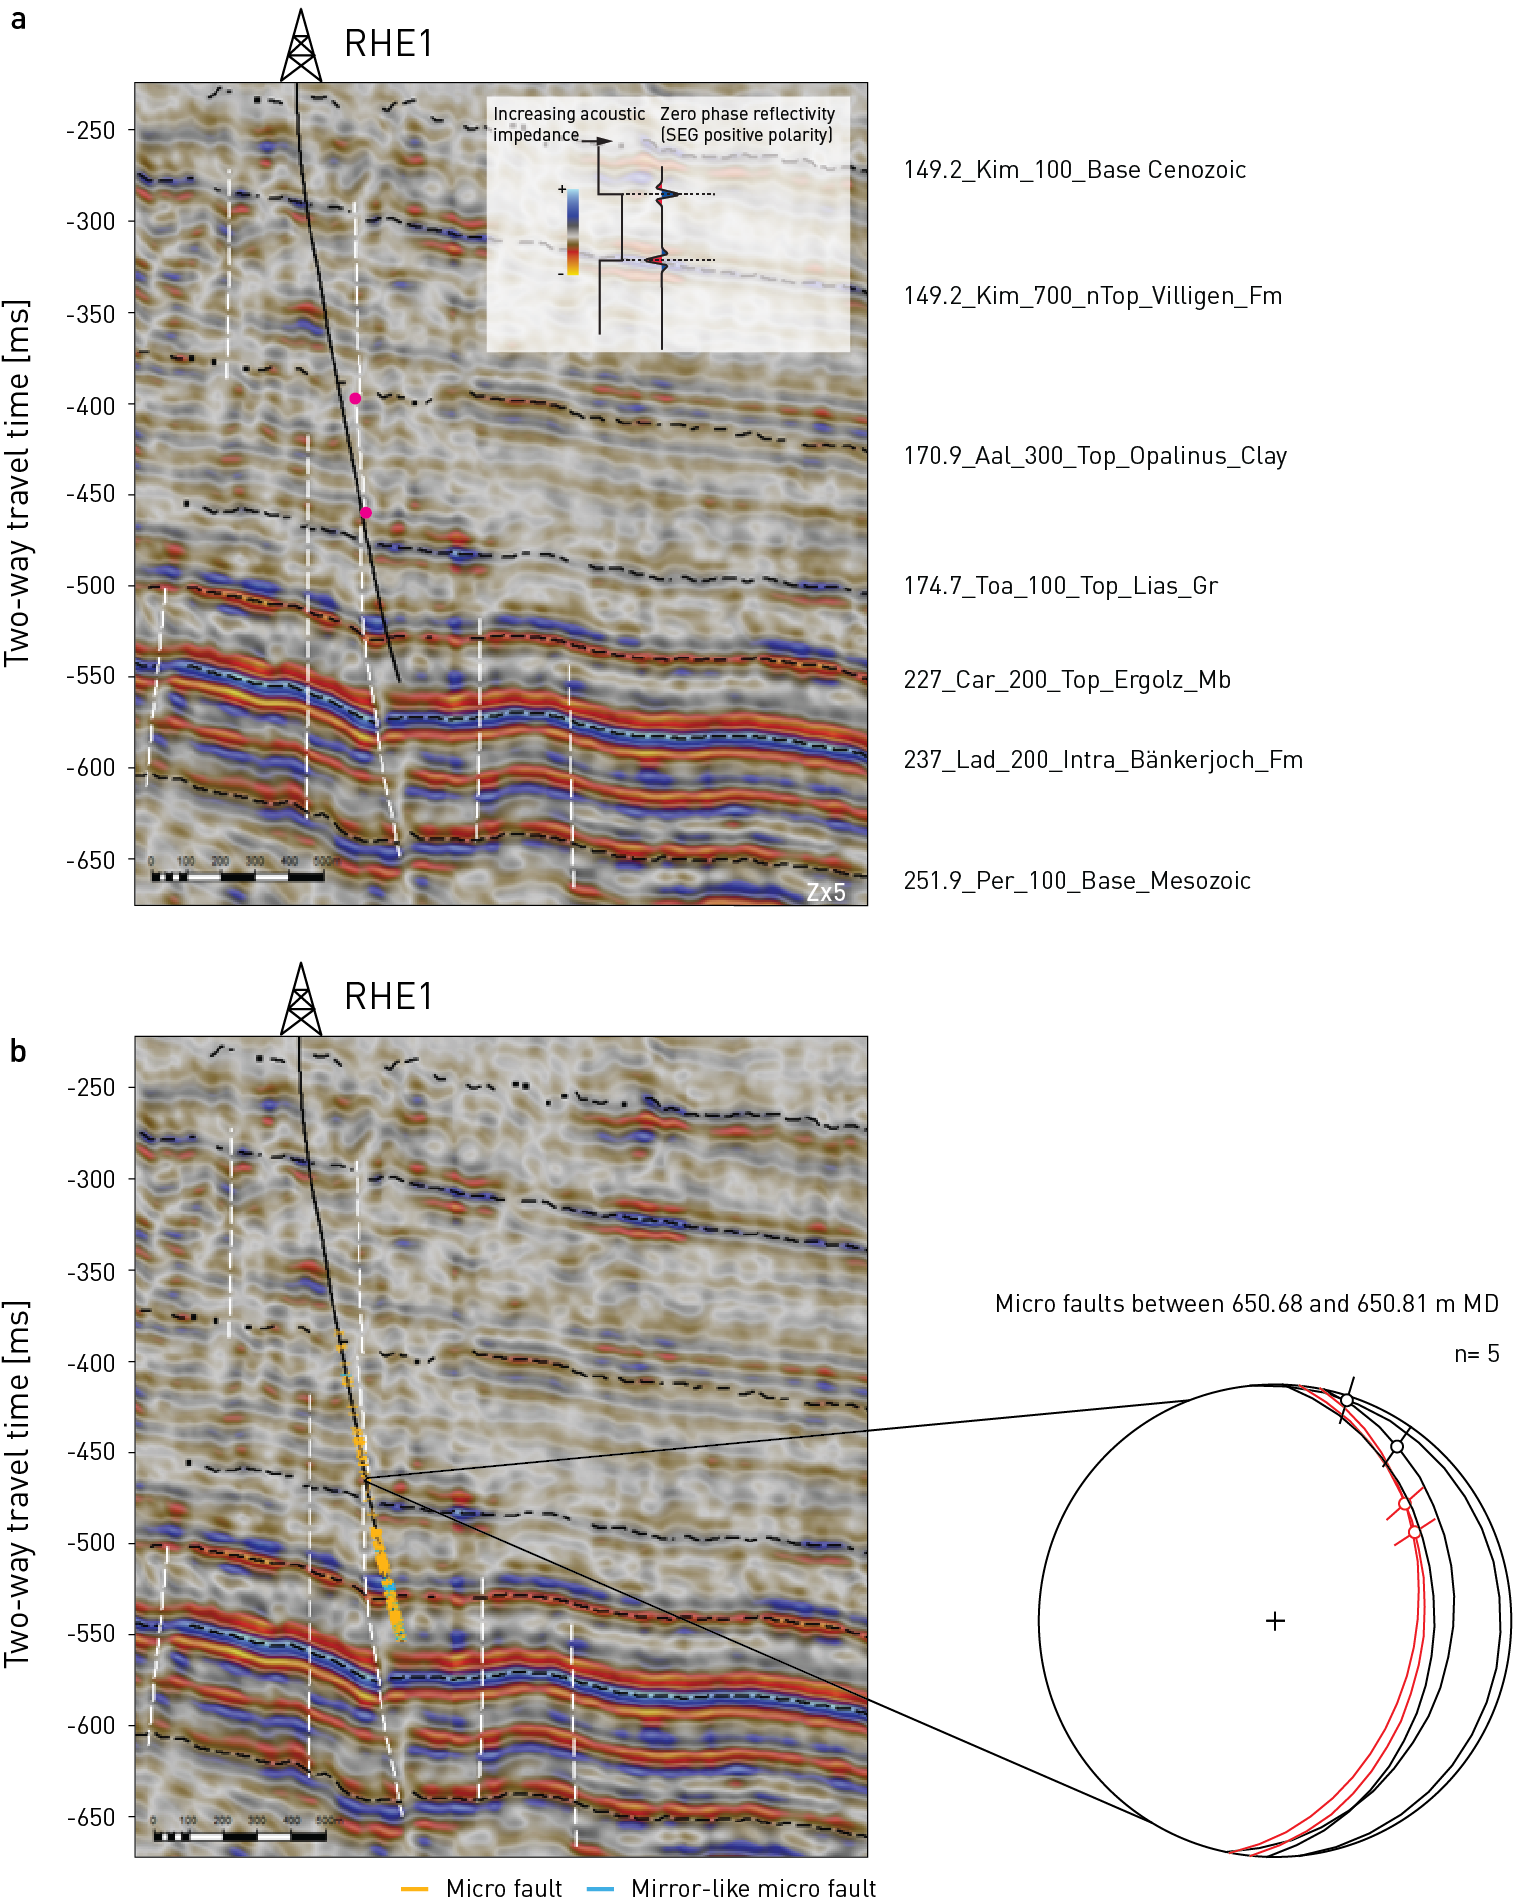
Fig. 4‑72:Rheinau Fault in a 2D seismic reflection line oriented parallel to the borehole path
Modified after Nagra (2024c). White dashed lines refer to interpreted fault segments. For the Rheinau fault, the segments mapped above and below the Opalinus Clay were conceptually connected with a separate fault stick (magenta dots) to indicate that the fault cannot directly be seen on the seismic data here in the Opalinus Clay (see Nagra 2024c for more details). (a) 2D seismic reflection line oriented parallel to the borehole path. (b) 2D seismic reflection line oriented parallel to the borehole path including structural inventory from borehole, and a lower hemisphere equal area projection showing orientation and slickenlines of micro faults encountered in the drill core at the depth of 650.7 – 650.8 m MD. The two micro faults highlighted in red could be related to the seismically mappable Rheinau Fault. Seismic display is PreSTM-ref reflectivity with an overlay of relative acoustic impedance (Nagra 2024c). The vertical axis was stretched 5 times (Z × 5).