
This section discusses data for mobile (i.e. non-retarded) natural tracers (stable isotopes of water, Cl, Br, He) obtained at the different sites investigated. From the shape of the tracer profiles, it is often possible to identify the hydrochemical boundaries of the low-permeability zone (aquitard) and to delineate the thickness of this zone. Furthermore, the relevance of transport processes (diffusion, advection) or of episodic events may be assessed by comparing data and model calculations. A careful analysis of the profiles and the palaeo-hydrogeological setting, including transport modelling, allows the past evolution of the groundwater-porewater interaction to be constrained and to test whether transport parameters obtained in the laboratory are applicable at larger scales.
It is advantageous to consider several different tracers to obtain more robust interpretations. The information provided by each tracer may differ. Tracers such as stable isotopes of water or anions are mostly influenced by processes at hydrogeological boundaries, while a tracer such as He is also affected by the internal production and release rate within the aquitard. Furthermore, transport parameters are not identical. For example, He diffusion coefficients in water are about three times higher, and effective He diffusion coefficients De in the Opalinus Clay are more than five times higher than those of a water tracer (Jacops et al. 2017), while De values of Cl are about four to five times lower than those of a water tracer. Also, during advective transport, anions typically experience a higher effective flow velocity because they are mostly located in larger pores (i.e. further away from negatively charged surfaces) with a higher local flow velocity. He transport tends to be more dominated by diffusion, while anion transport is more sensitive to advection compared to a water tracer. Finally, boundary conditions for the different tracers can vary independently, depending on the hydrogeological and climatic conditions. For example, freshwater recharge is characterised by low anion contents, while the signature of stable isotopes of such water depends also on the climatic conditions. The lack of unique relationships between boundary conditions for different tracers may, in turn, also complicate the definition of consistent sets of boundary conditions for the past.
The spatial distribution of tracer concentrations across low-permeability formations is the result of flow and solute transport processes that have acted over geological timescales. The composition of porewater in aquitards is affected by the initial water composition at the time of sediment deposition (connate water), by water-rock interactions and by solute exchange with adjacent aquifers. If the groundwater composition in an aquifer in contact with an aquitard changes as a result of a palaeo-hydrogeological event (e.g. new discharge zones, new recharge of meteoric water, different climatic conditions etc.; Fig. 4‑118), the changing groundwater signature propagates over time into the aquitard. As solute transport in an aquitard is generally slower than that in an aquifer, tracer profiles across the aquitard have a longer memory. They record situations in the distant past, in particular in their central region where signals from changing boundary conditions in the aquifers are most strongly retarded and attenuated. If molecular diffusion dominates transport across the aquitard, the trends of tracer concentrations are anticipated to be relatively smooth, while advection across the aquitard could (depending on other parameters) lead to sharper tracer fronts.
A tracer profile obtained in a given borehole can represent a steady-state situation, but more often it represents a snapshot of a slowly evolving, transient situation. The profile can be interpreted by transport modelling. The modelling tries to simulate the observed tracer pattern assuming suitable initial and boundary conditions in the past and using transport parameters that were derived from laboratory experiments. Before doing so, it is appropriate to be aware of the approximate ‘field of view', that is of the approximate time and space scales of observation. For one-dimensional diffusive transport, a diffusive timescale td for the propagation of a mobile (non-retarded) tracer over a distance x can be obtained as:
![]()
where Dp is the pore diffusion coefficient. If we assume a thickness x of an aquitard of 100 m and a Dp of 10–10 m2 s–1 (e.g. the Opalinus Clay at in-situ temperature), a change at the boundary of the aquitard would roughly propagate up to the centre of the aquitard in a time frame of about 0.8 Myr. For a thickness of 300 m, the characteristic time would increase ninefold, i.e. to 7.2 Myr. That is, it would still be expected to see a (transient) response of a change in boundary conditions within a formation of 100 or 300 m thickness if this change happened less than about 1 Myr or 7 Myr ago, respectively. In contrast, the new signature would already have affected large parts of the formation if the change had happened several Myr or several tens of Myr ago, respectively. The detailed response would also depend on the variability of diffusion properties or on any influence of advection, but this simple calculation sets a time frame for the interpretation of tracer profiles. It also shows that, during the long time since deposition of the Opalinus Clay, its porewater composition has definitively been altered, inter alia by exchange with groundwater in bounding aquifers and with porewater in embedding formations.
Different methods are required to obtain the concentrations of tracers. Values of the stable isotopes of water (δ2H, δ18O) were mainly obtained by diffusive isotope exchange experiments (Aschwanden et al. 2024, Gimmi et al. 2024). This method is well established and provides robust data for clay-mineral-rich samples but is more challenging and leads to slightly larger uncertainties for low-porosity samples (e.g. limestones or evaporites). Anion (Cl, Br) contents of the porewater were mainly obtained from aqueous leachates (Zwahlen et al. 2024, Wersin et al. 2023), but a substantial dataset from advective displacement (AD) and squeezing (SQ) experiments is also available. The aqueous leachate data have to be scaled by the anion-accessible porosity fraction in order to obtain concentrations per anion-accessible pore volume (as needed for transport modelling, see Section 5.4.2 and Zwahlen et al. 2024). The required scaling was done based on data from diffusion experiments or based on the combined data from advective displacement and squeezing experiments. The scaling leads in the end to increased uncertainties of the Cl or Br concentrations per accessible porewater, especially for low-clay samples (Wersin et al. 2023). The Br/Cl ratios, in contrast, are not affected by the uncertainty regarding the accessible pore fraction, which is probably very similar for the two ions and thus cancels out in their ratio. Noble gas contents in porewater were obtained by outgassing experiments (Rufer et al. 2024). Helium in particular is characterised by a low abundance in air and air-saturated water, an in-situ geogenic production through radioactive decay of U and Th in the rock matrix as well as a high diffusivity in the porewater. The resulting enrichment of helium in the aquitard porewater relative to (most) groundwaters and its efficient diffusive redistribution makes it a useful tracer to investigate and temporally constrain even younger hydrogeological disturbances.
Diffusive transport of δ2H, δ18O, Cl, and Br across the formations between the Malm and Muschelkalk was modelled using the numerical code PFLOTRAN (www.pflotran.org). Sensitivity calculations including advection were previously undertaken for data from the Benken (BEN) borehole in the ZNO region; they indicated the lack of any signature of an advective component (Gimmi & Waber 2004, Gimmi et al. 2007). Similar sensitivity calculations are being done for the new tracer profiles. Unlike the earlier simulations for data from the BEN (Gimmi et al. 2007) and Schlattingen-1 boreholes (Wersin et al. 2018), porosities and pore diffusion coefficients were varied with depth in the current modelling campaign, based on measured diffusion data (Van Loon et al. 2023) and temperature logs (Section 4.8).
Simulating the detailed evolution of the porewater in the low-permeability sequence since the time of deposition is not considered meaningful because of the collective uncertainties. It is likely that the changing boundary conditions since deposition and the prolonged interaction times have led to profiles with comparably smooth trends with depth, before more recent changes at the currently active boundaries left their signatures in the aquitard. Based on the tectonic and burial history of Northern Switzerland (Section 4.3.5), modelling concentrated on the last ~ 10 Myr, starting by using the δ2H and δ18O data that have comparably small analytical uncertainties. The procedure was as follows: First, approximate initial conditions for these simulations were fixed (constant value for δ2H based on maximum values towards the centre of the profiles, decreasing values with depth for δ18O based on the general trend in the central part, see Section 4.6.2). Then, step changes of the boundary conditions to the different aquifers (when present) to present-day values were applied. The times of these step changes were treated as unknowns; they were fitted so that a good match of the simulations with the overall shape of the profile was obtained. In some cases, two step changes of the boundary condition were considered, in order to account for observed trends. The evolution times derived in this way from the profiles of the water tracers were then used for the subsequent simulations of the profiles of Cl and Br (also setting their constant initial concentrations at the maximum values found in the central part).
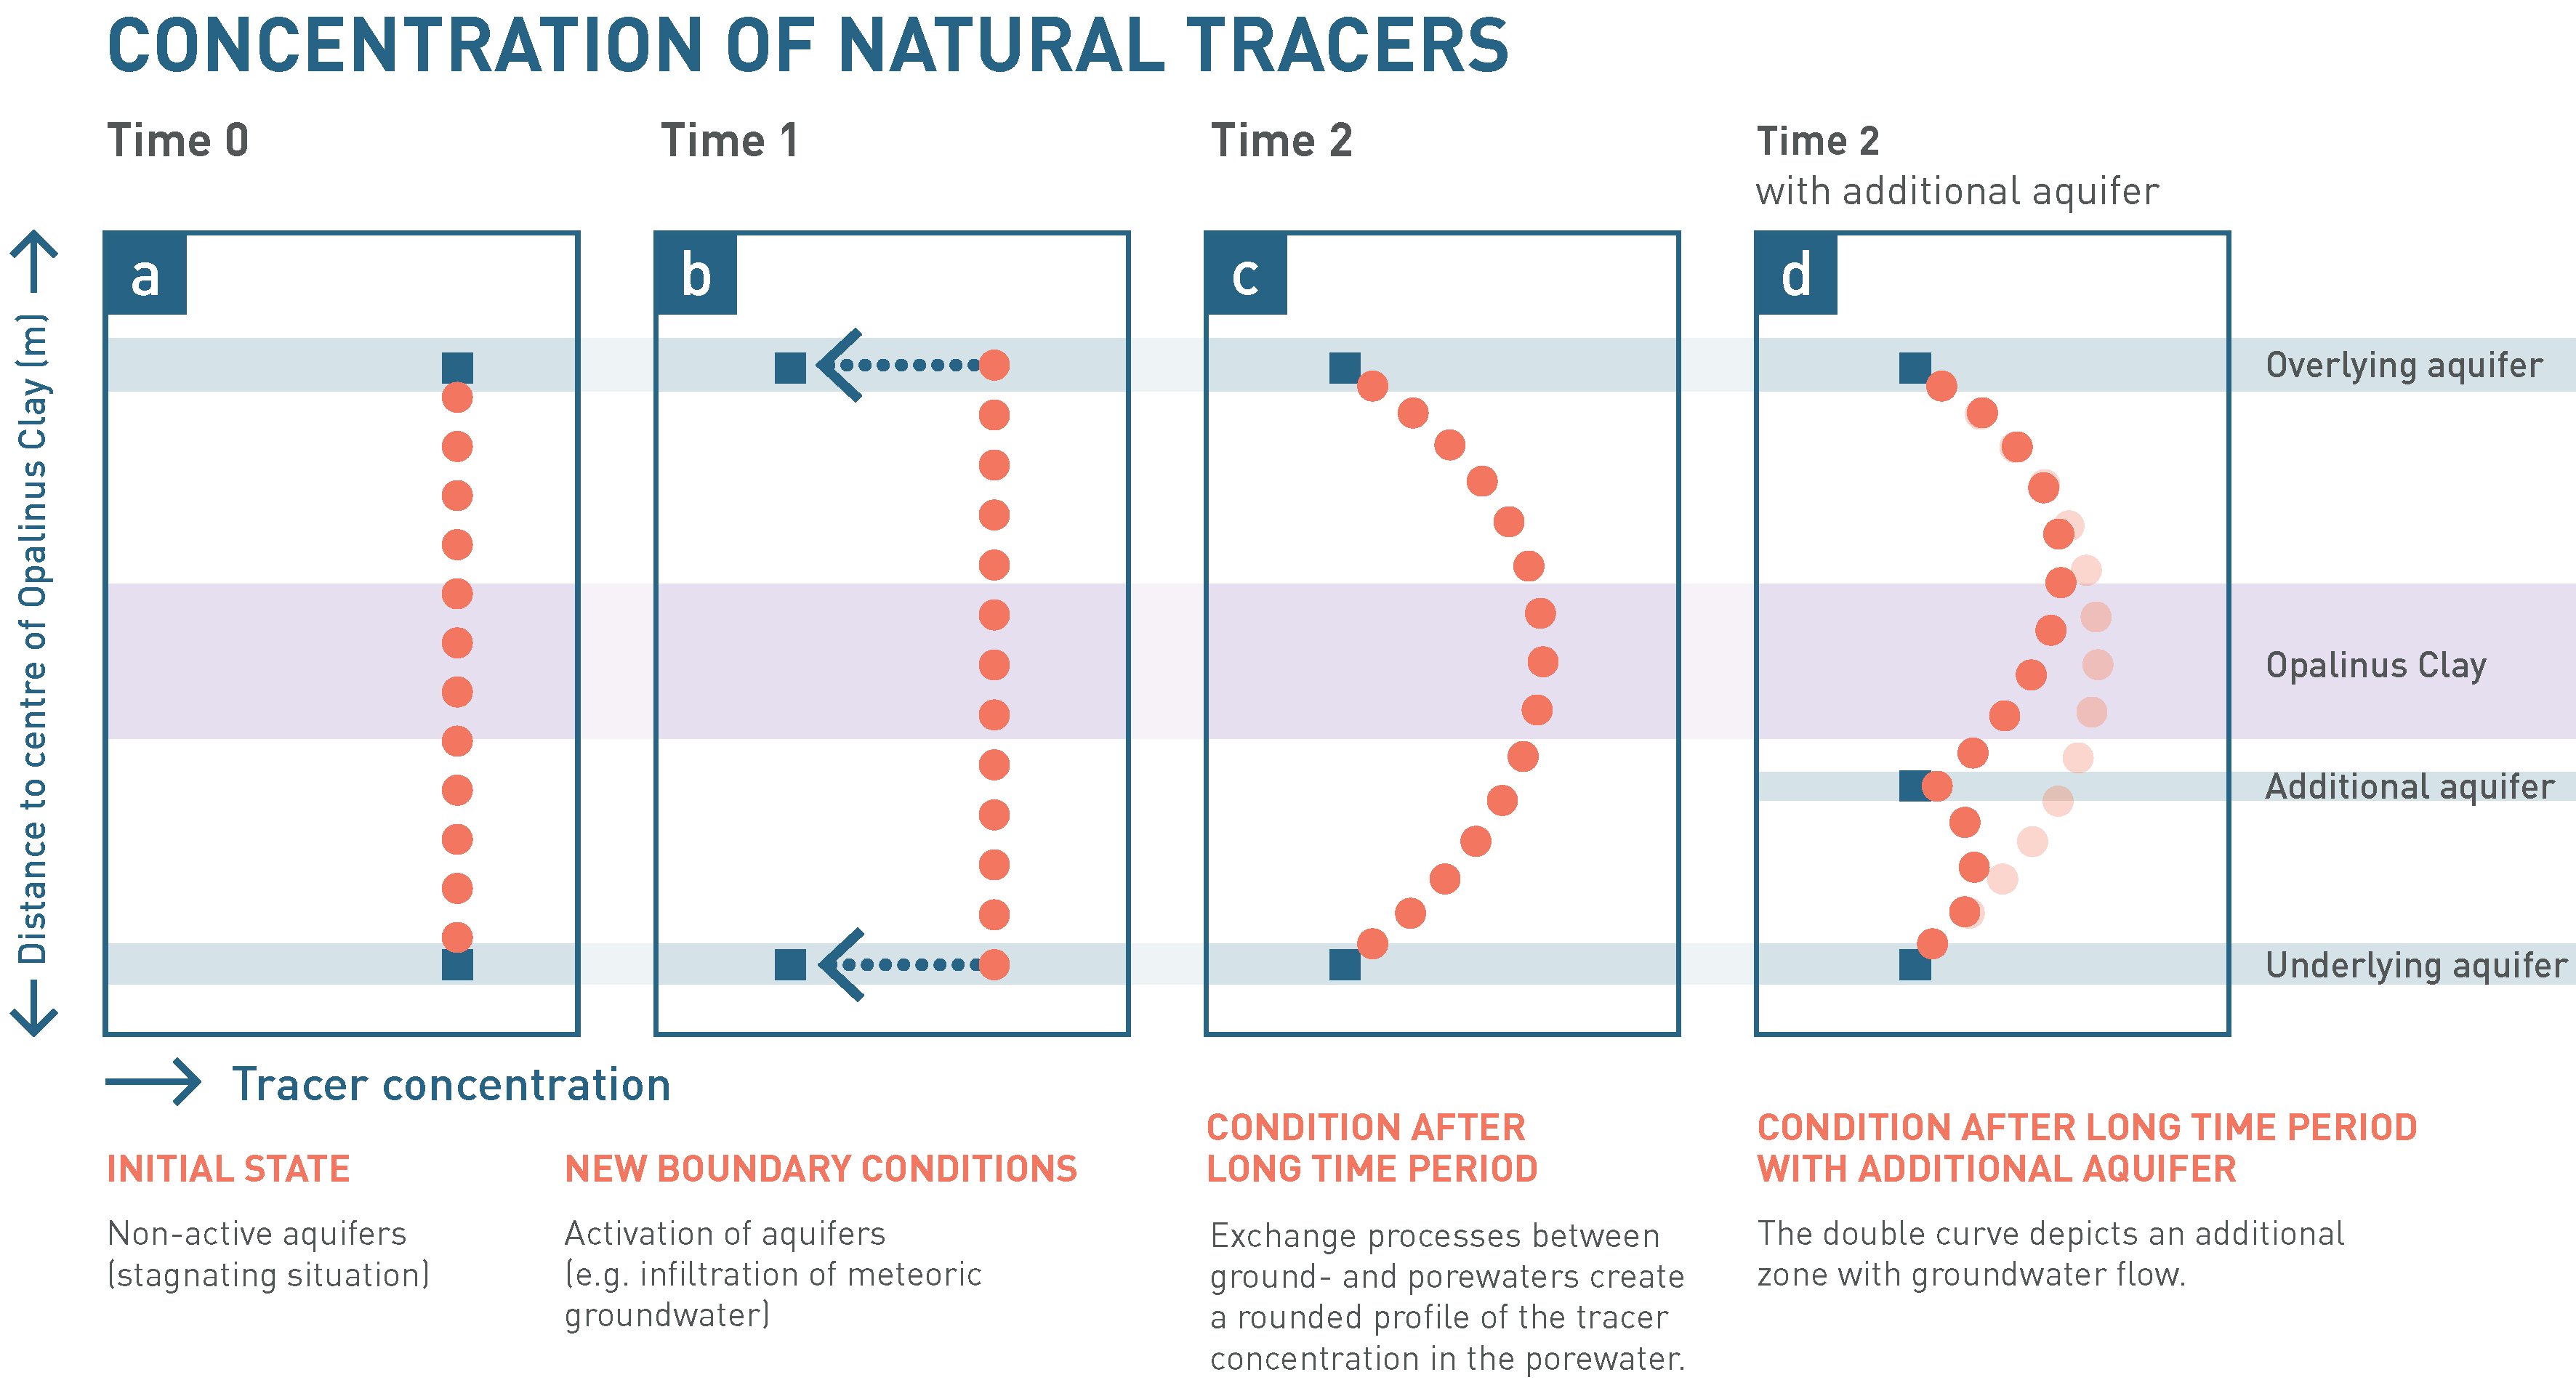
Fig. 4‑118:Illustration of possible evolution of tracer profiles across an aquitard sequence driven by concentration changes in two or more bounding aquifers
Example of a tracer without in-situ production.