
A total of 9 new deep boreholes were drilled between 2019 and 2022. Together with the existing deep boreholes Riniken (RIN; JO), Weiach (WEI; NL) and Benken (BEN; ZNO), each of the three siting regions has between 3 and 5 deep boreholes, which were used for calibration and depth conversion of the 3D seismic data (Fig. 2‑2).
The main aims of the most recent drilling programme were the calibration of the 3D seismic data and the geological characterisation of the host rock and the adjacent low-permeability confining units (e.g. mineralogy, porosity, transport properties, geomechanical properties, hydraulic state, stress conditions; see Chapters 4 and 5). A further aim was to characterise the deep aquifers above and below the host rock and its low-permeability confining units as they define the boundary conditions for transport in the aquitard sequence and represent the most important hydraulic connection to the biosphere. The investigations of the deep aquifers included an assessment of hydraulic conductivities, hydraulic heads and the characterisation of the groundwater geochemistry and residence times.
In most of the boreholes, the bulk of the Mesozoic rock sequence and the uppermost part of the underlying Paleozoic rock was cored, providing information on the host rock, confining units, neighbouring aquifers and on the underlying evaporitic series, known to be relevant for tectonic evolution. One of the boreholes, RHE1 (ZNO), was deviated to investigate the structural and hydrogeological characteristics of the Opalinus Clay in the area of a steeply dipping fault.
A comprehensive programme of investigations was undertaken downhole and on rock cores, and fluid samples were obtained from the boreholes. Downhole investigations included petrophysical logging, groundwater sampling and in-situ testing (fluid logging, hydraulic packer tests, microhydraulic fracturing tests). Following detailed core logging, a comprehensive characterisation programme of laboratory measurements was performed, including mineralogy, porosity, hydraulic conductivity, porewater and groundwater chemistry, groundwater dating, as well as a suite of geomechanical properties with customised on-site sampling and sample conditioning procedures (Rufer & Stockhecke 2019) and laboratory measurement protocols (e.g. Minardi et al. 2021, Waber 2020).
A generic work programme including a short description of the exploration tools can be found in Nagra (2019a). The results of field investigations and laboratory measurements are documented in comprehensive borehole-specific data reports (Tab. 2‑1).
Tab. 2‑1:List of Nagra’s 9 deep boreholes drilled 2019 – 2022 and other important deep boreholes (shown in italics), including references to data reports
MD: Measured depth below ground level. 1 498.51 m true vertical depth (TVD), 2 745.33 m TVD, 3 only middle and lower sections of Opalinus Clay (OPA) encountered. Borehole locations are shown in Fig. 2‑2.
|
Siting region |
Borehole name |
Abbrevi ation used in report |
Data reports |
Nagra Report No. |
Depth Top OPA [m MD] |
Final depth [m MD] |
|---|---|---|---|---|---|---|
|
JO |
Bözberg-1-1 |
BOZ1 |
530.28 |
1'037.39 |
||
|
JO |
Bözberg-2-1 |
BOZ2 |
NAB 21-22 |
451.54 |
829.11 |
|
|
JO |
Riniken |
RIN |
NTB 88-09 |
450.93 |
1'800.50 |
|
|
JO |
Beznau |
BEZ |
NTB 84-34 |
(20.3) 3 |
321.8 |
|
|
NL |
Bülach-1-1 |
BUL1 |
NAB 20-08 |
891.70 |
1'370.19 |
|
|
NL |
Stadel-3-1 |
STA3 |
NAB 22-01 |
779.26 |
1'280.88 |
|
|
NL |
Stadel-2-1 |
STA2 |
NAB 22-02 |
799.67 |
1'288.12 |
|
|
NL |
Bachs-1-1 |
BAC1 |
NAB 22-04 |
808.34 |
1'306.26 |
|
|
NL |
Weiach |
WEI |
NTB 88-08 |
665.67 |
2'482.20 |
|
|
ZNO |
Trüllikon-1-1 |
TRU1 |
NAB 20-09 |
816.42 |
1'310.0 |
|
|
ZNO |
Marthalen-1-1 |
MAR1 |
NAB 21-20 |
590.35 |
1'099.25 |
|
|
ZNO |
Rheinau-1-1 |
RHE1 |
NAB 22-03 |
524.61 1 |
827.99 2 |
|
|
ZNO |
Benken |
BEN |
NTB 00-01 |
652.04 |
1'007.00 |
|
|
– |
Schafisheim |
SHA |
NTB 88-11 |
1'079.95 |
2'006.50 |
|
|
– |
Schlattingen-1 |
SLA1 |
NPB 12-16 |
949.70 |
1'508.00 |
The deep drilling programme substantially expanded the database for characterising and quantifying radionuclide transport in the geological barrier. Fig. 2‑3 shows the marked increase in the available data for some key measurements relating to safety:
-
The large number of additional hydraulic packer tests increases confidence in the hydraulic characterisation of the host rock, adjacent low-permeability confining units and neighbouring aquifers (Sections 4.5.3 and 5.6).
-
A large number of diffusion measurements from various lithologies across the host rock and confining units allows the diffusion properties to be quantitatively linked to the clay-mineral content (Section 5.8). This increases the representativity and robustness of the diffusion properties used for transport modelling.
-
Closely spaced porewater chemistry determinations along all boreholes (profiles of natural tracers in the porewater; see Section 4.6), in combination with groundwater geochemistry measurements and 81Kr groundwater residence times from the aquifers (see Section 4.5.5), provide key information on transport over the past 104 to 107 years. Furthermore, the porewater chemistry measurements in the Opalinus Clay allow the characterisation of the geochemical conditions in the host rock to understand the stability of the engineered barriers (Section 5.4).
-
A detailed programme of mineralogical characterisation of the host rock and confining units (Section 5.2) allows the relationship to other key parameter measurements (e.g. geomechanical properties, diffusion coefficients and hydraulic conductivity) to be quantified (Sections 5.5, 5.6 and 5.8). This is important in assessing long-term stability, because the clay-mineral content is a key factor controlling the self-sealing behaviour of faults (Section 5.7).
-
A thorough understanding of the stress state in the host rock is important for engineering design and long-term stability (repository-induced effects, self-sealing of faults). The dataset gained from microhydraulic fracturing in the new campaign is exceptional both in terms of methods applied and data frequency and allows a robust characterisation of the stress magnitudes (Section 4.4).
A more detailed discussion of the evolution of the database and the related progress in site characterisation and process understanding is given in Section 7.1.
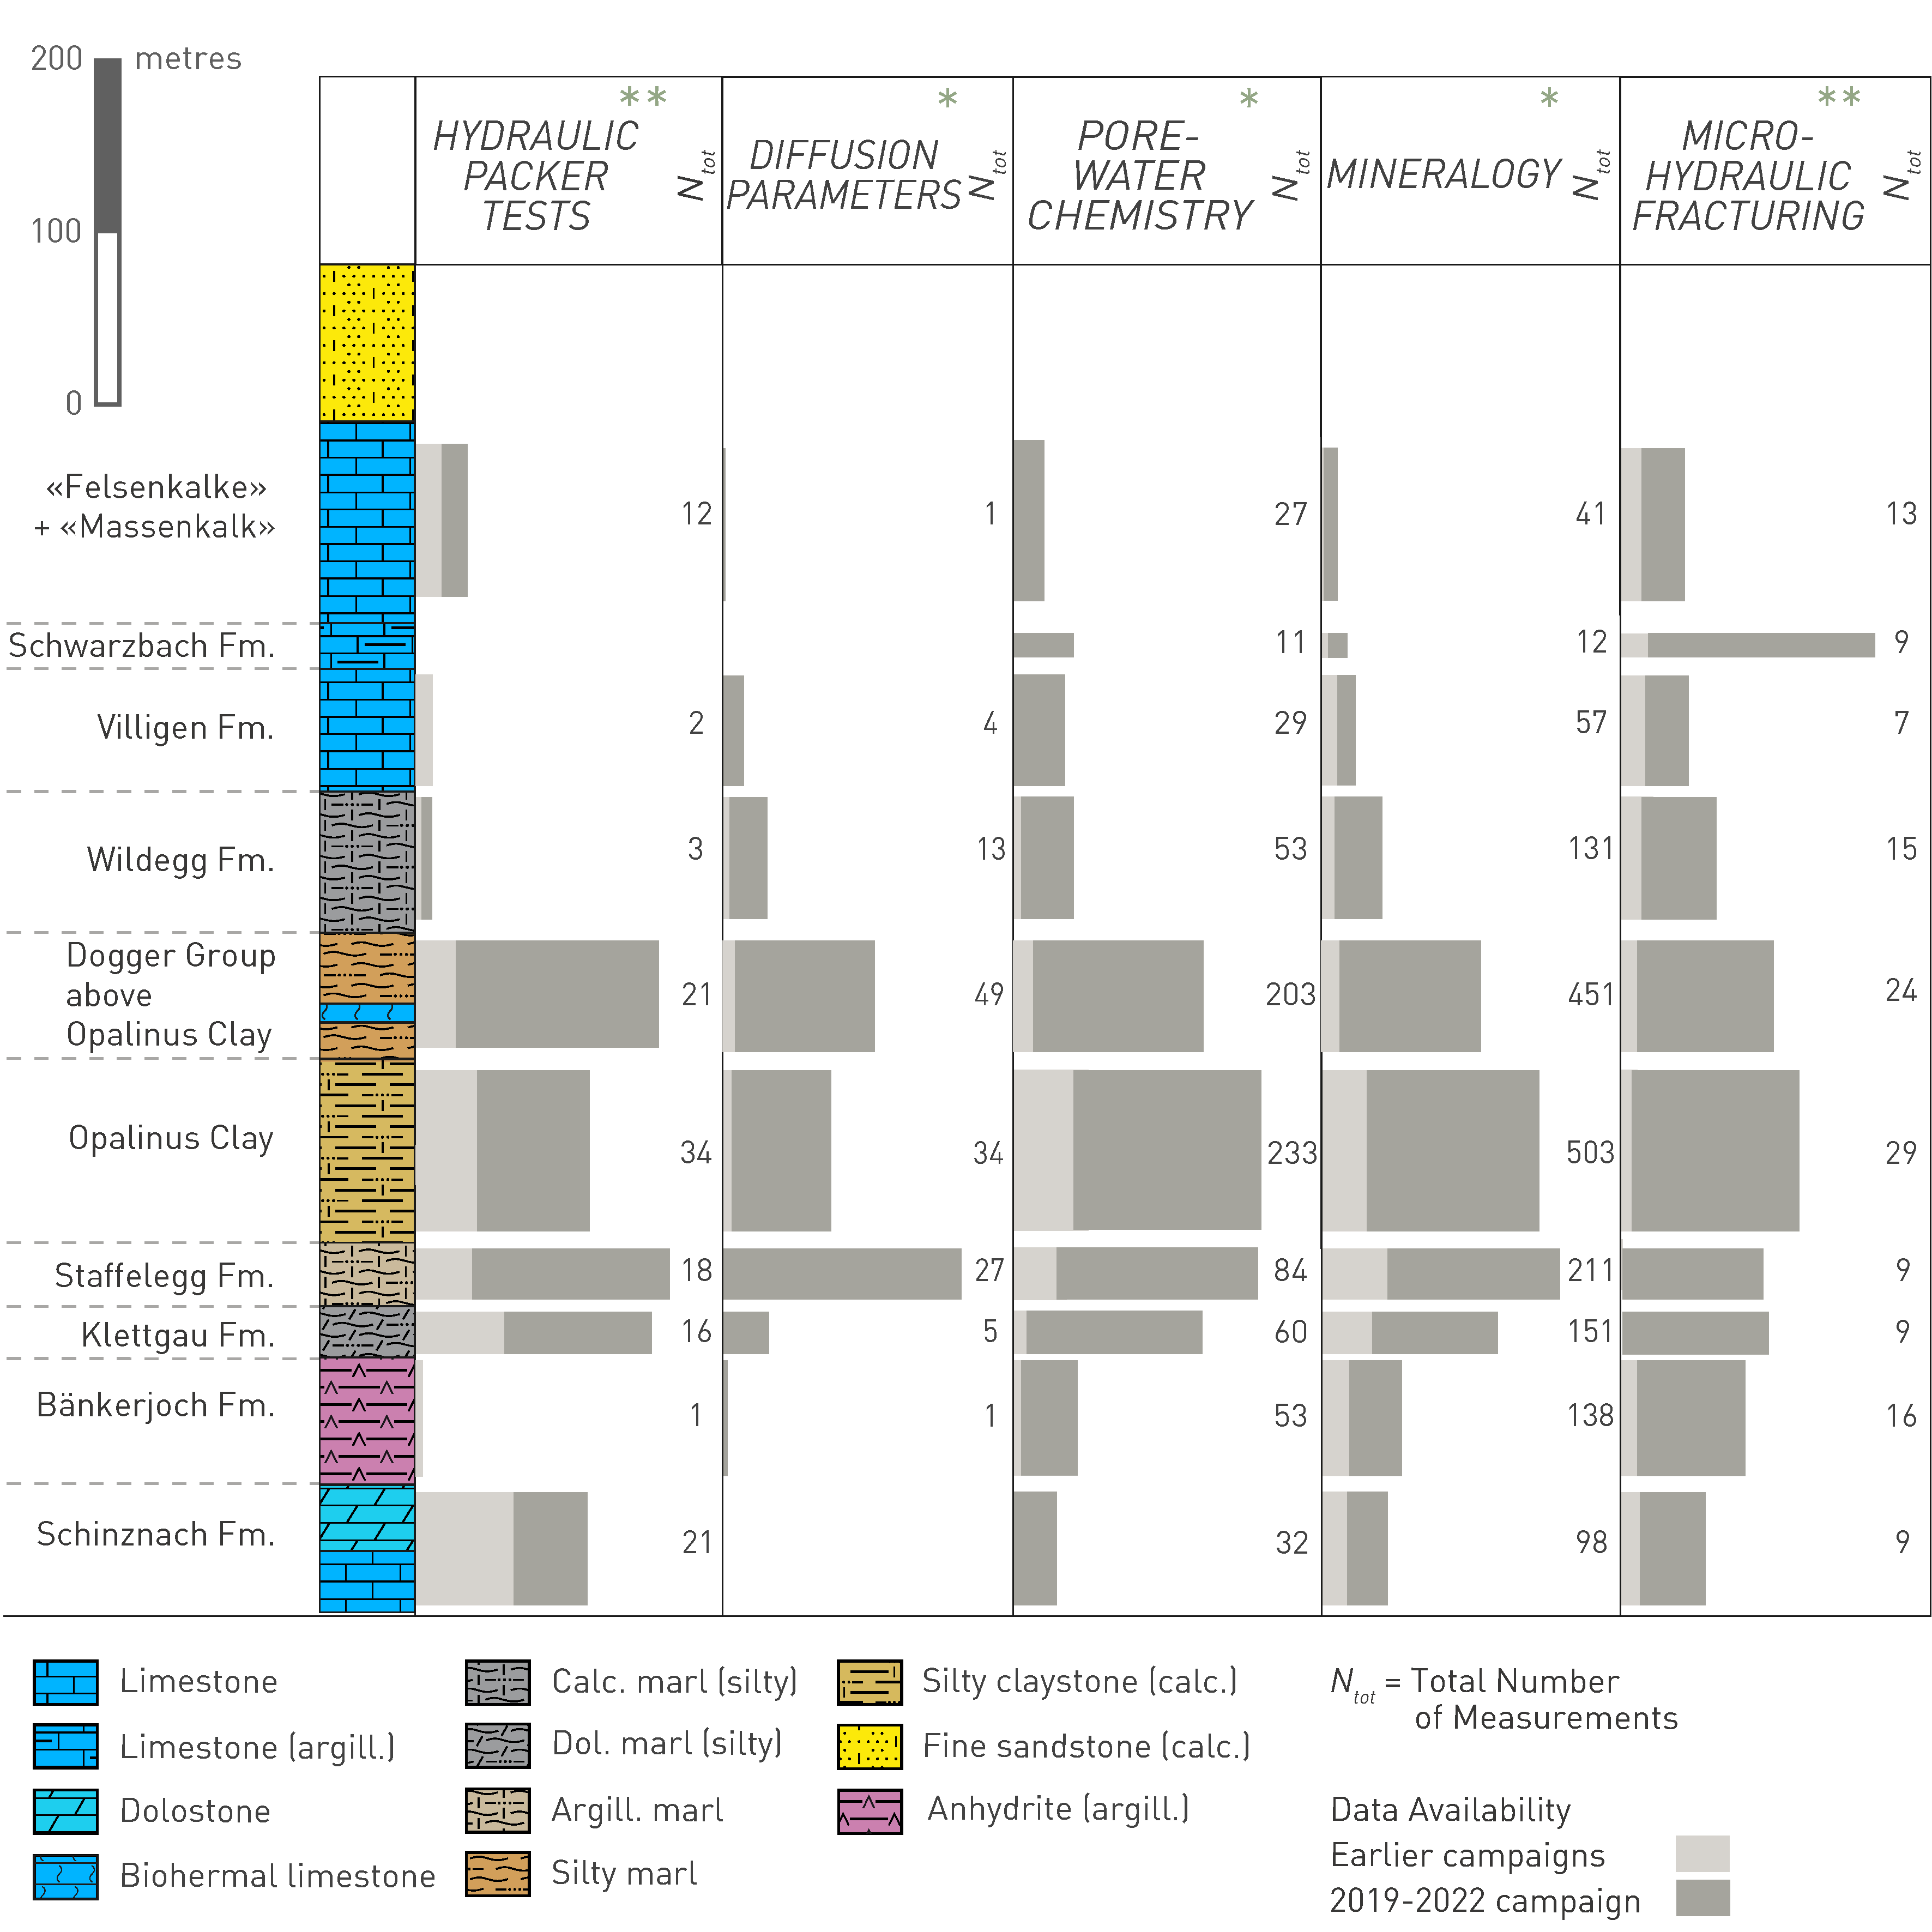
Fig. 2‑3:Increase in size of the database for key parameters during the 2019 – 2022 deep drilling campaign
The above overview includes the 9 new boreholes as well as the BEN, RIN, WEI, SLA1, BEZ and SHA boreholes. Data are projected onto the lithostratigraphic column for the STA2 borehole, which is shown as a reference on the left. For an introduction to the lithostratigraphic column see Section 3.1. Ntot indicates the total number of measurements per formation. The length of the horizontal bars represents the number of measurements normalised by the thickness of the formation. Longer bars thus indicate higher densities of data points in the corresponding formation. Parameters with one asterisk indicate laboratory experiments on drill cores, while parameters with two asterisks represent in-situ measurements in the boreholes.
The figure shows the substantial increase in the database resulting from the new drilling campaign and reflects the investigation focus on the host rock and the surrounding confining units.