
For future deep glacial erosion to affect the geological barrier of a deep geological repository, a series of events must occur. First, a future glaciation has to cover the siting region. Second, the eroded overdeepening must be deep enough to reach the level of the disposal area. This depth is a combination of the future local erosion base, the size and erosion potential of the glaciation, and the incised rock type. Third, the overdeepening must incise at the location of the future repository.
Unlike the simulation of the future local erosion base and local topography, the assessment of deep glacial erosion did not include numerical process modelling. Instead, a chain of calculations using expert knowledge-based parameter distributions link the above outlined aspects of depth, location, and erodibility. These will be summarised in the following paragraphs. For more information see Nagra (2024k).
Key glaciations and future climate
The specific extents of the known principal Quaternary glacials Birrfeld (including LGM), Beringen (probably MIS 6), and Möhlin (probably MIS 12/16) were used as key glacial stages in the future assessment of erosion with respect to the three siting regions (Fig. 6‑18d, Fig. 6‑24, Sections 6.3.1 and 6.4.1.4). The comparison of their respective ice extents with the locations of the siting regions suggests that JO will only be covered by a future glaciation of Möhlin-size, whereas NL would be affected by Möhlin- and Beringen-size glaciers, and ZNO would be affected by glaciers that would correspond to the size of all three principal glaciations. For a full assessment it is also considered that a foreland glaciation might occur, but it is smaller than LGM, i.e. in this context smaller than reaching ZNO. Such a glaciation will not have any impact on the estimated deep glacial erosion. The concept of key glacials was used to (1) estimate the probability of occurrence of alternative drainage scenarios (see Section 6.4.3.2) conditional on the occurrence of a key glacial; (2) to estimate the overdeepening depth for each of the key glacials; and (3) to estimate the probability of occurrence of future glaciations with similar extents as the key glacials over a time span of one million years. The Quaternary glaciation history of Northern Switzerland and the model results estimating ice volume in the next one million years (Talento & Ganopolski 2021; see Fig. 6‑17 in Section 6.3.3.1) served as guidance for the latter argumentation.
According to Figure 19 in Preusser et al. 2011, there may have been four larger ice advances of "key glacial" size (1× Möhlin-size, 1× Beringen-size, 2× LGM-size [Habsburg and LGM]), see also Section 3.5. Earlier glaciations did reach the foreland, as rarely indicated by intercalated till within Deckenschotter deposits. It seems, however, that the above-mentioned four larger glaciations took place only after the accumulation of the TDS and probably after (or associated with) the Mid-Pleistocene Transition (MPT), when glacial cyclicity switched from a dominant 41-kyr to a 100-kyr cycle (Section 6.3.1). The ages of the Möhlin and Beringen Glacials are not unambiguously resolved, but the Möhlin Glacial is tentatively assigned to MIS 16 or MIS 12 and the Beringen Glacial to MIS 6 (see Section 3.5). Because of the age uncertainty and general poor preservation of continuous geomorphic markers for the Möhlin ice extent, it cannot be excluded that the ice advanced far to this position during both, MIS 16 and MIS 12 times. Many of the overdeepened throughs observed in the external Swiss Alpine Foreland are thought to be associated with these abovementioned large glaciations (Section 6.4.1.4). In summary, this suggests that the overdeepenings observed in Northern Switzerland are the cumulative result of recurrent processes that have affected Northern Switzerland during the past ~ 800 kyr or more, which corresponds roughly to the time frame to be assessed for the future. Accordingly, the observed overdeepening depth could be considered an "implicit stack", i.e. overdeepening depth at one million years may similarly reflect the cumulative result of multiple foreland glaciations. Because the depth distribution is placed below the future local erosion base, the most influential overdeepening with respect to its potential to erode down to the repository level, is one that occurs late (when the local erosion base is already lowered significantly), and which stems from a large glaciation with high glacial erosion potential (see Nagra 2024k for more details).
Because of continuous erosional downcutting and subsequent decrease of the accumulation area of future glaciers, future foreland glaciations may be smaller even with similar climate forcing (Egholm 2022).
Overdeepening depth and dependence on rock type
The glacially eroded Molasse assemblage in Northern Switzerland comprises a variety of different, yet mostly easily erodible rock types. Because most of the observed glacial overdeepenings were carved into Molasse rocks (Section 6.4.1.4), these strata were considered as the base unit, when evaluating the potential depth of future overdeepenings. For each key glacial to be considered per site, a reference (i.e. for Molasse rocks) depth distribution for future glacial overdeepening occurring within each HLW perimeter, respectively was established during SHELF-based workshops (Fig. 6‑40; see Nagra 2024k for detailed distributions and discussion).
The main evidence used to estimate the uncertainty of future glacial overdeepenings is based on the statistics of observations in Northern Switzerland, supported by global observations (Nagra 2024k). In this context, it is important to note that for instance the overdeepening depth drilled in the Nagra boreholes is contained within the total assumed probability but may correspond to a less likely percentile (Fig. 6‑40; e.g. QHST in NL would be near the 70% percentile of the assessed probabilities for a future Beringen or Möhlin key glacial). These boreholes were explicitly located to drill the deepest parts, while the majority of the glacial overdeepenings in the distal foreland is shallower (e.g. Section 6.4.1.4, Fig. 6‑24, Fig. 6‑25, Fig. 6‑26, Fig. 6‑28, see Nagra 2024k for more statistics). The width of the total assumed probabilities allows no overdeepening at all on the lower bound and a depth similar to the exceptionally deep Bodensee Trough on the upper bound (Fig. 6‑40). Such large depths, however, are considered very unlikely.
The assumed total probabilities of reference overdeepening depth for Möhlin and Beringen key glacials in NL and ZNO closely resemble each other but for a slight shift towards larger depth for future Möhlin-size glacials. The argumentation here is based on the remaining age uncertainty with respect to the sediment fill of the overdeepenings and thus the preceding glacial erosion event. In addition, the close proximity of similarly sized troughs, which may reflect different glacials (e.g. Strassberg Through [presumably Möhlin erosion] next to the Bülach Trough [presumably Beringen erosion] in the lower Glatt Valley or Marthalen Through [presumably Möhlin erosion] next to the Andelfingen Trough [presumably Beringen erosion] in the lower Thur Valley; Fig. 6‑26b and c; Buechi et al. 2024) does not allow a clear distinction between the erosional efficiency of Beringen and Möhlin Glacials. The limited bedrock incision of an LGM-size glacial is also reflected in the total assumed probabilities but allowing also deeper values with less likely occurrence, because of the observation of glacial erosion during the similarly sized Habsburg Glacial in the Birrfeld Trough (Section 6.4.1.4).
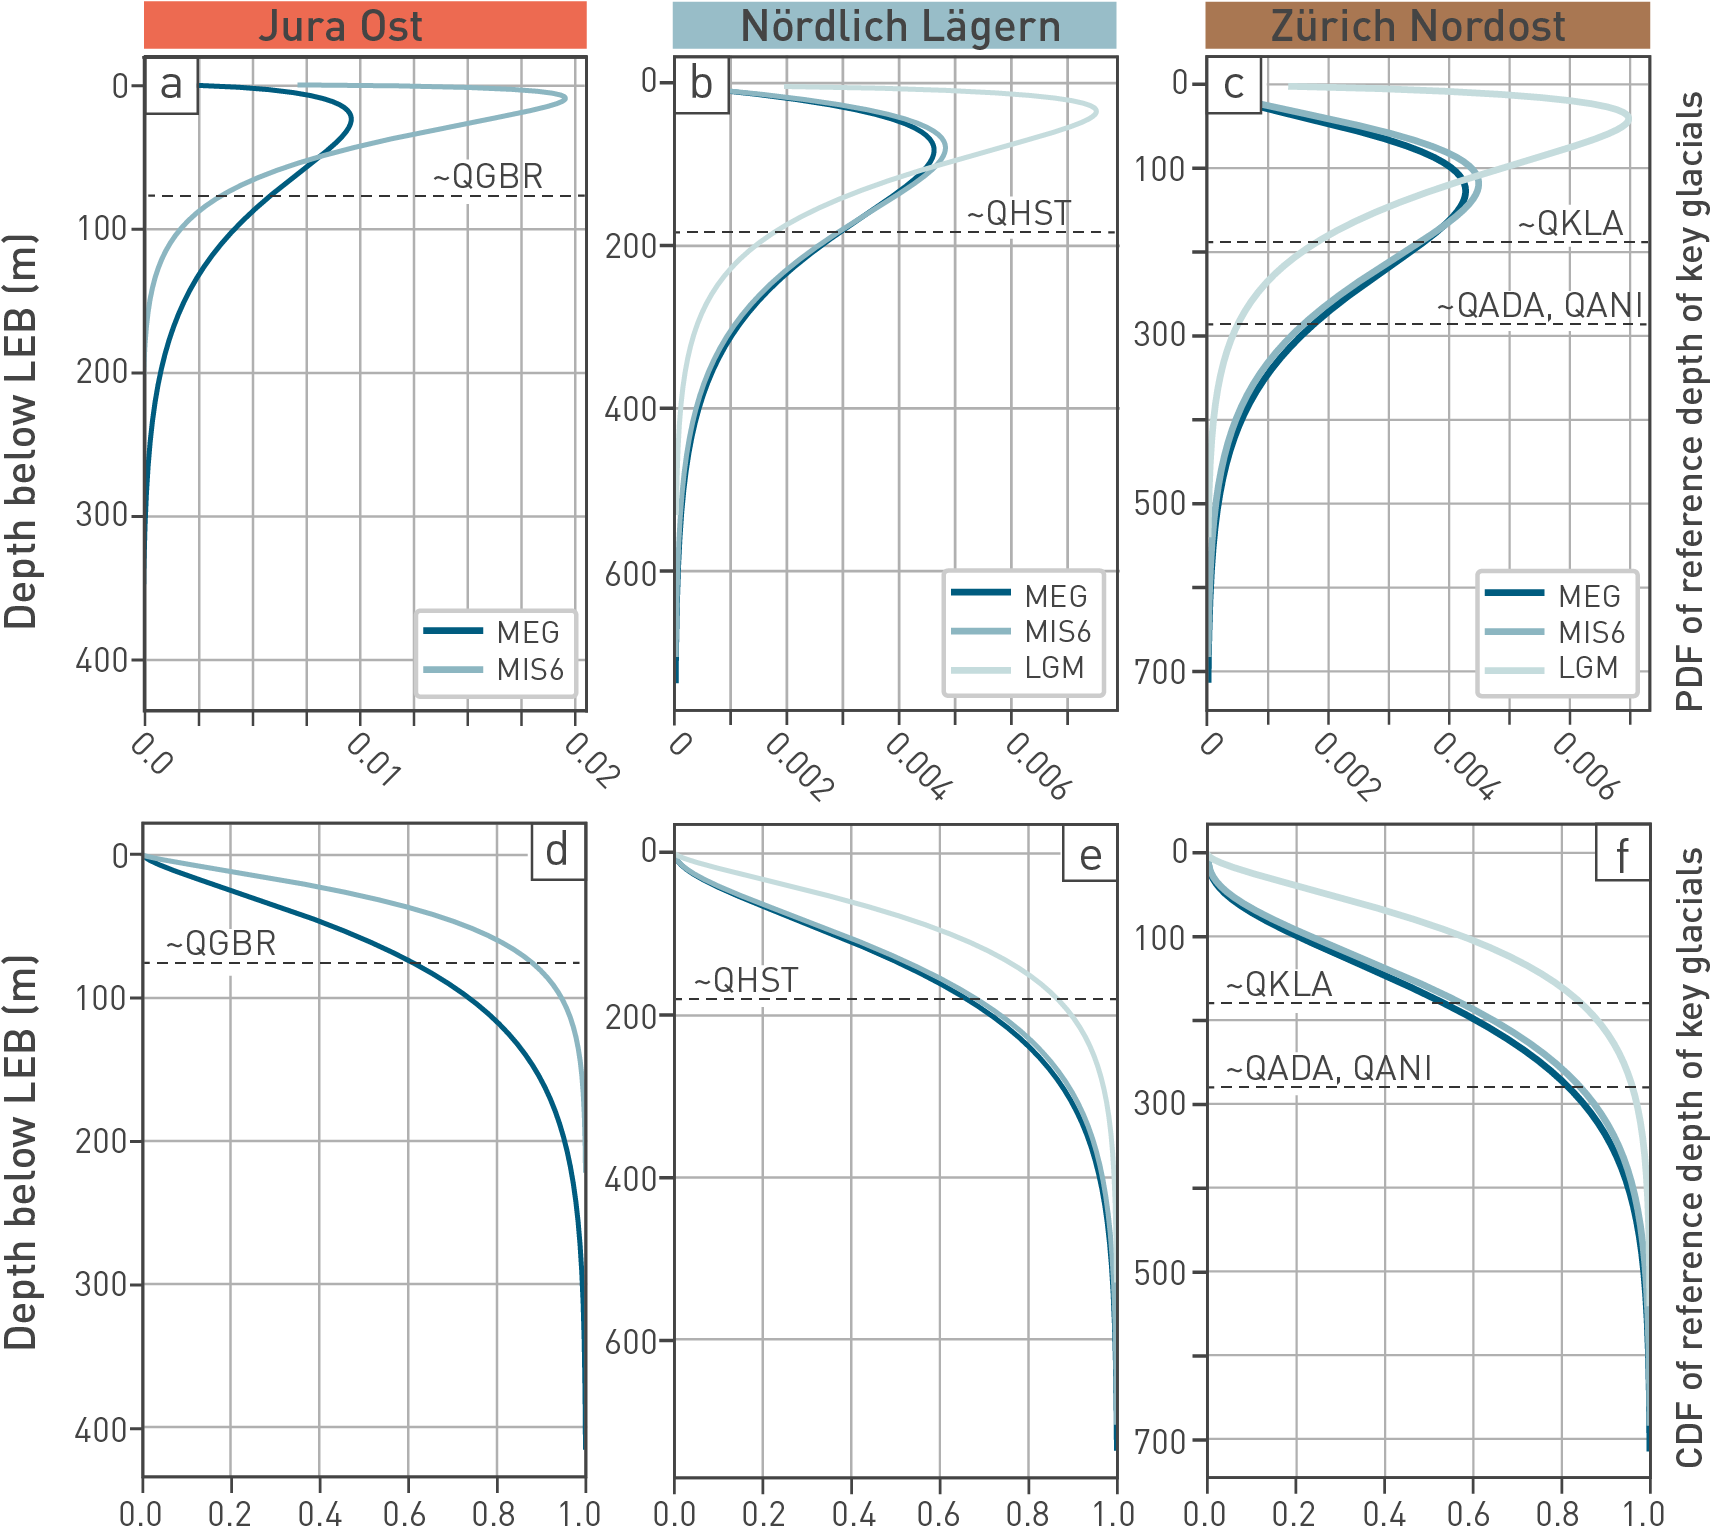
Fig. 6‑40:Total assumed probabilities for reference overdeepening depth per key-size glaciation
Total assumed probabilities for reference depth distributions (Molasse) for each site and the respective key glacial. Note that MIS 6 refers to the Beringen glaciation and MEG to Möhlin. Figures in the upper panel show the probability density function (PDF), those in the lower panel show the respective cumulative distribution function (CDF) for Jura Ost (left), Nördlich Lägern (centre), and Zürich Nordost (right). Horizontal dashed lines correspond to the approximate depths (below LEB) of Quaternary boreholes that Nagra drilled within the wider areas of the siting regions (Section 6.4.1.4). QGBR: Gebenstorf-Brüel borehole is located within the lower Aare Valley but not within the HLW area of JO. QHST: Hochfelden-Strassberg borehole is located in the southernmost part of NL. QKLA: Kleinandelfingen-Laubhau borehole is located in the southernmost part of the ZNO-HLW area. QADA: Adlikon-Dätwil borehole is located in the south, just outside of the ZNO-HLW area. QANI: Andelfingen-Niederfeld borehole is also located in the south, just outside of the ZNO-HLW area (for references, see Tab. 2‑2).
Because observations show that overdeepenings tend to incise into easily erodible rocks, if they are not additionally restricted by topography (see Section 6.4.1.4), and are less deep within more resistant rocks in such cases, a scaling was introduced leading to a stretching or shortening of the reference depth distribution if incision reaches a different rock type. Accordingly, the erodibility classes were scaled with respect to the Molasse assemblage (Fig. 6‑41). For example, rock types that are part of EC 4 (e.g. Malm limestones) were considered on average only half as erodible as Molasse-type rocks.
Nevertheless, even if less likely, certain conditions might occur where resistance to erosion per class differs from the bulk of the material. The consideration of such possibilities is visible in the overlaps between the probability density functions (PDF; Fig. 6‑41a, see Nagra 2024k for more detail).
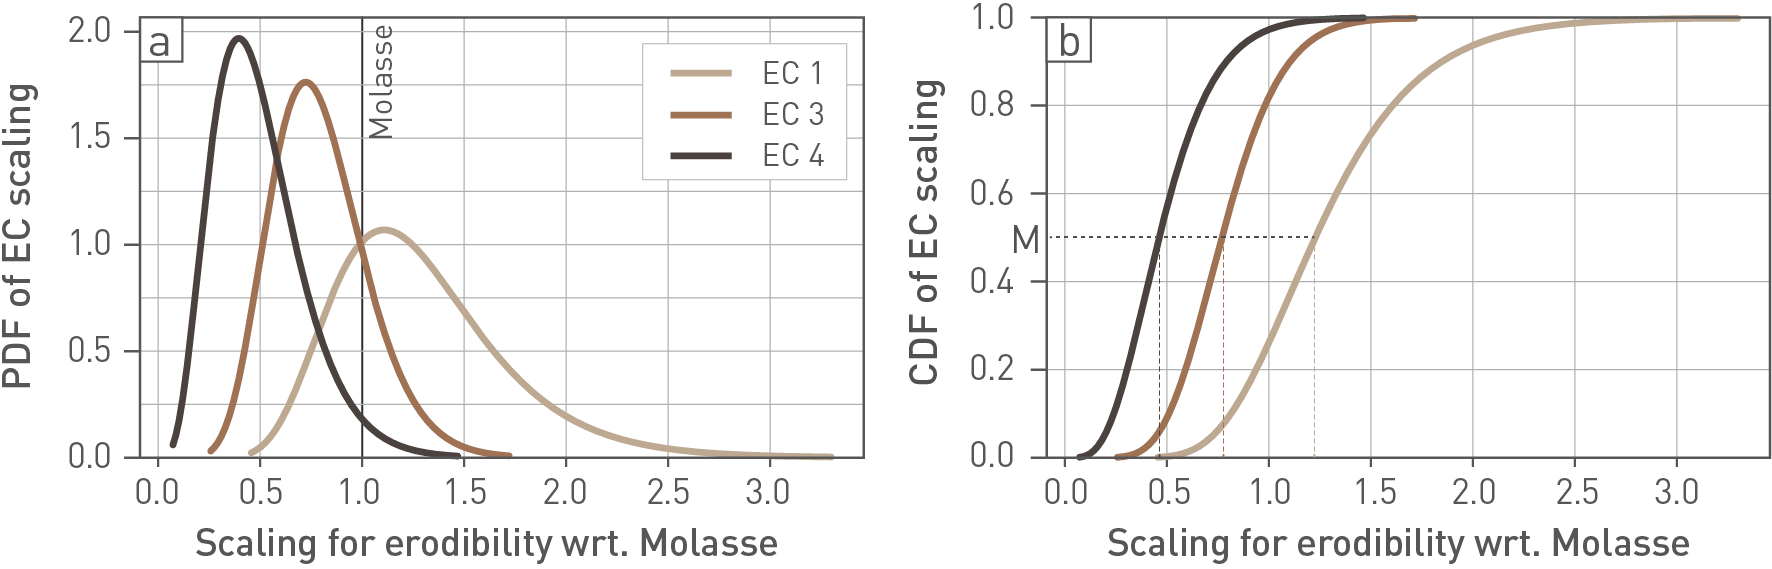
Fig. 6‑41:Total assumed probabilities of erodibility scaling with respect to the Molasse of Northern Switzerland
The sediments of the Molasse assemblage of Northern Switzerland with their variety were considered as the base unit with the scaling value of 1.0 (labelled in a). Molasse sediments are in erodibility class (EC 2). Accordingly, rock types in EC 1 are generally easier to erode, and rocks in EC 3 and EC 4 are harder to erode. Probability (a) and cumulative distribution function (b) are based on expert judgement under the prerequisite that the median values (M, labelled in b) follow the assumption of M(EC 1) > M(EC 2 [equals Molasse]) > M(EC 3) > M(EC 4).
By taking the rock types at a certain overdeepened point into account and by scaling the reference depth of incision based on these rock types, the distribution for the actual depth of overdeepening at that point can be evaluated. Note that this distribution is conditional on glacial overdeepening occurring at the selected point (and conditional on a specific LEB). For evaluating the unconditional probability of repository excavation due to glaciation, additionally, the probability of future glaciation events, the spatial occurrence of glacial overdeepening and the actual overdeepened area must be taken into account (see next subsection). The full stepwise procedure to evaluate probabilities of incision (fluvial and deep glacial) at a certain point is illustrated in Fig. 6‑42.
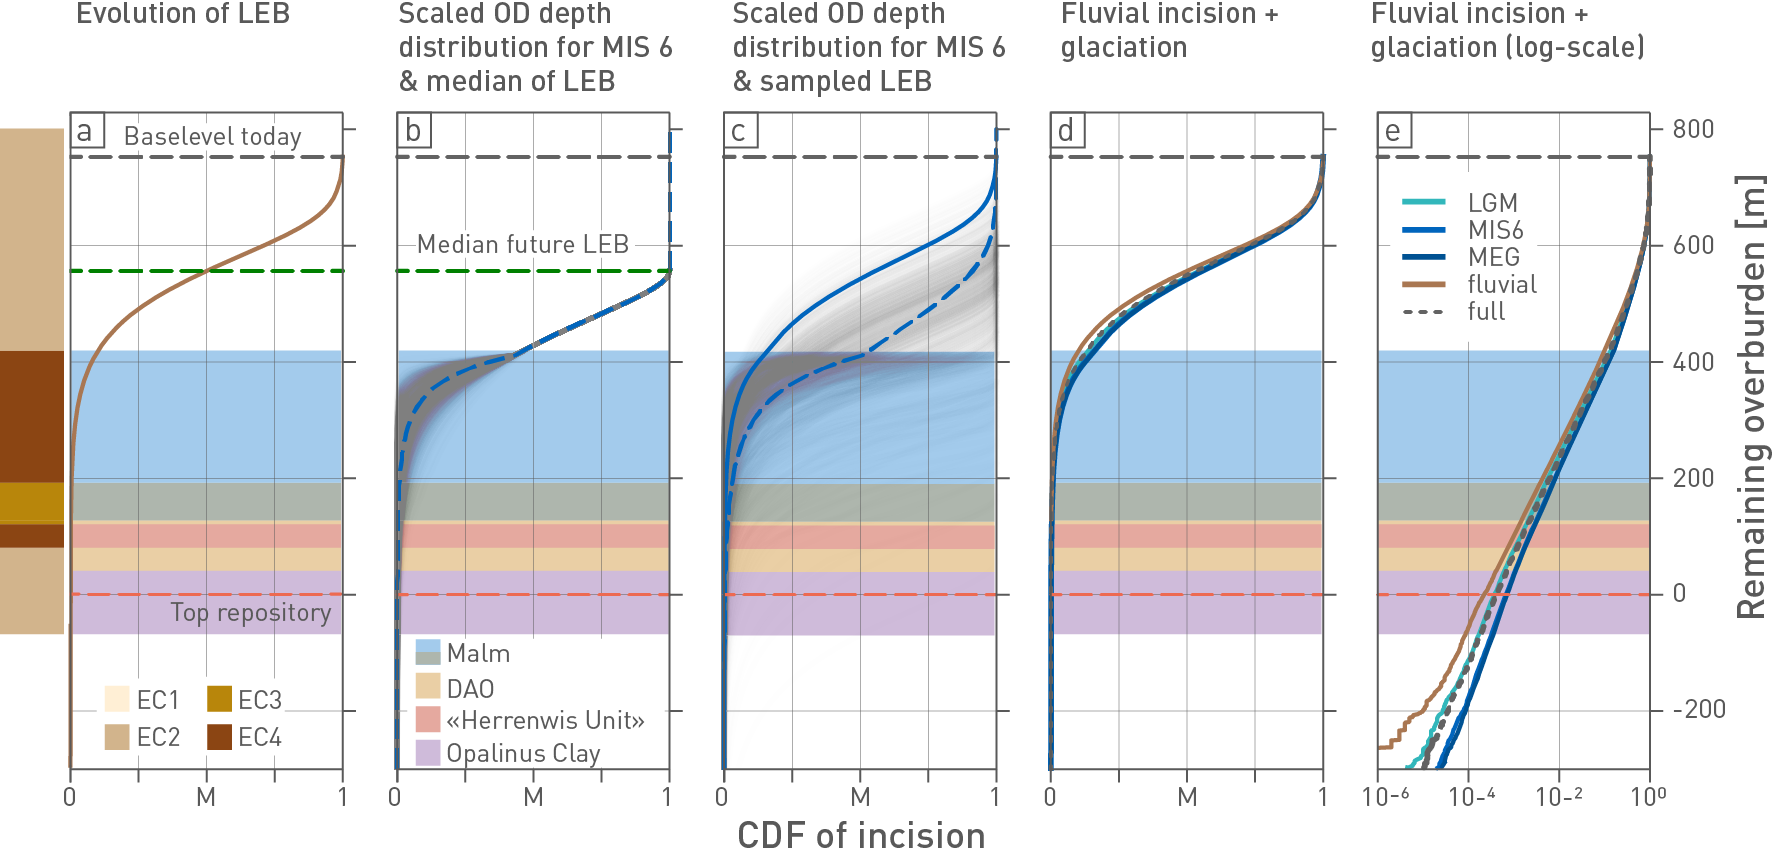
Fig. 6‑42:Step-wise illustration of procedure to evaluate the probabilities of fluvial and deep glacial erosion at a certain point
The illustration represents a step-wise visualisation of the probabilistic approach for the example of NL and the timing of one million year. The stratigraphic column below the Molasse is shown in all subfigures. The (colour-coded) associated erodibility classes are visible on the left. (a) Cumulative distribution function (CDF) of the future local erosion base (LEB, dashed green line shows median value). (b) Scaled depth distribution (CDF), exemplarily shown for a future MIS 6 (Beringen-size) glaciation linked to the median of the future LEB (dashed green line), derived by scaling the reference depth distribution (dashed blue CDF) with different sets of scaling factors sampled from their distributions (Fig. 6‑41). The variability resulting from the scaling starts at the depth of the stratigraphic step between Molasse rocks and rocks of EC4 (grey lines). Note that this is a subset of the full samples and plotted only for illustration purposes. (c) Scaled depth distributions (grey CDF) for different samples of the future LEB (blue solid CDF). The blue dashed line corresponds to the resulting CDF conditional on the glaciation and the occurrence of an overdeepening (OD) scenario at the location of the provisional disposal area. It does not involve the condition of an actual OD at the location18. This distribution is calculated conditional on the occurrence of a glaciation comparable to the one during MIS 6. (d) Probability of incision (fluvial and glacial) for a certain remaining overburden thickness, including all key glacials with their probabilities of causing overdeepening within the provisional disposal area. The process termed fluvial erosion (‘fluvial’) describes the case of no glacial OD, e.g. for glaciations of a size smaller than during the LGM and corresponds to the distribution of the future LEB. (e) For better visibility, the incision probability (same as in d) is illustrated in log-scale. Note that in this illustration it is assumed that glacial overdeepening occurs directly above the provisional disposal area.
Locations of future glacial overdeepenings
Besides the occurrence of a glaciation with a certain (key-size) extent and the depth of a future overdeepening, the potential location of future overdeepenings must be assessed. This is done by combining and weighting different scenarios.
The multiphase infilling history of many deep glacial troughs suggests a tendency for reoccupation of existing overdeepenings. Present overdeepenings as potentially preconditioned pathways for future reoccupation are thus one scenario. A spatial buffer around the present-day overdeepenings to account for growth in length or width and allowing a lateral shift of the axis, and thus the location of deepest erosion, can be applied. However, the potential for glacially diverted channels with new overdeepenings cannot be excluded as a scenario and this is thus integrated within the probabilistic model. Although the future topography cannot be precisely forecasted, there are certain assumptions that help in deriving such potentially additional scenarios. Topographic steering of ice through pre-existing valleys (ice is probably steered away from hills and ridges into already existing troughs and valleys; Kessler et al. 2008) is considered in the scenario building. On the contrary, the lower the relief, the more degrees of freedom or randomness need to be accounted for. This is especially important for ZNO but also the eastern part of NL, where the present relief is low. A set of plausible scenarios for each site was ranked during SHELF-based workshops, which in turn provided the input for scenario maps (Fig. 6‑43, see Nagra 2024k for more details). The darker the colour in these maps appears, the more likely a certain scenario becomes. Calculations of remaining overburden thickness that incorporate the influence of overdeepening locations are shown in Section 6.4.4.
Finally, it is important to note that while the coloured parts of the maps highlight where overdeepening might plausibly occur, the actual dimension of the overdeepenings within such a zone is significantly smaller (compare the present-day occurrences in Fig. 6‑24). For instance, ~ 5% of the NL siting region and less than 18% in ZNO are actually overdeepened. Because of a narrowing of the overdeepening forms towards depth, this number decreases, if considering only deeper troughs. For instance, overdeepenings of more than 50 m below LEB constitute ~ 2% area in NL and ~ 6% area in ZNO (see Nagra 2024k for more details). Such fraction of actual overdeepening with a potential overdeepening scenario is considered in the model (see Nagra 2024k) and results in an additional reduction of overdeepening probability.
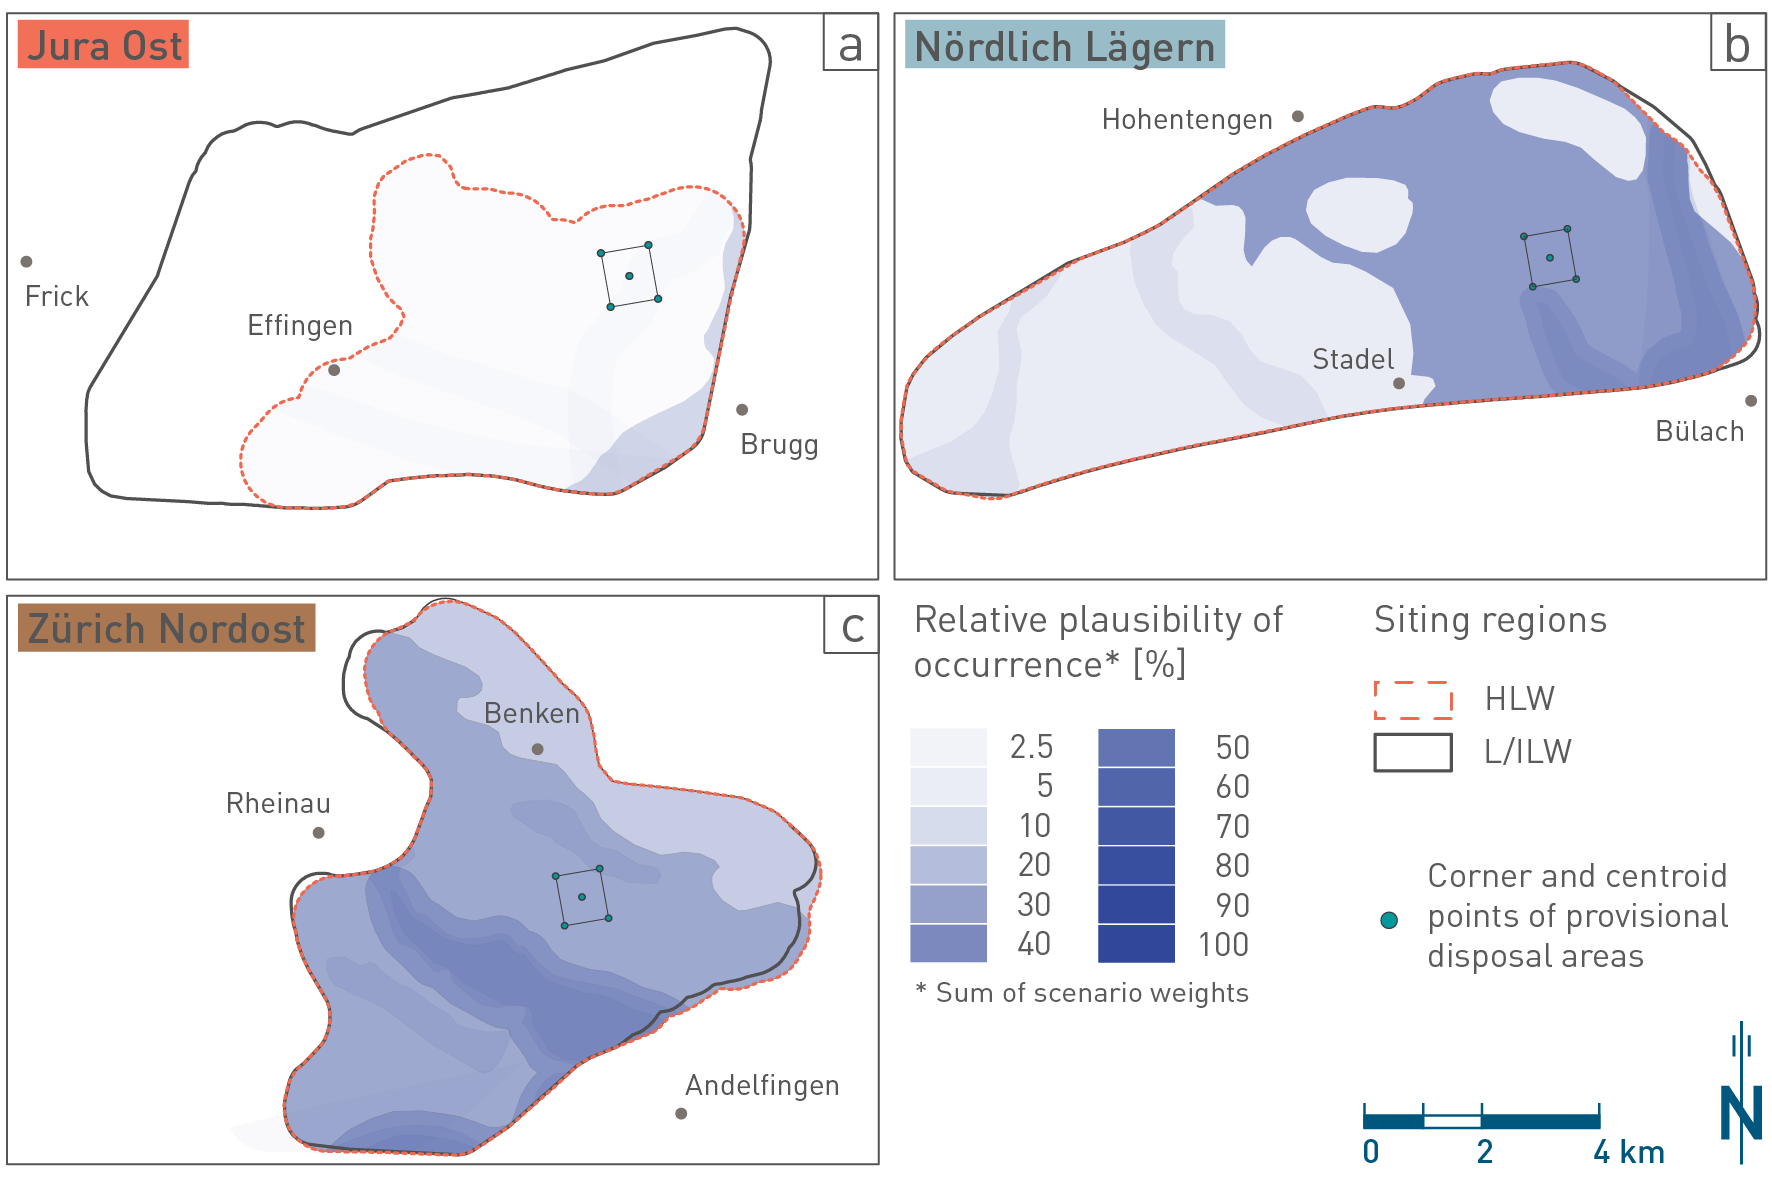
Fig. 6‑43:Scenarios for spatial occurrence of future overdeepenings within the siting regions, one million years
Shown are colour-coded maps with darker colours reflecting a higher plausibility of occurrence of future glacial overdeepenings in the JO (a), NL (b) and ZNO (c) siting regions. The provisional disposal areas are shown with their respective corner and centroid points. For JO, overdeepening to occur is less likely for the next one million years. Here, the generally less likely occurrence of overdeepening is strongly linked to the (alternative) drainage scenarios (see Section 6.4.3.2).
The probability for a point being actually overdeepened within an overdeepening scenario is below 100%. This is especially important for scenarios that allow random occurrence of new breaching channels within a relatively large area – not all of this area will be overdeepened. ↩