
Local topography considers bedrock and unconsolidated sediments above the local erosion base. Because the characteristics of local topography vary between the sites, it is important to evaluate under what circumstances such additional overburden thickness can counterbalance potential disadvantages of a shallower site with respect to the local erosion base (Section 6.4.3.1).
It is likely that erosion rates will always be unevenly distributed in a cuesta landscape of alternating highly erodible and less erodible strata as in Northern Switzerland, and that the landscape will remain in disequilibrium (e.g. Forte et al. 2016, Perne et al. 2017, Yanites et al. 2017, Darling et al. 2020). The most resistant units can have both the steepest (cliff forms) and shallowest (plateau) gradients, and, locally, transient erosion rates can vary greatly and in either direction from the controlling rate of the main channel. Such processes render a forecast of the topographic evolution difficult.
Modelling the evolution of future local topography
The evolution of local topography was modelled with the landscape evolution model MuddPILE (Mudd et al. 2022) in a simplified approach using the SPIM equations described in Section 6.4.3.1. In an upstream working process, these equations are solved until the topography reaches equilibrium ("snap-to-steady"), i.e. the elevations stop changing, and until drainage divides no longer migrate (Graf 2022, Nagra 2024k).
The main input considers the SPIM-based modelled incision rates of the Rhine River and the total assumed probabilities of the erodibility coefficient K from Section 6.4.3.1 (Fig. 6‑29, Model B). Lateral changes in the main drainage network (Fig. 6‑34) were varied and incorporated as selected scenarios that were ranked based on expert judgement. Moreover, reference hillslope angles for the respective lithologies were determined based on the median values of associated lithostratigraphic units in Ludwig (2018), as they were considered to be a representative measure of hillslope relief observed in the present-day landscape. As an example, Fig. 6‑33 shows the histograms and corresponding median values of hillslope gradients for the contrasting Villigen Formation and the Opalinus Clay.
Because the modelling approach is computationally intensive, a surrogate model (Nagra 2024k) was generated to allow all possible parameter combinations to be tested and to calculate a probabilistic distribution of remaining overburden thickness at the location of the provisional disposal area. Accordingly, the remaining overburden thickness was calculated for the future scenarios of local topography in all three siting regions, using the present-day drainage networks and a selection of parameter combinations (Fig. 6‑35 and Fig. 6‑36). Additionally, for JO, four alternative drainage scenarios were analysed (examples in Fig. 6‑37 and Fig. 6‑38). The output from surrogate model at the location of the provisional disposal areas is shown in Fig. 6‑39.
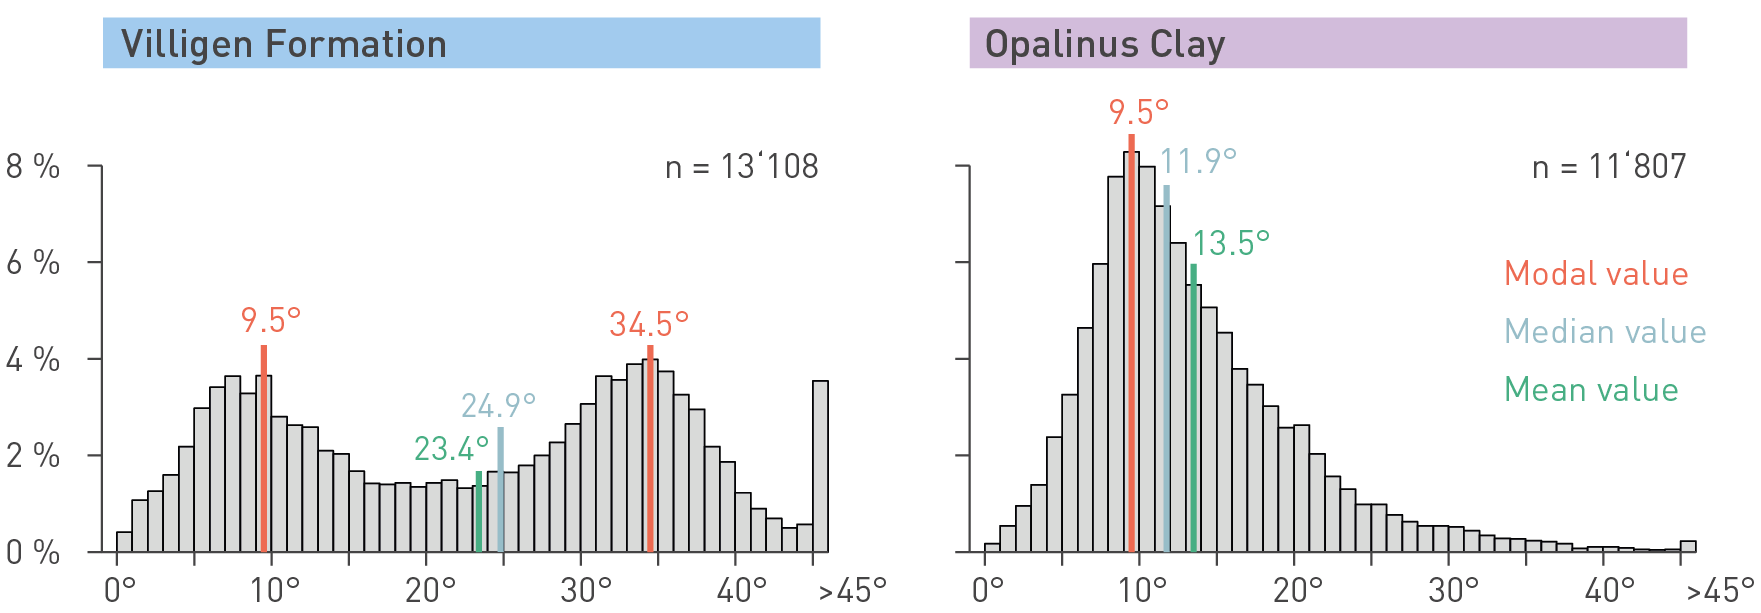
Fig. 6‑33:Histogram and statistical measures of slope gradients within the hillslope domain of JO and surrounding area: two examples
The examples refer to the Villigen Formation (EC 4) and the Opalinus Clay (EC 2) (Ludwig 2018). Slope gradients correspond to pixel-based values from DTM-AV (2-m grid size; © swisstopo). Number ‘n’ indicates the number of pixels for each lithostratigraphic unit. Note that frequencies of values steeper than 45° are summarised in the histograms.
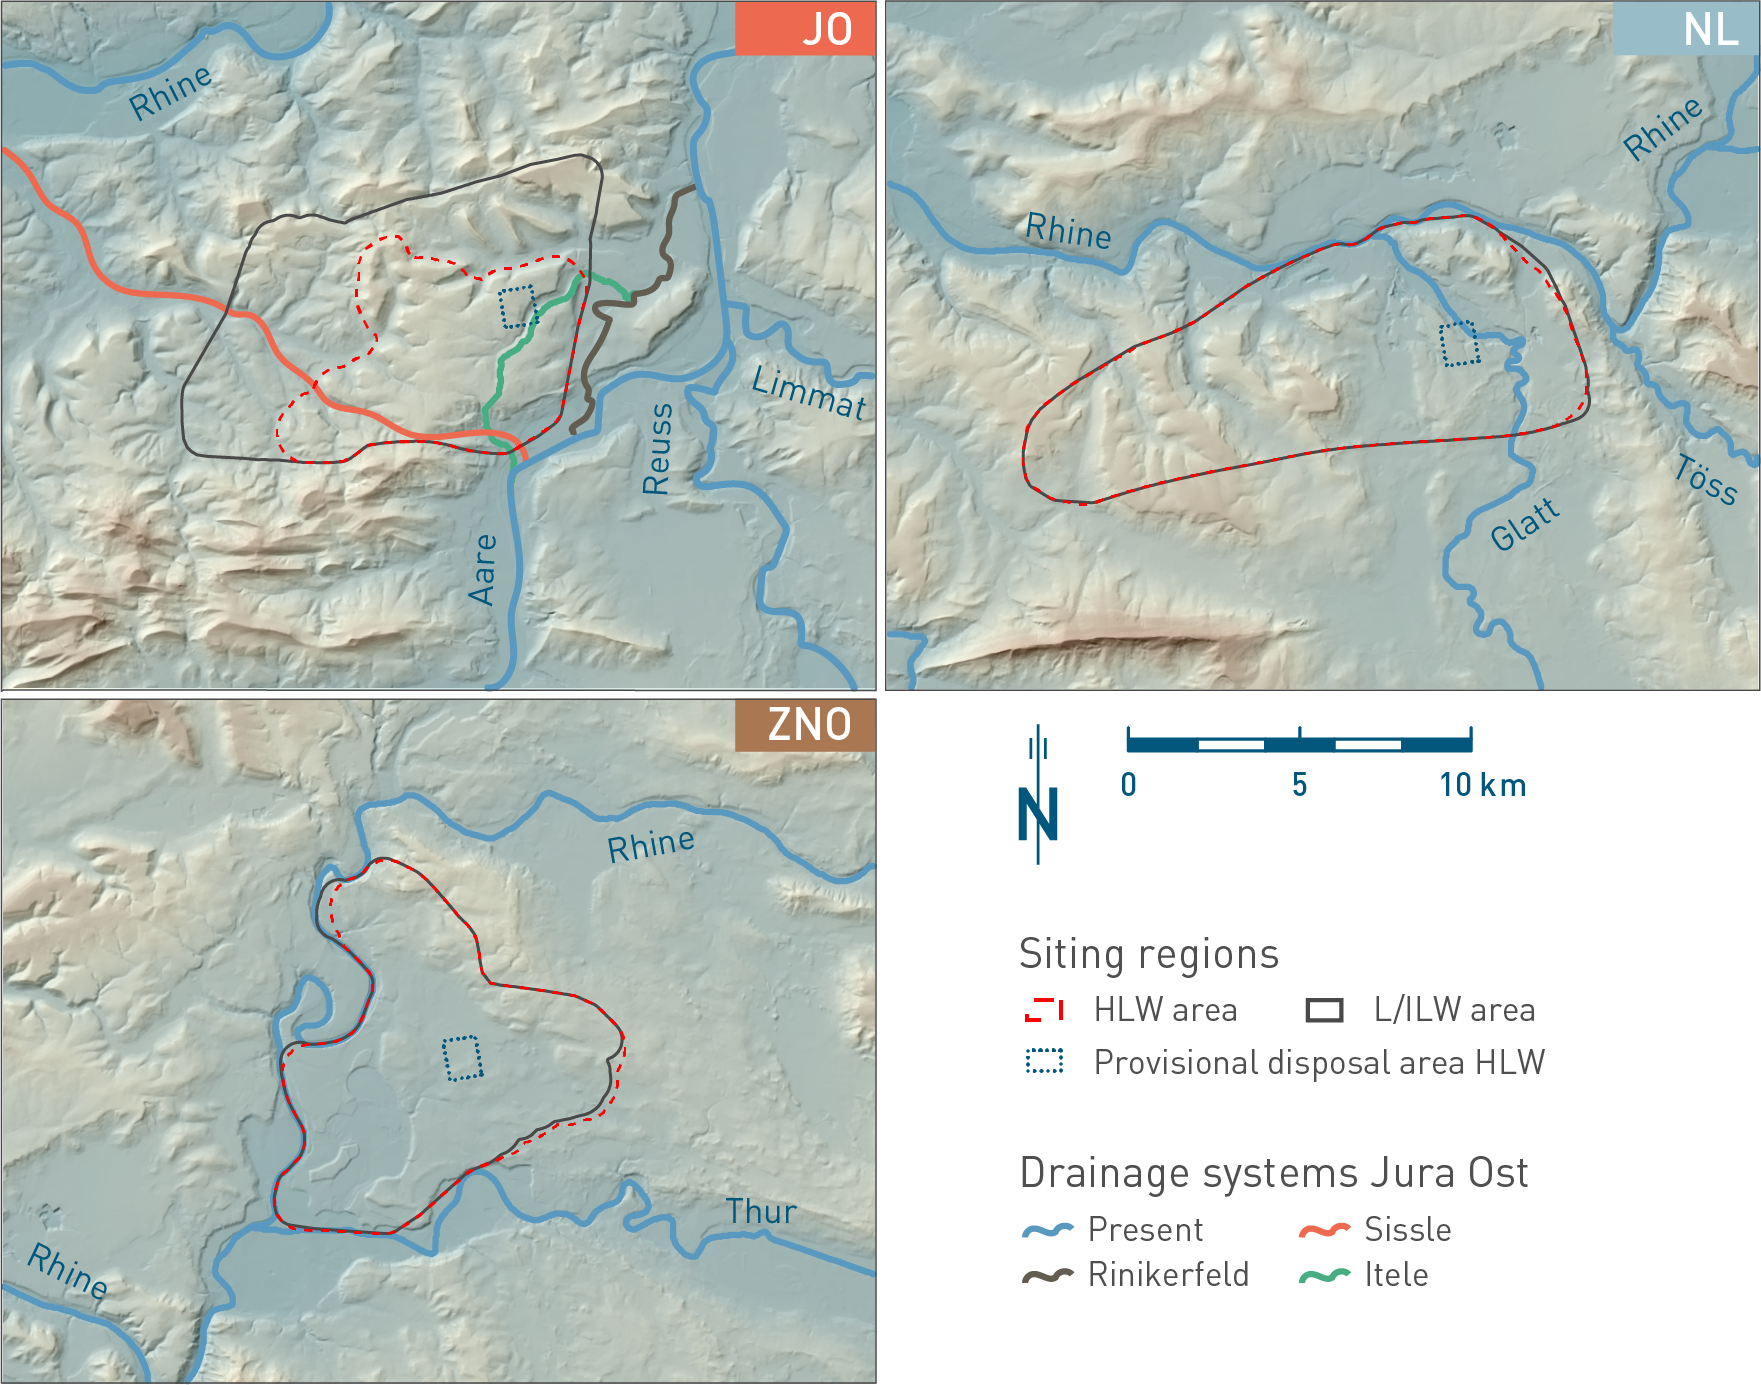
Fig. 6‑34:The siting regions with present-day and alternative main drainage network scenarios
Local topography scenarios based on present-day (all sites) and alternative drainage networks (JO) are considered for the assessment of erosion in the provisional HLW disposal areas at one million years. Potential for lateral changes in drainage scenarios can be drawn from knowledge of fluvial or fluvioglacial processes and denudation.
Lateral migration and changes in main drainage
Lateral migration of the main and tributary rivers, particularly in connection with glacial processes, can lead to the formation of new drainages by cutting through bedrock relief. These processes are more likely in lower relief landscapes and under the influence of large foreland glaciations (see Fig. 6‑22b in Section 6.4.1.3). However, even in areas of high local topography, corresponding scenarios cannot be excluded over long time periods and are thus considered as alternative evolutions, especially for JO (Fig. 6‑34). Modelled scenarios are the reactivation of the Rinikerfeld Channel, an Aare shortcut using the Sissle drainage with and without incorporation of the Reuss and Limmat Rivers along this new route, and a breakthrough channel following the Itele Valley. Because the relief (local topography) in the relevant parts of NL and in ZNO is too low to provide meaningful alternative scenarios for modelling of future landscape evolution, a (worst-case) scenario is added that assumes a main drainage developing just above the provisional disposal area. In this case, the remaining overburden thickness is directly derived from the SPIM output of fluvial incision modelling (Section 6.4.3.1).
Modelling results
The first set of results considers a stable main drainage system (Fig. 6‑35, Fig. 6‑36). Such a situation may be expected in an evolution lacking major foreland glaciations. Compared to the results of remaining overburden thickness with respect to the local erosion base (Section 6.4.3.1, Fig. 6‑32), the integration of local topography has a significant positive effect for JO.
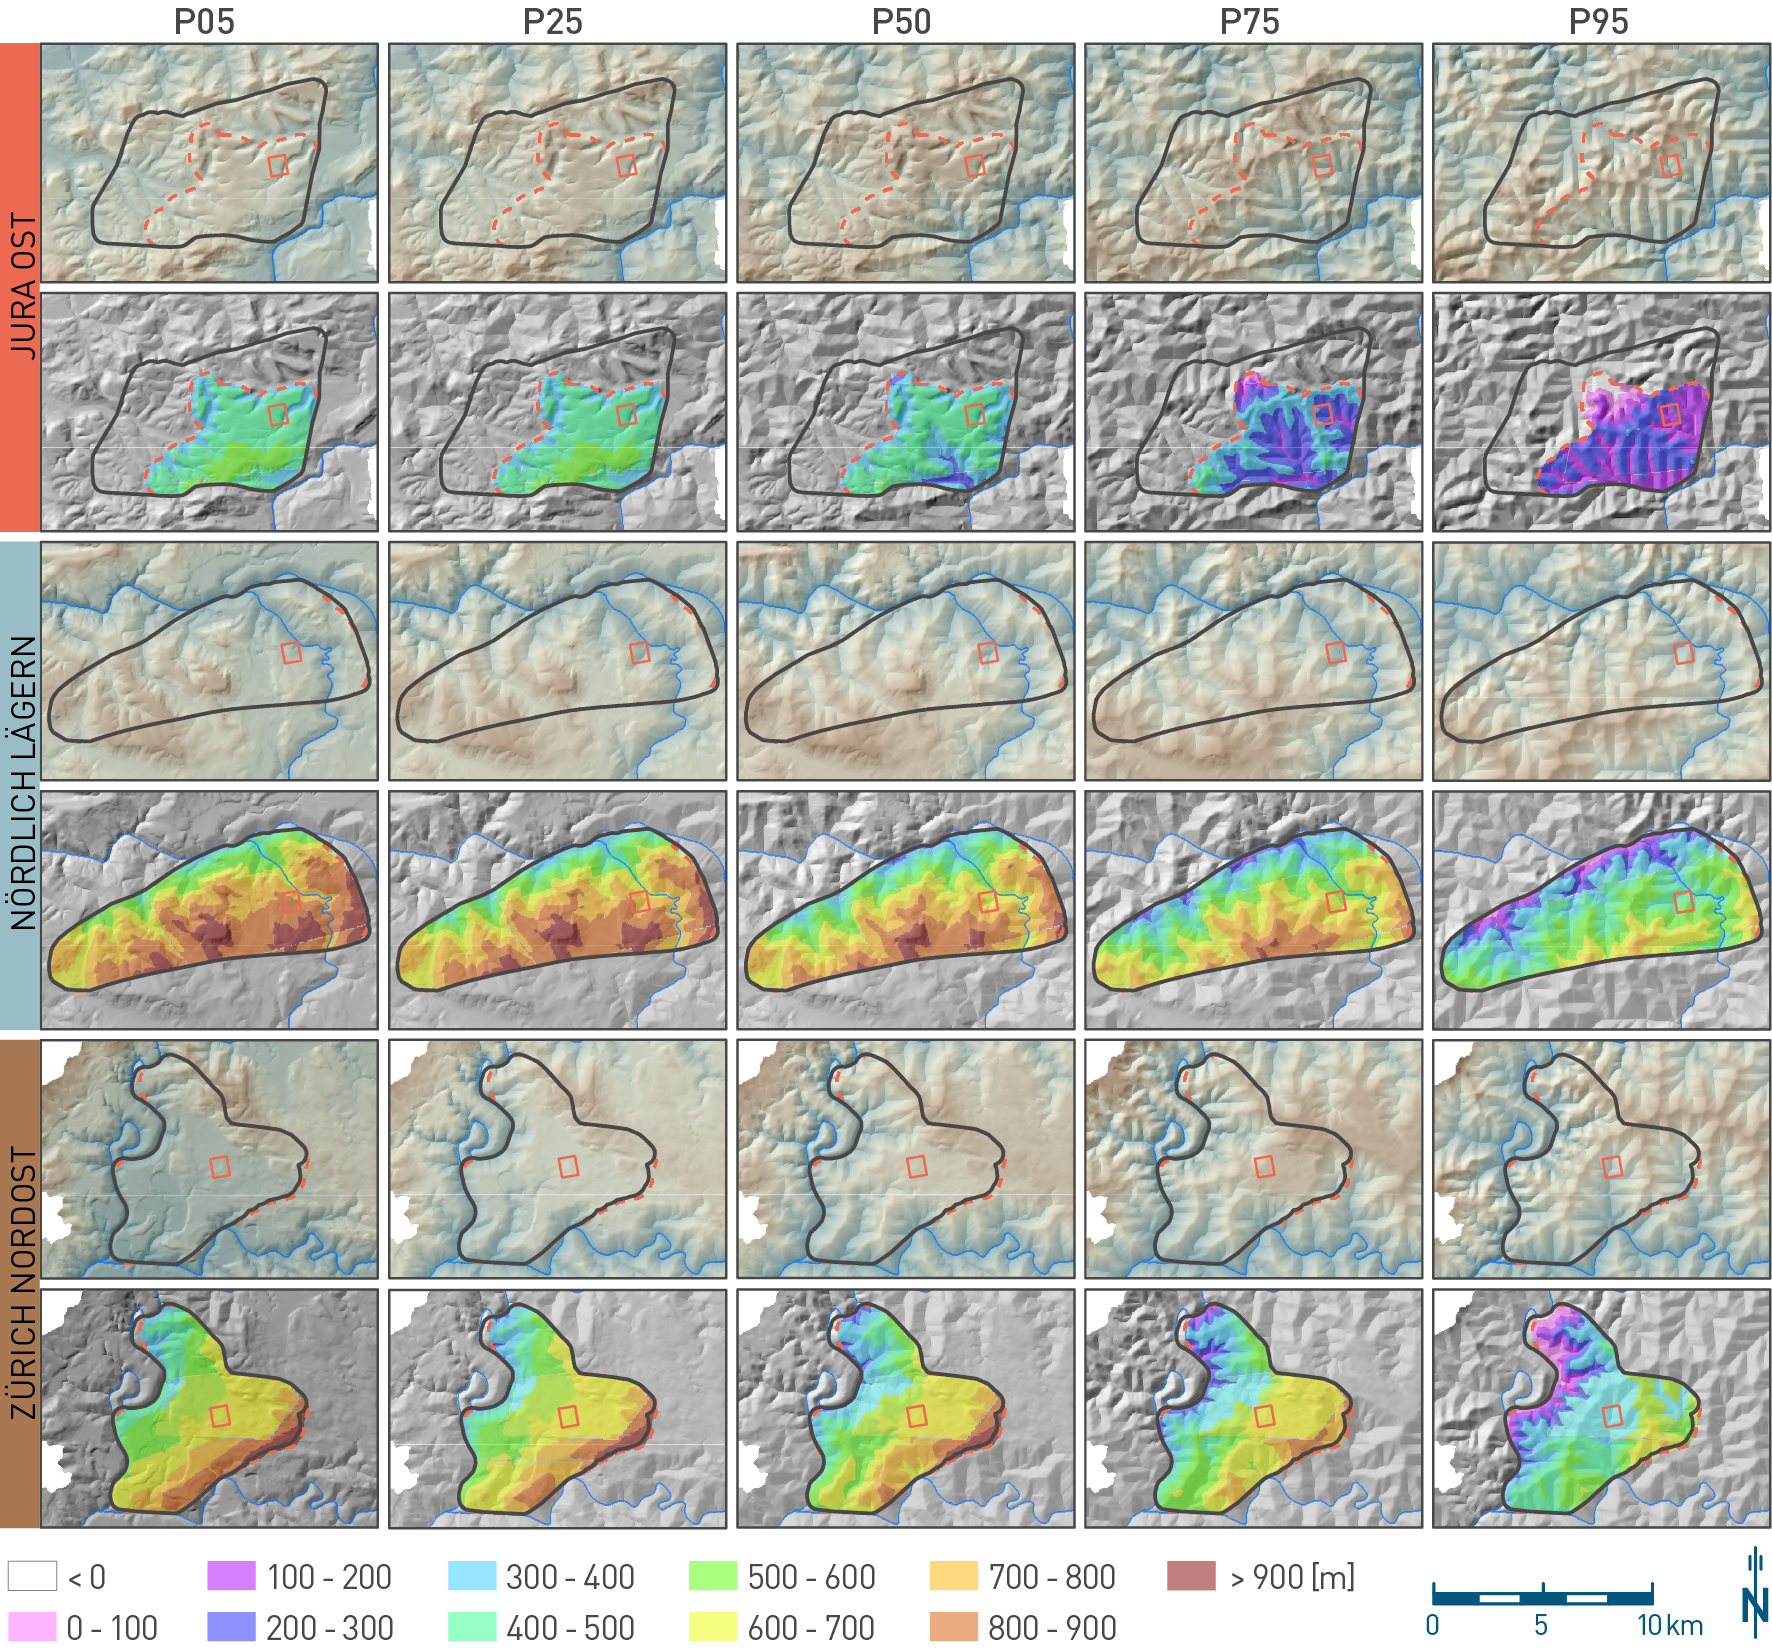
Fig. 6‑35:Results of modelling the evolution of local topography at one million years using the present-day drainage network
Shown are examples of synthetic future landscapes and colour-coded remaining overburden thickness for each siting region and for certain quantiles of parameter combinations (e.g. 25th percentile of fluvial incision after one million years as derived from the SPIM modelling, combined with the 25th percentile of the erodibility distributions). Remaining overburden thickness is shown with respect to the Top Opalinus Clay. Red square shows the location of the provisional HLW disposal area.
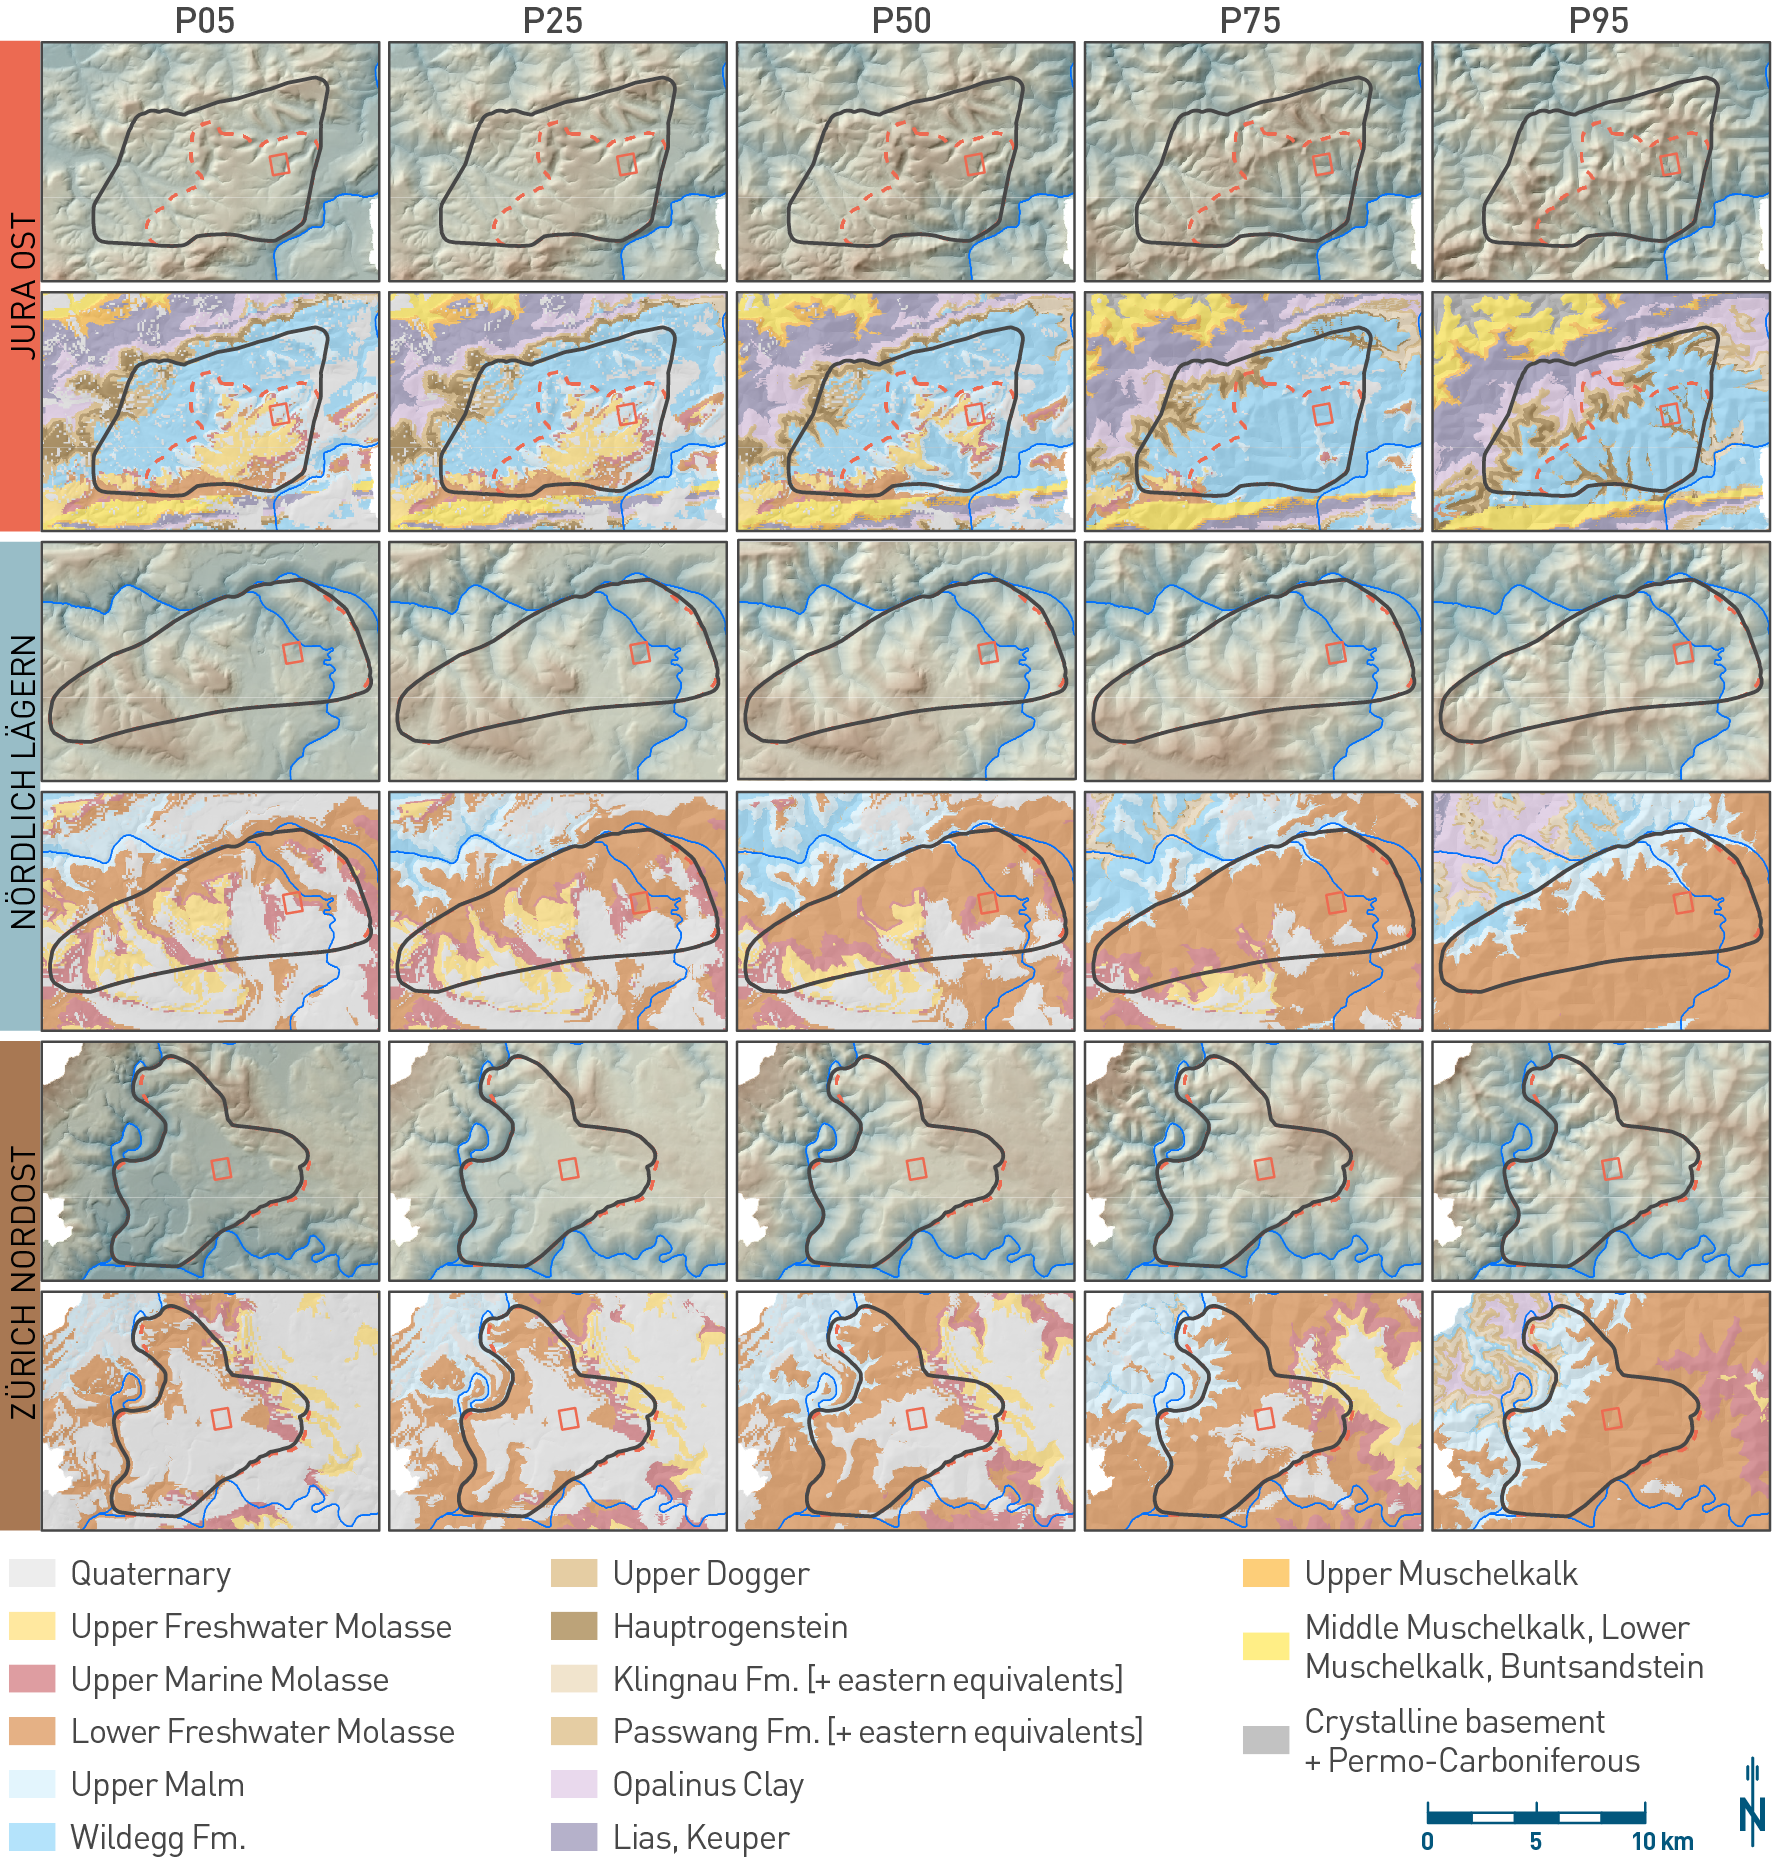
Fig. 6‑36:Outcrop maps representing the evolution of local topography at one million years using the present-day drainage network
Shown are examples of synthetic future landscapes and colour-coded geological outcrop maps for each siting region and for certain quantiles of parameter combinations (e.g. 25th percentile of fluvial incision after one million years as derived from the SPIM modelling, combined with the 25th percentile of the erodibility distributions). The outcrop map is based on the Regional 3D Geological Model 2012 (Gmünder et al. 2013) used within MuddPILE. Red square shows the location of the provisional HLW disposal area.
In a second step, changes in the main drainage routing in JO (Fig. 6‑34), which might be linked to future foreland glaciations, have been evaluated (Fig. 6‑37 and Fig. 6‑38). When including these alternative drainage networks, it can be seen that the Itele scenario in particular modifies the topography above the provisional disposal area in JO significantly and reduces the remaining overburden thickness considerably (Fig. 6‑37). The probability of occurrence of this scenario, however, is low and depends on the development of a large foreland glaciation (Nagra 2024k).
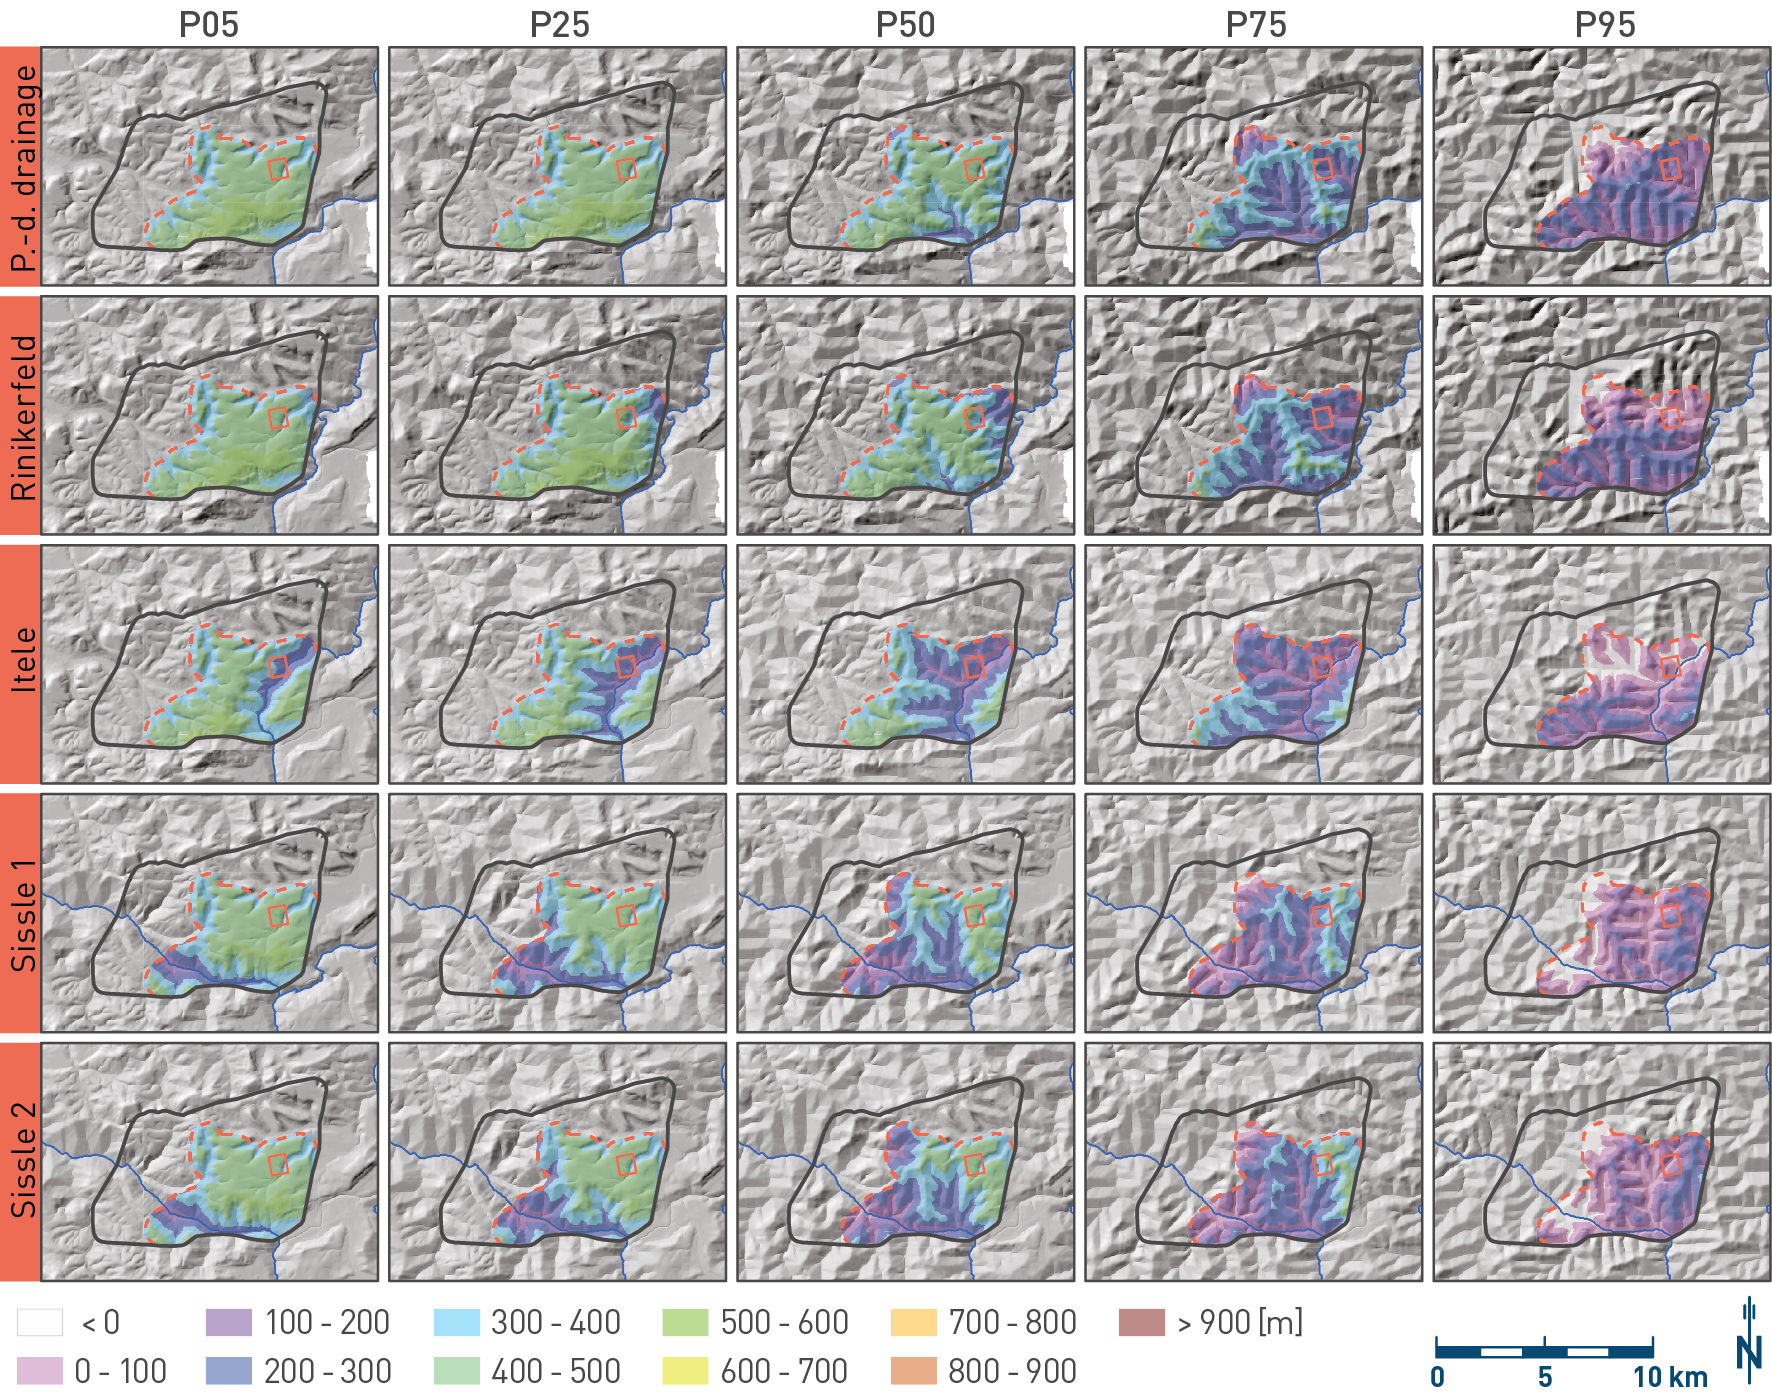
Fig. 6‑37:Results of modelling the evolution of local topography at one million years using alternative drainage networks for JO
Shown are examples of synthetic future landscapes and colour-coded remaining overburden thickness for certain quantiles of parameter combinations (e.g. 25th percentile of fluvial incision after one million years as derived from the SPIM modelling, combined with the 25th percentile of the erodibility distributions) for the present-day main drainage network (upper panel) and alternative drainage networks (reactivation of the Rinikerfeld channel, breakthrough channel through the Itele Valley, a shortcut of the Aare through the Sissle Valley with [Sissle 1] and without [Sissle 2] diversion of Limmat and Reuss). Remaining overburden thickness is shown with respect to the Top Opalinus Clay. Red square shows the location of the provisional HLW disposal area.
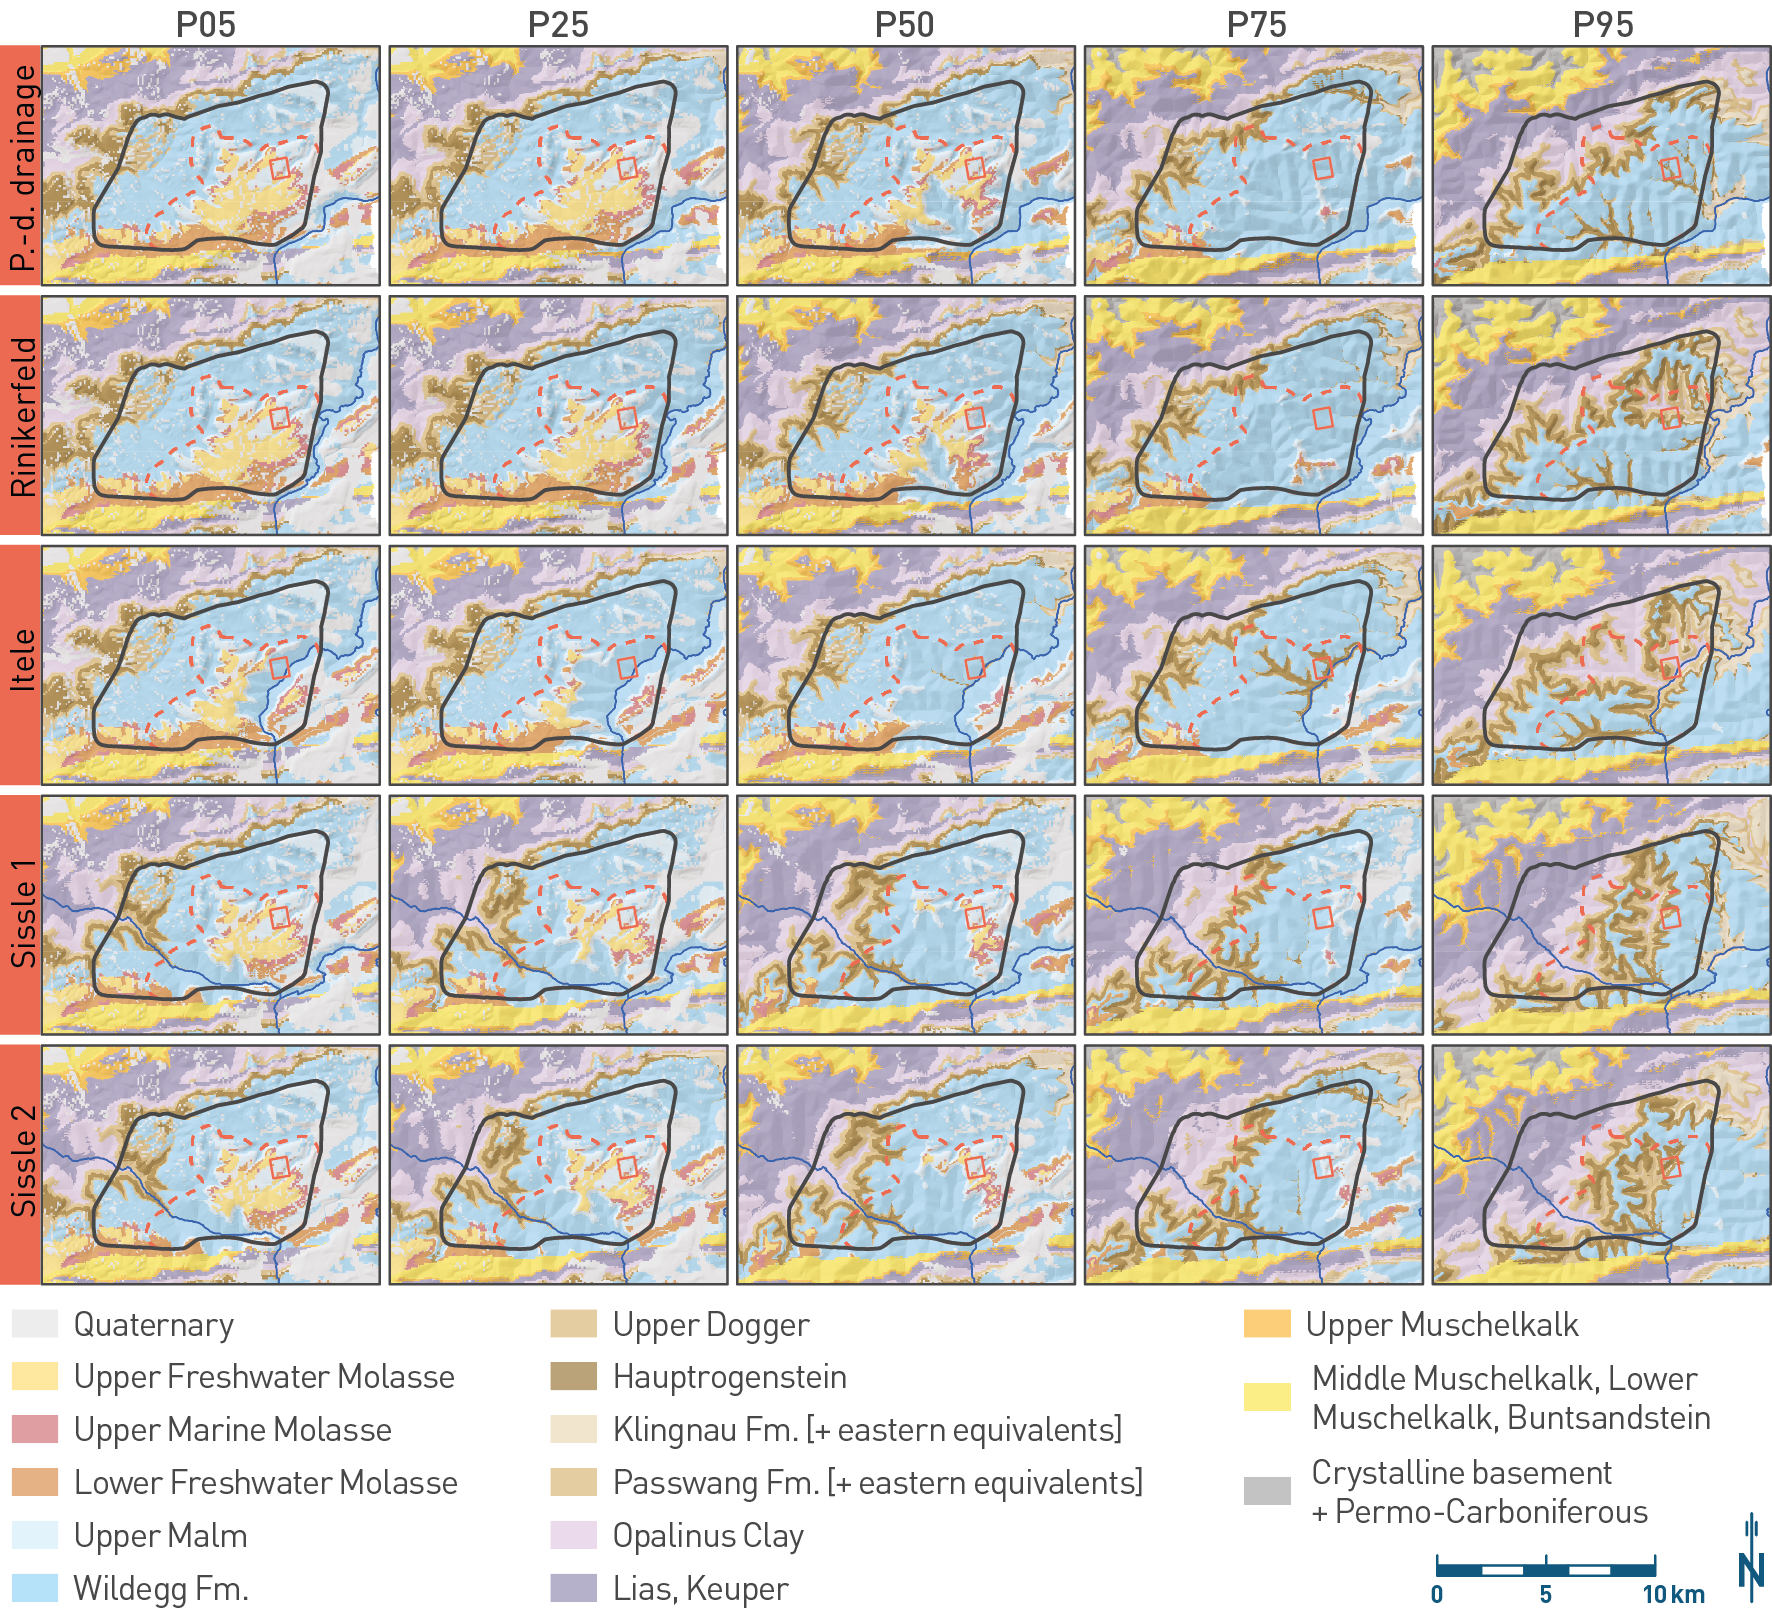
Fig. 6‑38:Outcrop maps representing the evolution of local topography at one million years using alternative drainage networks for JO
Shown are examples of synthetic future landscapes overlain by colour-coded geological outcrop maps for certain quantiles of parameter combinations (e.g. 25th percentile of fluvial incision after one million years as derived from the SPIM modelling, combined with the 25th percentile of the erodibility distributions) for the present-day main drainage network and alternative drainage networks (reactivation of the Rinikerfeld Channel, breakthrough channel through the Itele Valley, a shortcut of the Aare through the Sissle Valley with [Sissle 1] and without [Sissle 2] diversion of Limmat and Reuss). The outcrop map is based on the Regional 3D Geological Model 2012 (Gmünder et al. 2013) used within MuddPILE. Red square shows the location of the provisional HLW disposal area.
The actual overburden assessment of the provisional disposal areas with respect to local topography uses the probability distribution of remaining overburden thickness provided by the surrogate model (see above, and Nagra 2024k). Results are shown in Fig. 6‑39 for the local topography scenarios in each siting region based on (a) preservation of the present-day drainage network, and (b) including alternative drainage networks. For JO, the latter combines the results for the present-day and alternative drainage networks, as weighted by the expected probability of occurrence (Nagra 2024k). For JO, including local topography in both (a) and (b) has a significant positive effect as compared to accounting for the LEB only (Fig. 6‑32).
For NL and ZNO, alternative drainage networks are assessed based directly on the output of the SPIM model (Section 6.4.3.1), reflecting the probability distribution of the future LEB. For NL, results in (a) and (b), i.e. accounting for local topography vs. for LEB only, are quite similar. The reason is the proximity of the NL provisional disposal area to the present-day main drainage system (defining the LEB), in this case represented by the Glatt River (Fig. 6‑34). Accordingly, less local topography develops at the specific location in the case of a stable main drainage network. In contrast, ZNO shows a higher median value of remaining overburden thickness assuming the present-day drainage compared to NL (Fig. 6‑39a), as its provisional disposal area is more distant to the present-day main rivers. Remaining overburden thickness (including the median), however, is largest in NL among the three sites when including alternative drainages (Fig. 6‑39b). Given the low present-day relief in the eastern part of NL and ZNO, this represents a valid case to compare the two sites with respect to the evolution of local topography. The results are incorporated in the combined assessment of glacial and non-glacial erosion in Section 6.4.4.
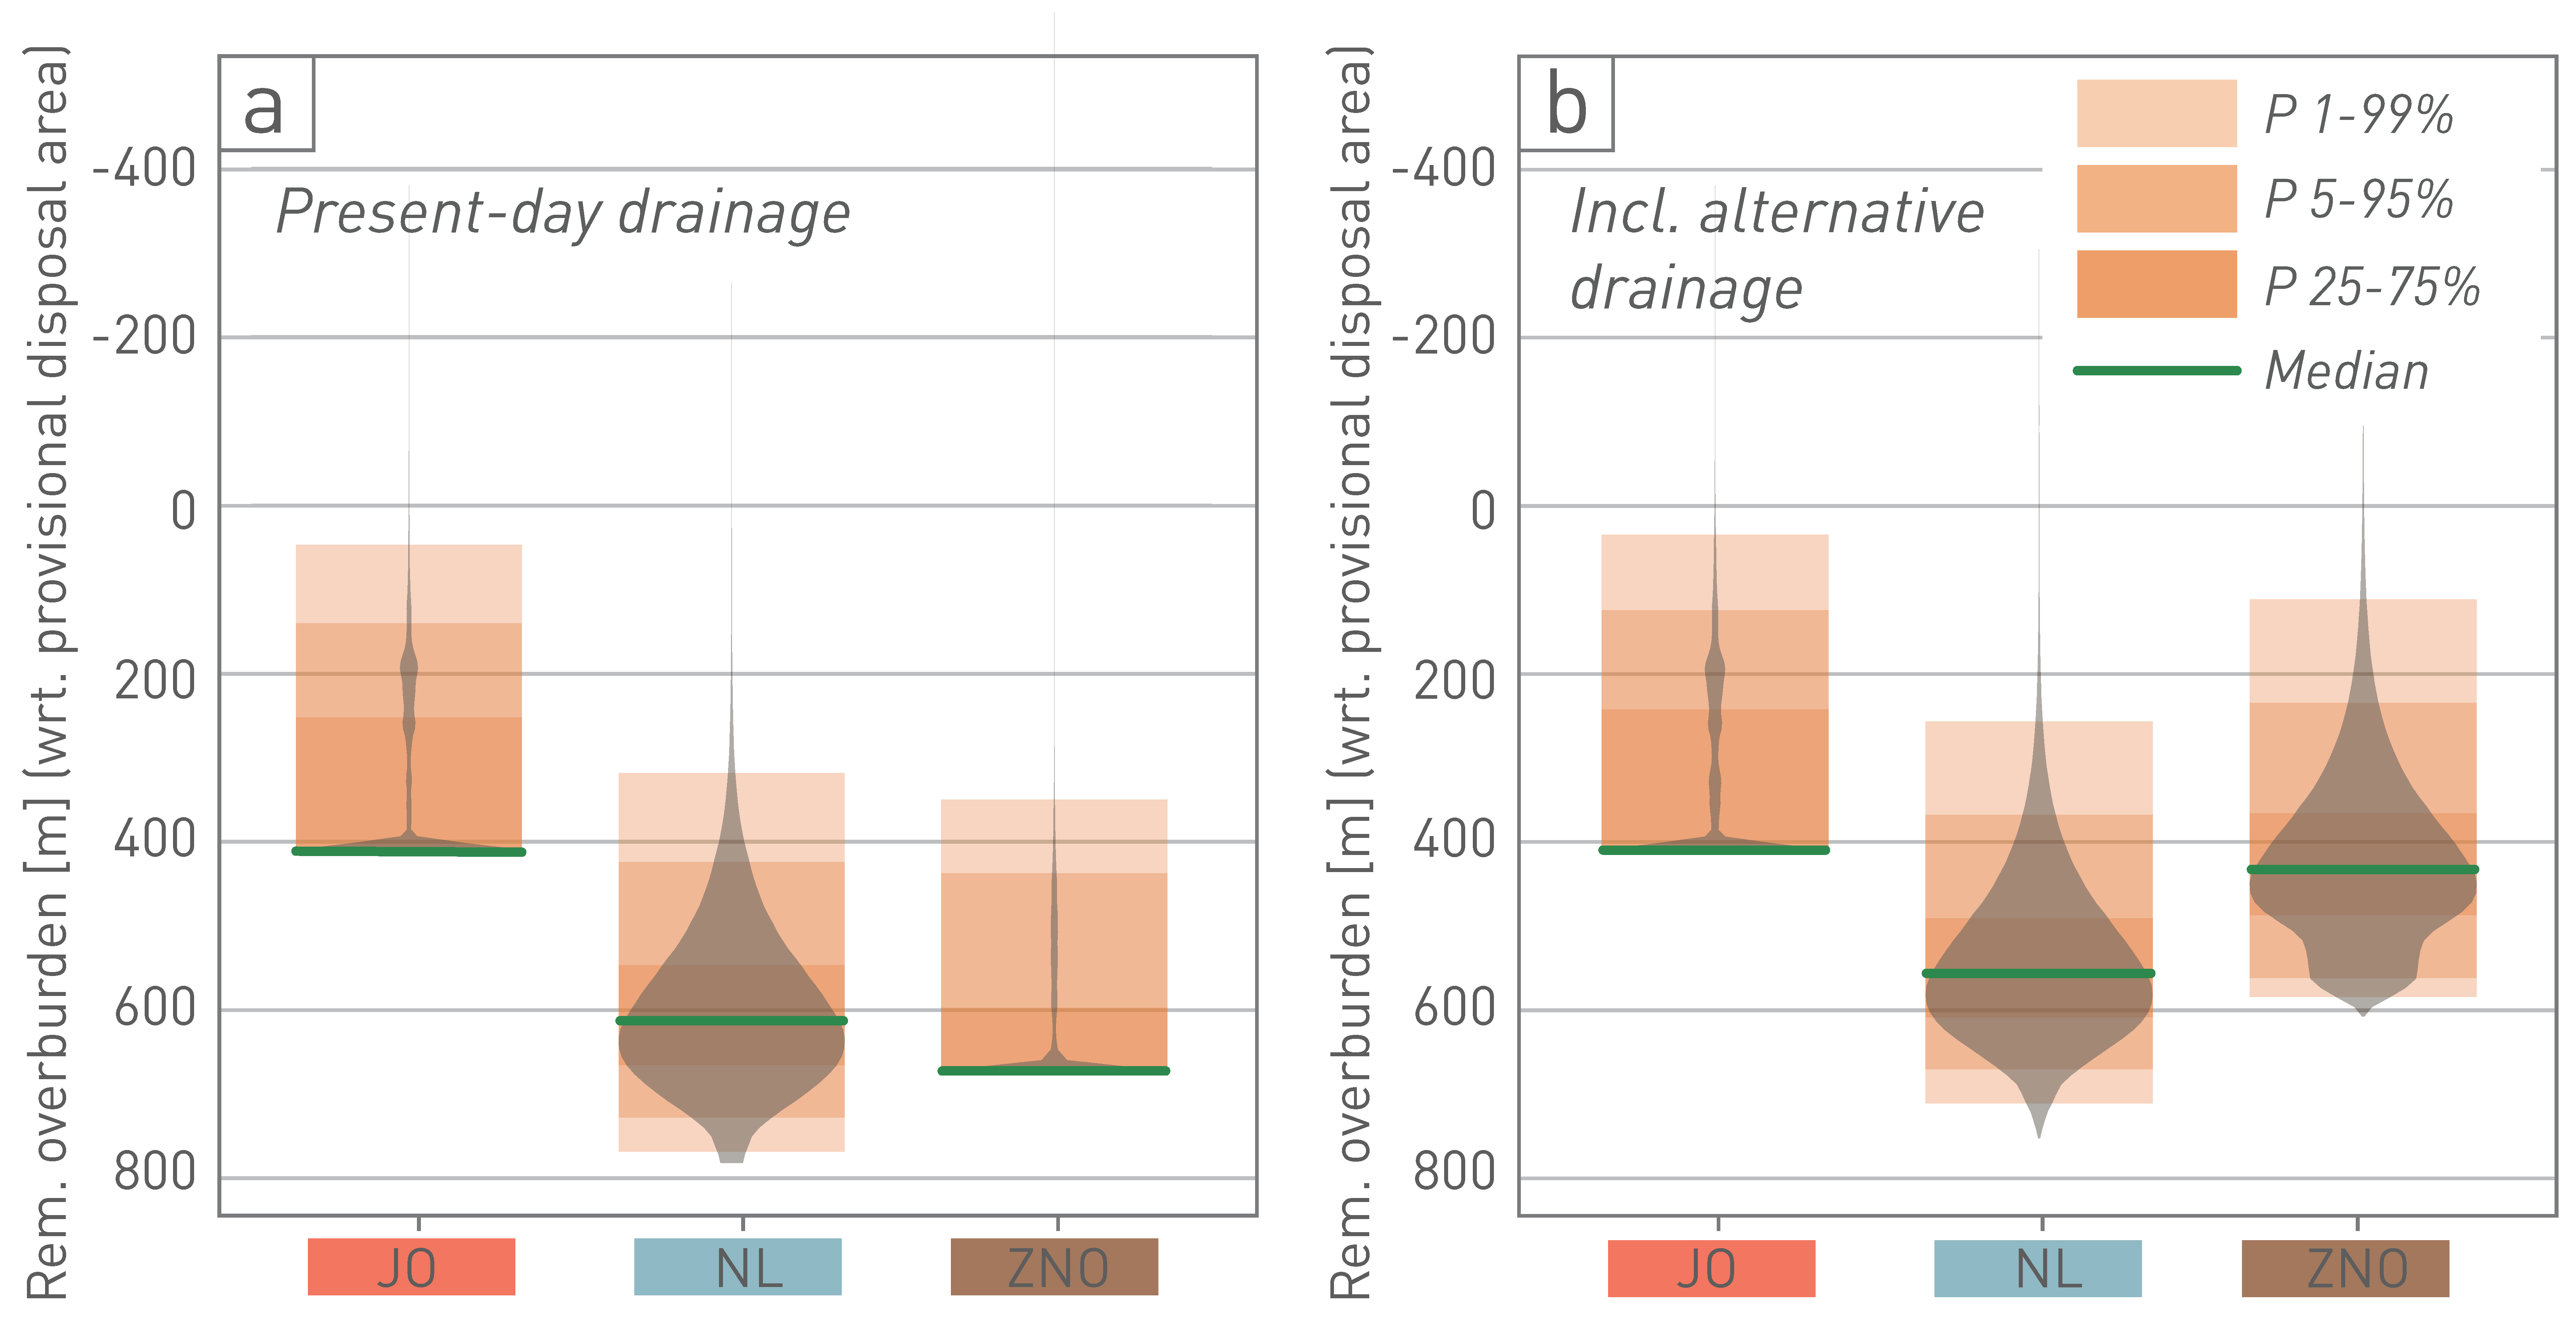
Fig. 6‑39:Distributions of remaining overburden thickness after one million years including local topography for JO
Violin plots and boxes with selected percentiles of remaining overburden thickness at the location of the provisional disposal areas (see caption of Fig. 6‑32 for explanation). (a) Distributions with respect to the evolution of local topography, assuming preservation of the present-day drainage network (i.e. main rivers remain laterally at the same position as today (Fig. 6‑34). Including local topography has a significant effect, especially for JO, if compared to the distribution shown in Fig. 6‑32d. Distributions for JO and ZNO "converge" at the value of the present-day overburden thickness, because of a modelling step that "caps" the model elevation as a function of the present-day terrain surface (further details in Nagra 2024f). (b) Several plausible alternative drainage scenarios were tested for JO (Fig. 6‑34). A respective weighting by the probability of occurrence of the present-day and alternative drainage scenarios is incorporated into the uncertainty estimates for the evolution of local topography in JO. In NL and ZNO, scenarios for alternative drainage networks cannot be reasonably derived because of the low relief. Distributions are calculated using the (worst case) assumption of a main river positioned at the repository location (corresponding to direct output from the SPIM modelling, Fig. 6‑32d).