
Overall, the geodynamic setting of Central Europe (Fig. 6‑3a) is influenced by the convergence between the African and Eurasian plates (Chapter 3, Fig. 3‑12). The largest geodetic velocities and highest strain rates are measured in the eastern part of the African – Eurasian plate boundary zone in Greece and Turkey (e.g. DeMets et al. 1990, Serpelloni et al. 2022). Rates decline significantly towards the western plate boundary zones, closer to the Alps. The highest rates of deformation within the western plate boundary zone have been recorded along wide, diffuse deformation zones, such as the Apennines, the Dinarides, or the Betic Cordillera (see Fig. 6‑3a, b and c). Here, active deformation appears to be mainly influenced by independent microplate motion, such as the counterclockwise rotation of the Adriatic plate and Tyrrhenian and Aegean back-arc extension (e.g. Nocquet & Calais 2004, Piña‐Valdés et al. 2022; see Fig. 6‑3b for low geodetic rates, Fig. 6‑3c for diffuse seismicity and Fig. 6‑3d for SHmax indicators of stress regimes).
In the Alpine region, horizontal geodetic velocities are influenced by microplate deformation, but the rates are significantly lower and seismicity relatively sparse compared to the above-mentioned zones, despite considerable topographic relief and evidence for vertical motion (Fig. 6‑3a, b, c, Fig. 6‑4). Across the central Alps, shortening is low with values similar to the uncertainty (Sánchez et al. 2018).
Based on the global navigation satellite system (GNSS) measurements, the vertical velocity field of the Alps is in the order of ~ 2 mm/yr along the northward-convex border (Fig. 6‑4), increasing towards the central Alps and characterised by a generally positive correlation with topography (Sánchez et al. 2018, Piña‐Valdés et al. 2022, Serpelloni et al. 2022, Pintori et al. 2022). Total decadal-scale uplift is generally higher in the areas that undergo less horizontal shortening and, as such, is higher in the western and central Alps compared to the eastern part (Sternai et al. 2019). A tectonic contribution to rock uplift and exhumation appears to be pronounced in the eastern Southern Alps, where ~ 2 mm/yr movement between the Adriatic plate and stable Europe are accommodated (Sánchez et al. 2018, Sternai et al. 2019, Serpelloni et al. 2022). In addition to tectonic drivers, buoyancy forces associated with isostasy make a significant contribution to uplift (e.g. Sternai et al. 2019, Piña‐Valdés et al. 2022). Isostatically driven processes, such as postglacial or erosional rebound/unloading, slab detachment, as well as the effects exerted by the formation of dynamic topography (upper mantle processes) and the establishment of horizontal gradients associated with gravitational potential energy are considered to play a role (Sternai et al. 2019). Isostatic adjustment in response to deglaciation or erosion might cause uplift and can be in the order of 10 – 30% and 10 – 20% in the western and central Alps and up to 50% and 30 – 40% in the eastern Alps, respectively.
Towards the northern and southern Alpine Forelands, vertical velocities decrease to positive sub-millimetre and even to stable, zero mm/yr rates (Sánchez et al. 2018, Henrion et al. 2020, Pintori et al. 2022; Fig. 6‑4c). Low vertical velocities are observed in the Jura Mountains and the Molasse Basin (Fig. 6‑4c).
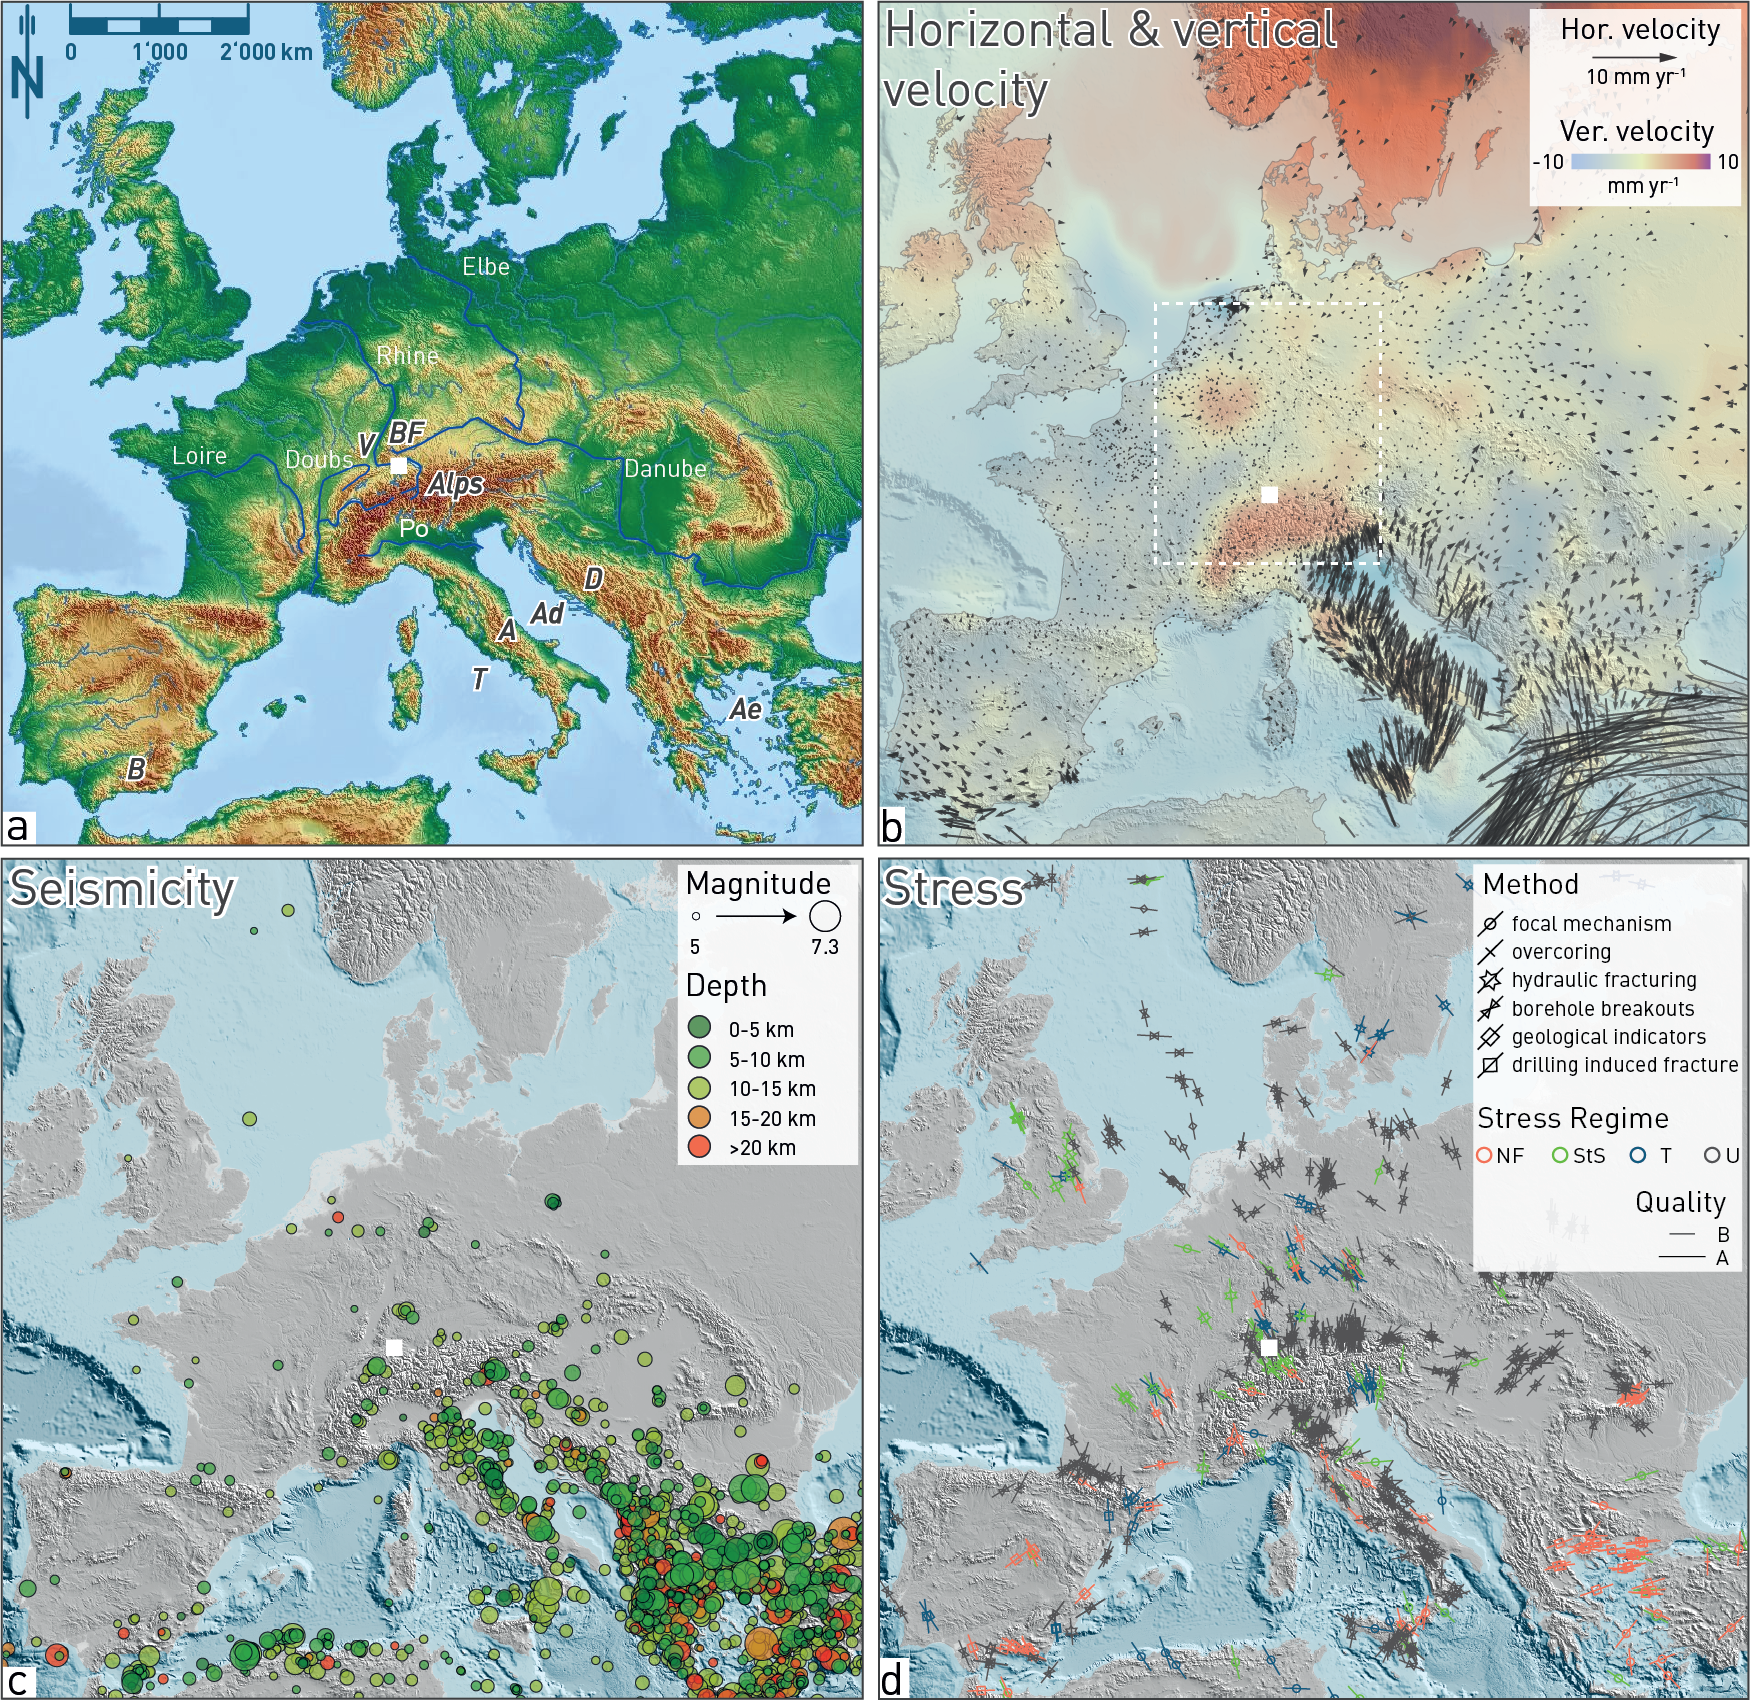
Fig. 6‑3:Velocity fields, seismicity and stress vectors in Europe
(a) Hillshade and digital elevation map of the same area with labels of geographic features discussed in Section 6.2.1. V: Vosges, BF: Black Forest, A: Apennines, B: Betic Cordillera, D: Dinarides, Ad: Adriatic Ocean, T: Tyrrhenian Ocean, Ae: Aegean. (b) By combining and harmonising geodetic velocities of several European datasets, a smoothed 3D velocity field solution across Europe and with respect to a stable Europe framework was generated (Piña‐Valdés et al. 2022). Dashed white rectangle outlines Fig. 6‑4. (c) Earthquakes with magnitudes equal to and larger than 5 between 1900 and July 2023, colour-coded by depth (https://earthquake.usgs.gov/earthquakes/search/; retrieved July 10th 2023). High-seismicity regions in Europe (e.g. Greece and Italy) are associated with subduction processes and coincide with regions of large horizontal velocities. (d) Direction of maximum horizontal stress and stress regime (Section 4.4). The map is based on the World Stress Map project (CASMO) and shows data from focal mechanism solutions, borehole breakouts, hydrofractures etc. Stress indicators are colour-coded by their respective stress regime (Heidbach et al. 2016, 2018). NF: Normal fault, StS: Strike-slip fault, T: Thrust, U: Unknown. White solid square in all figures depicts the study area.