
This section presents the combined results of the erosion assessment for a 1-million-year time frame. Discussed are the remaining overburden thickness for the expected geological evolution as well as the probability of combined glacial and non-glacial repository excavation. The example below considers the full range of uncertainties as elicited for the locations and depth of the provisional HLW disposal areas over the period of one million years. Of this full range of uncertainties, the 5 – 95% range is considered as "expected range" of future evolutions. In Nagra (2024k), additional calculations are shown for subsets of scenarios that feed into site comparison (site comparison criteria 2.2. and 3.3; Nagra 2024t).
Fig. 6‑44 shows the total probabilities of remaining overburden thickness distributions after one million years. Remaining overburden thickness is calculated in a Monte-Carlo approach using one million samples (Section 6.4.2.3, Fig. 6‑29) and is provided with respect to the respective provisional disposal areas (i.e. the worst case of their four corner- and one midpoint19 ). The respective probabilities to incise to the depth of the provisional disposal areas are deduced from the Monte Carlo samples. Fig. 6‑44 is tripartite for better accessibility: the upper panel provides probability density functions (PDF), from which the most likely scenarios can be deduced (bulk of the curves, highlighted by the vertical arrows). The middle panel shows the same distributions as cumulative distribution function (CDF). The shaded areas represent the 5 – 95% probability (x-axis) and associated overburden thickness amounts (y-axis), which are considered here as "expected range" of future evolutions. Very low probabilities are not distinguished in the upper and middle panels. Therefore, the lower panel shows the CDF in log-space. The intercept with the position of the provisional disposal area (red dashed line) reveals the probability of excavation.
The most likely scenarios show at least ~ 400 m of remaining overburden thickness above the repository after one million years at all sites (vertical arrows in Fig. 6‑44a). In NL, nearly 600 m of overburden thickness is likely to be preserved. At the 5 – 95% probability range, between ~ 125 and 410 m of overburden thickness might be expected in JO, between ~ 350 and 670 m in NL and between ~ 220 and 560 m in ZNO (shaded area and vertical arrows in Fig. 6‑44b). Considering the required 200 m of overburden thickness for efficient self-sealing (Section 5.7), the JO site (i.e. at the position of the provisional disposal area) shows more limitations within this range than the other sites. However, suitable conditions in JO are available in the immediate surroundings of this provisional disposal area (Nagra 2024k), such that JO can also reliably provide sufficient overburden thickness to secure the barrier function over the period under consideration.
Excavation of the repository within one million years was estimated to be highly unlikely at the provisional disposal areas in all three siting regions. This fact is best seen in the log-scale visualisation of the distribution (vertical arrows in Fig. 6‑44c, see grey box showing the 5 – 95% range for comparison). This likelihood is about an order of magnitude lower for the provisional disposal area in NL than in JO and ZNO. Excavation probabilities were calculated to show the robustness of the repository. A discussion on the plausibility of the corresponding results, especially considering the extreme values contained in the tails of the total probability can be found in Nagra (2024k).
Fig. 6‑44 also shows the main contributor with respect to the distributions of remaining overburden thickness. Although deep glacial erosion is capable of incising strongly into the overburden, its probability to incise at the position of the repository is strongly reduced. The main contributors consequently are fluvial incision driven by rock uplift and, in case of JO, associated evolution of local topography. The present-day low relief in ZNO and in the east of NL does not allow to reasonably consider and rank scenarios for future evolution of local topography. Instead, remaining overburden is considered with respect to the local erosion base (see Section 6.4.3.2). However, it cannot be excluded that the location of the main drainage will be shifted away from the provisional disposal area and a significant protective relief will develop in the future. Accordingly, the remaining overburden thickness might be further increased, and the probability of excavation further reduced in NL and ZNO.
Consequently, considering the three erosion processes, NL provides the best protection against future erosion.
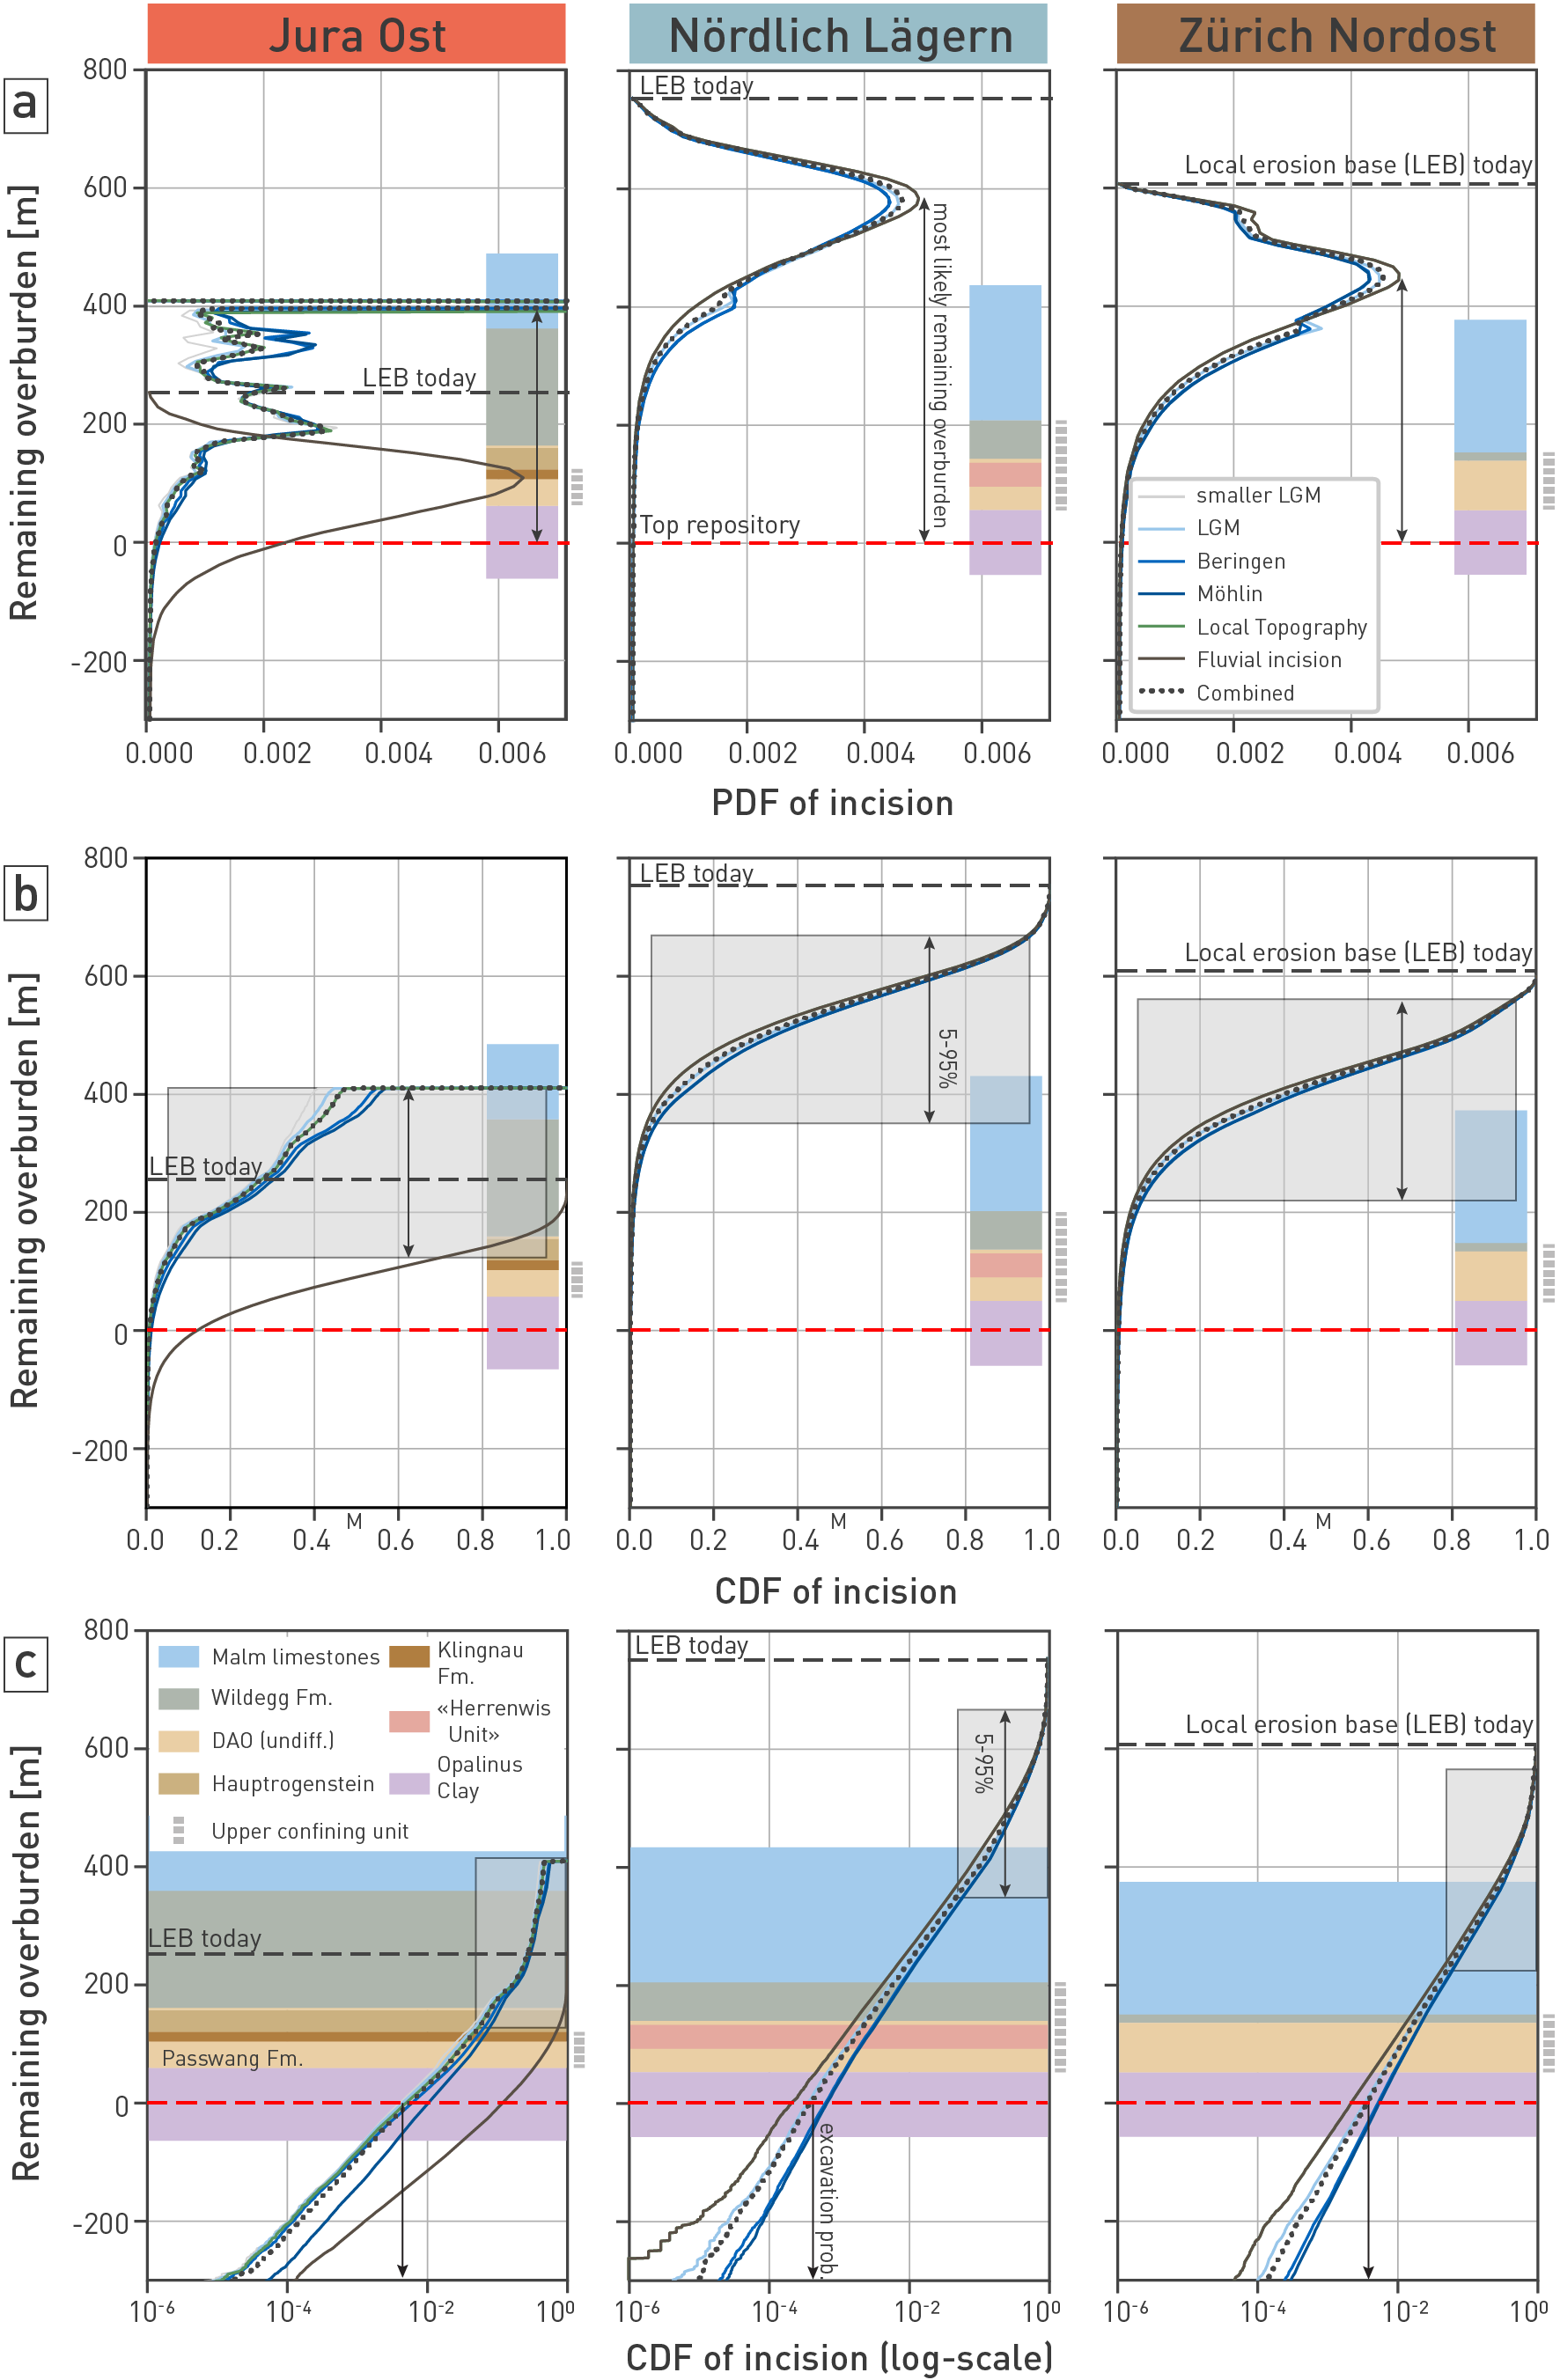
Fig. 6‑44:Estimated probabilities of remaining overburden thickness above the provisional disposal area in the three siting regions
The same outputs are displayed in three different formats for better visualisation (a) as probability density function (PDF), (b) as cumulative distribution function (CDF), and (c) as CDF, transferred onto a logarithmic scale. Results are shown with respect to the depth and location of the provisional disposal area (red dashed line). The thick black dotted line represents the final combined probability. That is, it integrates over (i) both glacial and non-glacial processes and (ii) the occurrence of all considered key glacials. The lines "smaller LGM", "LGM", "Beringen" and "Möhlin" integrate over both glacial and non-glacial processes but are restricted to the occurrence of the specific key glacial. The line "Local Topography" integrates over all considered key glacials for determination of alternative drainage networks but is restricted to non-glacial processes (output Model B, i.e. no glacial overdeepening). The line "Fluvial incision" describes the modelled LEB (local erosion base) from Model A.
For JO, the final combined curve is a combination of the fluvial incision by main rivers (line "Fluvial incision"), evolution of local topography (including ranked scenarios) and deep glacial erosion (output Model C; conditional on the occurrence of key glacials). Local topography was not included in the case of NL and ZNO. Here, a main river (defining the local erosion base) was assumed to be located directly above the provisional disposal area (see Section 6.4.3.2). The vertical arrows in (a) highlight the most likely amount of remaining overburden thickness at the location of the provisional disposal area, in (b) the 5 – 95% range (also shaded), see M for position of median values, and in (c) the probability of excavation, which is about an order of magnitude lower in NL (see grey shaded box showing the 5 – 95% range for comparison). Simplified lithostratigraphic columns are provided with these images, allowing to visualise the incision depth. DAO: Dogger Group above Opalinus Clay. The grey dotted bar at the right of each subfigures represents the upper confining units.
Note, in the case of Model B (modelling of local topography), the remaining overburden thickness is determined by the minimum value within the entire perimeter of the provisional disposal area. ↩