
The differences illustrated above (e.g. occurrence of glacial overdeepenings or local topography) become effective when considering the depth-dependent barrier function (Sections 6.1.2, 6.5.2.2) of the host rock and potentially relevant tectonic- and climatic-driven surface processes. Fig. 6‑28 exemplifies this effect by showing the fractions of the different landscape elements (compartments) with respect to the depth of the Top Opalinus Clay (i.e. the repository host rock) for each siting region. These fractions are shown for (1) the entire HLW siting regions, (2) the provisional disposal area (reflects the ~ 1 km2 outline of the repository project for high-level waste; for location see Fig. 6‑34) and (3) the provisional disposal area including spatial reserves (see Nagra 2024e for further information). Note that the final calculations of the erosion assessment refer to the provisional disposal areas.
The depth of the provisional disposal area (approximately 50 m below the Top Opalinus Clay; see Fig. 6‑28, brown boxes) with respect to the local erosion base is deepest in NL (794 m at centre, 764 m at most shallow location), and considerably less deep in JO (291 m at centre, 270 m at most shallow location). On the other hand, the amount of local topography is significantly larger, both as median (206 m) and as range, in JO than in NL (median 113 m) or ZNO (median 84 m, red boxes). This local topography adds additional overburden thickness above the repository needed to maintain the barrier effect (Section 6.1.2).
The distribution of glacial overdeepenings in the siting regions varies significantly. As already highlighted above, no overdeepening is observed in the entire HLW siting region of JO. The box plots for glacial overdeepenings in NL and ZNO (blue boxes in Fig. 6‑28) not only show the occurrence of such feature in the siting regions or the spatial reserves but also show that they can be very deep (> 150 m below local erosion base [LEB] in the entire HLW areas of NL and ZNO); more often or in larger parts, however, they do not reach more than about 70 m below LEB with median values around 30 m. This is an important observation when addressing this effect in the future assessment.
Accordingly, to compare the three sites with their different boundary conditions in an unbiased way, the landscape compartmentalisation into local erosion base, local topography, and glacial overdeepenings was transformed into a model cascade (see next section).
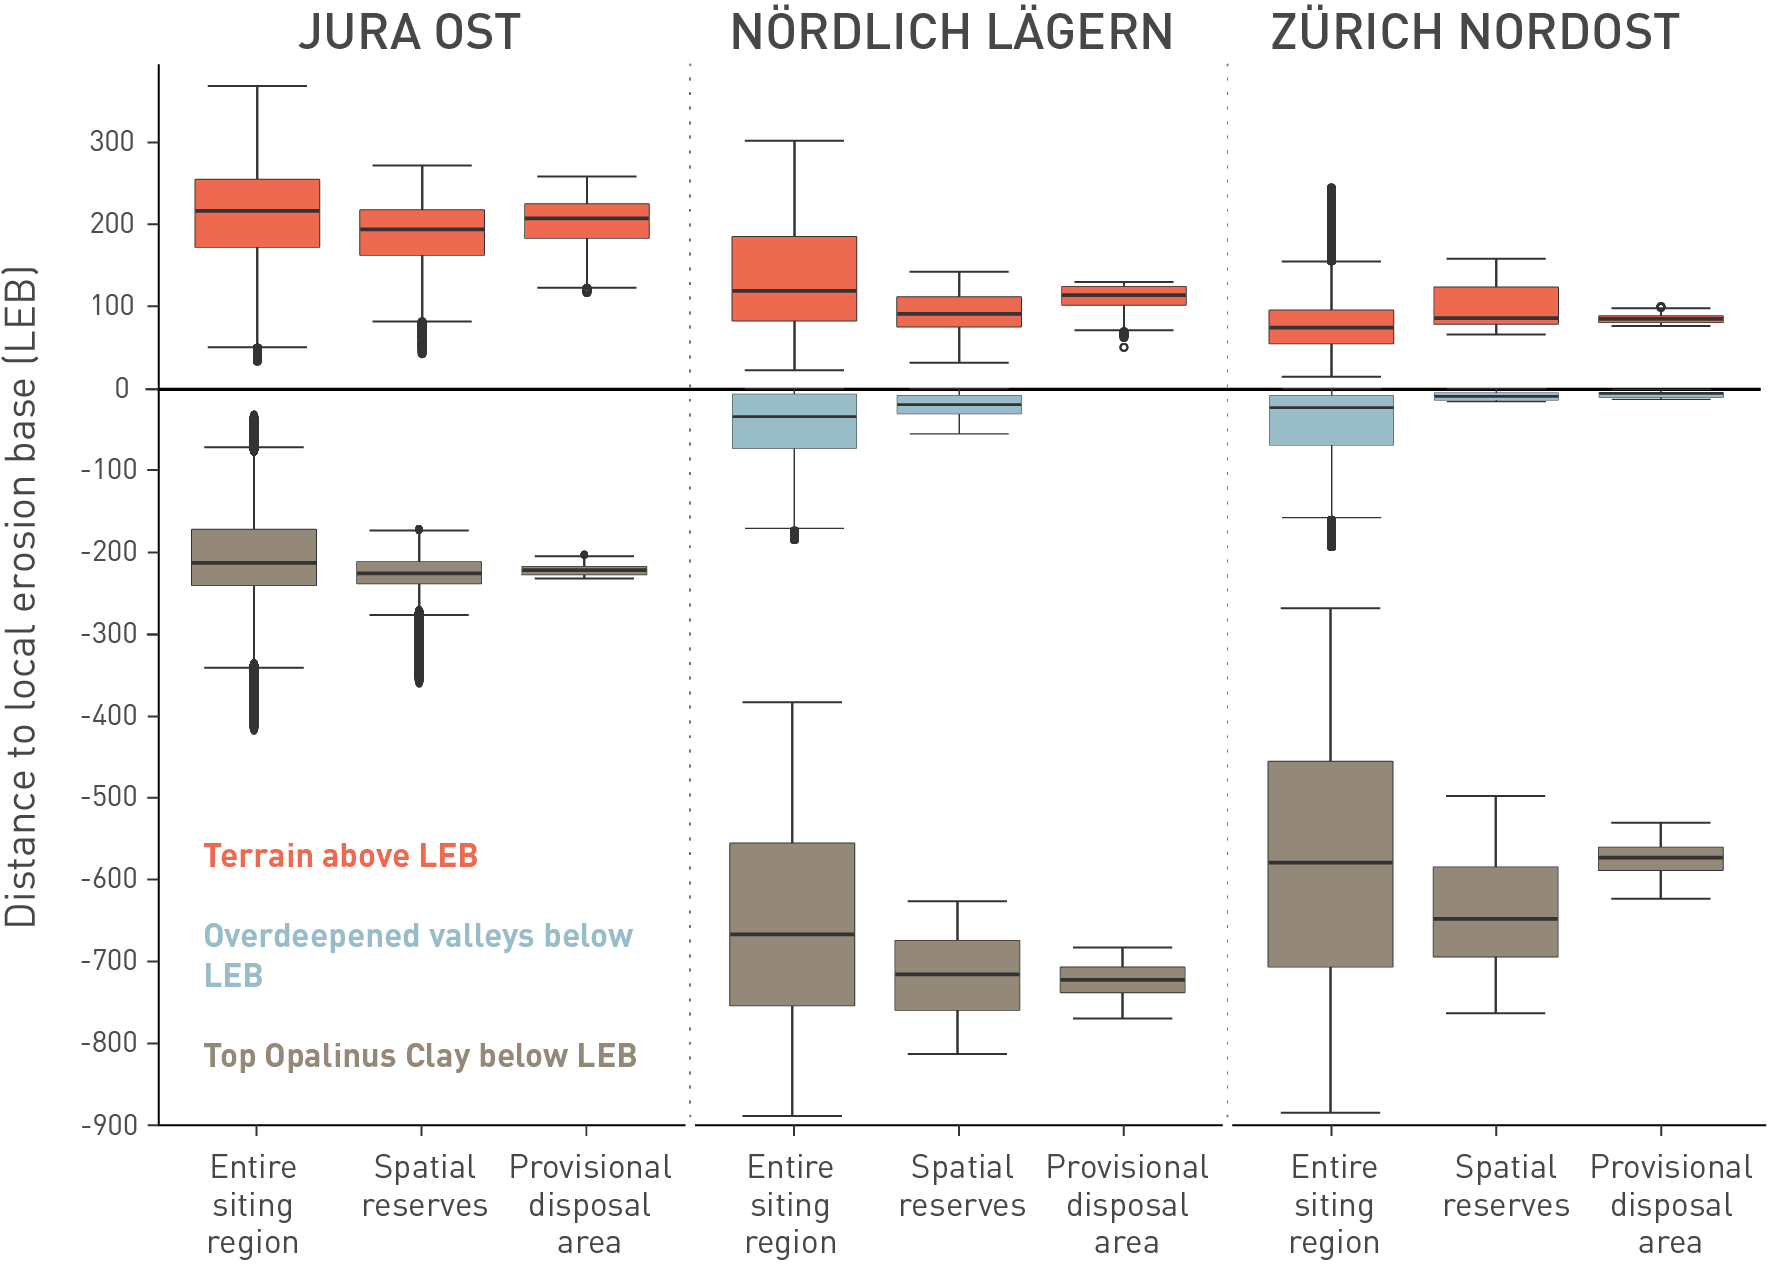
Fig. 6‑28:Site-specific constraints of the landscape compartments within the siting regions
Depth profiles showing boxplot statistics on the main compartments with respect to the local erosion base (0 m line). Boxes entail the interquartile range between 25th – 75th quantiles, the whiskers the extreme values, as derived from multiplying the interquartile by 1.5. Values outside the whiskers are considered statistical outliers. The siting regions share different portions of the landscape compartments. The depth of the provisional disposal area with respect to the local erosion base (LEB) is deepest in NL, and considerably less deep in JO. On the other hand, JO is covered by significant terrain above the LEB (local topography) and this site is less affected by glaciations. JO has no overdeepened area within the siting region.
For the calculation of the difference raster LEB – Top Opalinus Clay, raster datasets of the LEB (Pietsch & Jordan 2014) and the horizon Top Opalinus Clay (Nagra 2014b) were used. In comparison to the local model Top Opalinus Clay of 2014 (Nagra 2014b), the more recent 3D horizon model of the sites (Nagra 2024m), covering the zones of the spatial reserves and the provisional disposal areas, shows the following average differences: 18 m deeper in JO, 12 m deeper in NL, 6 m shallower in ZNO. Note that the assessment of future erosion presented in Section 6.4.3 is based on the recent 3D horizon model documented in Nagra (2024m).