
The main parameters driving fluvial incision are uplift/subsidence, climate-driven water and sediment flux, and erodibility, with natural feedback between them.
Climate-driven water and sediment flux
The glacial/interglacial cyclicity (Section 6.3) has a major impact on the spatiotemporal sediment production and transport in Alpine source areas and their forelands (e.g. Antoniazza & Lane 2021). Sediment yield may be highly variable during phases of glacier advance, retreat, and readvance for instance. Antoniazza & Lane (2021) describe the highest sediment availability during early phases of glacial retreat and re-advance, before the sediment sources become exhausted at later stages.
Hinderer (2003) provided a source-to-sink case study from the Alpenrhein and Bodensee area, covering the Late Pleistocene and Holocene. They propose temporal storage of sediment in the source areas and the foreland during glacials. The highest sediment flux instead was observed during early melting (10× higher flux during the Late Pleistocene when compared to today). Importantly, the Bodensee as a large periglacial lake constitutes an efficient sediment trap and decouples further sediment flux into the foreland and the Hochrhein area (Hinderer 2003).
Upon filling of the Bodensee, incision in the Hochrhein is limited, because bedload is trapped within the lake and is not available as tools for fluvial impact erosion. The largely preserved knickpoint of the Rhine Falls seems indicative for this process. When bedload tools become available, it is expected that the local incision will strive towards equilibrating the longitudinal profile of the Hochrhein. However, at this point, further sediment flux from the Alpenrhein and the source region is no longer inhibited and large sediment supply may result in the opposite cover effect, i.e. shielding the riverbed from further vertical downcutting.
Rock uplift and stream piracy – process and Quaternary history
Rock uplift and subsidence of any landscape is mainly driven by neotectonic activity and/or isostatic compensation to mass redistribution by glacial processes (erosion and deposition). The effects of these processes dictate rates and locations of incision and sediment accumulation and thus can cause changes in river profiles (steepening, knickpoints), catchment changes by piracy, and variability in strength of the exposed rocks.
The influence of tectonic domains on the river profiles of the Aare and Rhine were explained in Section 6.2.2. Most important is the rock uplift of the Alpine Foreland. However, Rhine – Danube catchment competitions can also cause a sudden significant drop of the baselevel. As highlighted in Section 3.4.5, the past evolution of the Aare – Rhine River system occurred in several phases of drainage reorganisation that resulted in significant baselevel drops between tens of metres and up to several hundred metres (see Fig. 3‑11 in Section 3.4.5). The present-day longitudinal profile of the Rhine is significantly shorter than that of the neighbouring Danube, which causes the Rhine catchment to grow at the expense of the Danube to achieve geometric equilibrium of the watersheds (e.g. Winterberg & Willett 2019). This relationship is illustrated in Fig. 6‑19. The drainage divide has successively shifted further east as this process progresses. Importantly, fluvial geometric imbalance is often associated with variable erosion (incision) rates, and those rivers and tributaries that gain watershed experience an increase in rates (e.g. Willett et al. 2014). Most likely, the main pulse of increased incision based on past reorganisation has already propagated through the Hochrhein (range of the siting regions). This hypothesis is supported by the observation that the Hochrhein has attained an overall along-river gradient that is comparable to the Rhine River section draining the Upper Rhine Graben. Former river gradients need to be interpreted with care due to the possibility of tectonic tilting, but were still steeper than today, possibly showing a gradual adjustment since the emplacement of the Höhere Deckenschotter (HDS; Fig. 6‑19b). The relatively low gradients today suggest also that similar drainage changes in the future will most likely lead to minor if any increased incision. Any large events of fluvial incision in response to drainage reorganisations are therefore not to be expected within the next one million years.
The Quaternary incision history, which is an important parameter for evaluating future incision, probably reflects a combination of rock uplift and piracy-related baselevel lowering. In the following paragraph, the Quaternary incision history is briefly summarised based on four main morphostratigraphic units with fluvioglacial sediments (Fig. 6‑20) that have been differentiated in the Swiss Alpine Foreland: Höhere Deckenschotter (HDS), Tiefere Deckenschotter (TDS), Hochterrasse (HT), and Niederterrasse (NT) (Graf 1993; Preusser et al. 2011), see also Section 3.5 and Nagra (2024k).
The HDS and TDS units are characterised by complex internal geometries (cut-and-fill sequences, see inset in Fig. 6‑20), in which several depositional phases can be distinguished, for example based on clast petrography and orientation (Graf 1993). These deposits reflect protracted depositional phases, largely in proximity to former glaciers. In addition, interglacial overbank deposits occur for example in the HDS (Hasli Formation) at Irchel (Thew et al. 2024, Bolliger et al. 1996) and in the TDS at Hungerbol (Graf 2009a). The base of the HDS and TDS units may locally differ by several decametres (usually between 30 and 100 m), thus reflecting a period of net bedrock incision between the depositional phases (see also Fig. 6‑19b). While the base of the relict HDS deposits is predominantly more or less planar, the TDS deposits are associated with pronounced channel forms. Accordingly, their base is highly irregular and has considerable relief differences (see for instance Fig. 6‑20, inset). The incision between HDS and TDS accumulation might have been caused by increased subsidence of the Upper Rhine Graben, increased uplift of the external Alpine Foreland (Preusser et al. 2011), and/or by re-routing of the Alpenrhein from the Danube towards the ‘recent’ Rhine system through the Rhine Graben (see Section 3.4.5, Fig. 3‑11); Claude et al. 2019). Age control of these units has improved considerably, but is still debated depending on different geochronometers (see Fig. 6‑20a and Nagra 2024k for more detail).
Two main phases of sediment accumulation following bedrock incision occurred after the deposition of the HDS and TDS units (Fig. 6‑19b and Fig. 6‑20). The morphostratigraphically next lower level (Hochterrasse, HT) is located about 50 to 200 m below the TDS level, depending on the region. The difference significantly increases from west to east and from north to south (Preusser et al. 2011). It has been argued that this significant drop of the local erosion base after TDS accumulation could potentially be associated with the Mid-Pleistocene Transition (MPT, see Section 3.5). Preusser et al. (2011) speculated that these changes, including glaciations extending into the Alpine Foreland, might have led to reorganisation of the major drainage system. Accordingly, the Alpenrhein at the location of the Bodensee changed its course from previously draining towards the Danube towards a new Hochrhein direction.
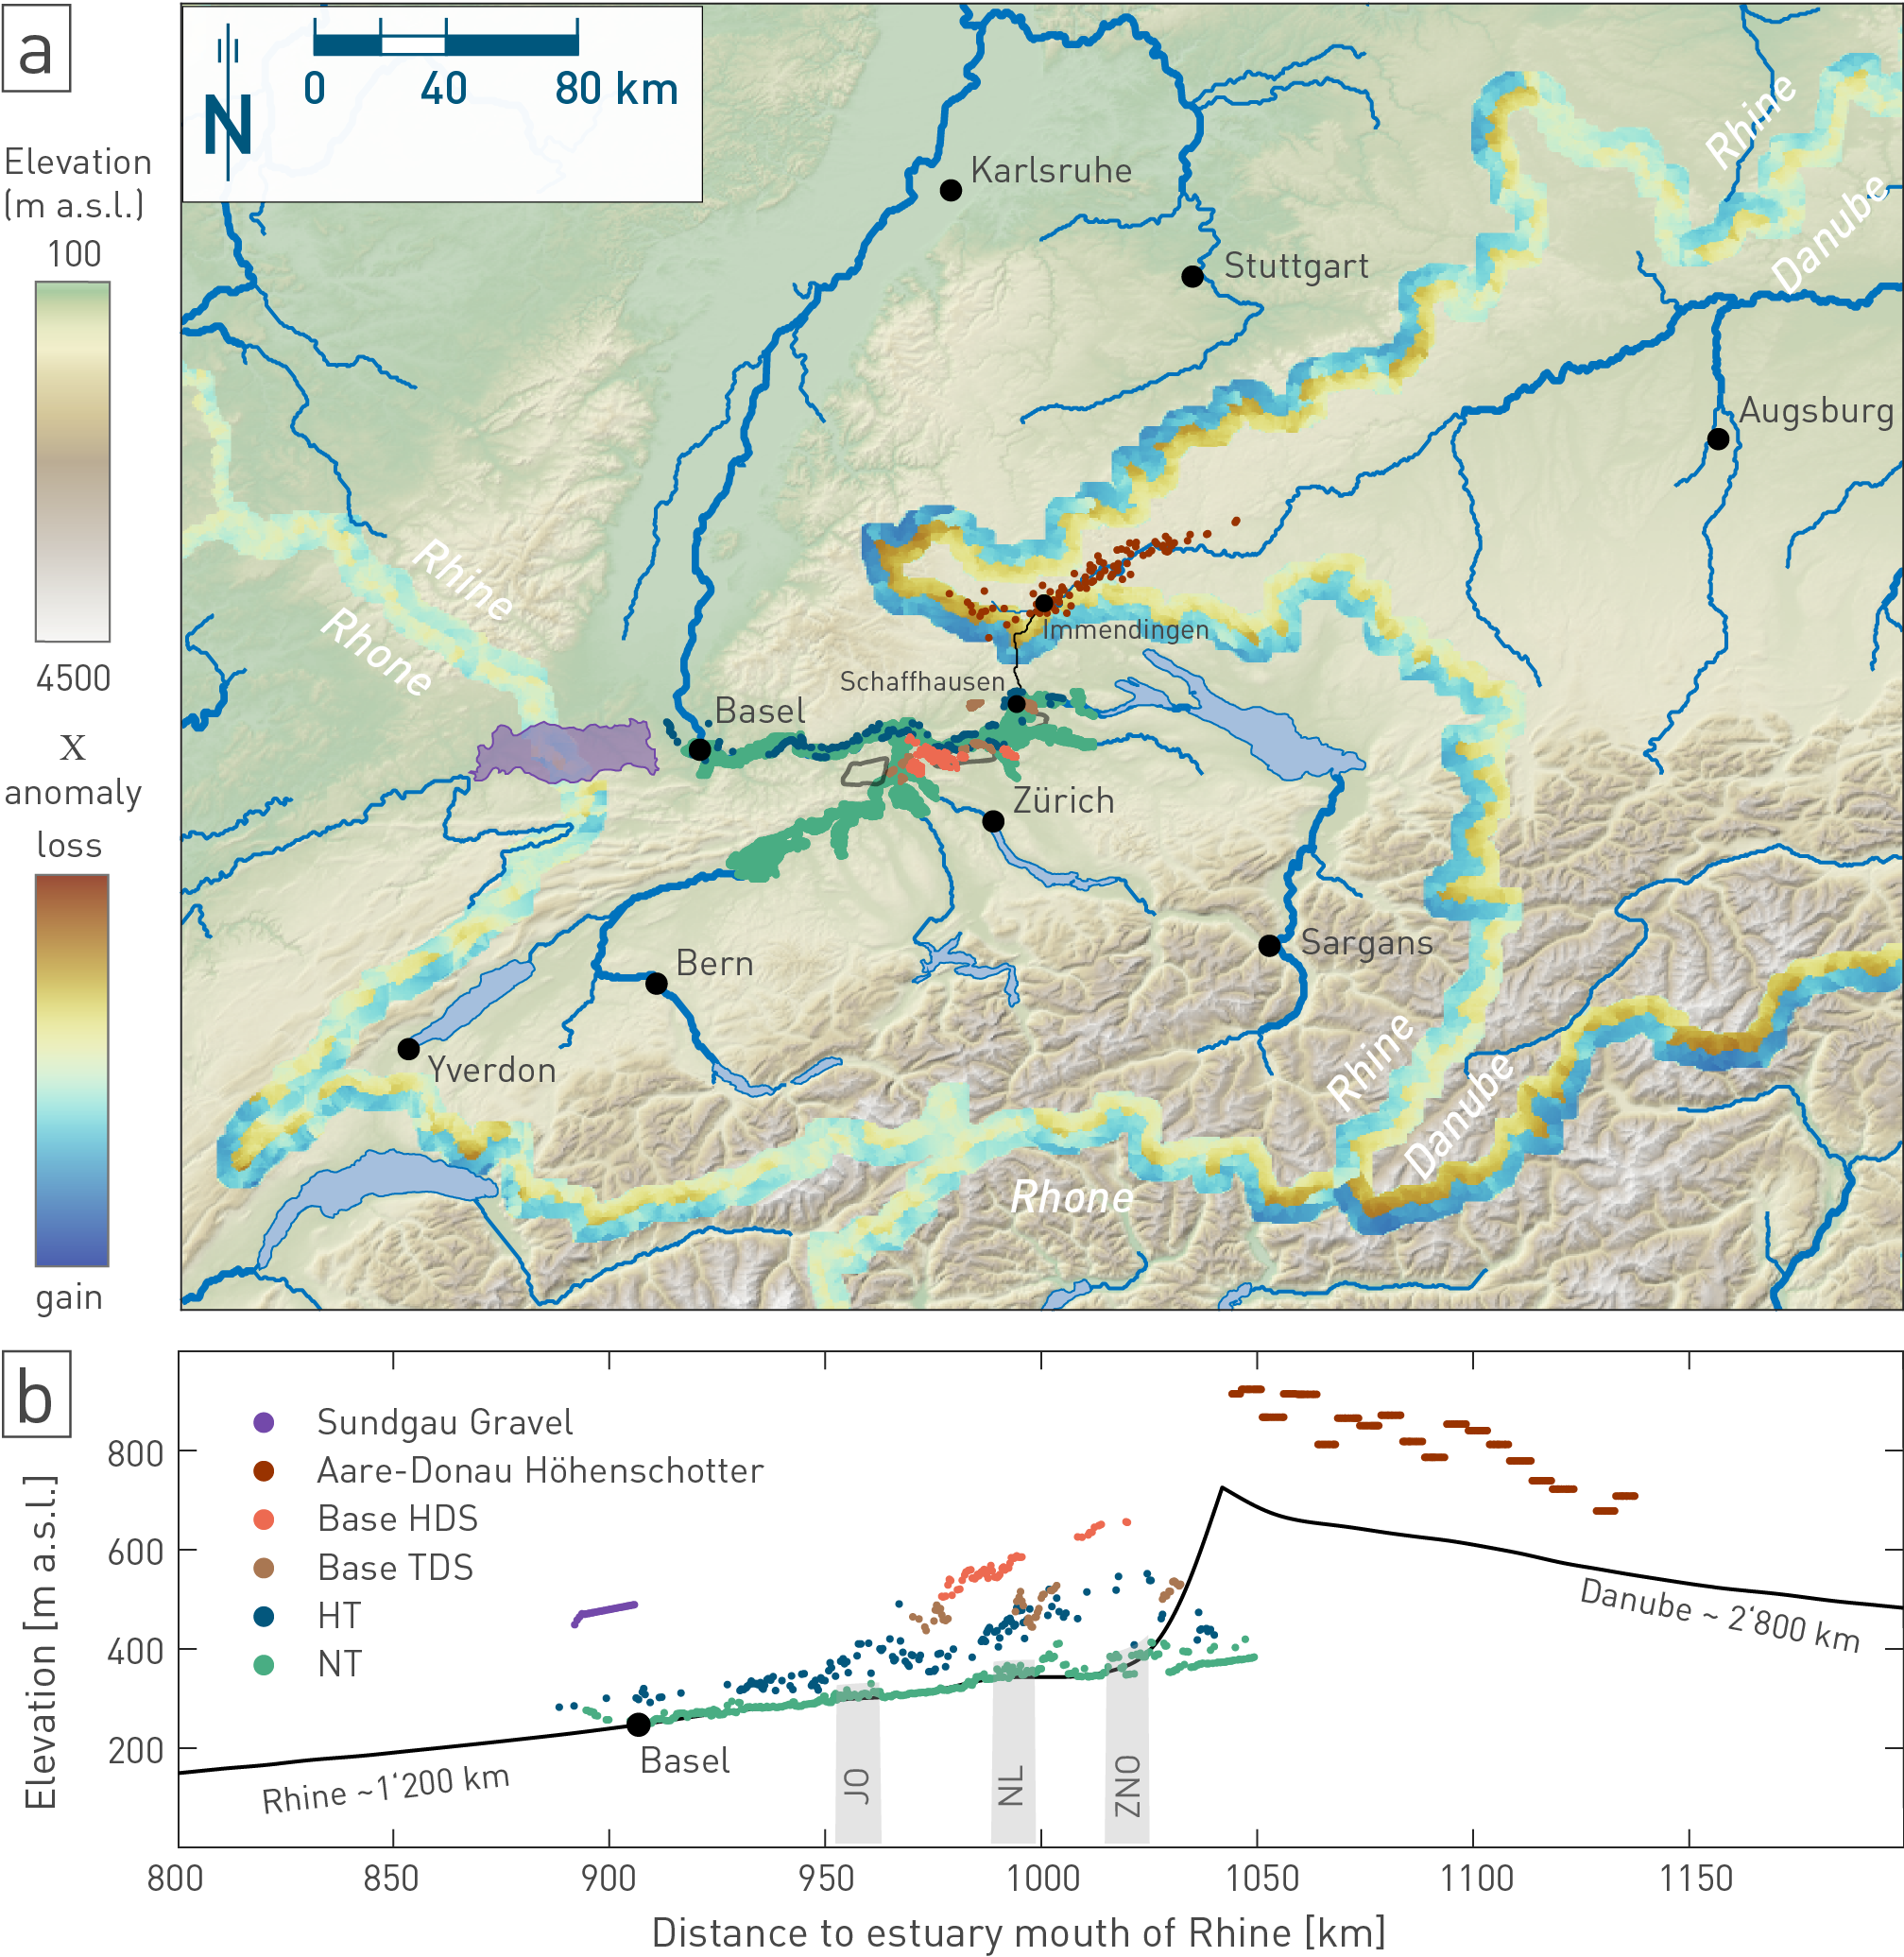
Fig. 6‑19:Catchment competition between the Rhine and Danube watersheds and drainage reorganisation
Digital terrain model (a) with main river courses and their catchments. The drainage divide of the Rhine catchment is outlined by a visualisation of the direction of future catchment growth (calculation of a parameter , e.g. Willett et al. 2014). The anomaly quantifies the differences in the parameter on either side of the divide. The parameter is calculated for the river network and then projected onto the main upslope divides. Blue values indicate low values and thus potential future gains in drainage area, whereas red values indicate potential losses. Sharp cross-divide contrasts thus highlight regions of potential future drainage reorganisation. In turn, similar anomaly values on both sides suggest stable divides. Also shown are locations of major fluvial to fluvioglacial deposits, see legend in (b) for colour-code. These deposits constitute important marker horizons for the past evolution of the drainage system. (b) Simplified comparison of partial longitudinal river profiles of the Rhine and Danube artificially connected along the black line between Immendingen and Schaffhausen in (a). The distance along the Rhine to the North Sea is remarkably shorter than the distance of the Danube to the Black Sea, resulting in a higher altitude of the Danube system. This difference resulted in a significant erosional pulse after capturing the Alpine-to-Danube River reaches and diverting them into the Rhine. The approximate position of the siting regions is indicated by the grey-coloured bars. The level of the Rhine is already clearly lowered at these positions (also visible from vertical the position of the fluvioglacial deposits) and is part of an equilibrated longitudinal profile, which suggests that the main pulse of the incision caused by the capture has already migrated through the Hochrhein and passed the repository sites.
On a more local scale, repeated drainage shifts were also observed during HT sediment accumulation. In an early phase, the higher Thur Valley drained via Stammheim, Schaffhausen and Klettgau towards Basel (northern HT occurrences), while the river’s course via Eglisau and Koblenz (southern HT occurrences) probably became established only after the penultimate (Beringen) glaciation (Fig. 6‑20; Graf 2009a). Clast provenance additionally provides evidence for an early drainage between Walensee and Klettgau (Graf 2009a). The vertical difference between the elevation of the deepest fluvial channel and the highest mapped gravel surface within the morphostratigraphic Hochterrasse unit can attain more than 100 m.
The lowest bedrock elevation attained prior to Hochterrasse deposition (e.g. Graf & Burkhalter 2016) is still considered the lowest regional level and constitutes the basis for the main reference used in evaluating future incision, the so-called local erosion base (see Section 6.4.1.1). Based on luminescence ages of the fluvial channel deposits, this depositional phase may fall within MIS 6 (onset ca. 190 ka ago, minimum age; e.g. Lowick et al. 2015).
No deeper vertical bedrock incision took place after MIS 6. The even younger Niederterrasse deposits were deposited onto the (partly incised) previous fill of Quaternary sediments or on bedrock at higher or approximately equal positions to the HT. In many places, these deposits are currently being incised by the Aare and Rhine Rivers and their tributaries (Fig. 6‑20), locally more than 30 m (Nagra 2024k). About 14 m of postglacial incision (post-Würm glaciation) into Niederterrasse sediments are observed in the southern Upper Rhine Graben (Hillebrand & Frings 2017).
Mean values of incision rates derived for bedrock incision after HDS or TDS deposition (base HDS or base TDS to local erosion base, respectively), ranged between ~ 0.1 and ~ 0.3 mm/yr (see Section 6.2.2 and Nagra 2024k). This is based on simplified assumptions: firstly, the elevation of base of the deposits (i.e. the bedrock elevation) is used, to address the net lowering of the local baselevel over time, independent of intermediate aggradation phases. Secondly, it is assumed that the age range reflects the deposition at a late stage, i.e. shortly before the subsequent incision. Combining an age derived from sediment deposits accumulated up to several tens of metres with the elevation of the bedrock marker below these sediments requires the third assumption: a "quasi-instantaneous" incision through the unconsolidated Quaternary deposits.
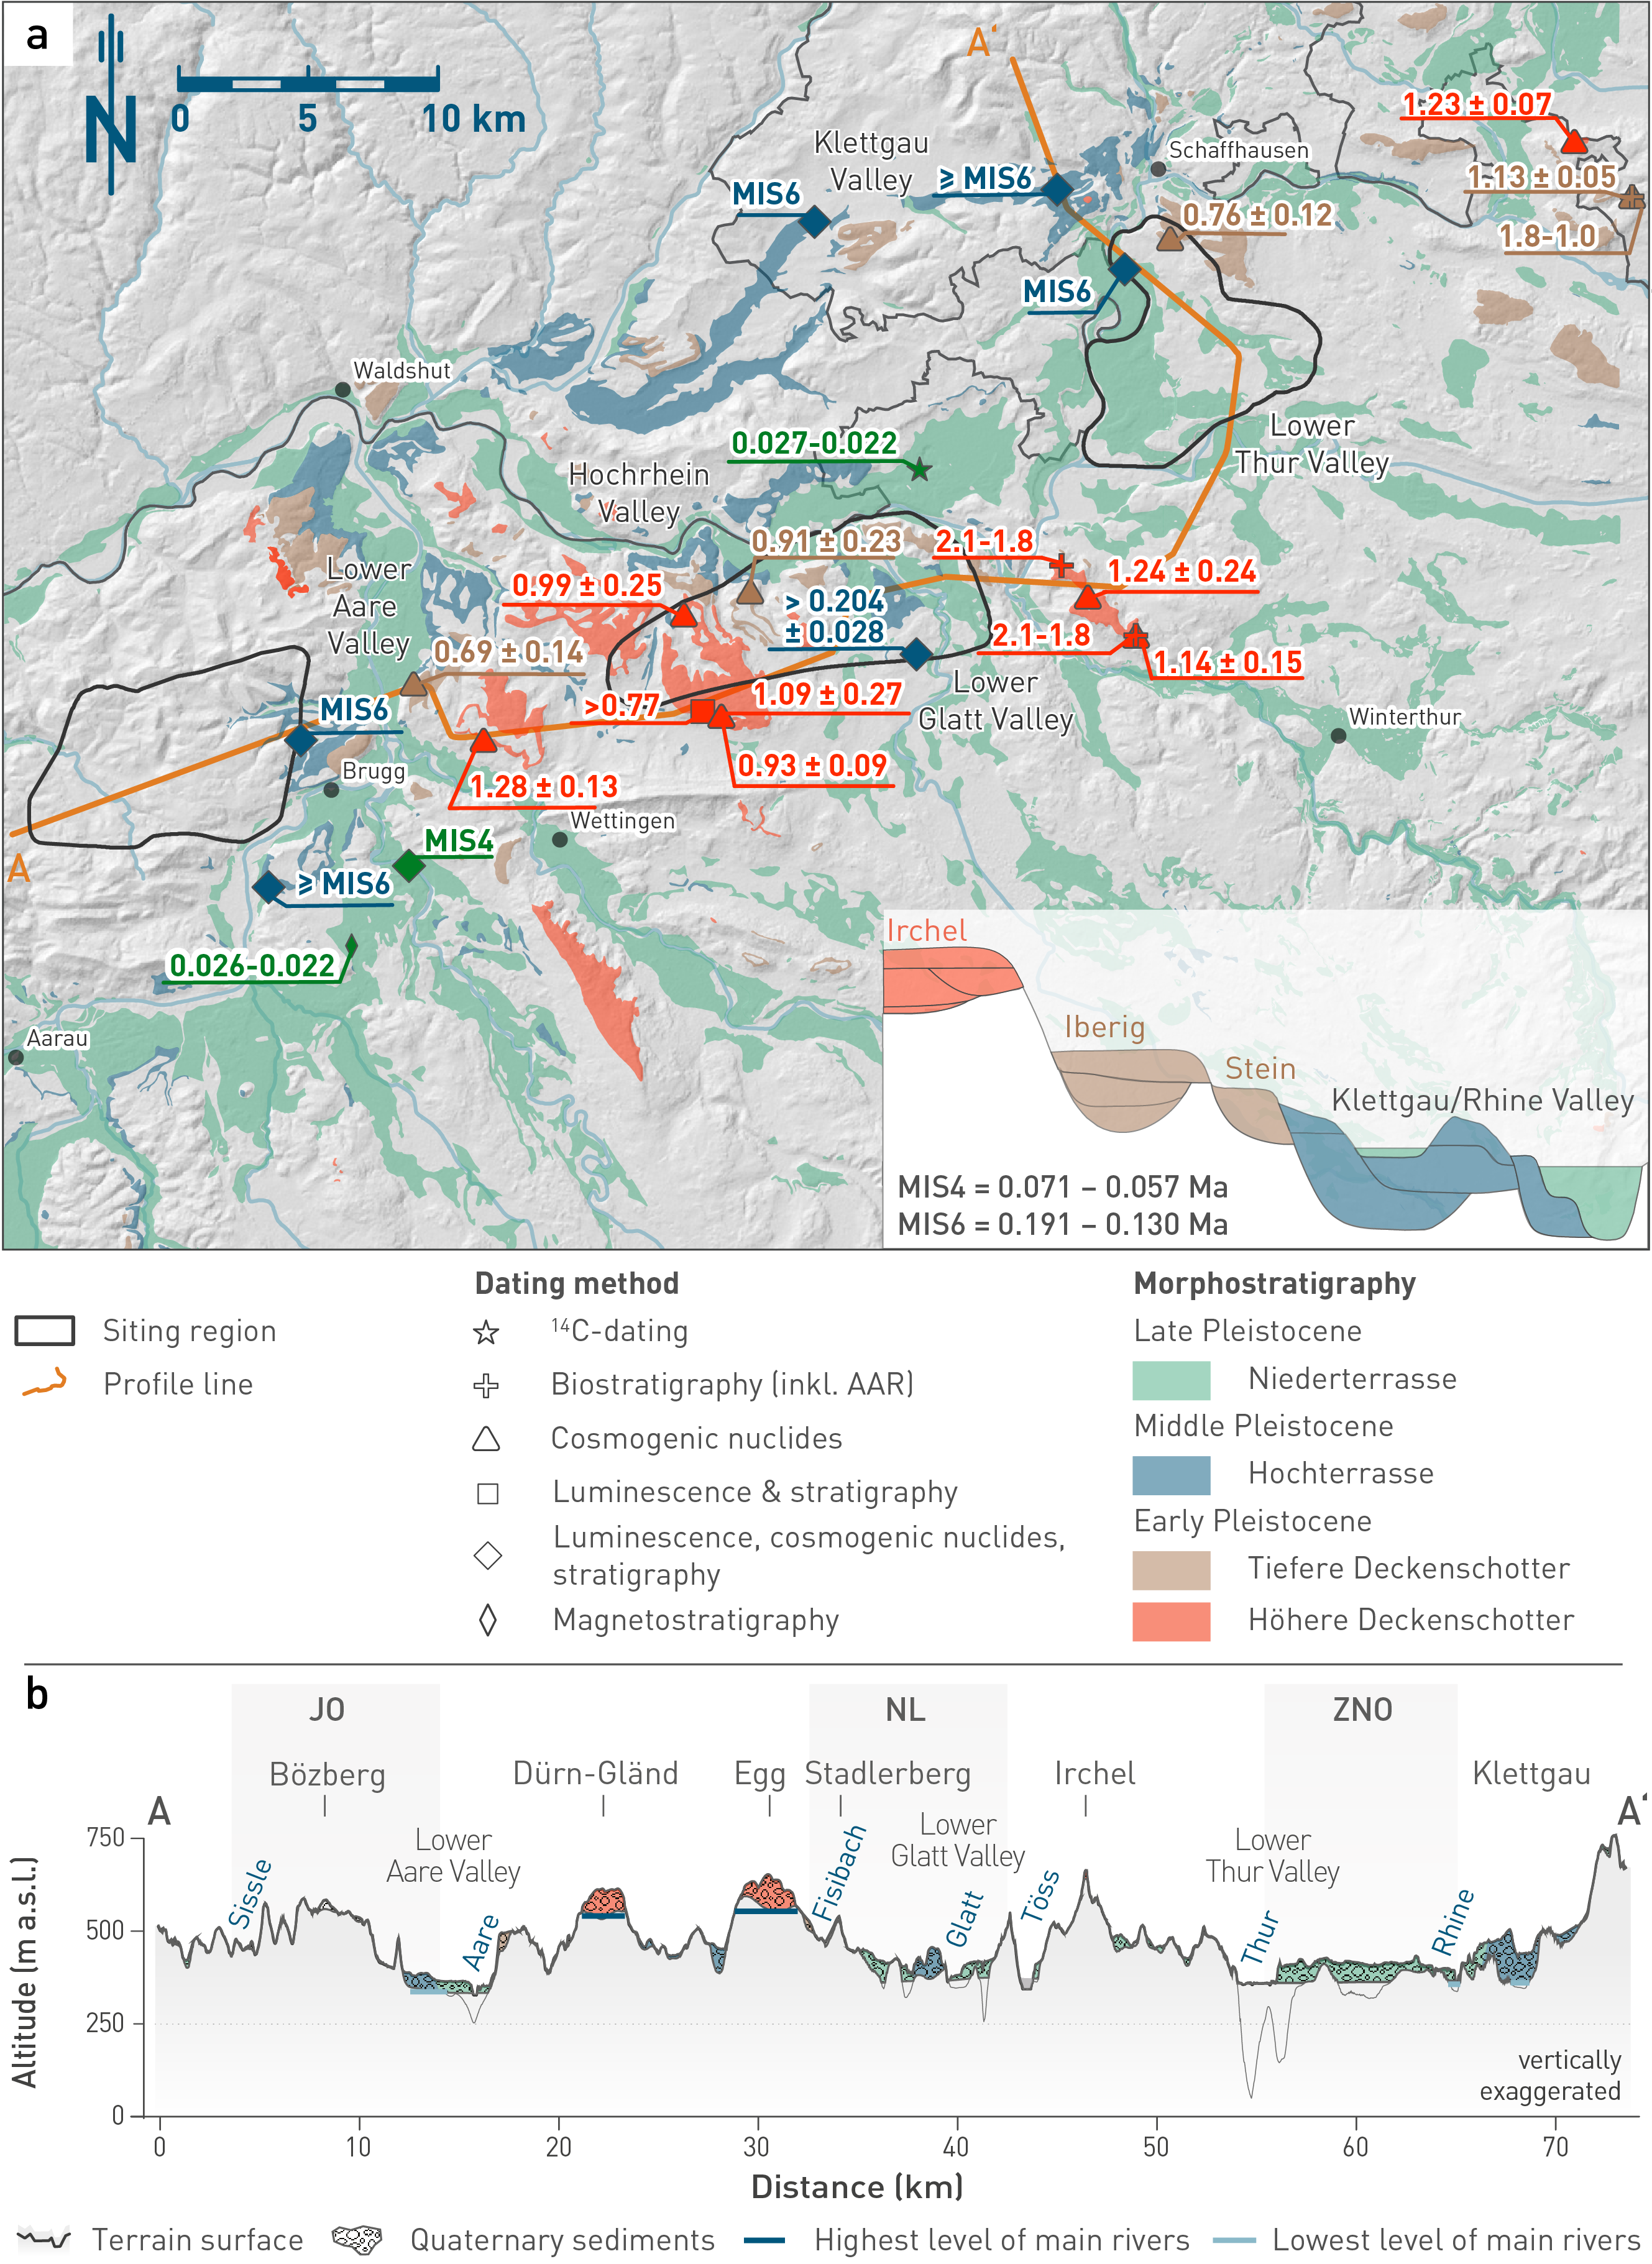
Fig. 6‑20:Morphostratigraphic units in Northern Switzerland with selected age information
(a) Ages are colour-coded according to the morphostratigraphic unit of the respective deposits and listed with symbols according to dating method: biostratigraphy (Thew et al. 2024), AAR (Penkman et al. 2024), magnetostratigraphy (Scheidt et al. 2023), luminescence & stratigraphy (Mueller et al. 2024, Gegg et al. 2023, Kamleitner et al. 2023, Gegg 2021, Mueller et al. 2020, Gaar et al. 2019, Buechi et al. 2017, Lowick et al. 2015, Reber et al. 2014, Dehnert et al. 2012), cosmogenic nuclides (Dieleman et al. 2022a, Grischott et al. 2020, Knudsen et al. 2020). Inset shows sketch of morphostratigraphic relationship with complex cut-and-fill sequences within each unit (based on Graf 2009a). (b) Simplified profile (see a for location) through the siting regions and crossing several Deckenschotter deposits. Note highest fluvial level (dark blue) and lowest level (light blue).
Lithological control
Generally, two main counteracting processes are important for bedrock incision: (1) the "tool effect" when bedload (the tools) is available to erode the bed by impact, abrasion, or quarrying, and (2) the "cover effect", when the riverbed is protected from erosion by a critical sediment cover (e.g. Turowski et al. 2007). Erodibility, which defines the rock resistance against erosion15, has an impact on sediment production and discharge, grain size, and bedload in the channel. The main influences on erodibility, in turn, are lithological contrasts, often defined by their rock compressive and tensile strengths (e.g. Fig. 6‑21a, c).
The lithologies that form the stratigraphic column in Northern Switzerland comprise variable degrees of rock resistance (erodibility) with respect to the influence of fluvial impact erosion, as determined by abrasion mill experiments (Fig. 6‑21b; Turowski et al. 2023). Resulting erosion rates derived from these experiments varied over about six orders of magnitude. Uncertainties scale with measured erosion rates.
Erosion rates measured on samples from the same lithostratigraphic unit revealed variability, most notably (for the given dataset) within the Lower Freshwater Molasse Group. Nevertheless, as expected, weakly consolidated sandstones or mudstones show the highest erosion rates and lowest tensile or compressive strength, and crystalline rocks such as granite tend to show the lowest erosion rates and highest tensile or compressive strength (Fig. 6‑21).
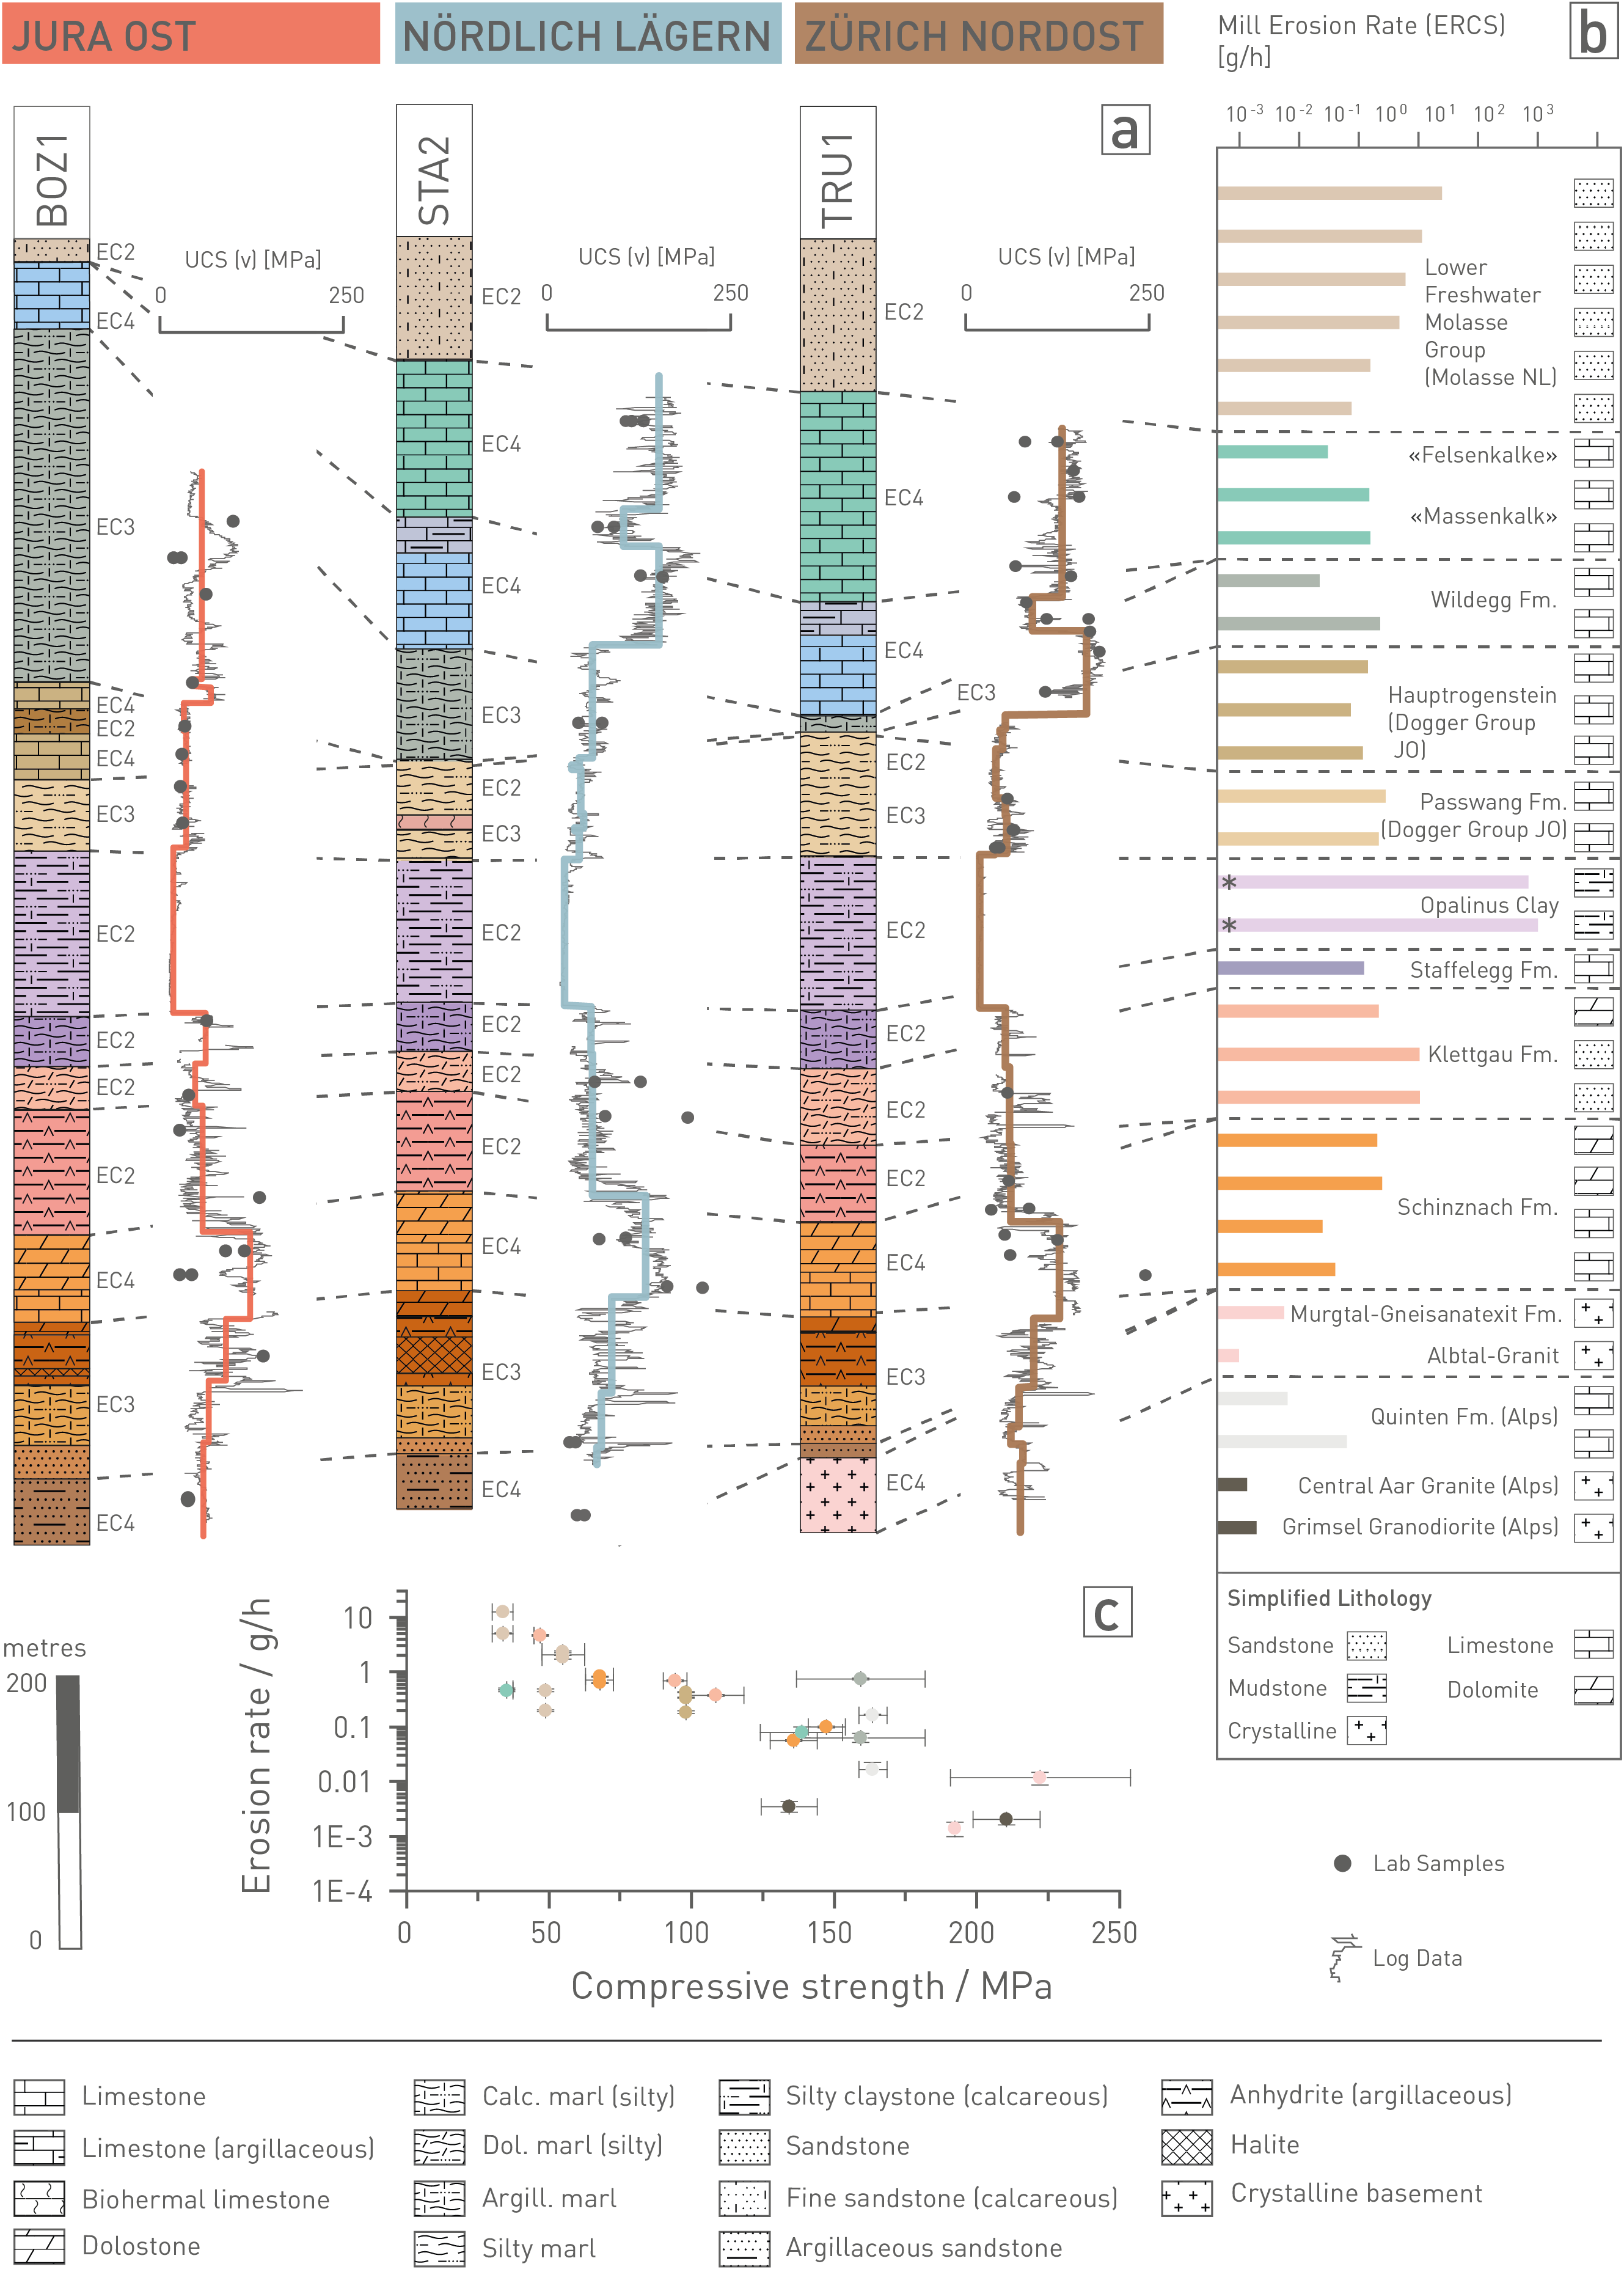
Fig. 6‑21:Unconfined compressive strength and abrasion mill erosion rates as quantitative indicators of bedrock erodibility
(a) Stratigraphic columns based on the BOZ1, STA2, and TRU1 boreholes with measured and estimated unconfined compressive strength (UCS) from selected deep boreholes in the three siting regions. Measured data points are based on core samples tested in the laboratory (Dossier IX in Nagra (ed.) 2022a, 2022c, 2021c). Continuous curves were approximated by combining the laboratory measurements with borehole log data from Nagra (2024m). Erodibility classes (EC) along the stratigraphic columns reflect the abstraction of the lithostratigraphic units as used for erodibility-related parameterisation in Model B of the erosion assessment model cascade described in Section 6.4.2.3 (Fig. 6‑29). Quaternary deposits (not displayed here) are assigned to EC 1. (b) Relative erodibility in fluvial impact erosion as represented by erosion rates from abrasion mill experiments (Turowski et al. 2023; see further details there). Measurements were conducted on intact rock samples in the laboratory (ERCS method = erosion rate from the concentration of solids), from lithostratigraphic units as labelled. Asterisks denote results for highly erodible Opalinus Clay samples, where deviations from the standard experimental procedure were necessary. Samples were collected from surface outcrops, except for the Opalinus Clay and Alpine crystalline rock samples that were taken from the FMT and GTS rock laboratories, respectively. Due to technical limitations, there is a sampling bias towards harder rock types. This is mostly important for more heterogeneous formations, where samples focus on the harder beds (e.g. cemented sandstone layers in the Molasse units and limestone layers within the Wildegg Formation). Note the simplified lithological classification. (c) Strong negative correlation between abrasion mill erosion rate and UCS is suggested by paired laboratory measurements by Turowski et al. (2023). Error bars are only discernible if larger than the data point symbols. Colours correspond to figure part (b). Note that data for the Opalinus Clay and the Passwang Formation from (b) are missing in (c) because of a lack of UCS measurements on these samples.
An impressive example of the effect of variable erodibility on a river’s longitudinal profile is the Rhine Falls knickpoint that is located within resistant limestones. However, besides the lithological contrast, the present-day incision efficiency needed to erode this knickpoint seems to be hampered by trapping of the Alpine sediments (i.e. the tools for efficient bedrock erosion) within large glacially overdeepened lakes, e.g. the Bodensee. Accordingly, a major control on the tool and cover effects and thus on the sediments and fluvial dynamics of Northern Switzerland is the glacial/interglacial cyclicity.
High erodibility corresponds to low rock resistance against erosion, and vice versa. ↩