
The short introduction to climate proxies on a global scale can be viewed as a general guideline to understanding the behaviour of climate and its potential impact at regional and local scales. On a local scale, climate is significantly influenced by e.g. local topographic conditions, distance to the ocean and poles and with respect to prevailing wind directions.
In Northern Switzerland, regional climatic conditions may have influenced the spatial and temporal evolution of foreland glaciations. Up to 15 Quaternary glaciations are assumed to have reached the foreland (Preusser et al. 2011, Ivy-Ochs et al. 2006). Of these, the potentially largest known may have occurred in the past ~ 800'000 years (see also Section 3.5, Section 6.4.1.4 and Fig. 6‑12; Preusser et al. 2011). The advance and retreat of glaciers and their maximum extents for the Birrfeld, Beringen, Habsburg and Möhlin Glacials (Fig. 6‑12) were reviewed by Preusser et al. (2011) and summarised in Nagra (2024k). The Möhlin Glacial is of particular interest because it reached the southern slopes of the Black Forest and is believed to be the most extensive glaciation (MEG) in the Swiss Alpine Foreland during the Quaternary (e.g. Graf 2009b). At that time, the different glaciers (Rhine, Linth, Reuss and Aare – Valais Glaciers) combined and formed a contiguous ice cover. Similarly, during the LGM, glaciers also reached far into the Alpine Foreland, forming a continuous ice cover but with a reduced north-western extent that was smaller compared to that during the MEG. Ice extents of the Habsburg, Beringen and Birrfeld Glacials were smaller than the Möhlin Glacial and, at least during the Habsburg and Birrfeld Glacials, the ice is not believed to have formed a contiguous ice cover (Preusser et al. 2011). The ZNO siting region and partly also NL were covered during LGM-size glaciations, while JO remained ice-free. NL was covered during the Beringen glacial. JO is only covered by exceptionally large foreland glaciations, such as the Möhlin Glacial (Fig. 6‑12) – these are considered key glacials in future erosion assessments.
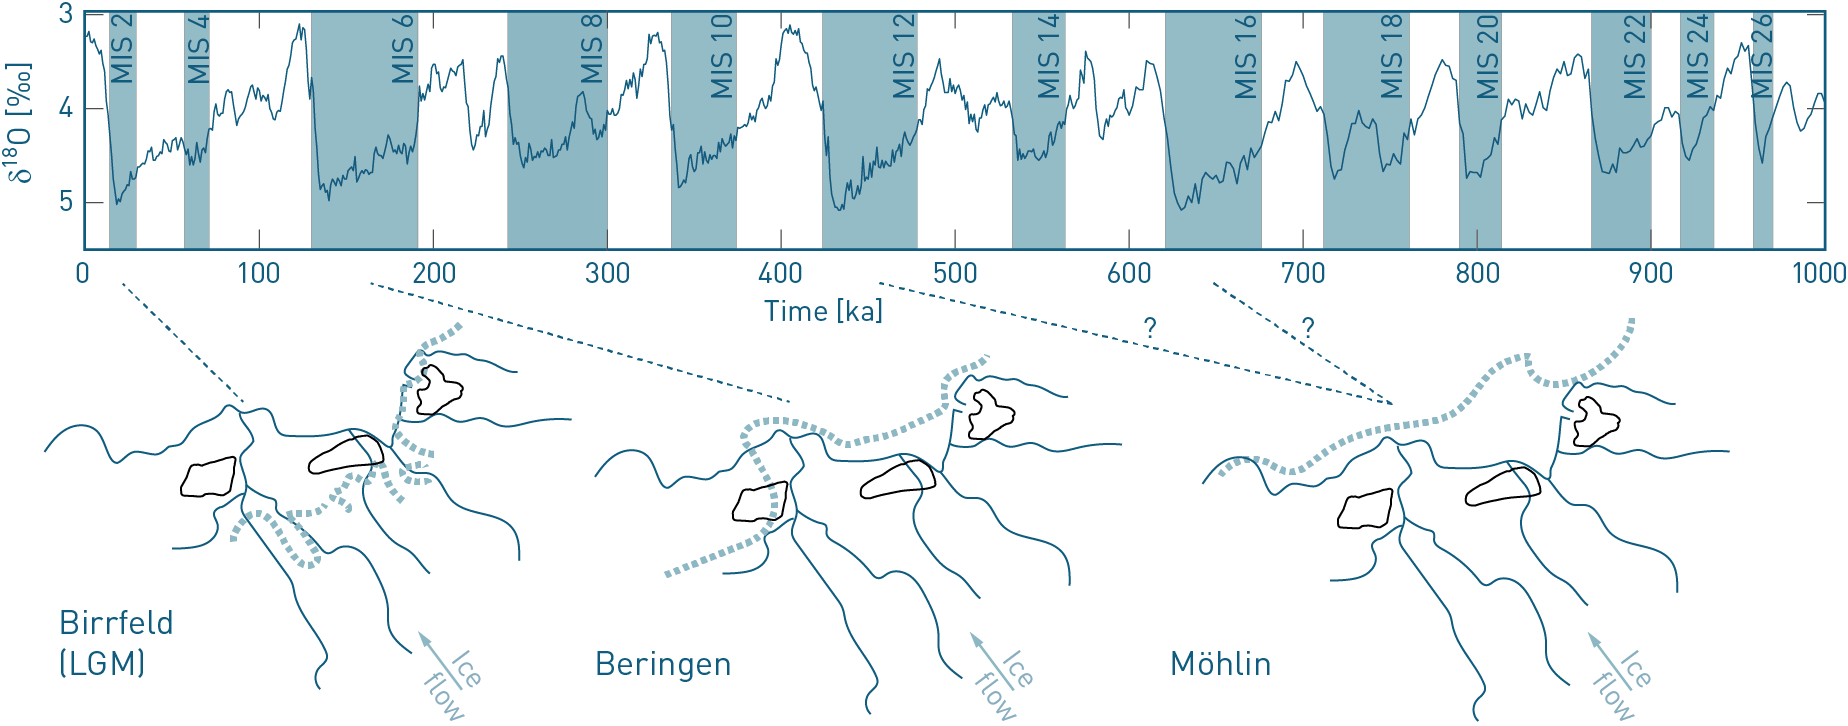
Fig. 6‑12:Key glacials in Northern Switzerland
Glacials (MIS) of the past million years are highlighted together with the key glacials of Northern Switzerland. Sketches show the inferred maximum ice extent (dashed lines) during these times, together with the present-day main rivers and outlines of the siting regions. Ice extent during the LGM covered ZNO and the easternmost parts of NL. The Beringen Glacial is probably associated with MIS 6 and covered ZNO, NL and the easternmost part of JO, and the presumably most extensive glaciation (MEG, Möhlin) covered all three siting regions and is probably associated with MIS 12 or MIS 16 (Preusser et al. 2011).
To understand the regional behaviour of climate and climate-related processes for a specific region of interest, information from local proxies is needed. Such data are often based on analyses of pollen records in (lake) sediments or on measurements such as the δ18O from dated speleothems (e.g. Luetscher et al. 2021). Proxy information for periods before the LGM is often sparse and more ambiguous but exists, for instance, from the Bergsee (Germany, e.g. Becker et al. 2006, Duprat‐Oualid et al. 2017, Kämpf et al. 2022), Wehntal (Switzerland; e.g. Anselmetti et al. 2010, Dehnert et al. 2012), la Grande Pile (France, e.g. Woillard 1979, Rousseau et al. 2007), and Füramoos (Germany, e.g. Bolland et al. 2022).
Davis et al. (2024) compiled a large number of available pollen data for the LGM, including the Alpine realm, and determined mean seasonal values for temperature and precipitation. Russo et al. (2024) compared these values to climate simulations shown in the following figures. Although the exact timing of events between pollen proxy data and climate simulations is difficult to determine, Russo et al. (2024) showed that climate simulations for the LGM are in good agreement with parameter estimations from regional data (see also Nagra 2024j for more detail).
Together with the results of the climate simulations of MIS 4, MIS 6, MIS 8, and MIS 16 and their respective differences, details on the modelling approach can be found in Nagra (2024j). Their comparison suggests that the interplay between mean temperature changes and precipitation changes as well as their seasonality and variabilities are important for the conditions that led to glacier advances into the Alpine Foreland of northeastern Switzerland. Below, illustrations of downscaled simulated climate conditions (temperature, precipitation, and climate classification) are presented for a comparison between pre-industrial (PI) and LGM conditions (Fig. 6‑13). These simulations were further used for the ice-flow modelling (Section 6.3.2). Similar maps for older MIS are documented in Nagra (2024j).
Under pre-industrial conditions (PI) (Fig. 6‑13c, d, g, h), a mean temperature of 8.3 °C (as averaged over 10 years in Switzerland) was simulated, which is slightly warmer, in particular during winter, than observations suggest. In this simulation, the difference in temperature between the coldest and the warmest month is 17.5 °C. The yearly mean precipitation is 4.39 mm/day, which is an overestimation compared to observations, again in particular in winter. The difference between the driest and the wettest month, a measure of the variability within a year, is 2.74 mm/day.
The simulated LGM (Fig. 6‑13e, f, i, j) is, on average, much colder than PI, leading to a mean temperature of only -1 °C with a reduced difference of 15.7 °C between the coldest and warmest month. It is also drier than PI, showing a mean precipitation of 3.35 mm/day and a slightly reduced difference in precipitation of 2.65 mm/day over northeastern Switzerland.
Climate classifications can be derived based on such simulations (Fig. 6‑13a and b). While, during the pre-industrial period, most of Switzerland experienced a temperate climate (except for the Alps), during the LGM most of Switzerland saw a polar climate (Fig. 6‑13b).
During the glacials, polar climates (with ice cover or tundra) were likely to have been most prominent in Switzerland. Very low temperatures during the glacials would also have caused extensive permafrost conditions. Permafrost refers to a condition where subsurface material remains at negative temperatures (frozen) throughout the year and often over very long periods of time (centuries, millennia and more). Permafrost exists today at cold high latitudes and high altitudes. The fact that deep-reaching permafrost during past glacials also existed in wide parts of the European lowlands was documented by the analysis of characteristic deformation features (ice wedge casts and other cryoturbation phenomena) caused by former deep-reaching frost action in unconsolidated sedimentary deposits (Poser 1948, Washburn 1979, Lindgren et al. 2016). During the coldest time intervals, permafrost north of the Alps was continuous, cold (mean annual surface temperature about -5 °C with shorter-term extremes down to -10 °C; Duprat‐Oualid 2019) and reached depths of about 100 to 200 m (Haeberli et al. 1984, Frenzel et al. 1992, Delisle et al. 2003).
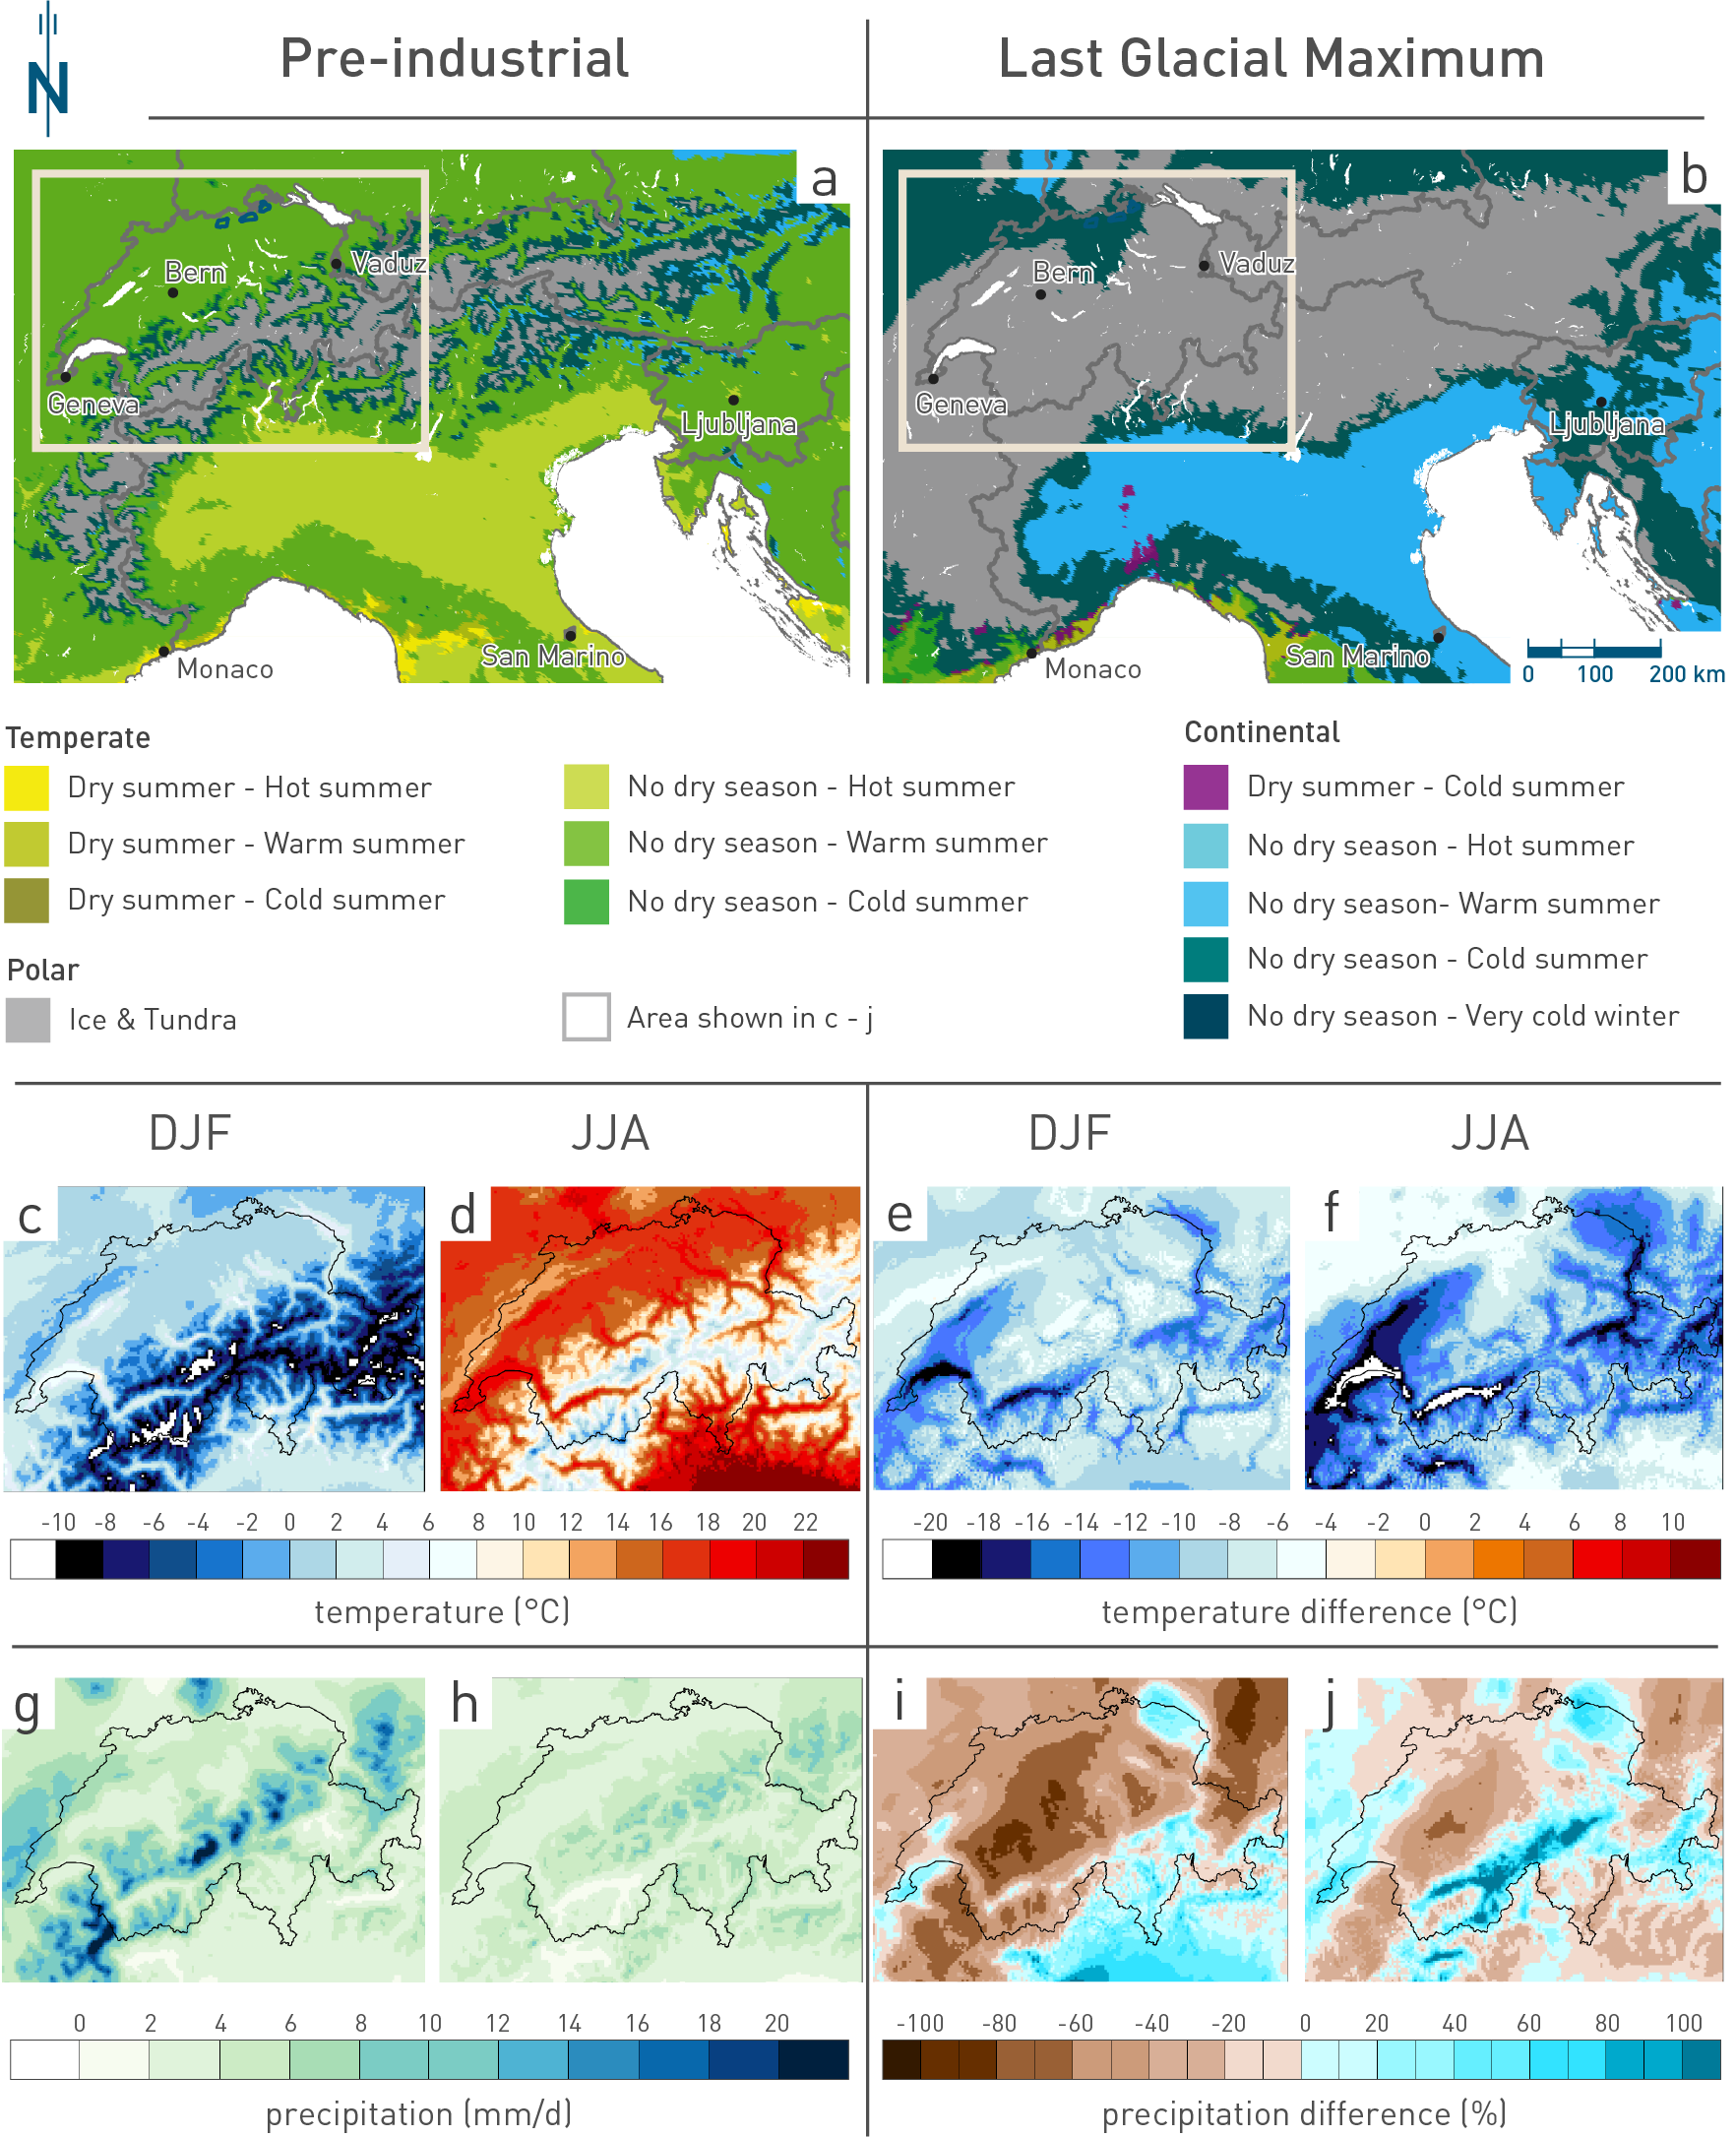
Fig. 6‑13:Temperature, precipitation and climate classification for pre-industrial and LGM climates
The upper panels (a) and (b) show climate conditions from simulations of the pre-industrial period and the LGM (MIS 2), respectively. The climate classifications follow the Köppen classification scheme (Köppen 1918, see Nagra 2024j for more simulations). Note the extent of the polar climate, especially in Northern Switzerland. Below, the figures show simulated mean temperatures for the pre-industrial period in °C for (c) December, January, February (DJF) and (d) June, July, August (JJA), followed by temperature simulation for LGM, visualised as the difference with respect to pre-industrial values in °C (e and f). (g) Simulated precipitation for the pre-industrial period (DJF) as absolute values in mm/day, (h) same as (g) but for period JJA; (i) simulated precipitation for LGM for the period DJF, visualised as the difference with respect to pre-industrial in %; (j) same as (i) but for period JJA.