
During the Quaternary Period, there have been multiple variations between cold and warm climates which gave rise to glacial and interglacial periods. During the glacial periods, ice sheets expanded across the globe, while interglacial periods reflect times of much-reduced ice-sheet extent. The glacial periods themselves comprise extremely cold intervals, known as stadials, and milder intervals that are referred to as interstadials.
These cycles of glacials and interglacial periods are commonly known as glacial cycles ("ice ages"). During at least the last ~ 700 kyr, i.e. after the Middle Pleistocene Transition, the glacial cycles lasted approximately 100 kyr (e.g. Clark et al. 2006).
Temperature-dependent O18/O16 isotopic ratios (δ18O) in, for example, calcitic foraminifera from marine sediments, are typically used to identify glacials and interglacials in the geological record. Because foraminifera are in isotopic equilibrium with ocean water, δ18O variations mainly reflect sea level (and hence global ice volume) and (water-) temperature if δ18O records from different locations are combined (e.g. Ahn et al. 2017). Because of its higher vapour pressure, the H2O16 molecule evaporates preferentially from the ocean surface. In the case of cold temperatures and expanding global ice, this results in seawater, which is residually enriched in 18O. Conversely, lower δ18O values typically correspond to warmer periods with a reduced ice volume.
Lisiecki & Raymo (2005) combined δ18O values from 57 globally distributed sites into the LR04 stack database. From this record, marine isotope stages (MIS) were defined for the past 5.3 Myr. Even-numbered stages represent glacials, while odd numbers refer to interglacials (Fig. 6‑11c, see Fig. 3‑11 for a longer record).
Another important proxy of past global climate evolution is the greenhouse gas concentration, mainly CO2, which can be measured from air trapped in gaseous bubbles in ice cores. Variation in CO2 has been described for the last 800 kyr in ice cores from Antarctica (Vostok and EPICA; see Lüthi et al. 2008 and references therein). As well as greenhouse gas concentrations, orbital parameter variations have been proposed to be significant drivers for the change from glacials to interglacials (Ruddiman 2003). Since the early studies by Milankovitch in the 1920s, the orbital parameters of precession, eccentricity and axial tilt can be calculated accurately for the past and future and document changed cyclical orientations of the Earth towards the sun through time (Milankovitch 1941, Berger 1977, Roe 2006) and thus, the energy received by the Earth’s surface (insolation).
Fig. 6‑11 shows the measured δ18O concentration from microorganisms in deep-sea sediments together with insolation (based on orbital parameters of the Earth), global mean temperature difference, CO2 content and the estimated global ice volume for part of the Quaternary. The results show that CO2 concentrations ranged between 300 ppm and 170 ppm during the last 800 kyr and correlate well with the MIS determined from the LR04 stack (Fig. 6‑11). In general, high insolation correlates with warm periods, while low insolation values correlate with colder periods.
Currently, the Earth is in a relatively warm period (MIS 1). MIS 1 started approximately 14'000 years ago and has continued until today (Walker et al. 2009). It began with a gradual warming from the last glacial period, MIS 2, which lasted from 29'000 to 14'000 yr ago (Lisiecki & Raymo 2005). The Last Glacial Maximum (LGM, ~ 24'000 yr ago) is the term used to describe the most recent substantial ice sheets covering North America, Europe and Asia that caused global sea levels to fall by about 120 m (Clark et al. 2009). Shifts between glacial and interglacial periods were rapid, occurring within a few thousand years (Clark et al. 2007).
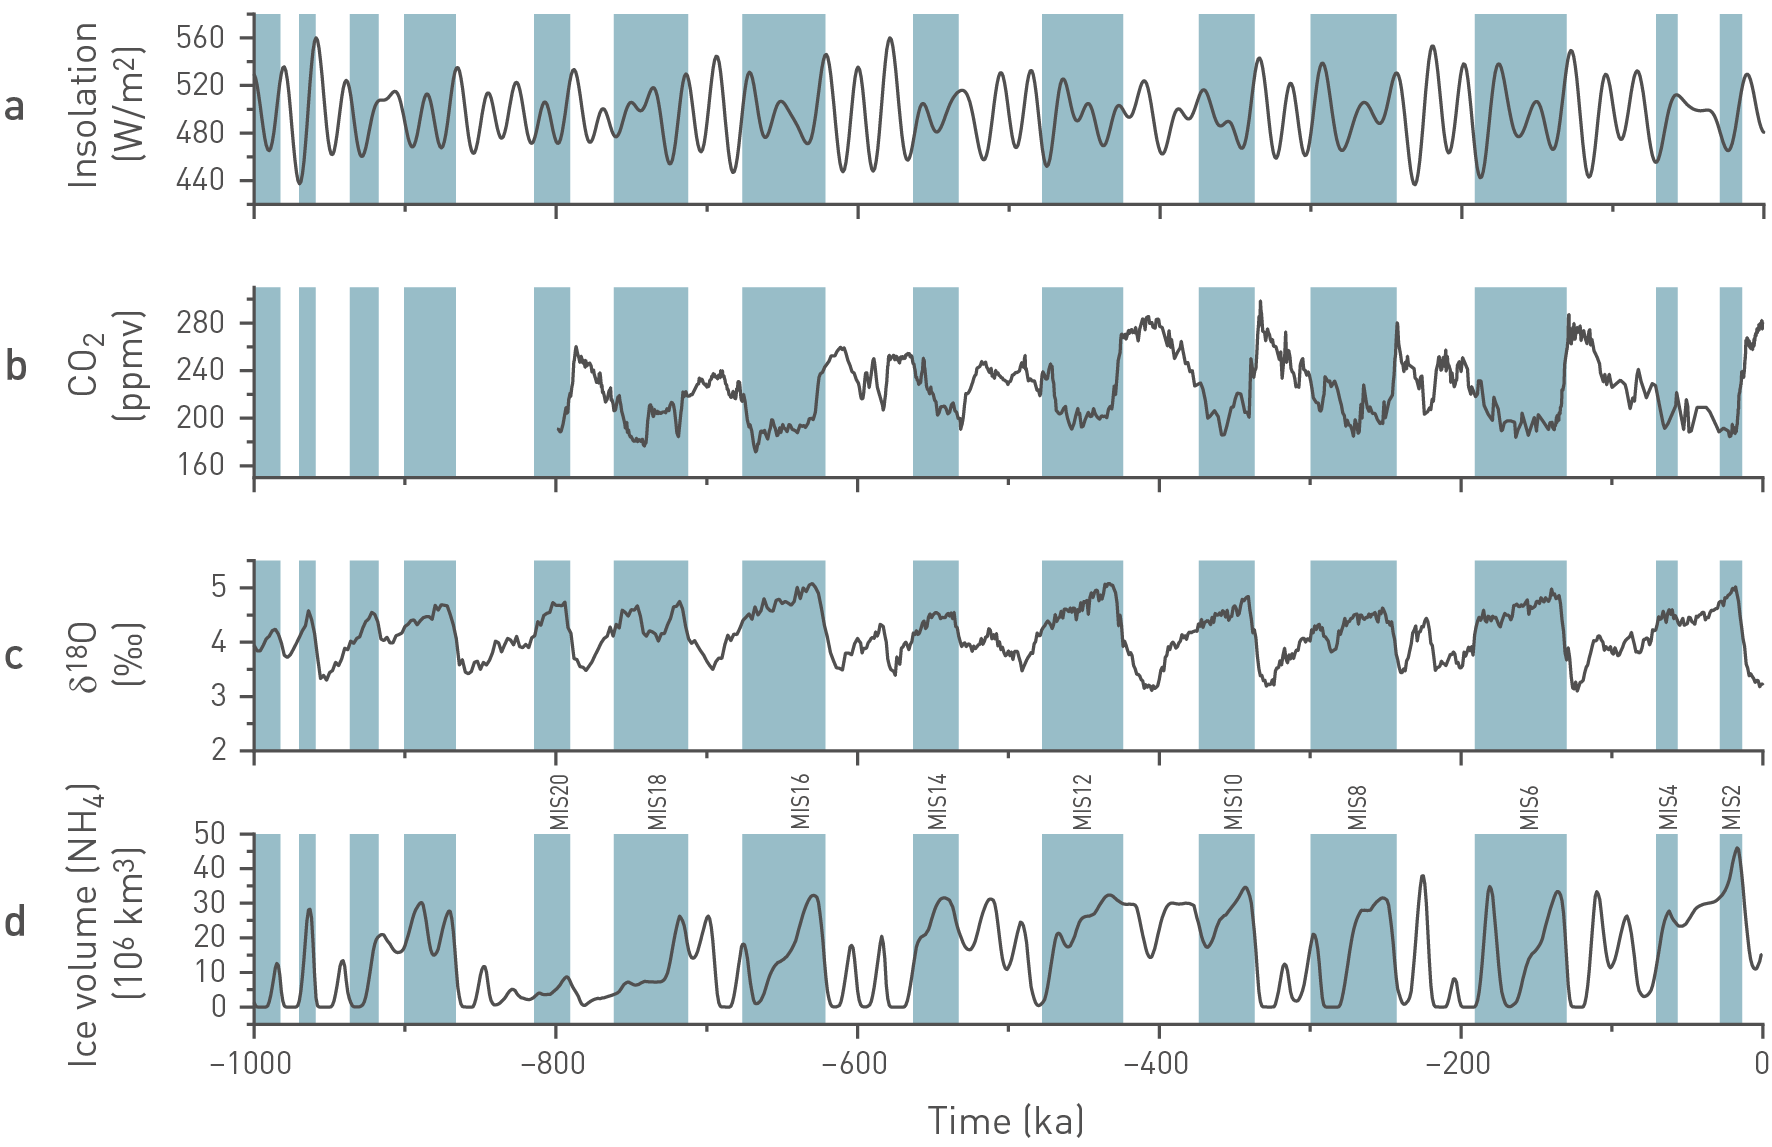
Fig. 6‑11:Comparison of climate proxies for the northern hemisphere during the last million years
(a) Insolation is given for 65°N (July) according to Berger & Loutre (1991). (b) The CO2 content follows the determinations from Lüthi et al. (2008) and is based on measurements from the EPICA ice core in Antarctica. (c) δ18O was determined from 57 globally distributed benthic records, collected from the scientific literature (Lisiecki & Raymo 2005). (d) δ18O was used to calculate a rough estimate of the northern hemisphere ice volume. Blue bars depict even-numbered MIS (periods of glaciations), white sectors correspond to interglacial stages.