
In this section, the regional geodynamic setting is reviewed with respect to its influence on erosion processes. Beyond the North Alpine Foreland, this primarily considers fluvial incision by the Rhine River system from source to sink. Here, it is considered how rates of deformation (mainly vertical motion) have driven baselevel changes of the Rhine on timescales similar to the future one million years. This information is important to assess future fluvial incision, as rock uplift is expected to exert a first-order control.
The Aare – Rhine River system hydrologically connects the Alps with the North Sea as the final baselevel (Fig. 6‑4a). From source-to-sink, the Rhine crosses several tectonic domains that may influence erosion (Fig. 6‑4b and Fig. 6‑5). The siting regions are located along the Hochrhein section, between the Bodensee and Upper Rhine Graben (Fig. 6‑4a).
The main neotectonic influence on erosion in Northern Switzerland are Alpine uplift, transtensional deformation in the Upper Rhine Graben and potential low-level movements of the Jura Fold-and-Thrust Belt and the Bodensee – Hegau Graben (see Section 6.2.3). Together these define the regional tectonic setting for fluvial erosion processes associated with rock uplift and baselevel drop.
Fluvial incision and erosion in Northern Switzerland are also influenced by far-field uplift of the Eifel area and the Rhenish Massif (Fig. 6‑3b, Fig. 6‑4, Fig. 6‑5). The latter represents a regional intermediate baselevel of the Rhine. As long as the area continues uplifting, it is not expected that processes related to sea level changes will affect the siting regions on the relevant timescale of one million years. The main tectonic domains that are located between the Rhenish Massif and the Alpine Foreland, which control stream profile evolution of the Rhine River, are summarised below, starting at the relevant downstream locations (see Nagra 2024k for more detail).
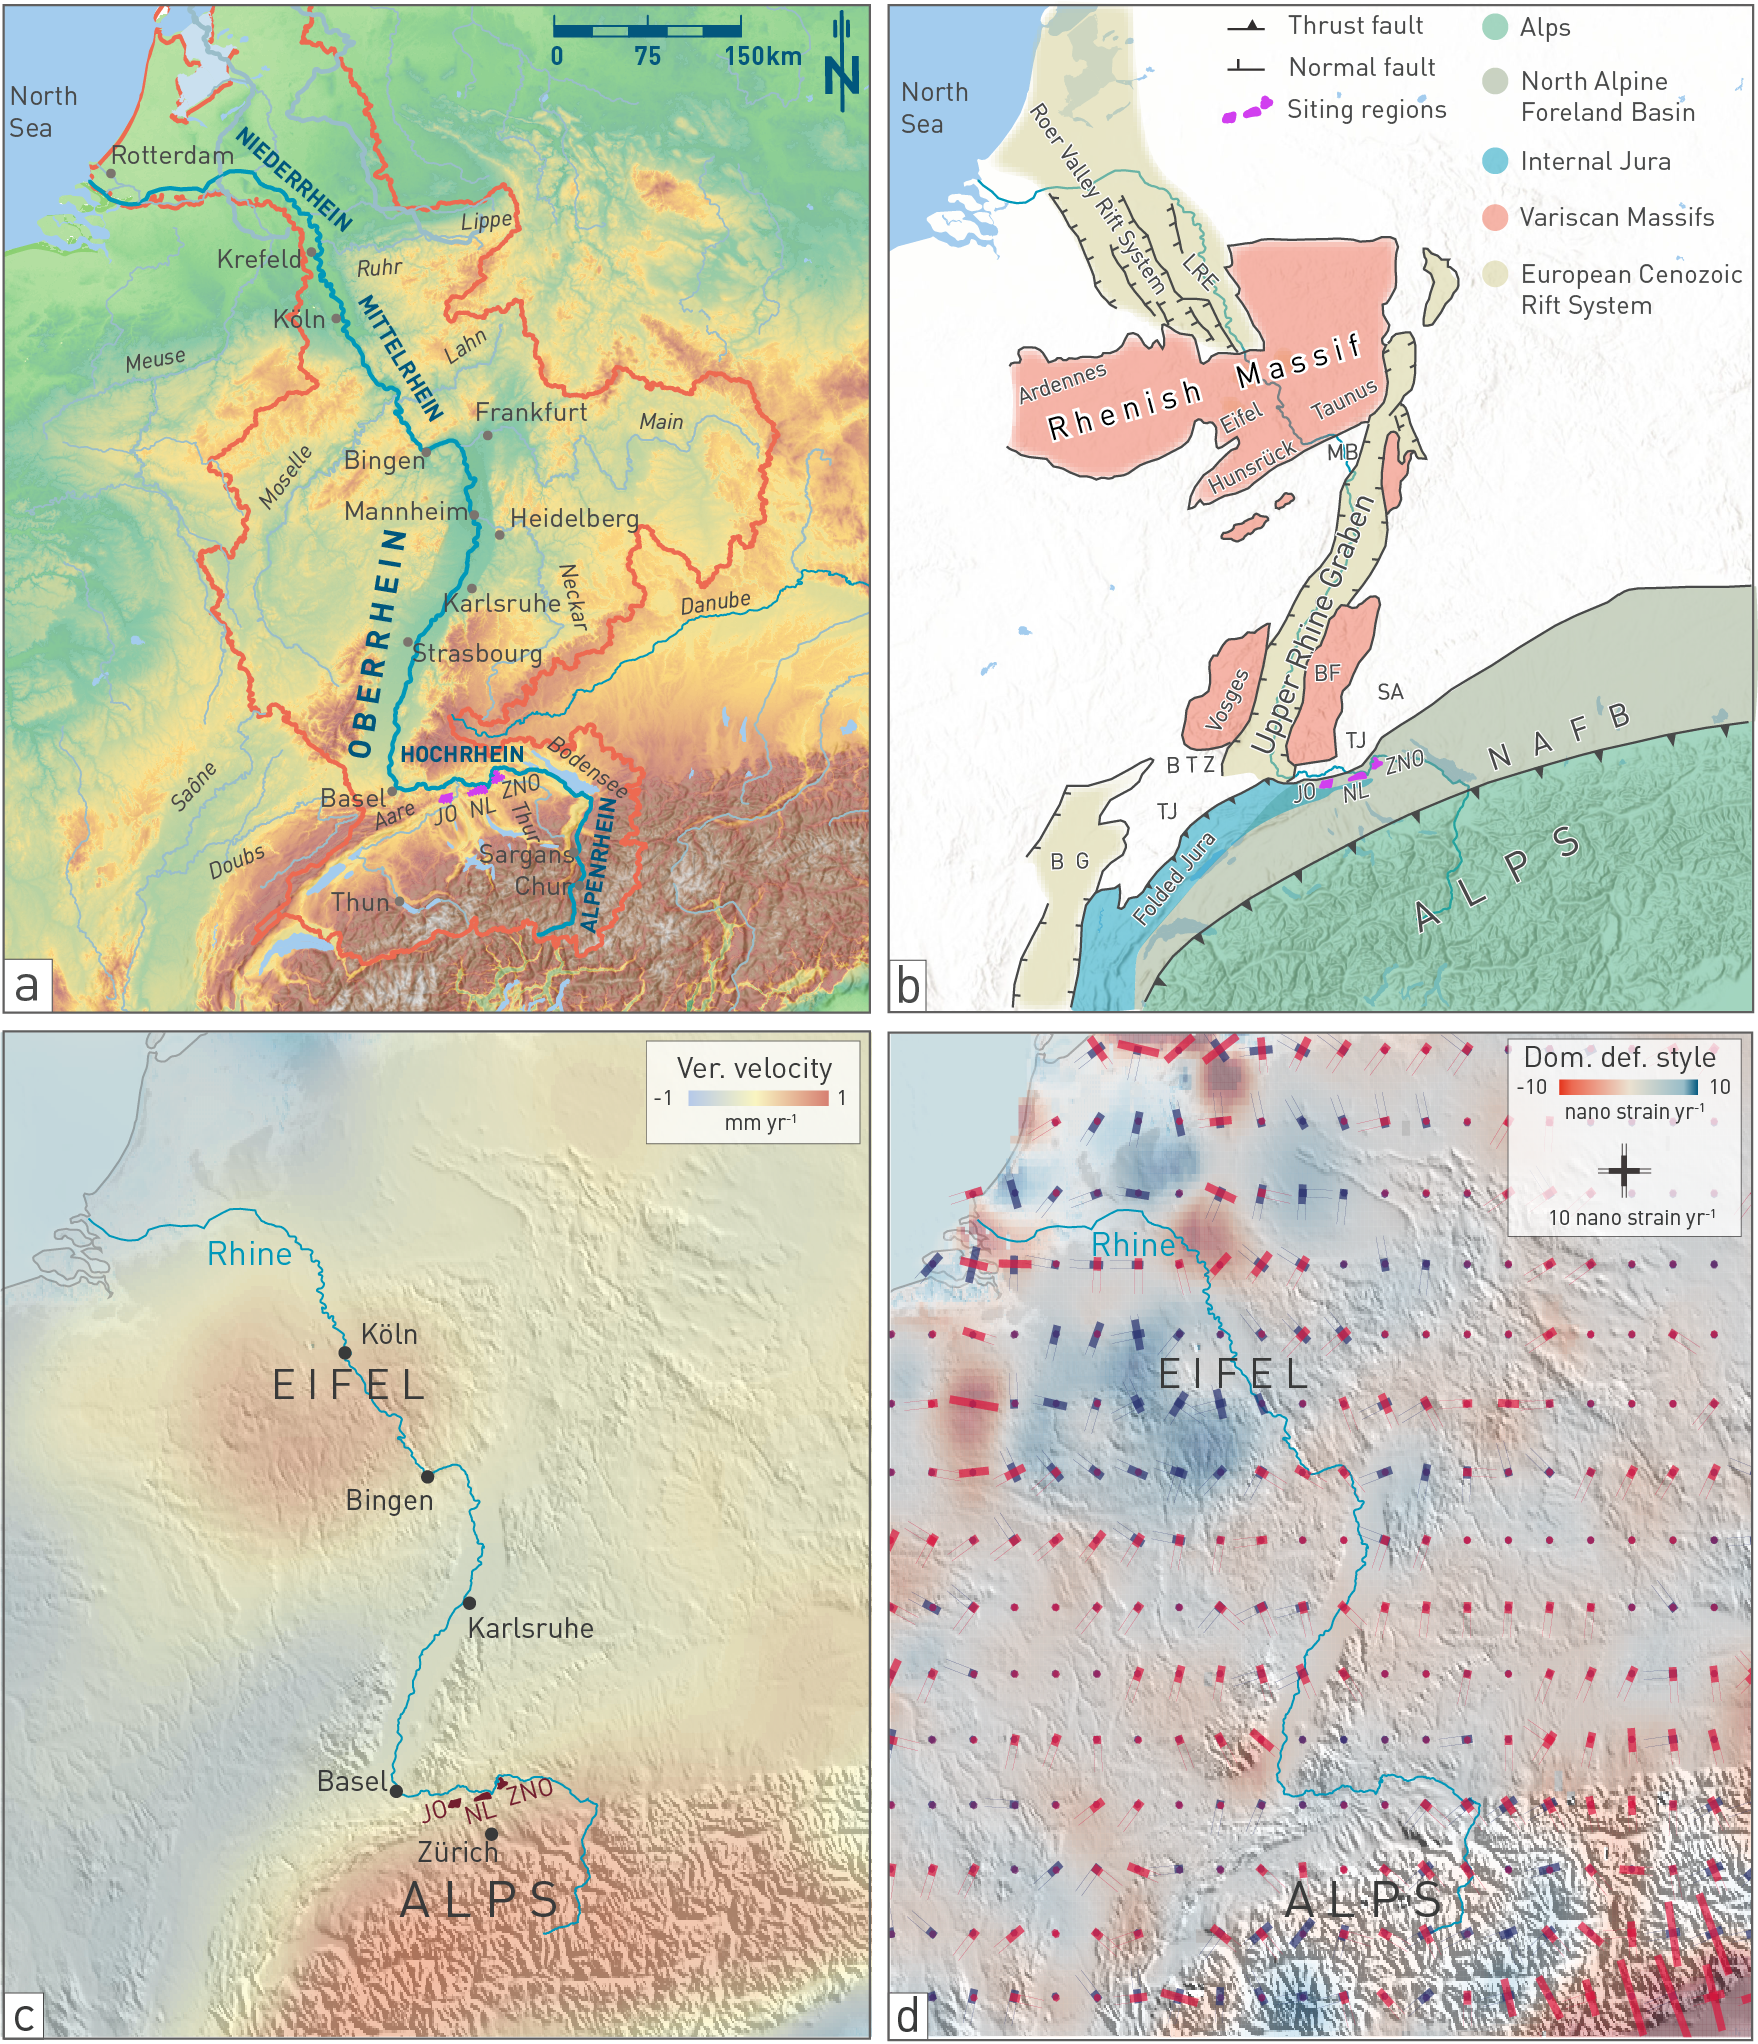
Fig. 6‑4:Present-day Rhine catchment in a morphotectonic and geodynamic context for fluvial incision and sediment accumulation
(a) Rhine catchment (b) Morphotectonic domains. The course of the Rhine River is highlighted with dark blue line. BF: Black Forest, BG: Bresse Graben, BTZ: Bresse Transfer Zone, TJ: Tabular Jura, LRE: Lower Rhine Embayment, MB: Mainz Basin, NAFB: North Alpine Foreland basin, SA: Swabian Alb. Data source: EU-DEM (European Environment Agency), rivers based on European Environment Agency (2020), https://land.copernicus.eu/en/products/eu-hydro/eu-hydro-river-network-database. c) Geodetic velocities (redrawn from Piña‐Valdés et al. 2022). Vertical motion relative to stable Europe is highlighted by red and blue colours (uplift and subsidence, respectively). The Alps and the Eifel area are prominent uplift regions that influence the profile of the Rhine River. (d) Strain rates (redrawn from Piña‐Valdés et al. 2022) with red pins showing contraction and blue pins showing extension) are generally low within the Alpine Foreland.
Rhenish Massif, Upper Rhine Graben and Vosges and Black Forest Massifs
The Rhenish Massif represents an actively uplifting region, which is coincident with bedrock incision of the Rhine River (Mittelrhein, see Fig. 6‑4 and Fig. 6‑5). It has been uplifting since at least Oligocene times (Illies & Greiner 1979, Illies et al. 1979, Garcia-Castellanos et al. 2000, Ziegler & Dèzes 2005, 2007). Extensive volcanism in the area, spanning from the Oligocene (Westerwald) until the Late Quaternary (East and West Eifel; Schmincke 2007), is closely connected with asthenospheric upwelling associated with a plume (Ritter & Christensen 2007). Staircase river terraces document incision that has apparently accelerated since the Pliocene (Fuchs et al. 1983) or the latest Early to Middle Pleistocene (Meyer & Stets 1998), with the greatest amount of incision (up to 250 m) achieved during the past 880 kyr. While the aforementioned authors interpret the incision to be a response to uplift only, Demoulin & Hallot (2009) suggest that part of the total incision might be related to knickpoint retreat in tributaries rather than tectonic deformation. If correct, this process may reduce the total uplift to 140 m, yielding a Quaternary long-term uplift rate (since ~ 880 ka) of ~ 0.2 mm/yr (Demoulin & Hallot 2009). GNSS data of the Eifel area indicate an overall present-day uplift in the order of 0.5 – 1 mm/yr (Fig. 6‑4c), which is likely related to mantle activity (Piña‐Valdés et al. 2022, Henrion et al. 2020). Combined, these data suggest long-term and ongoing uplift of the Rhenish Massif – Eifel area at amounts that exceed eustatic sea-level changes. It is reasonable to assume that these processes will continue in the future. Under this assumption, the Mittelrhein section (Fig. 6‑4a) would constitute an intermediate baselevel for the longitudinal profile of the Rhine.
The Upper Rhine Graben is part of the European Cenozoic Rift System (ECRIS). It is bordered to the northwest by the uplifting Rhenish Massif, to the south by the Jura Fold-and-Thrust-Belt, by the Vosges Mountains in the west and the Black Forest in the east (Fig. 6‑4 and Fig. 6‑5). Here, the Rhine (Oberrhein) drains a tectonic domain characterised by long-term intermittent subsidence, accompanied by erosion of the uplifting rift shoulders.
The present-day depositional centres (the northern, very deep Heidelberg Basin and the southern, less deep Geisswasser Basin) were established at least during the Pliocene – Quaternary. At this time, the central part of the Upper Rhine Graben was located in a restraining bend (Schumacher 2002) explaining the low subsidence and low sedimentation observed in this area (Karlsruher Swell; e.g. Gabriel et al. 2013, Edel et al. 2007, Hagedorn & Boenigk 2008, Rotstein & Schaming 2011). Importantly, the contrasting subsidence rates between Karlsruher Swell and Geisswasser Basin are expected to flatten the Oberrhein profile, leading to further deposition upstream. The Karlsruher Swell thus represents a buffer against increased incision. Quaternary subsidence rates are in the order of 0.1 – 0.3 mm/yr, increasing substantially towards the northern Upper Rhine Graben (Berger et al. 2005, Hagedorn & Boenigk 2008, Peters & van Balen 2007, Preusser et al. 2021).
Based on precise levelling data, Fuhrmann et al. (2014) inferred that the Upper Rhine Graben is mainly subsiding at rates between ‑0.2 and -0.5 mm/yr, which they attributed mainly to a combination of tectonic subsidence and sedimentary load (e.g. compaction and isostatic effects). This pattern is contemporaneous to slight uplift of up to 0.3 mm/yr of the graben shoulders at Black Forest and Vosges Massifs (relative to a reference point at the location of Freudenstadt in the eastern Black Forest Massif).
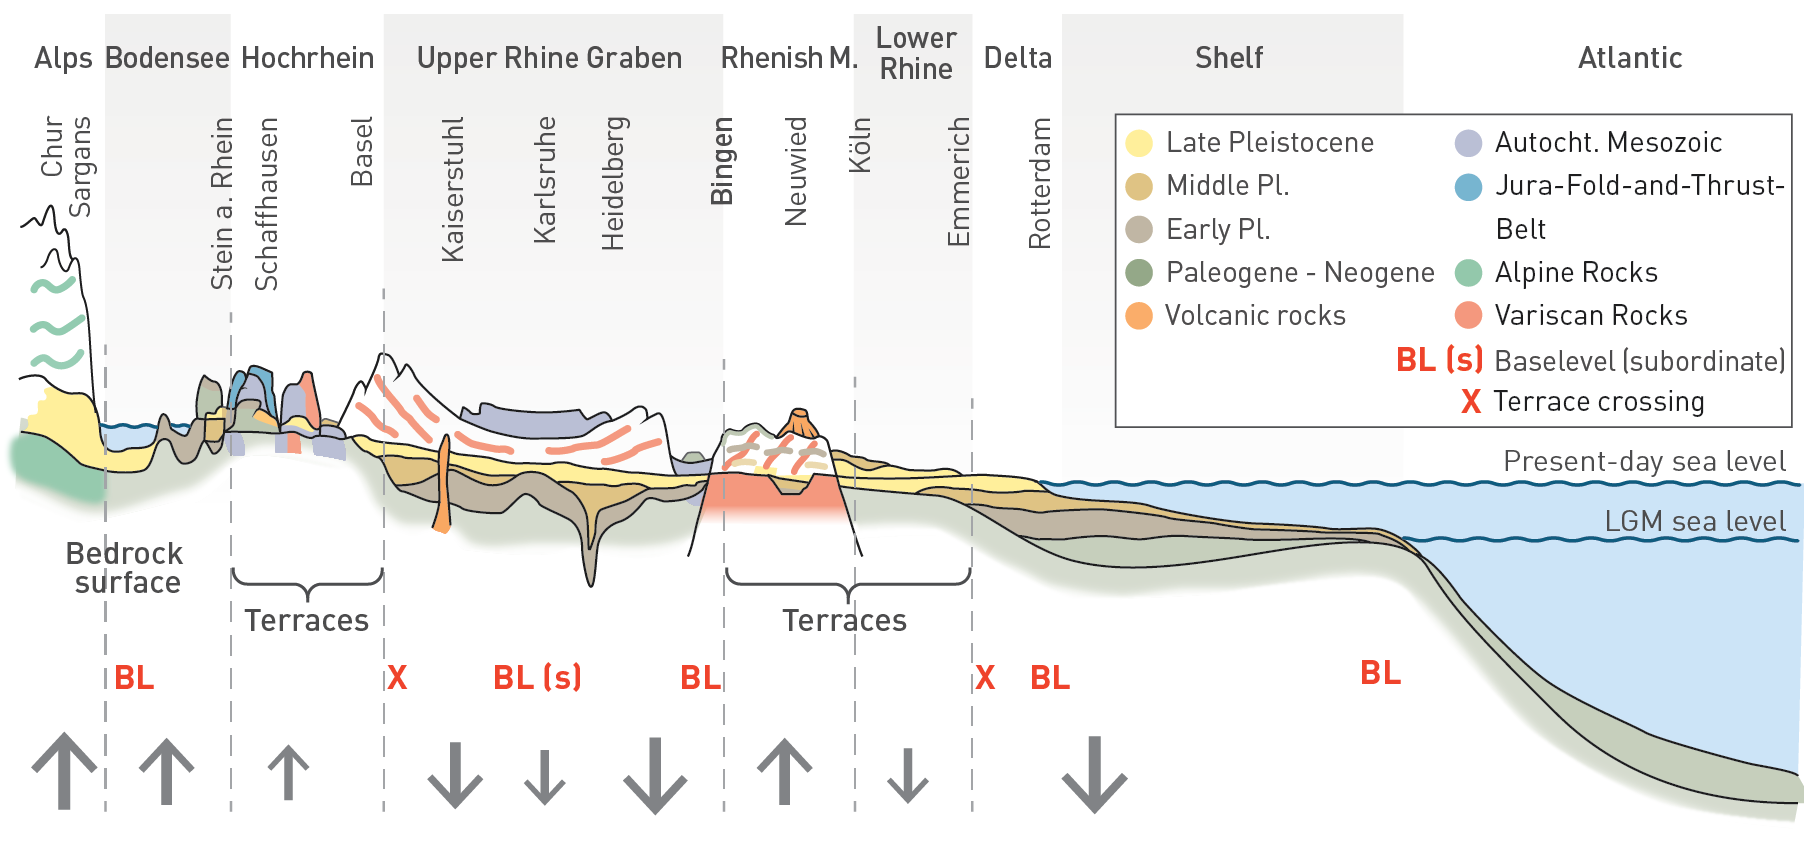
Fig. 6‑5:Sketch of the Rhine River course with domains of Quaternary vertical motion
Schematic river course with simplified general geology, occurrence of fluvial terraces and location of terrace crossings, (intermediate) baselevels of regional relevance, and variability of sea level. Not to scale, after Neeb in Hinderer (2005) and Hinderer (2012). Tectonically driven rock uplift and basin subsidence (qualitatively marked by the grey arrows) influence the pattern and rates of fluvial incision along the Rhine. Northern Switzerland is mainly influenced by North Alpine Foreland rock uplift, subsidence of the Upper Rhine Graben, and rock uplift of the Rhenish Massif. Figure draft courtesy of H.A. Kemna.
North Alpine Foreland
The dominance of Alpine-related uplift (including tectonic and isostasy-driven processes) within the North Alpine Foreland results in a general surface uplift gradient oriented perpendicular to the Alpine front with rates that decline towards NNW (Fig. 6‑6; Champagnac et al. 2009, Mey et al. 2016). This trend is also revealed by long-term thermochronology data (Fox et al. 2016), basin-wide erosion rates (Wittmann et al. 2007, Delunel et al. 2020) and measurements of present-day vertical motion (GNSS, precise levelling, e.g. Schlatter 2013, Nagra 2024l). The roughly north-south trend is also reflected by the principal flow direction of the larger rivers traversing Northern Switzerland, which suggests a long-term tectonic control on the geomorphic characteristics of this region.
Northern Switzerland is influenced by glacial/interglacial cycles with growth and decay of the Alpine Ice Field, including a number of large foreland glaciations (Section 3.5, Section 6.3; Nagra 2024j). Accordingly, Northern Switzerland is expected to undergo glacial isostatic adjustment (GIA), which affects the temporal and spatial uplift distribution (e.g. Craig et al. 2016). From studies related to large continental ice shields, it is known that GIA-related uplift after the Last Glacial Maximum (LGM) deglaciation shows a quasi-exponential form with fast and high-rate uplift shortly after deglaciation and continuously decreasing rates (see for instance Turcotte & Schubert 2014). A GIA effect might be still detectable in the Alpine Foreland, albeit to a lesser extent than in the Alps or in areas of large continental ice shields because of thinner ice and shorter duration of glaciation (see Section 6.3.2 and Nagra 2024j).
Long-term uplift proxies in Northern Switzerland (based on exhumation and incision rates)
Using exhumation or fluvial incision rates as proxy for rock uplift (which is the most important input parameter for the assessment of future erosion) is a simplification that requires the assumption of steady-state topography. Nevertheless, it allows a valuable first-order uplift estimate on long timescales, when short-term fluctuations level out. However, because of the complexities in tectonically active regions and the influence of climate fluctuations, this assumption needs to be treated with caution.
Past exhumation of the Molasse Basin is summarised in Section 4.3.5 and Chapter 3. Here the focus is on the second exhumation phase, which resulted in the present-day configuration. The amount of Miocene/Pliocene exhumation is generally estimated around 1 km (e.g. Mazurek et al. 2006, Villagómez Díaz et al. 2021, Omodeo-Salé et al. 2021, Schegg & Leu 1998). However, the timing of onset of exhumation is debated, with estimations ranging between 12 Ma and 5 Ma (von Hagke et al. 2015, Looser 2022, Mazurek et al. 2006, Villagómez Díaz et al. 2021). Under the simplest assumption of linear exhumation, inferred exhumation rates range between ~ 0.08 mm/yr and 0.20 mm/yr. However, it should be noted that several studies indicate heterogeneous exhumation rates in the past ~ 10 Myr.
Bedrock incision rates based on Quaternary geomorphic markers that are often used as proxy for rock uplift cannot be directly converted in Northern Switzerland. Here, effects of exhumation are complicated by the impact of baselevel lowering resulting from changes in drainage routing (see Sections 3.5 and 6.4.1.2). Nevertheless, a first-order assessment of bedrock incision can be calculated from bedrock elevation changes and the age of the Deckenschotter sediments (see Chapter 3 and Fig. 6‑6c to e). Mean ages of 1.38 ± 0.31 Ma and 0.9 ± 0.13 Ma were assumed for the Höhere Deckenschotter (HDS) and Tiefere Deckenschotter (TDS), respectively to derive the incision rates shown in Fig. 6‑6c to e (see Nagra 2024k for details on age determination). These rates (~ 0.1 – 0.2 mm/yr) are based on the elevation difference between the lowest data point of a respective Deckenschotter outcrop (Heuberger & Naef 2014) and the local erosion base (LEB). Incision rates increase slightly (mean rates HDS to LEB ~ 0.14 to 0.25 mm/yr and mean rates TDS to LEB ~ 0.2 to 0.32 mm/yr), if analysed along the valleys straddled by the Deckenschotter deposits and if using locally derived ages as well as the age ranges derived from samples across Northern Switzerland (see Nagra 2024k). Note that the incision signal not only includes a share from drainage reorganisation but is also a mixed signal stemming from rock uplift of the Alpine Foreland and baselevel fall at the transition to the Upper Rhine Graben. This may be seen in the the interpolated isolines of HDS to LEB and TDS to LEB heights (Fig. 6‑6c and d) that are slightly rotated to a more NW-SE trend compared to levelling data and GNSS measurements (Fig. 6‑6a and b).
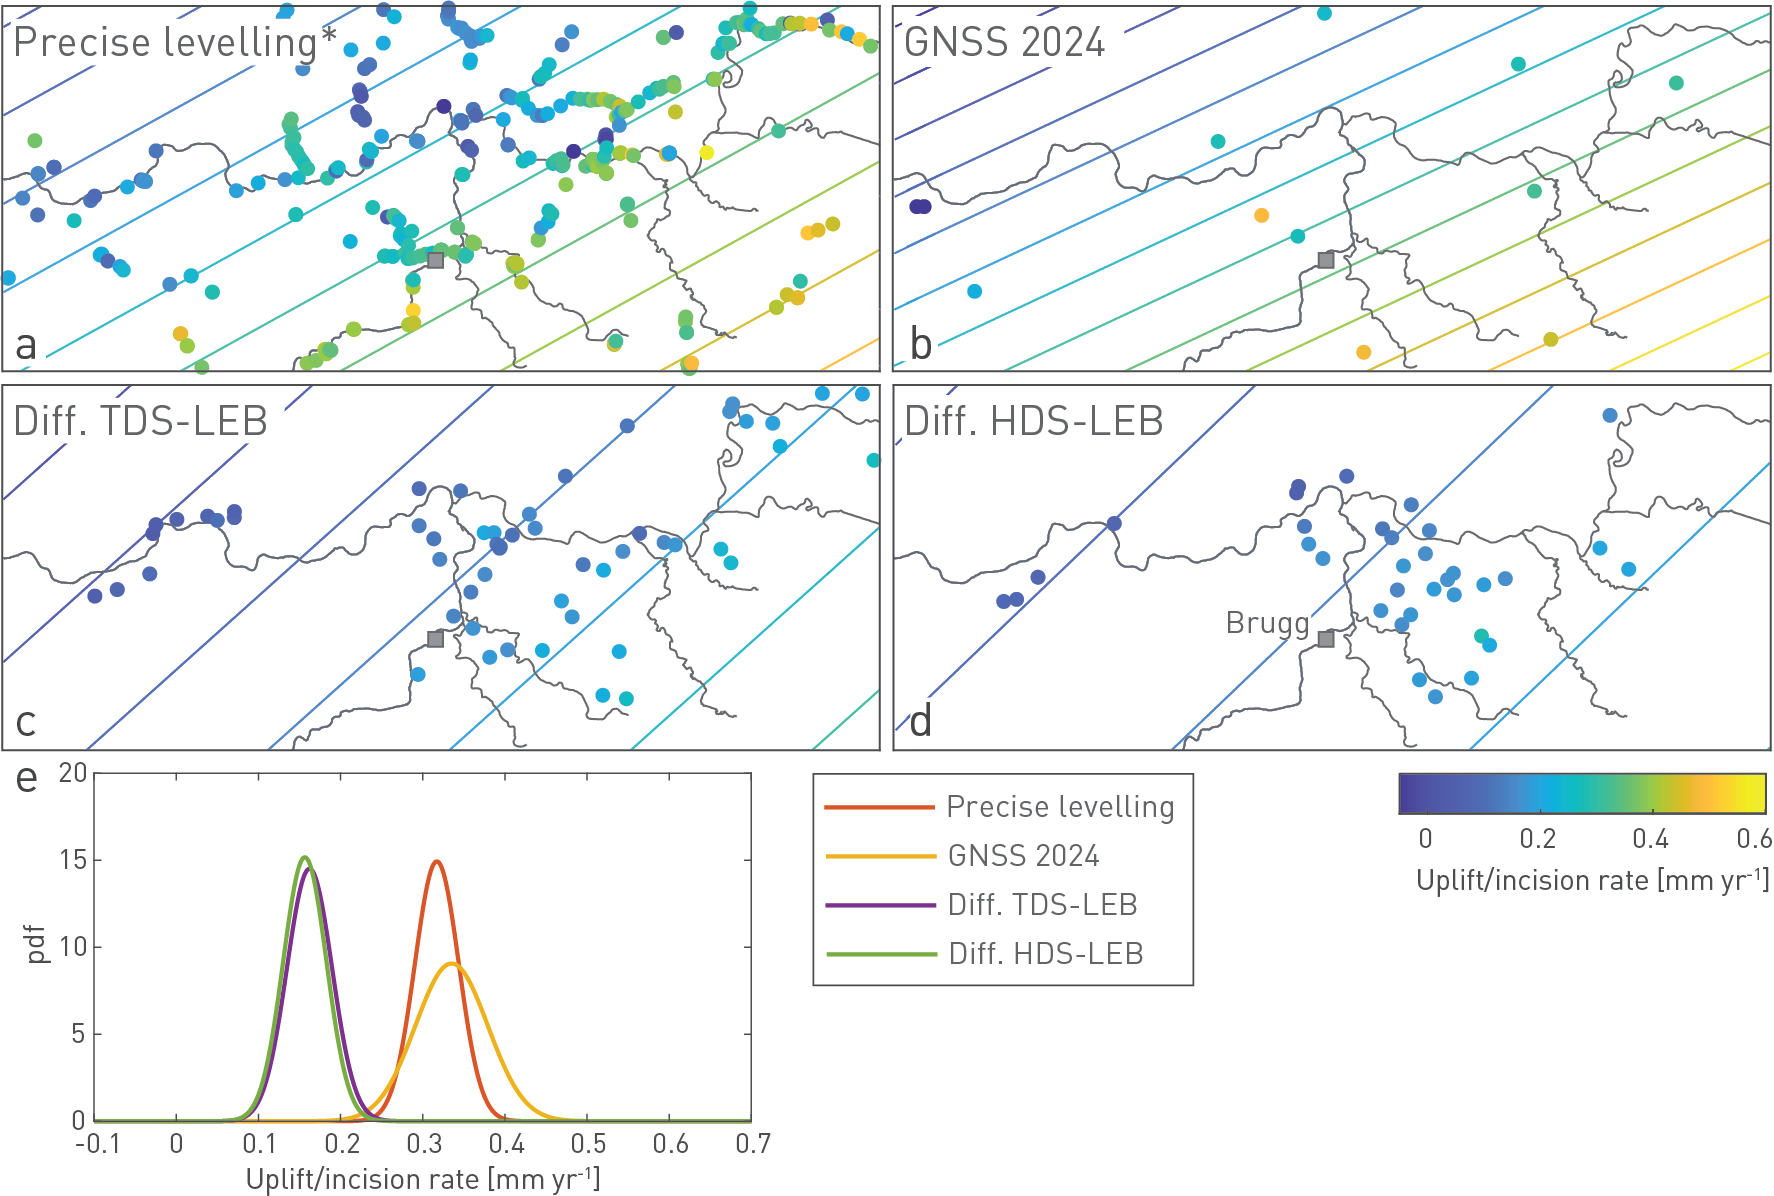
Fig. 6‑6:Patterns and rates of surface uplift and incision proxies on different timescales
The uplift planes in (a) to (d) are calculated from point measurements based on a regression using the coordinates as independent variables. (a) The interpolation of precise levelling data shows a gradient at an azimuth of ~ 153°, perpendicular to the Alpine front and declining towards the foreland. Vertical rates are measured with respect to Laufenburg. * 0.28 mm/yr were added to the dataset of precise levelling, which corresponds to the GNSS-based rate at which Laufenburg is currently uplifting with respect to stable Europe. (b) Interpolation of the vertical GNSS data shows a similar pattern to precise levelling data at an azimuth of ~ 157°. (c) Interpolation of height differences between the geomorphic marker represented by the local erosion base (LEB, see Section 6.4.2.1 for definition) and the base of the Tiefere Deckenschotter (TDS) using a mean age of 0.9 Myr. (d) Similar to (c) but using the Höhere Deckenschotter (HDS) as marker and a mean age of 1.38 Myr. See Section 6.4.1.2 for a discussion of the age constraints for the Deckenschotter deposits. Note that the elevation differences are based on the lowest elevation of each mapped Deckenschotter occurrence (Heuberger & Naef 2014). (e) Probability density function of all uplift proxy data shown in the respective maps above calculated as an example for the location of the city of Brugg (square in maps). Note the higher rates of present-day geodetic surface uplift signals with respect to the longer-term incision rates. LEB: Local erosion base.
Short-term geodetic surface uplift rates in Northern Switzerland
Present-day surface uplift rates as derived from geodetic measurements (precise levelling and GNSS) are considerably higher compared to past exhumation rates or incision rates using these as proxy for long-term surface uplift. However, present-day surface uplift rates for Northern Switzerland agree with each other, when accounting for the different reference frames (Fig. 6‑6a and b). The study area is currently uplifting at rates between ~ 0.2 and 0.5 mm/yr (Fig. 6‑6 and Fig. 6‑7). More detailed analyses are reported in Nagra (2024l).
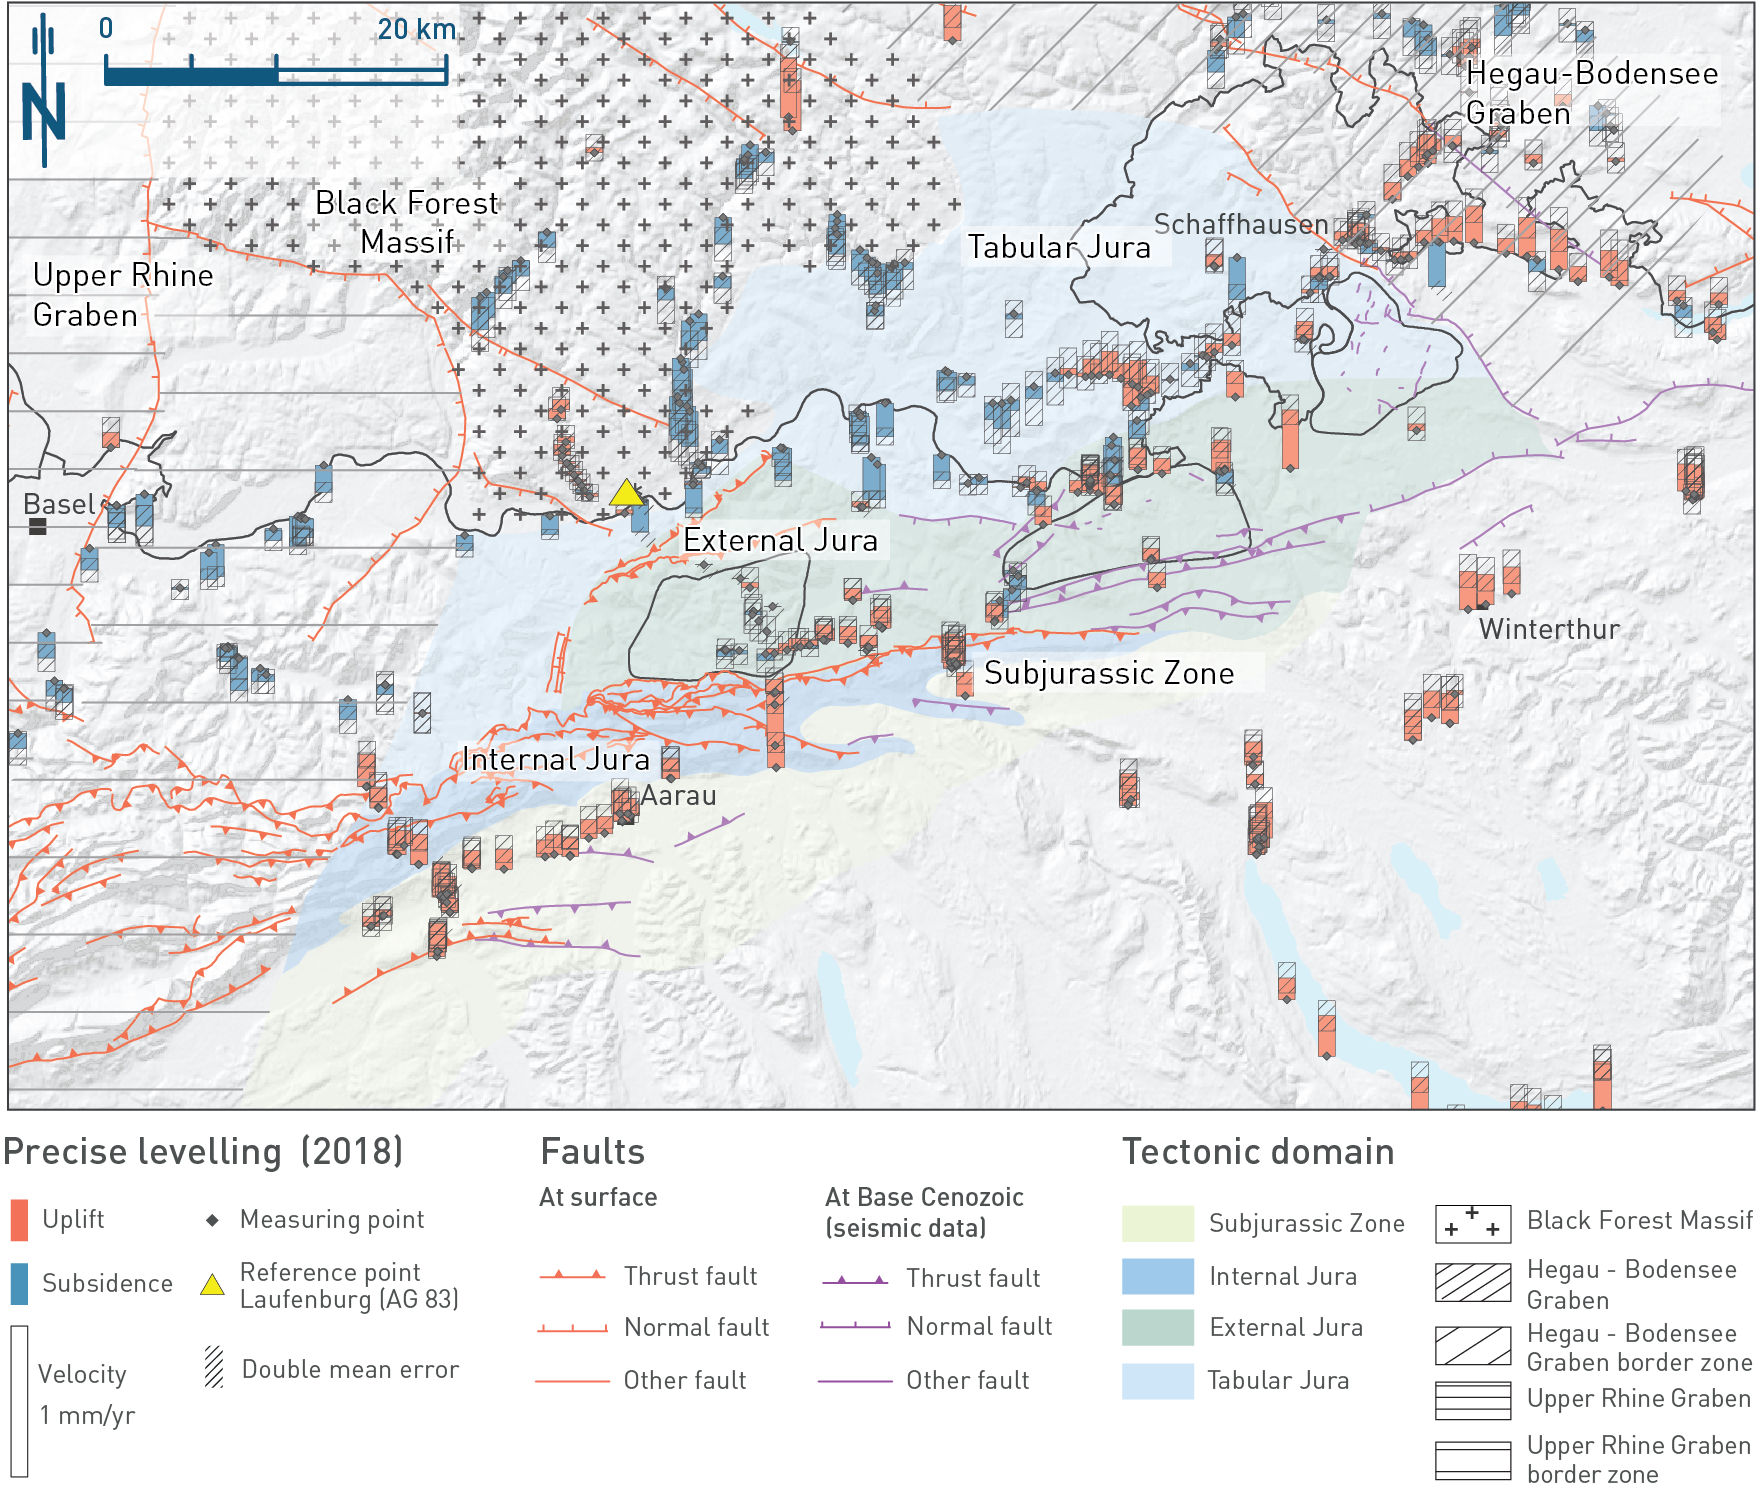
Fig. 6‑7:Geodetic precise levelling data with measurement uncertainties
Precise levelling measurements (analysis NEOTEK2018 by swisstopo). Only data with a good geological quality ranking (> 8.5) are shown. Vertical velocities are based on levelling measurements relative to the fixpoint Laufenburg (yellow triangle). These data show a general trend of decreasing rates from the Alps towards the foreland. Note that only a selection of the structures from 3D seismic interpretation is shown to highlight the structural trends of regional importance. These were projected from Top Villigen Formation to Base Cenozoic.
Summarising the domains crossed by the Rhine River, it can be concluded that the main influence on the incision of the Hochrhein are low rates of North Alpine Foreland rock uplift, compared with low, potentially episodic subsidence within the Upper Rhine Graben. The longitudinal Rhine River profile is also influenced by continuous uplift of the Rhenish Massif and Eifel areas. Accordingly, the Hochrhein is presently buffered against fluvial processes approximately downstream of the city of Bingen (Fig. 6‑5).