
RT can also be used to illustrate how radiotoxicity is distributed within the repository system, how it diminishes over time due to radioactive decay, and how much reaches the biosphere. The following figures show that the great majority of the RT decays within the repository system and never reaches the surface environment.
The distribution of radiotoxicity in the various repository system barriers as a function of time in the reference case is shown in Fig. 9‑4, 9‑5, 9‑6. Key observations are:
-
SF: For times up to 106 years and beyond, the largest fraction of the radiotoxicity is contained within the fuel matrix. At 106 years, the radiotoxicity present outside the CRZ is still several orders of magnitude below that in the fuel matrix.
-
RP-HLW: For times up to a few tens of thousands of years, the largest fraction of the radiotoxicity is contained within the glass matrix. At later times, the largest fraction is sorbed in the bentonite buffer. The radiotoxicity present outside the CRZ reaches a maximum after a few million years but is still orders of magnitude below that contained within the repository barrier system.
-
L/ILW: For times up to about 105 years, the largest fraction of the radiotoxicity is sorbed in the cementitious near field, after which the largest fraction is contained within the Opalinus Clay. Radiotoxicity present outside the CRZ is too low at all times to be shown in the figure.
For comparison, as in the previous section, the RT of uranium ore from the Cigar Lake deposit in northern Saskatchewan, Canada, is also shown.
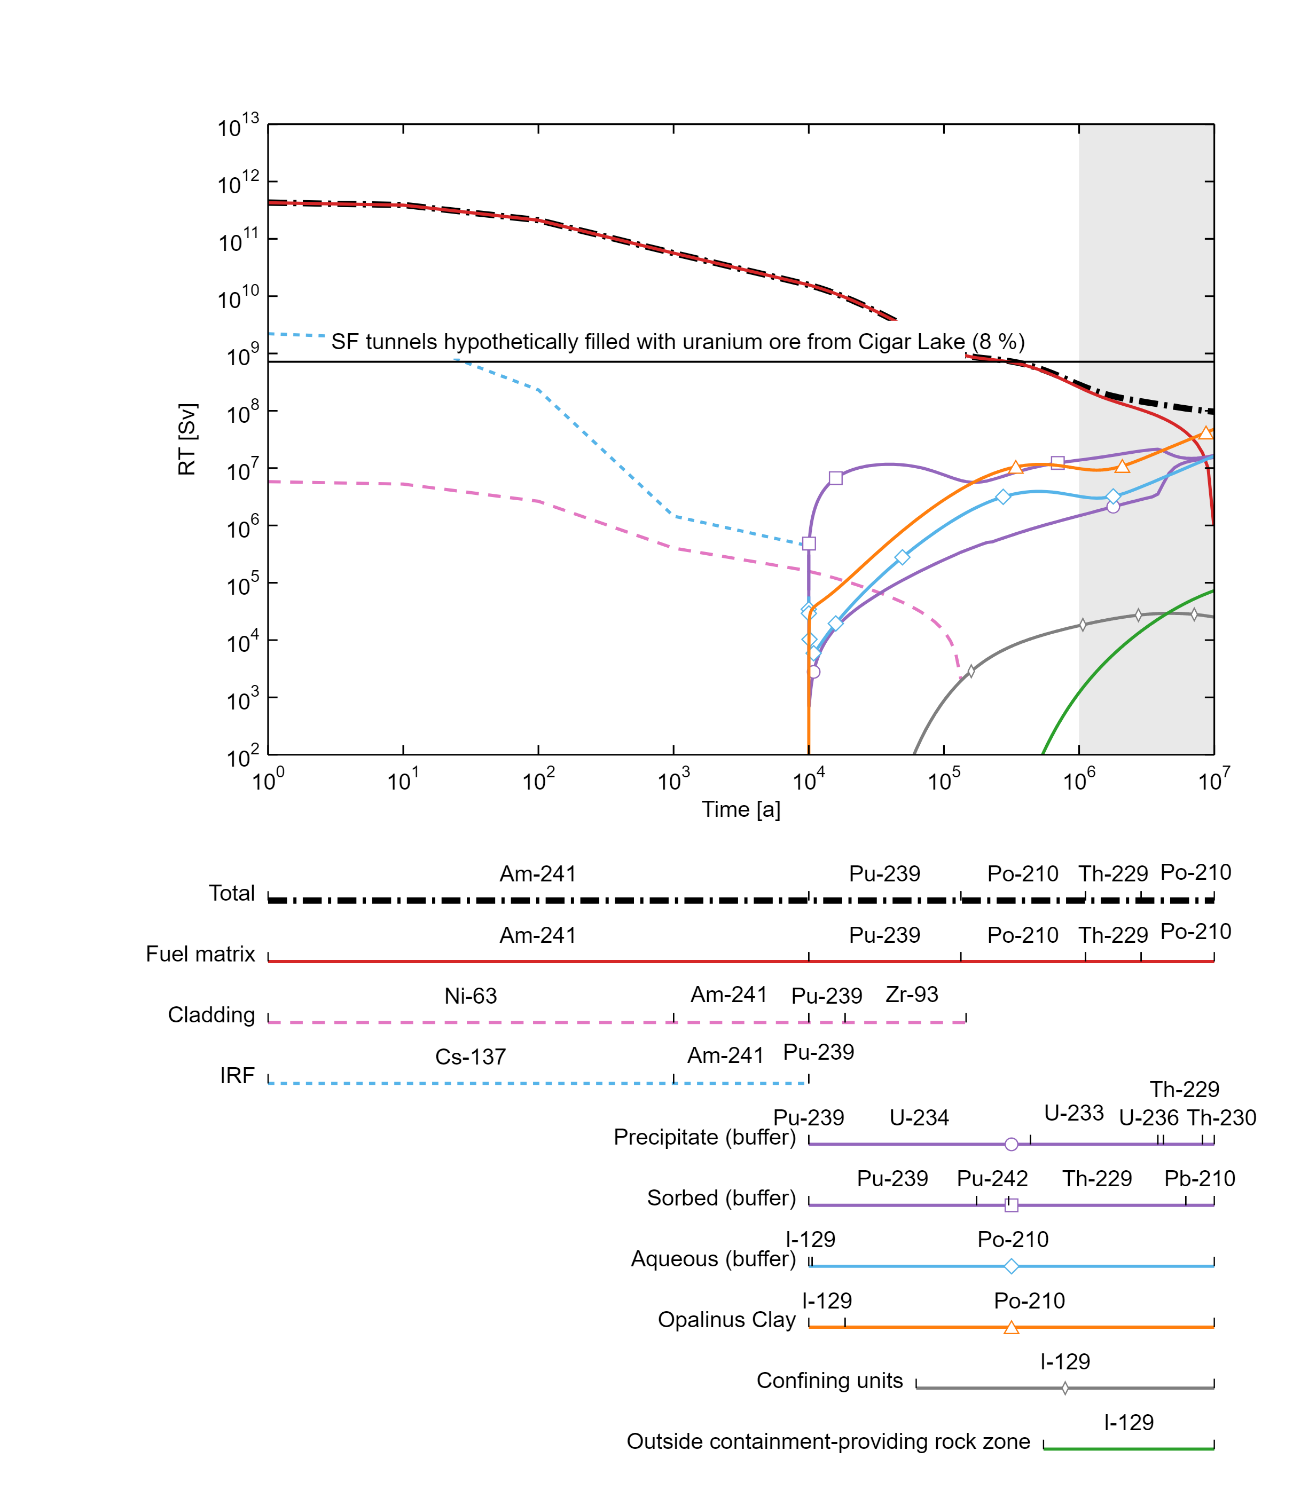
Fig. 9‑4:Evolution and distribution of radiotoxicity (RT) from SF in the different components of the repository near field, the Opalinus Clay and its confining geological units, as well as RT that exists outside the containment-providing rock zone (CRZ)
The bars beneath the graph indicate the radionuclides that make the highest contributions to RT at any given time and in any particular part of the system.
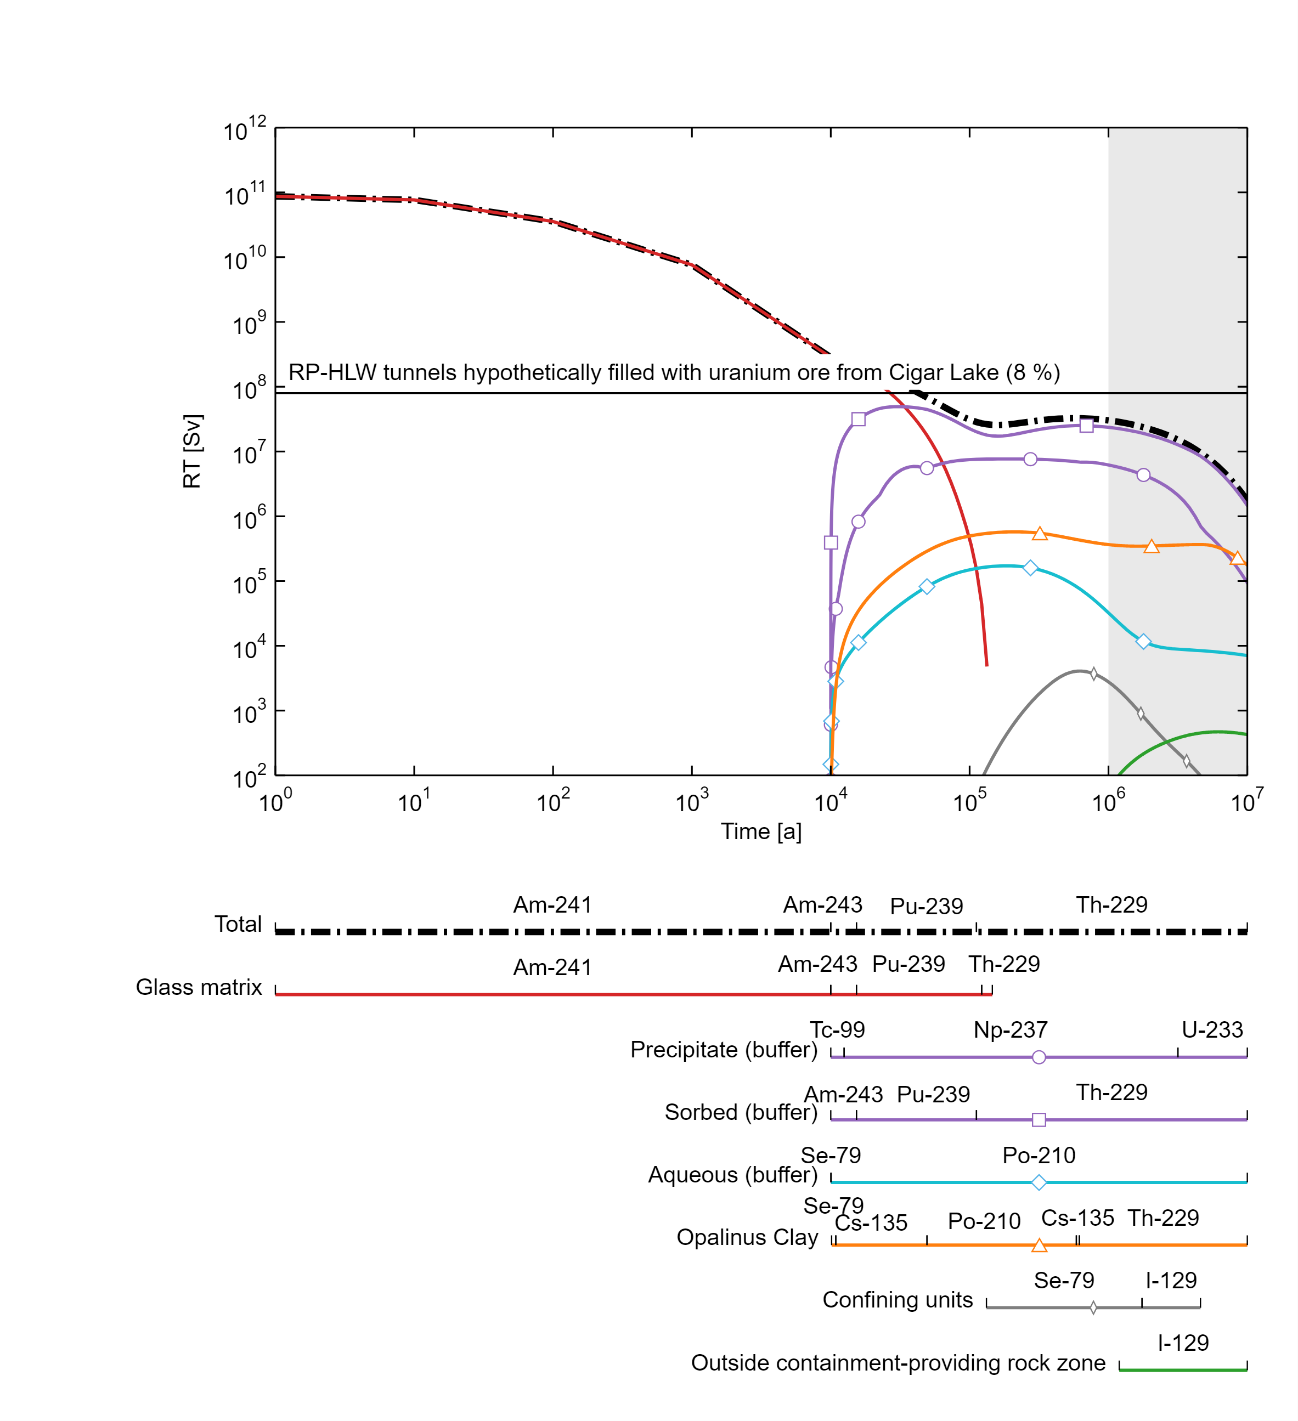
Fig. 9‑5:Evolution and distribution of radiotoxicity (RT) from RP-HLW in the different components of the repository near field, the Opalinus Clay and its confining geological units, as well as RT that exists outside the containment-providing rock zone (CRZ)
The bars beneath the graph indicate the radionuclides that make the highest contributions to RT at any given time and in any particular part of the system.
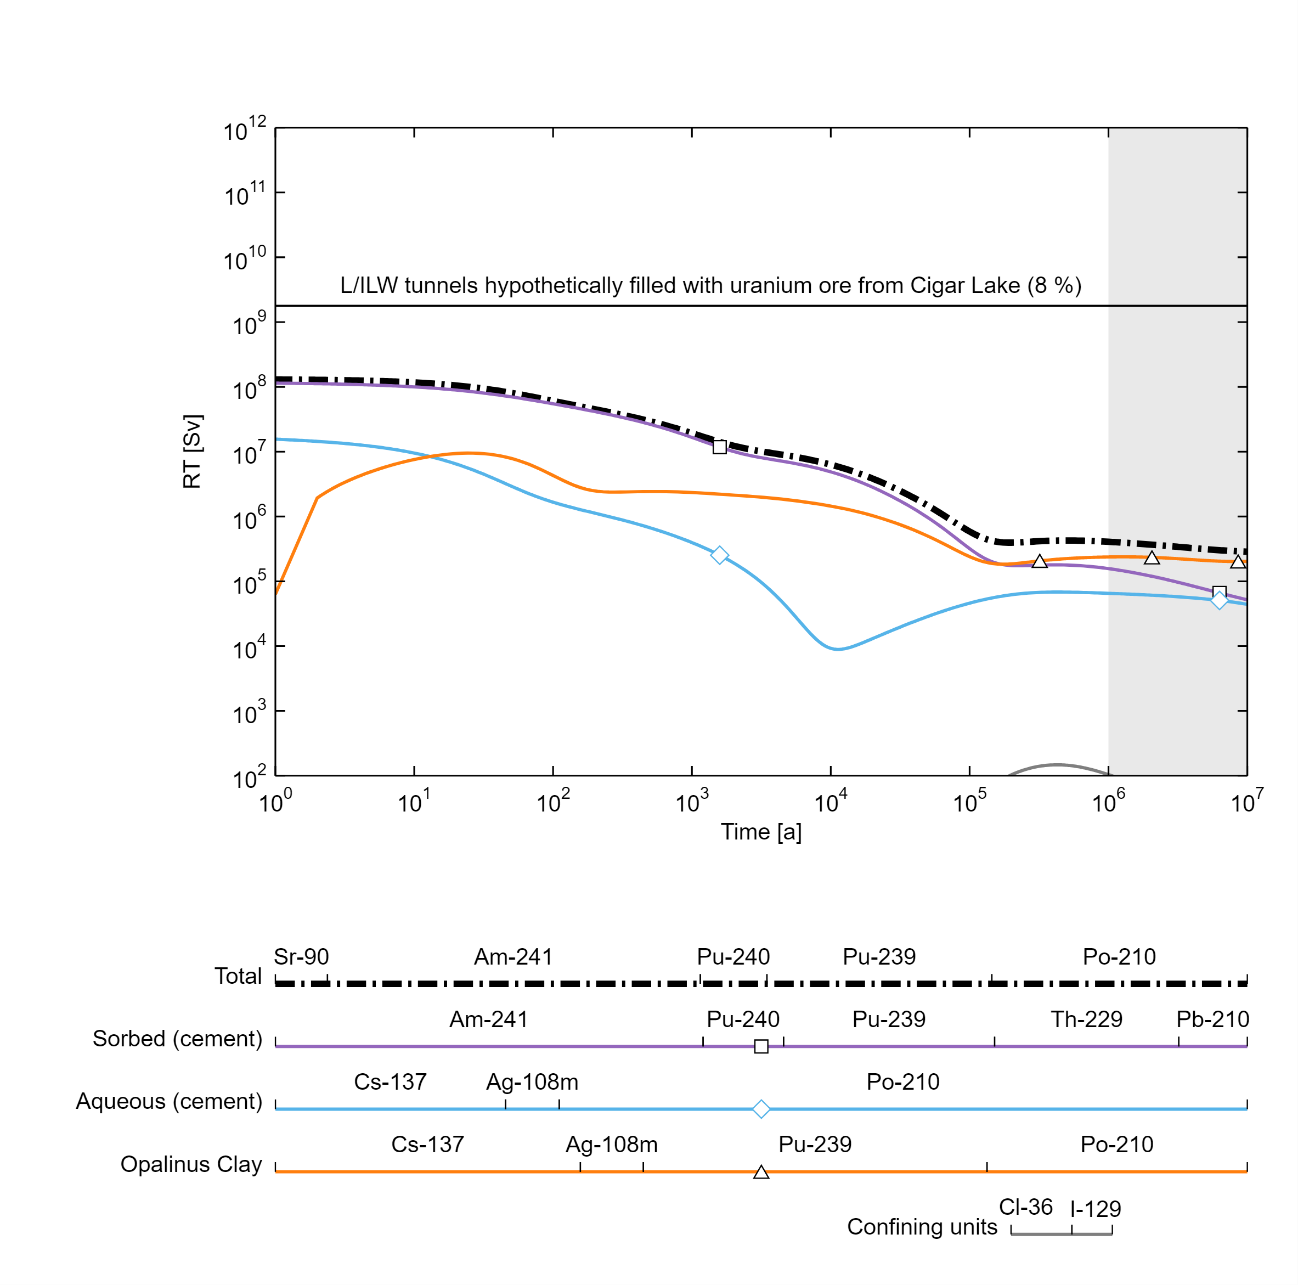
Fig. 9‑6:Evolution and distribution of radiotoxicity (RT) from L/ILW in the different components of the repository near field, the Opalinus Clay and its confining geological units, as well as RT that exists outside the containment-providing rock zone (CRZ)
The bars beneath the graph indicate the radionuclides that make the highest contributions to RT at any given time and in any particular part of the system.