
The results of the radiological consequence analysis demonstrate compliance with the regulatory protection criteria and, through safety margins and “what-if?” case results, underline the robustness of the repository system. The main results are summarised below and feed into the lines of argument for favourable results of the safety assessment (Section 10.2).
For any future evolution of the deep geological repository (except cases involving inadvertent human intrusion), either the dose protection criterion (0.1 mSv/a) or the risk protection criterion (10‑5/a) must be met during the time period for assessment (Section 2.4). After the end of the time period for assessment, the effects must not be significantly higher than the average current radiation exposure of the Swiss population.
Compliance with the dose protection criterion is illustrated in Fig. 8‑14, where maximum dose rates over the simulation time of 106 years have been extracted for all the calculation cases except for the “what-if?” case of excavation and FHA cases24.
The results that link to the reference safety scenario are well below the regulatory criterion of 0.1 mSv/a. The probabilistic results show a safety margin of more than two orders of magnitude for the 95 percentile and close to three orders of magnitude for the median. The most pessimistic deterministic case has a maximum dose rate occurring after roughly one million years. It is still about two orders of magnitude below the regulatory protection criterion. Its high maximum dose rate, which is not covered by the probabilistic results25, is due to the cumulation of pessimistic assumptions, in particular pessimistic values of all the sensitive parameters that lead to the highest dose rates. Furthermore, the wide spread of the results (particularly the deterministic ones over 5 and 11 orders of magnitude for the aqueous phase and two-phase 14C results, respectively) is mainly due to varying but strongly simplifying assumptions regarding the geosphere/biosphere interface, the biosphere itself, and the strong influence of the rather short half-life of 14C for the two-phase results. This is further illustrated in Fig. 8‑15, where dose rates over time are shown for all the calculation cases and thus the timing of the dose rate is visible.
For the alternative safety scenarios, very large safety margins also remain. Since the alternative safety scenarios are performed with the reference biosphere only, the spread of the results is narrower, and there is almost no impact on the maximum dose rates for the aqueous phase results when compared with the reference case. In conclusion, for the expected and any potential evolution of the repository system, the absence of any harm to humans and the natural environment is demonstrated with high confidence and an ample safety margin.
Furthermore, the results for the hypothetical “what-if?” cases shown in Fig. 8‑14 are also below the protection criterion. That the maximum dose rates are generally higher than for the reference and alternative safety scenario cases is expected, since assumptions and parameters are varied in a pessimistic way to test system robustness. The highest maximum dose rates are those of the case with an undetected fault with unrealistically high transmissivity that intersects the L/ILW section of the repository (see, e.g., also Fig. 8‑9). The impact of cumulative conservative assumptions (e.g., fast radionuclide release and dissolution and the neglect of partial saturation for the aqueous phase calculations; full 14C inventory as methane for the two-phase calculations) is at the source of these results that are thus significant overestimations.
It is worth noting that the “what-if?” cases that postulate a hypothetical failure of individual pillars of safety (see also Fig. 8‑12) do not lead to dramatic increases in maximum dose rates, thus building a strong argument for the repository system robustness.
The results for the “what-if?” case of repository excavation by erosive processes (Fig. 8‑10 and Fig. 8‑11 in Section 8.4.1) are not reproduced here. Note, however, that these conform with the risk protection criterion with an ample safety margin during the time period for assessment, while afterwards, they lie well within the typical natural radiation exposure in Switzerland.
Finally, calculation cases for future human action safety scenarios also give results well below the relevant protection criterion, as has been shown in Section 8.5.
Note that the results of consequence analysis are, despite some novel approaches and more extensive calculations, highly consistent with analyses of previous stages in the disposal programme, namely the demonstration of disposal feasibility (Project Entsorgungsnachweis, Nagra 2002). Thus, confidence in the Opalinus Clay as a suitable host rock for radioactive waste disposal is confirmed.
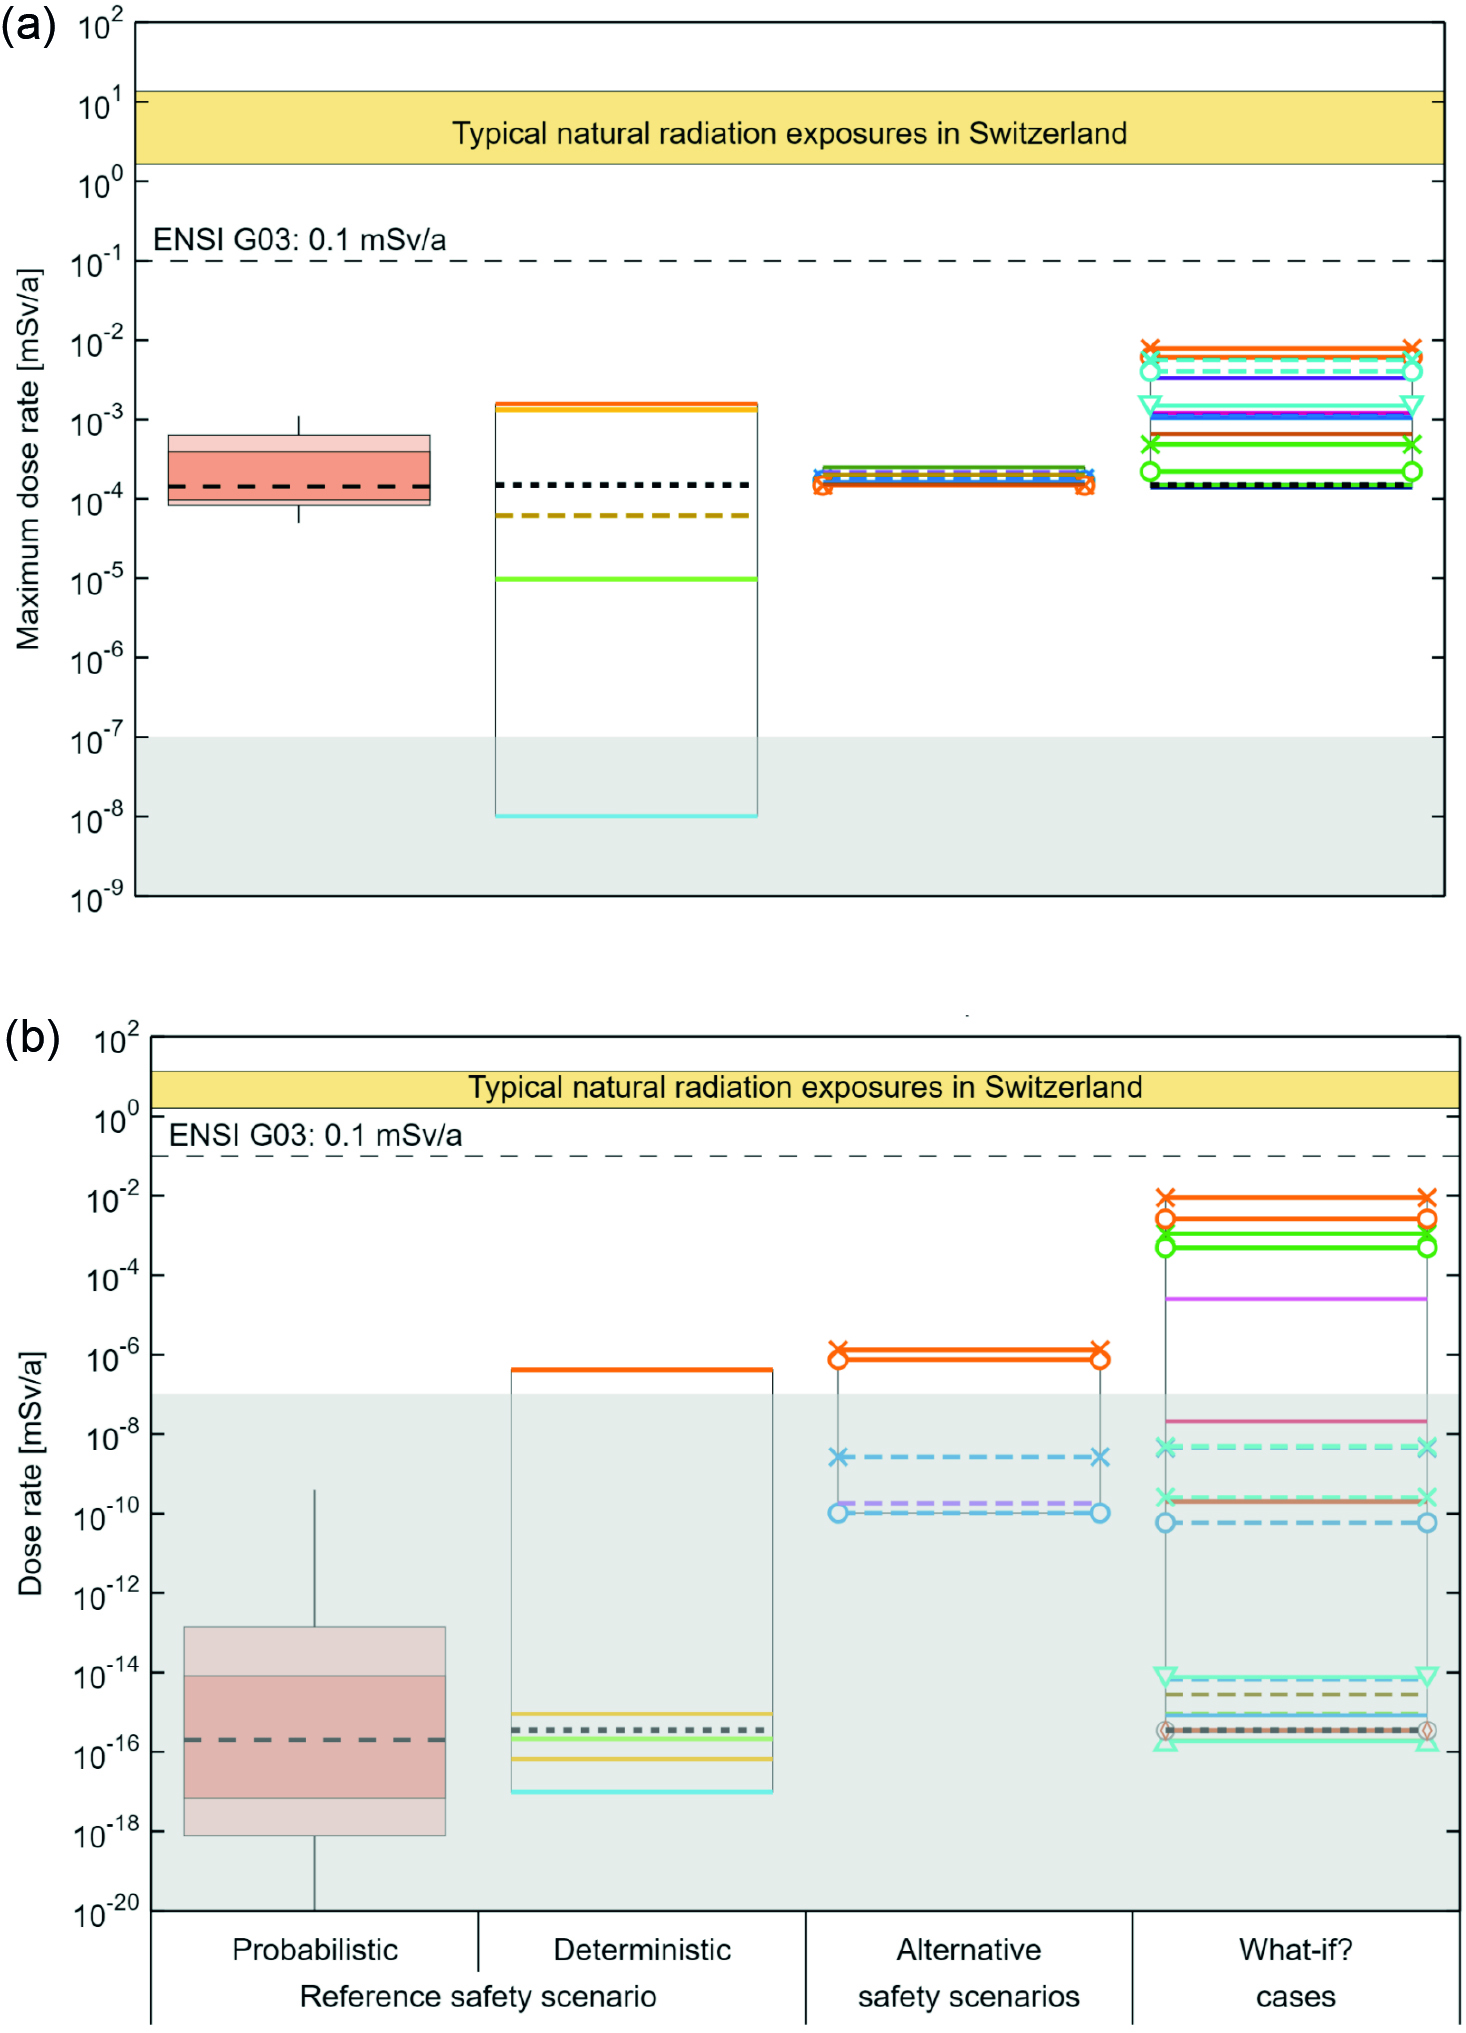
Fig. 8‑14:Summary showing the maximum dose rates over 106 years for the aqueous phase transport of all radionuclides and (a) for two-phase transport of 14C (b)
The reference safety scenario (probabilistic and deterministic calculation cases), calculation cases for the alternative safety scenarios and “what-if?” cases (except the “what-if?” case of excavation) are shown.
The boxplots show the statistical measures of median (dashed horizontal line), 95/5 and 84/16 percentiles (light and dark shades of red) and the full extent of the spread between minimum and maximum (thin vertical line); individual deterministic calculation cases are shown with coloured solid or dashed lines and markers which correspond to the calculation cases in Sections 7.1.5 and 7.2.5 of NTB 24-18 (Nagra 2024p).
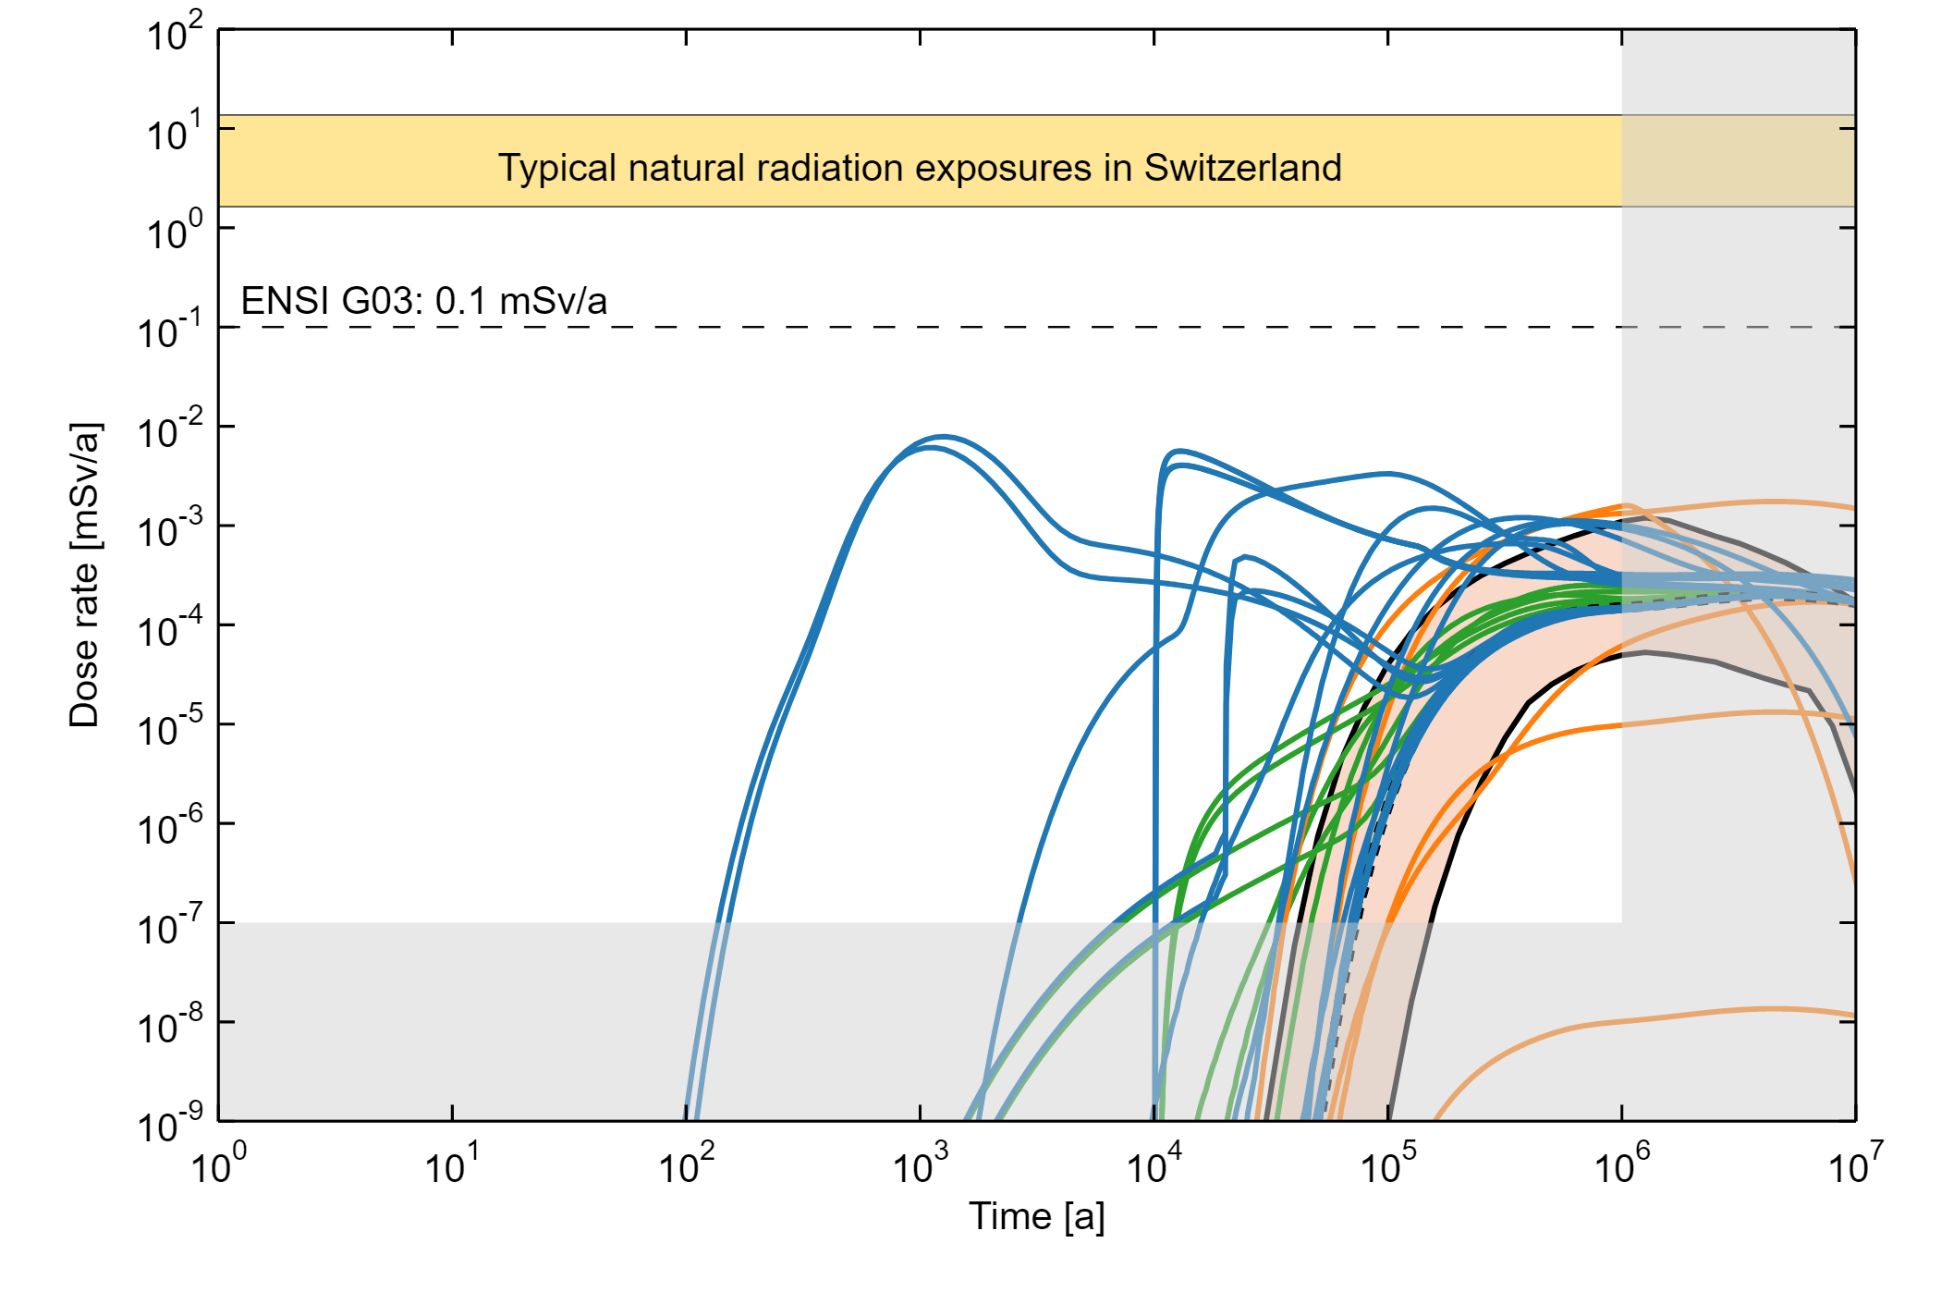
Fig. 8‑15:Summary showing dose rates for all the calculation cases for which the dose protection criterion is relevant
The reference case in dashed black, the reference scenario in orange, the alternative safety scenarios in green and the “what-if?” cases in blue lines. The orange surface illustrates the minimum and the maximum of the probabilistic simulations
For the “what-if?” case of excavation, conformity with the risk protection criterion is demonstrated, while for FHAs conformity with SSR-5 (IAEA 2011a) is shown. ↩
In general, the deterministic results have a wider spread, because combinations of extreme values are deterministically selected; it is thus highly unlikely that such combinations would be randomly sampled. ↩