
Occurrence of an undetected fault with a hypothetically high transmissivity in the vicinity of the repository
Two “what-if?” cases related to the physical phenomenon of geological faults were identified (see Section 7.4.1):
-
the occurrence of an undetected fault with a hypothetically high transmissivity in the vicinity of the repository,
-
the future creation or re-activation of a fault either by geological processes or as a repository-induced effect after repository closure.
For each of these “what-if?” cases, two variants consider whether the HLW or L/ILW repository section is affected and two calculation cases per variant address the fault orientation. The calculation cases are summarised in Tab. 8‑4 and Tab. 8‑5. For details and illustrations see Section 7.4.1. Note that the different timing of fault re-activation for the HLW and L/ILW variants corresponds to conservative assumptions with respect to potential radiological consequences (see Section 7.4.1)
Tab. 8‑4:Calculation cases for the “what-if?” cases for an undetected fault with hypothetically high transmissivity
All cases are calculated using both modelling approaches: aqueous-phase transport and two-phase transport of 14C.
|
Variant |
Case |
Description |
|
Fault with hypothetically high transmissivity intersects the HLW emplacement drifts |
WI-FLT-HLW-Along |
Fault, with a transmissivity of 10-7 m2/s, with strike running along the axis of a single emplacement drift |
|
WI-FLT-HLW-Across |
Fault, with a transmissivity of 10-7 m2/s, with strike running perpendicular to drifts, cutting each drift at its centre |
|
|
Fault with hypothetically high transmissivity intersects the L/ILW emplacement caverns |
WI-FLT-L/ILW-Along |
Fault, with a transmissivity of 10-7 m2/s, with strike running along the axis of a single emplacement cavern |
|
WI-FLT-L/ILW-Across |
Fault, with a transmissivity of 10-7 m2/s, with strike running perpendicular to caverns, cutting each cavern at its centre |
Tab. 8‑5:Calculation cases for the “what-if?” cases for fault re-activation by geological processes or as a repository-induced effect
All cases are calculated using both modelling approaches: aqueous-phase transport and two-phase transport of 14C.
|
Variant |
Case |
Description |
|
Newly created or re-activated fault intersects the HLW emplacement drifts |
WI-FLT/RA-HLW-Along |
Fault, with a transmissivity of 10-7 m2/s created at 10,000 years, with strike running along the axis of a single emplacement drift |
|
WI-FLT/RA-HLW-Across |
Fault, with a transmissivity of 10-7 m2/s created at 10,000 years, with strike running perpendicular to drifts, cutting each drift at its centre |
|
|
Newly created or re-activated fault intersects the L/ILW emplacement caverns |
WI-FLT/RA-L/ILW-Along |
Fault, with a transmissivity of 10-7 m2/s created at 20,000 years, with strike running along the axis of a single emplacement cavern |
|
WI-FLT/RA-L/ILW-Across |
Fault, with a transmissivity of 10-7 m2/s created at 20,000 years, with strike running perpendicular to caverns, cutting each cavern at its centre |
The results in the form of dose rates are shown for the calculation cases of these “what-if?” cases in Fig. 8‑9 for both (a) the aqueous phase and (b) two-phase transport. For the aqueous phase results, the reference case is also shown for comparison (for two-phase transport, the dose rate for the reference case is negligible).
The two calculation cases with an undetected fault with hypothetically high transmissivity intersecting L/ILW emplacement caverns (WI-FLT-L/ILW-Along and -Across) have highest dose rates for the aqueous phase, being about one order of magnitude below the dose protection criterion (Fig. 8‑9a). There is not a big difference between the fault with strike running along the axis of a single emplacement cavern and the one striking perpendicular to caverns, cutting each cavern at its centre. The calculation cases of a newly created or re-activated fault after 20,000 years intersecting L/ILW emplacement caverns (WI-FLT/RA-L/ILW-Along and -Across) have much lower dose rates that are only one order of magnitude above the reference case.
The dose rates for similar calculation cases for faults intersecting the HLW emplacement drift(s) are more than one order of magnitude below the dose protection criterion. The calculation cases WI-FLT-HLW-Along and WI-FLT-HLW-Across are almost identical to the calculation cases WI-FLT/RA-HLW-Along and WI-FLT/RA-HLW-Across and therefore not visible in Fig. 8‑9.
For the two-phase flow results (Fig. 8‑9b), the highest dose rates come from the same calculation cases as for the aqueous phase, which are also about one order of magnitude below the dose protection criterion. WI-FLT-L/ILW-Across gives higher dose rates than WI-FLT-L/ILW-Along because the fault cuts each drift at its centre and the gas is able to escape from each cavern along the fault.
The HLW calculation cases for the two-phase flow are two orders of magnitude and more below the protection criteria. WI-FLT-HLW-Along is not visible in the figure since it is almost identical to WI-FLT/RA-HLW-Along.
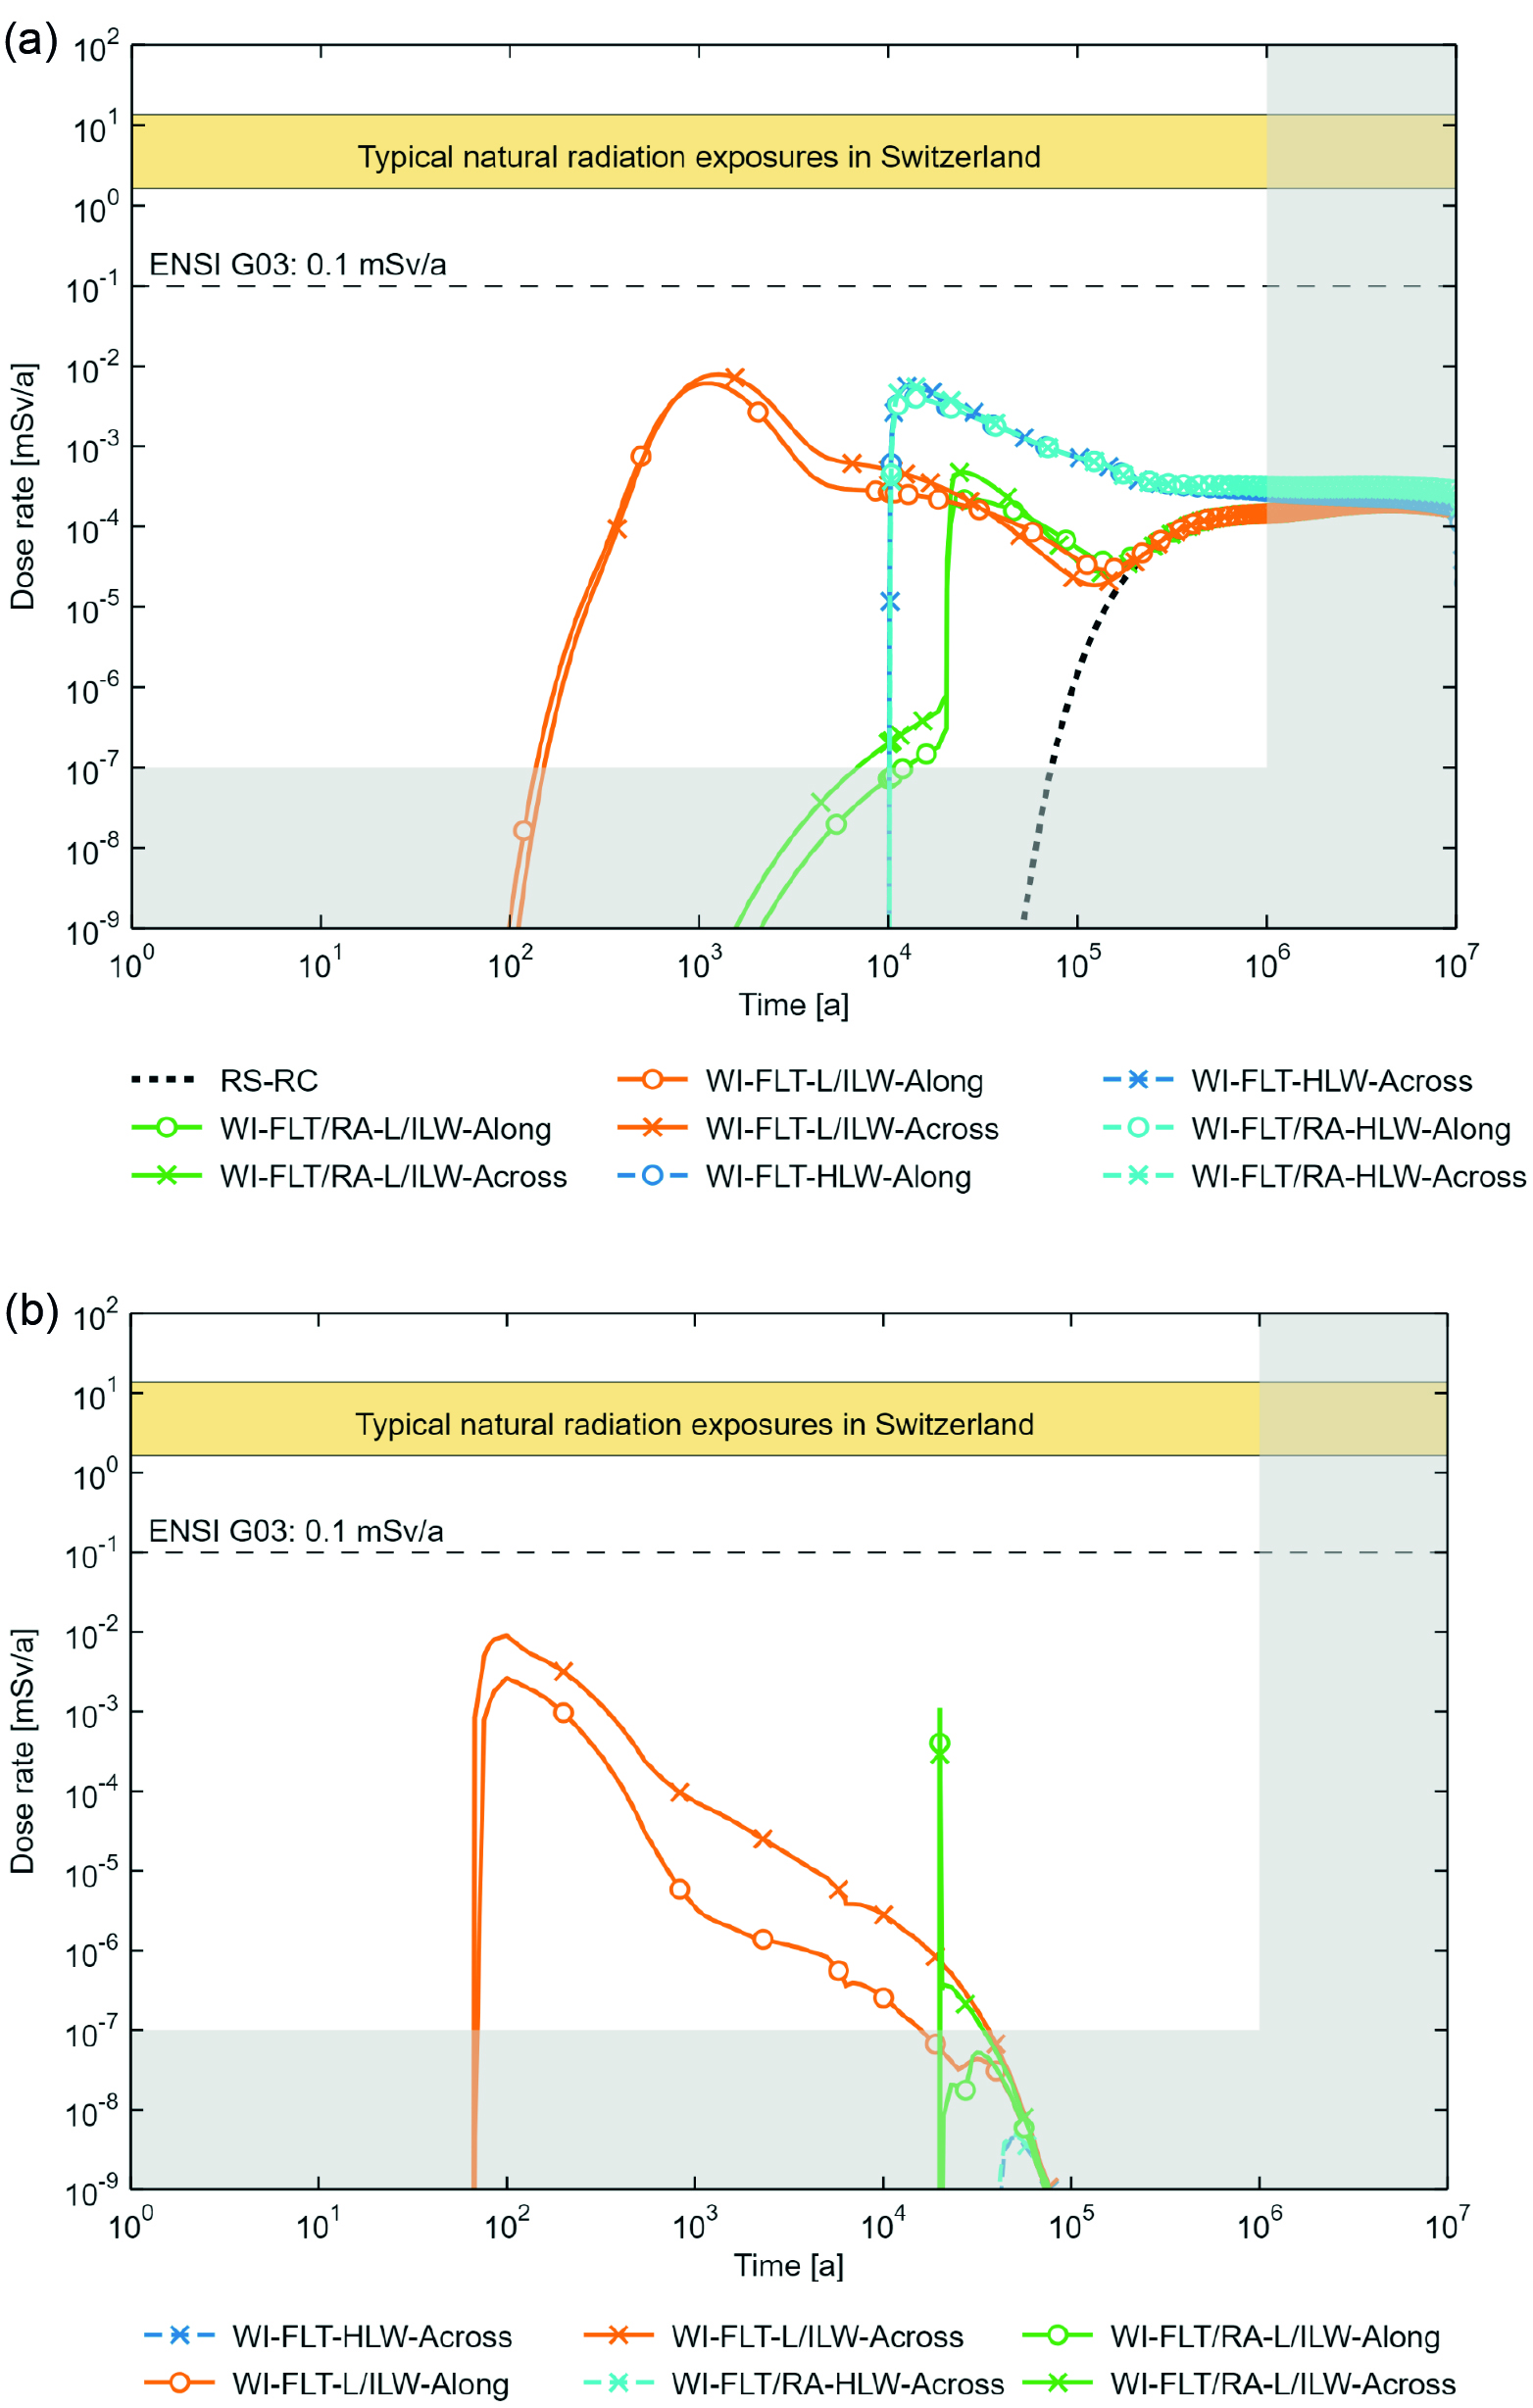
Fig. 8‑9:Dose rates for the calculation cases of the “what-if?” cases related to physical phenomena and radionuclide transport in the aqueous phase and (a) for the two-phase transport of 14C (b)
Excavation of the repository by erosive processes
An additional “what-if?” case related to physical phenomena concerns the excavation of the repository by erosion. During the time period for assessment, the occurrence of such an event has been demonstrated to be hypothetical (Nagra 2024i), thus positioning it as a “what-if?” case linked to the physical phenomenon of erosion. Note that, in the very distant future, beyond the one-million-year time period for assessment, there is a slow increase in probability with advancing time for repository material to be excavated as a result of erosion processes (NAB 24-08 Rev. 1, Nagra 2024q.
The variants and calculation cases for this “what-if?” case are shown in Tab. 8‑6 and Tab. 8‑7. The derivation of the variants and calculation cases, and also the radiological consequences of excavation of repository material by erosion, are fully discussed and analysed in NAB 24-08 Rev. 1 (Nagra 2024q). Uncertainties in key parameters, such as the assumed erosion rates, as well as the nature of the erosion (glacial and non-glacial), are taken into account and lead to the consideration of excavation occurring between 700,000 and four million years after repository closure.
Tab. 8‑6:Calculation cases for the assessment of repository excavation by deep glacial erosion
All calculation cases are calculated for excavation occurring 700,000 and 1, 2, and 4 million years after repository closure.
|
Variant |
Calculation case |
Description |
|---|---|---|
|
Ra |
River base case |
River variant with excavated material initially deposited in the shallow permeable sediments, groundwater connected to the river, water for drinking, animals and irrigation drawn from the shallow aquifer. |
|
Rb |
Alternative river case |
River variant with excavated material initially deposited in the impermeable layer below the shallow permeable sediments, groundwater connected to the river, water for drinking, animals and irrigation drawn from the shallow aquifer. |
|
L |
Lake case |
Lake variant with excavated material initially deposited in the impermeable sediments below the lake, water for drinking, animals and irrigation drawn from the lake. |
|
S |
Spring case |
Spring variant with excavated material initially deposited in the permeable sediments on the hillside, water for drinking, animals and irrigation drawn from the spring. |
Tab. 8‑7:Calculation cases for the assessment of repository excavation by non-glacial erosion
All calculation cases are calculated for excavation occurring 700,000 and 1, 2, and 4 million years after repository closure.
|
Variant |
Calculation case |
Description |
|
Hillside |
Case A |
Shallow valley with 50 m high hillslope, low erosion rate of 0.08 mm a-1, considering long-term exposures and discrete landslide events. |
|
Case B |
Average valley with 250 m high hillslope, average erosion rate of 0.2 mm a-1, considering long-term exposures and discrete landslide events. |
|
|
Case C |
Steep valley with 500 m high hillslope, high erosion rate of 25 mm a-1, considering long-term exposures and discrete landslide events. |
|
|
Case D |
Average valley with high-permeability limestone layer creating springs on the hillside below the repository. |
|
|
Valley floor |
Release from weathered repository below the local aquifer in a valley floor setting. |
|
To demonstrate regulatory compliance for times within the time period for assessment (see Section 2.4), the radiological consequences of repository excavation prior to one million years after repository closure are expressed in terms of annual risk and compared with the risk protection criterion of 10-5 per year (Fig. 8‑10) because dose rates exceed 0.1 mS/year for some calculation cases (Sections 3.7 and 4.7 of NAB 24-08 Rev. 1, Nagra 2024q). The annual risk is more than two orders of magnitude below the risk protection criterion and is so low that any impact during this period can effectively be considered irrelevant.
For excavation times beyond the time period for assessment, i.e., beyond one million years, calculated dose rates are shown in Fig. 8‑11. The dose rates are below or within the range of natural radiation exposure in Switzerland, and therefore also compliant with the regulatory protection criterion for such long timescales (see Section 2.4).
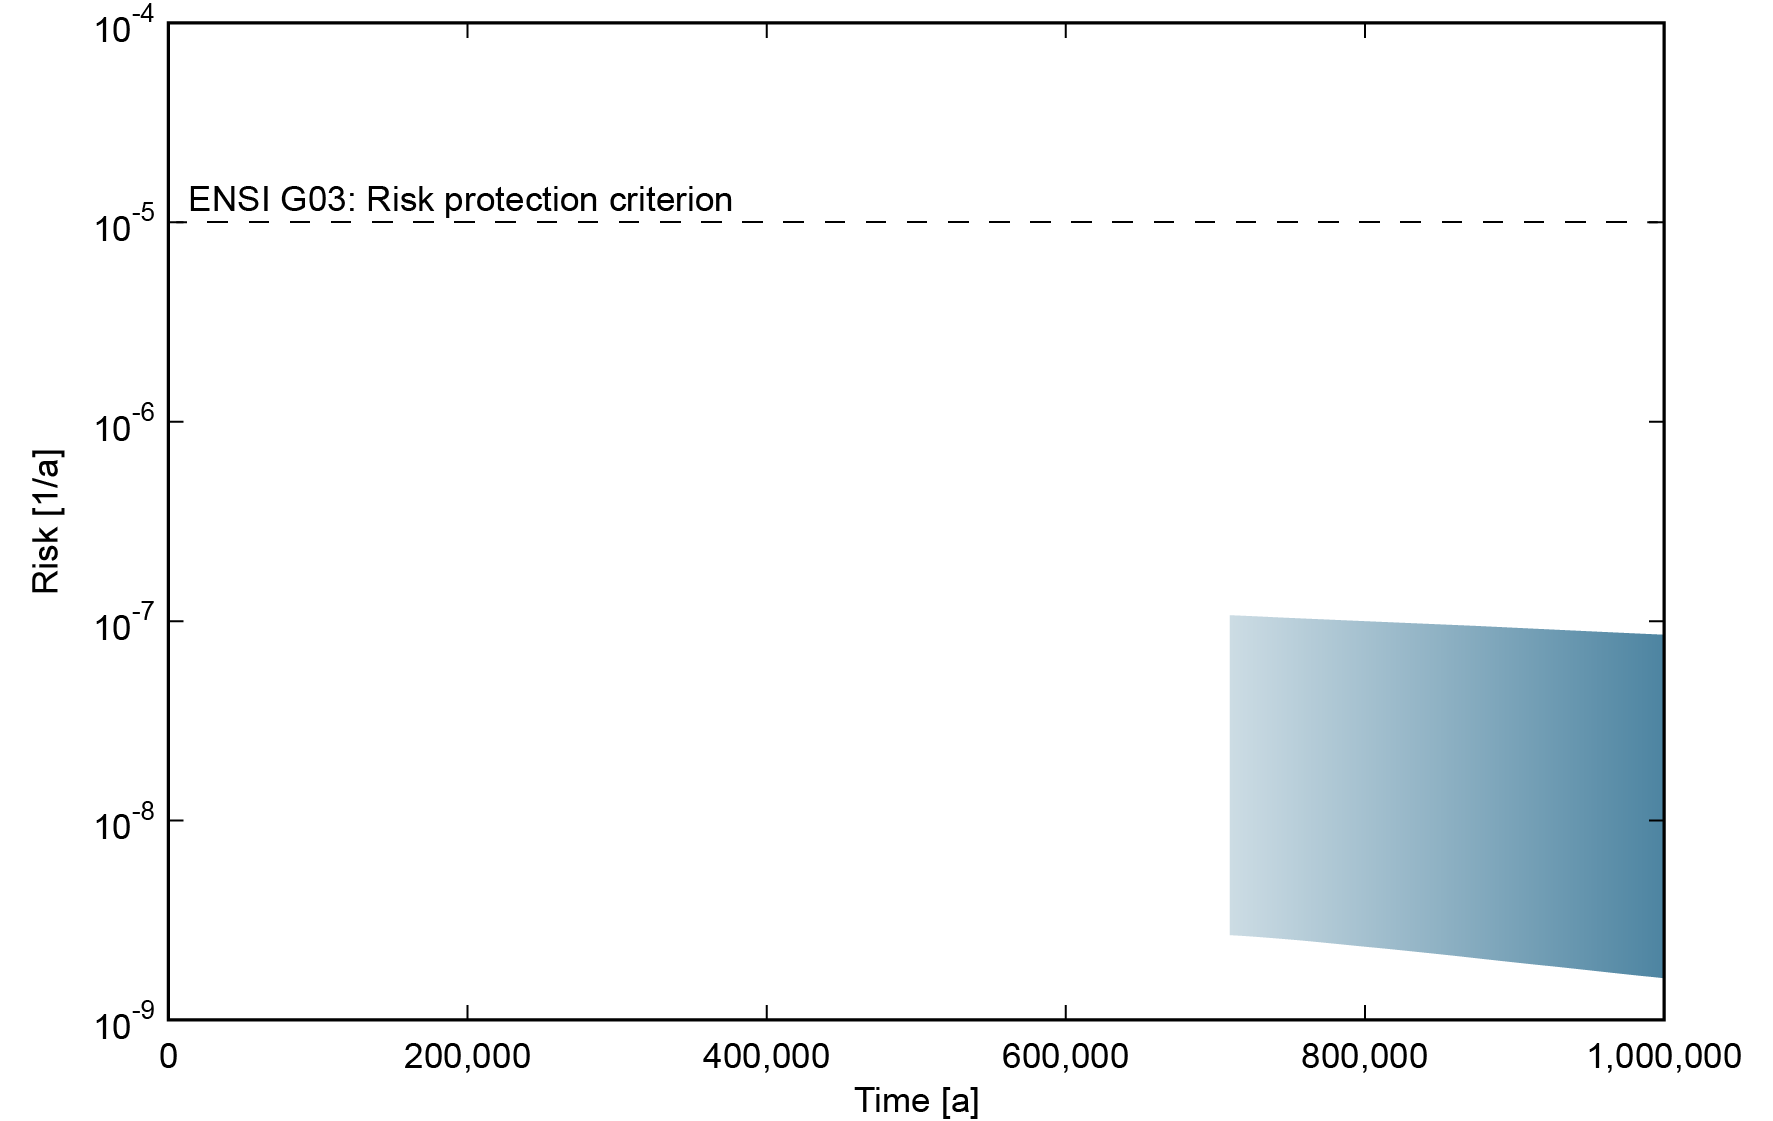
Fig. 8‑10:Illustration of the range of the annual risk associated with repository excavation compared with the regulatory risk protection criterion, for excavation times of up to one million years
Based on the calculated dose rates for repository excavation after 700,000 and 1 million years from NAB 24-08 Rev. 1 (Nagra 2024q), conservatively using the probability of excavation at one million years from (see Figure 6-44 of NTB 24-17, Nagra 2024i).
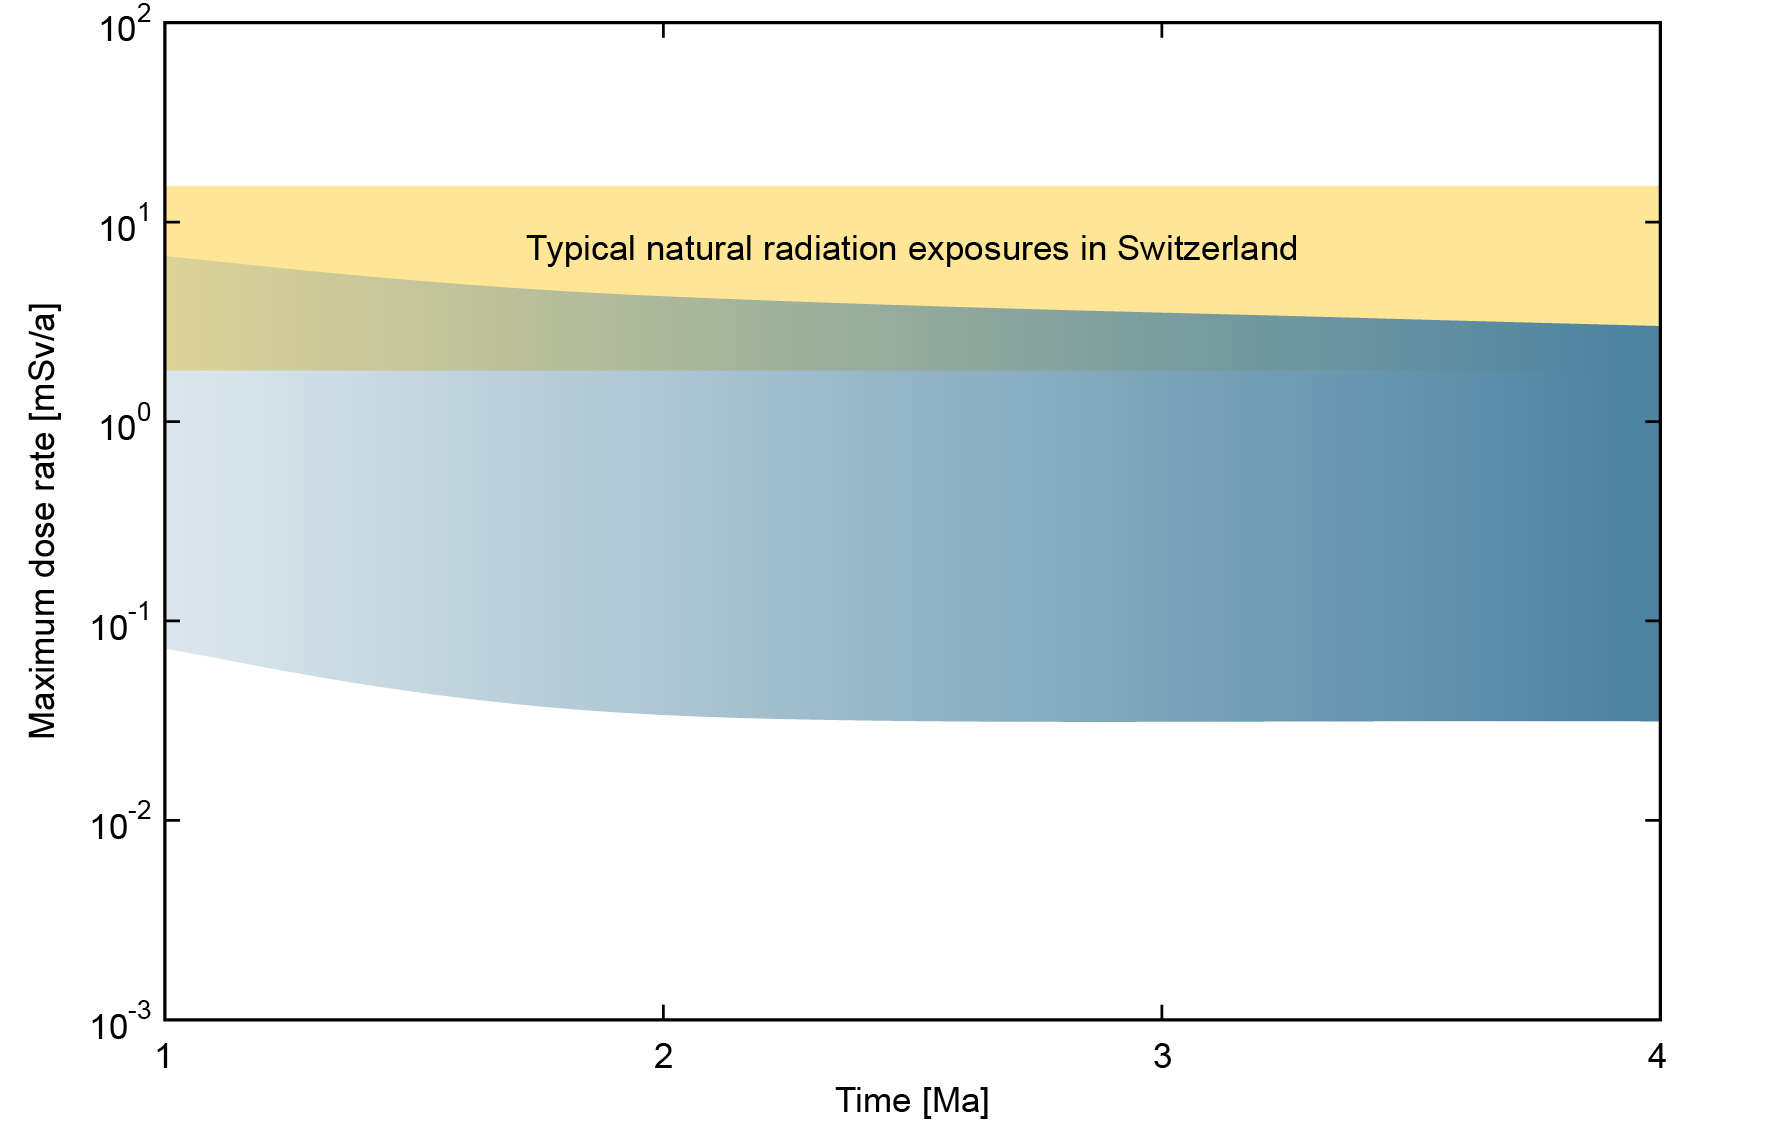
Fig. 8‑11:Illustration of the range of the maximum dose rates for excavation times after the time period for assessment (1 to 4 million years)
Based on the range of maximum calculated dose rates for all the calculation cases for the assessment of repository excavation by erosive processes after 1, 2 and 4 million years. The shading indicates an increase of probabilities of the excavation at later times.