
The reference safety scenario represents the expected initial state and expected evolution over time. Several deterministic calculation cases and one probabilistic calculation case, as summarised in Tab. 8‑1 and described in Section 7.2, have been defined for the reference safety scenario. Calculation cases for the reference conceptualisation of the CRZ cover the reference case, alternative climatic conditions and one different geomorphology (different biospheres), and one calculation case addresses parameter uncertainty. An additional calculation case uses a variant conceptualisation of the CRZ with a hydraulically inactive Keuper aquifer to account for uncertainty in geological characterisation.
Computed dose rates for the reference calculation case RS-RC resulting from radionuclide migration in the aqueous phase are shown in Fig. 8‑3, where the contributions of the HLW (top), L/ILW (middle) and the total dose rate for the repository (bottom) are distinguished. In each subfigure, the radionuclides that contribute significantly (and visibly) to the total dose rate are also plotted. It becomes obvious that only three radionuclides, namely I-129, Cl-36 and Se-79, reach the biosphere in sufficient amounts to contribute to the dose rates. Ca-41 only appears in the dose rate in which the contributions from both HLW and L/ILW are combined and has no radiological significance. All the other radionuclides decay to such a degree during their transport from the waste through the near field and the CRZ that their contributions are negligible, i.e., below 10‑9 mSv/a, and thus not visible in the plots. The three contributing types of radionuclides are characterised by a sufficiently large inventory, low sorption coefficients, and comparably long half-lives.
While the relative contribution of the three radionuclide types differs between the L/ILW and HLW repository sections, and also changes over time, it is clearly the HLW repository section that dominates the overall dose rates, with I-129 being the radionuclide with the highest contribution.
The total dose rate reaches 1.5 × 10⁻⁴ mSv/a after one million years, which is about three orders of magnitude lower than the protection criterion of 0.1 mSv/a, indicating a large safety margin. Note that the total dose rate continues to increase slightly thereafter, reaching a maximum of 2.0 × 10⁻⁴ mSv/a after about 4.5 million years, but remains about four orders of magnitude below the typical present-day natural radiological exposures in Switzerland and as published by the Swiss Federal Office of Public Health in their annual reports on radiological monitoring of the environment (“Umweltradioaktivität” BAG 2021).
A more detailed analysis of the radionuclide transport distance while considering decay is provided by analysing the dose rate contribution of radionuclides as a function of the distance from the near field (Fig. 8‑4). For this, selected radionuclide fluxes were captured in the geosphere model every 10 m, and a hypothetical dose rate contribution per radionuclide was computed, assuming that the exfiltration pathway would be at these locations, i.e., the radionuclide fluxes at these hypothetical interfaces every 10 m were converted to dose rates using the BDCF from the reference calculation case. The excellent retention capacity of the near field as well as that of the Opalinus Clay (OPA) become evident. The same radionuclides as in Fig. 8‑3 (I-129, Cl-36, Se-79 and Ca-41) leave the host rock and penetrate further into the upper (UCU) and lower confining geological units (LCU) and eventually reach the biosphere.
Tab. 8‑1:Calculation cases for the reference safety scenario
All cases are calculated using both modelling approaches: aqueous-phase transport and two-phase transport of 14C.
|
Variant |
Case |
Description |
|
Reference conceptualisation of CRZ; Hydraulically active Keuper aquifer |
RS-RC |
Reference case: Realistic (best estimate) assumptions and parameters whenever available (else conservative) Present-day climatic conditions (reference biosphere) Note that one conservative assumption in RS-RC is that the Keuper aquifer is hydraulically active and is thus the main exfiltration layer in the geological units below the repository |
|
RS-BIOS/WARM_DRY |
As the RS-RC but: Biosphere for warmer and drier climate |
|
|
RS-BIOS/COLD |
As the RS-RC but: Biosphere for colder climate |
|
|
RS-BIOS/DRAINED_FARMLAND |
As the RS-RC but: Biosphere assuming a drained farmland landscape |
|
|
RS-PROB |
Based on the RS-RC but: A probabilistic simulation with multiple realisations in which parameters are sampled at random from probability distributions, derived from an assessment of parameter uncertainty. Illustrates the range of uncertainty in calculated consequences and provides the data for a global sensitivity analysis. |
|
|
RS-CMB |
Based on the RS-RC but: Deterministic case in which the parameters to which the radiological consequences are most sensitive, as identified in the probabilistic analysis (RS-PROB), are set to their most unfavourable values, or from the reference value within their probability distributions, respectively. |
|
|
Hydraulically inactive Keuper aquifer |
RS-KEUPER_INACTIVE |
As the RS-RC but: Hydraulically inactive Keuper aquifer below the HLW repository section of the repository |
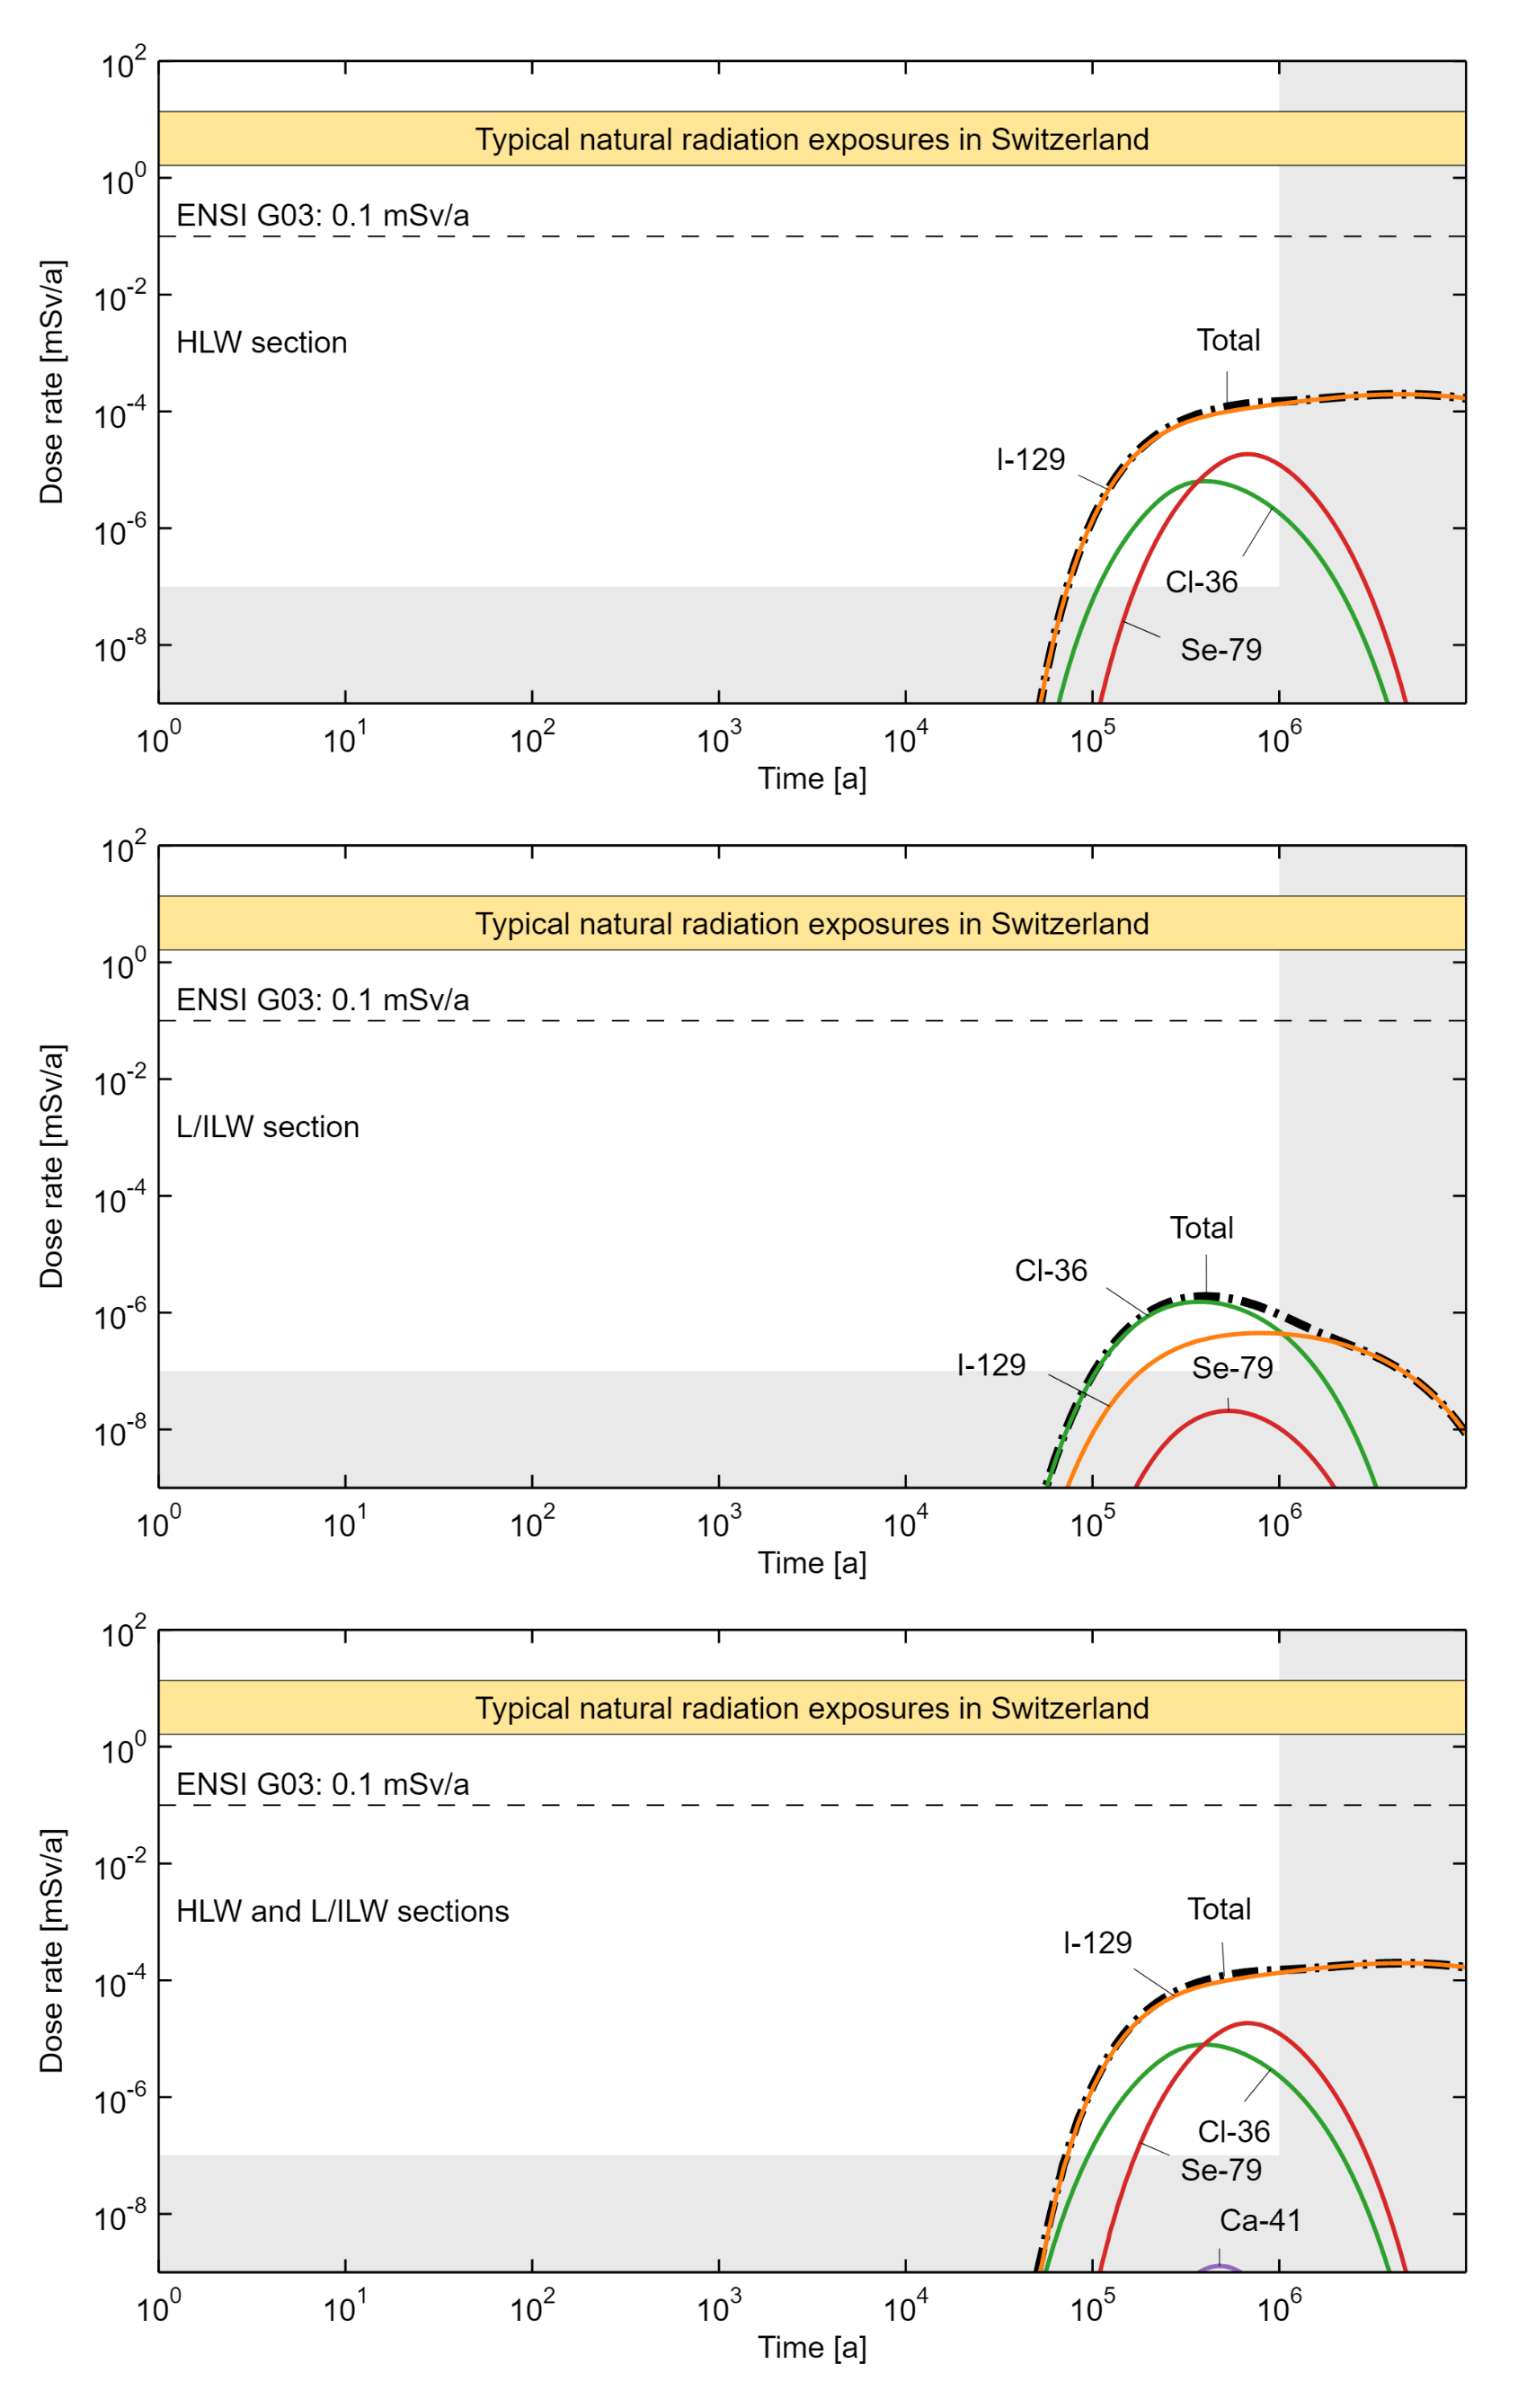
Fig. 8‑3:Dose rates and main contributing radionuclides for the reference calculation case RS-RC assuming radionuclide transport in the aqueous phase
Contribution from HLW repository section (top); contribution from L/ILW repository section (middle); total dose rate for the repository (bottom).
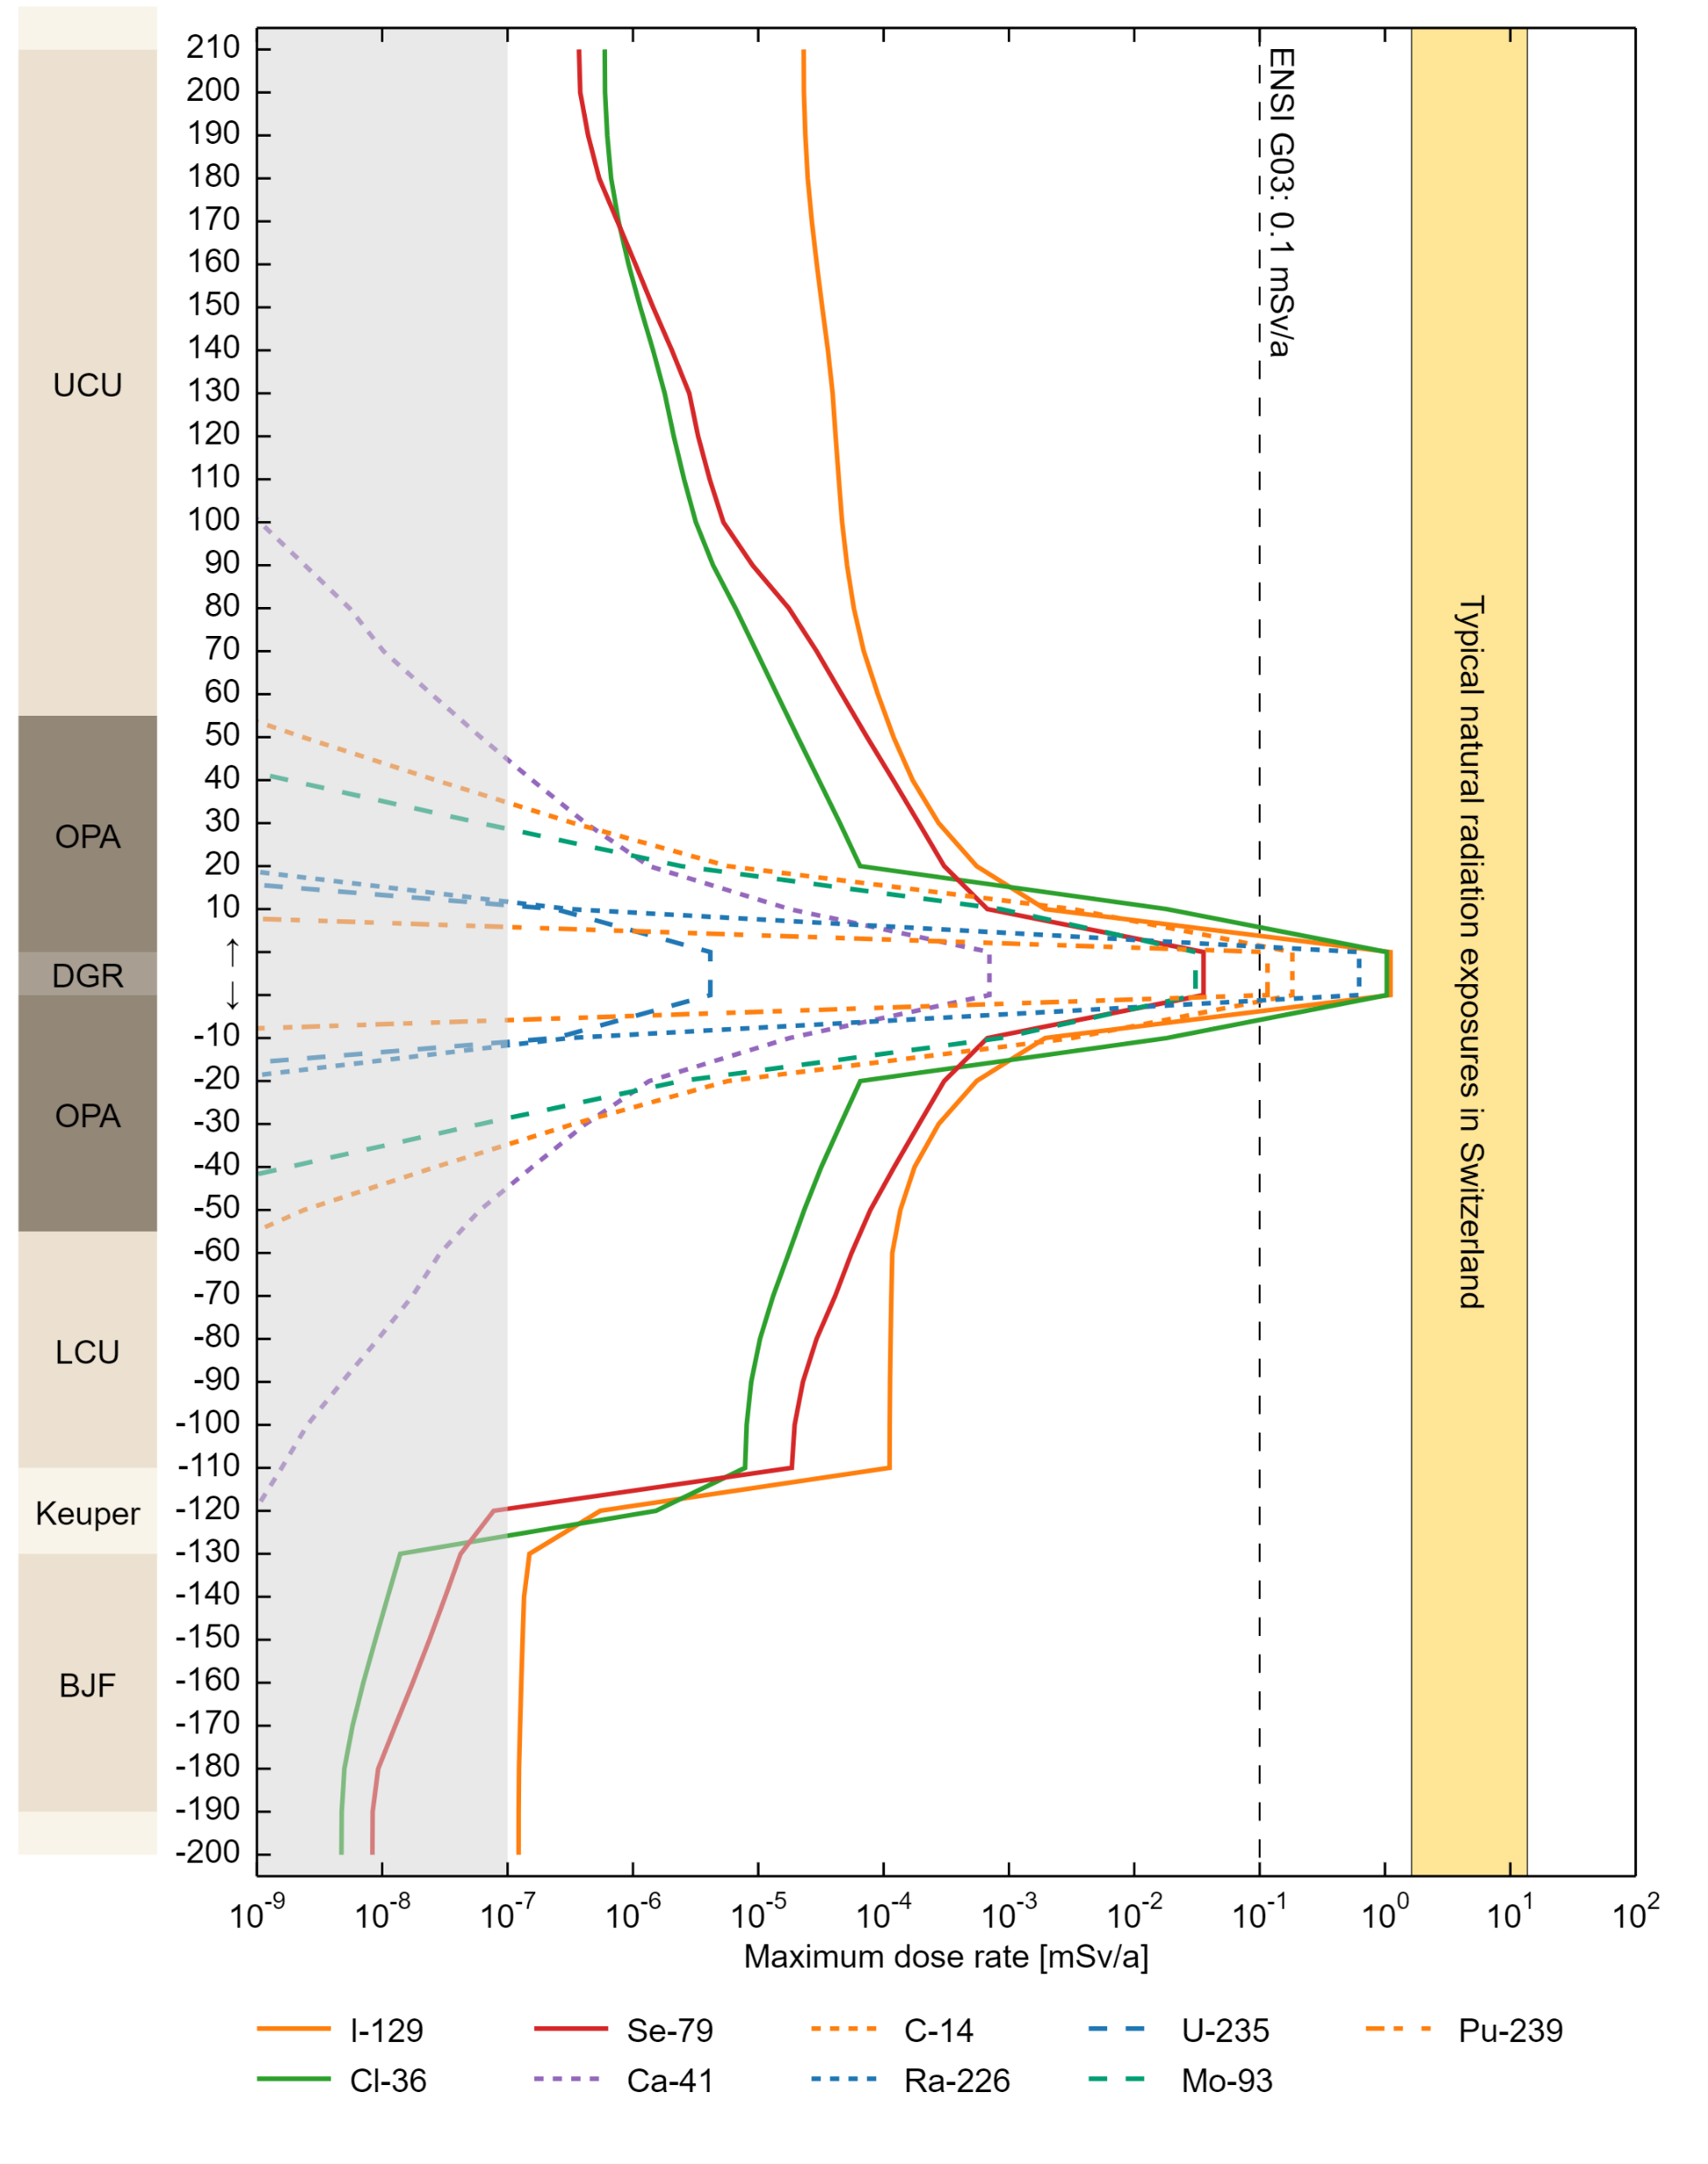
Fig. 8‑4:Hypothetical dose rate contributions of individual radionuclide types for the reference calculation case RS-RC in the aqueous phase based on radionuclide fluxes captured in the near field (one value) and every 10 m in the geosphere model
UCU = upper confining geological units, OPA = Opalinus Clay, DGR = deep geological repository, LCU= lower confining geological units, BJF = Bänkerjoch Formation, groundwater markers indicate the deep groundwater aquifers: Malm (at the top of the UCU), Keuper (in-between the LCU and the BJF) and Muschelkalk (below the BJF). For a selected dose rate on the x-axis (e.g., 10‑5 mSv/a), the reading of the distance on the y-axis (e.g., -30 m) indicates how far a signal of a given radionuclide, expressed as maximum dose rate contribution, reaches (e.g., Ca-41 would contribute ca. 10‑6 mSv/a if the flux of Ca-41 at 30 m into the geosphere could be captured and directly transferred into the biosphere aquifer). Radionuclides with dashed lines would contribute less than 10‑7 mSv/a at the boundary of the Opalinus Clay, ca. 50 m away from the centre of the repository into the geosphere. The sharp drop in the Keuper is due to dilution effects in the aquifer.
One key result of the probabilistic calculation case for the reference safety scenario, RS-PROB, is shown in Fig. 8‑5. The bandwidth of calculated dose rates assuming radionuclide transport in the aqueous phase is shown using the statistical measures of median, 95/5 and 84/16 percentiles, and the maximum and minimum dose rates (individually computed at each time step as maximum and minimum across all the probabilistic calculations).
The dose rates for the probabilistic calculation case remain comfortably two orders of magnitude below the dose protection criterion of 0.1 mSv/a, thus demonstrating an ample safety margin with respect to parameter uncertainty.
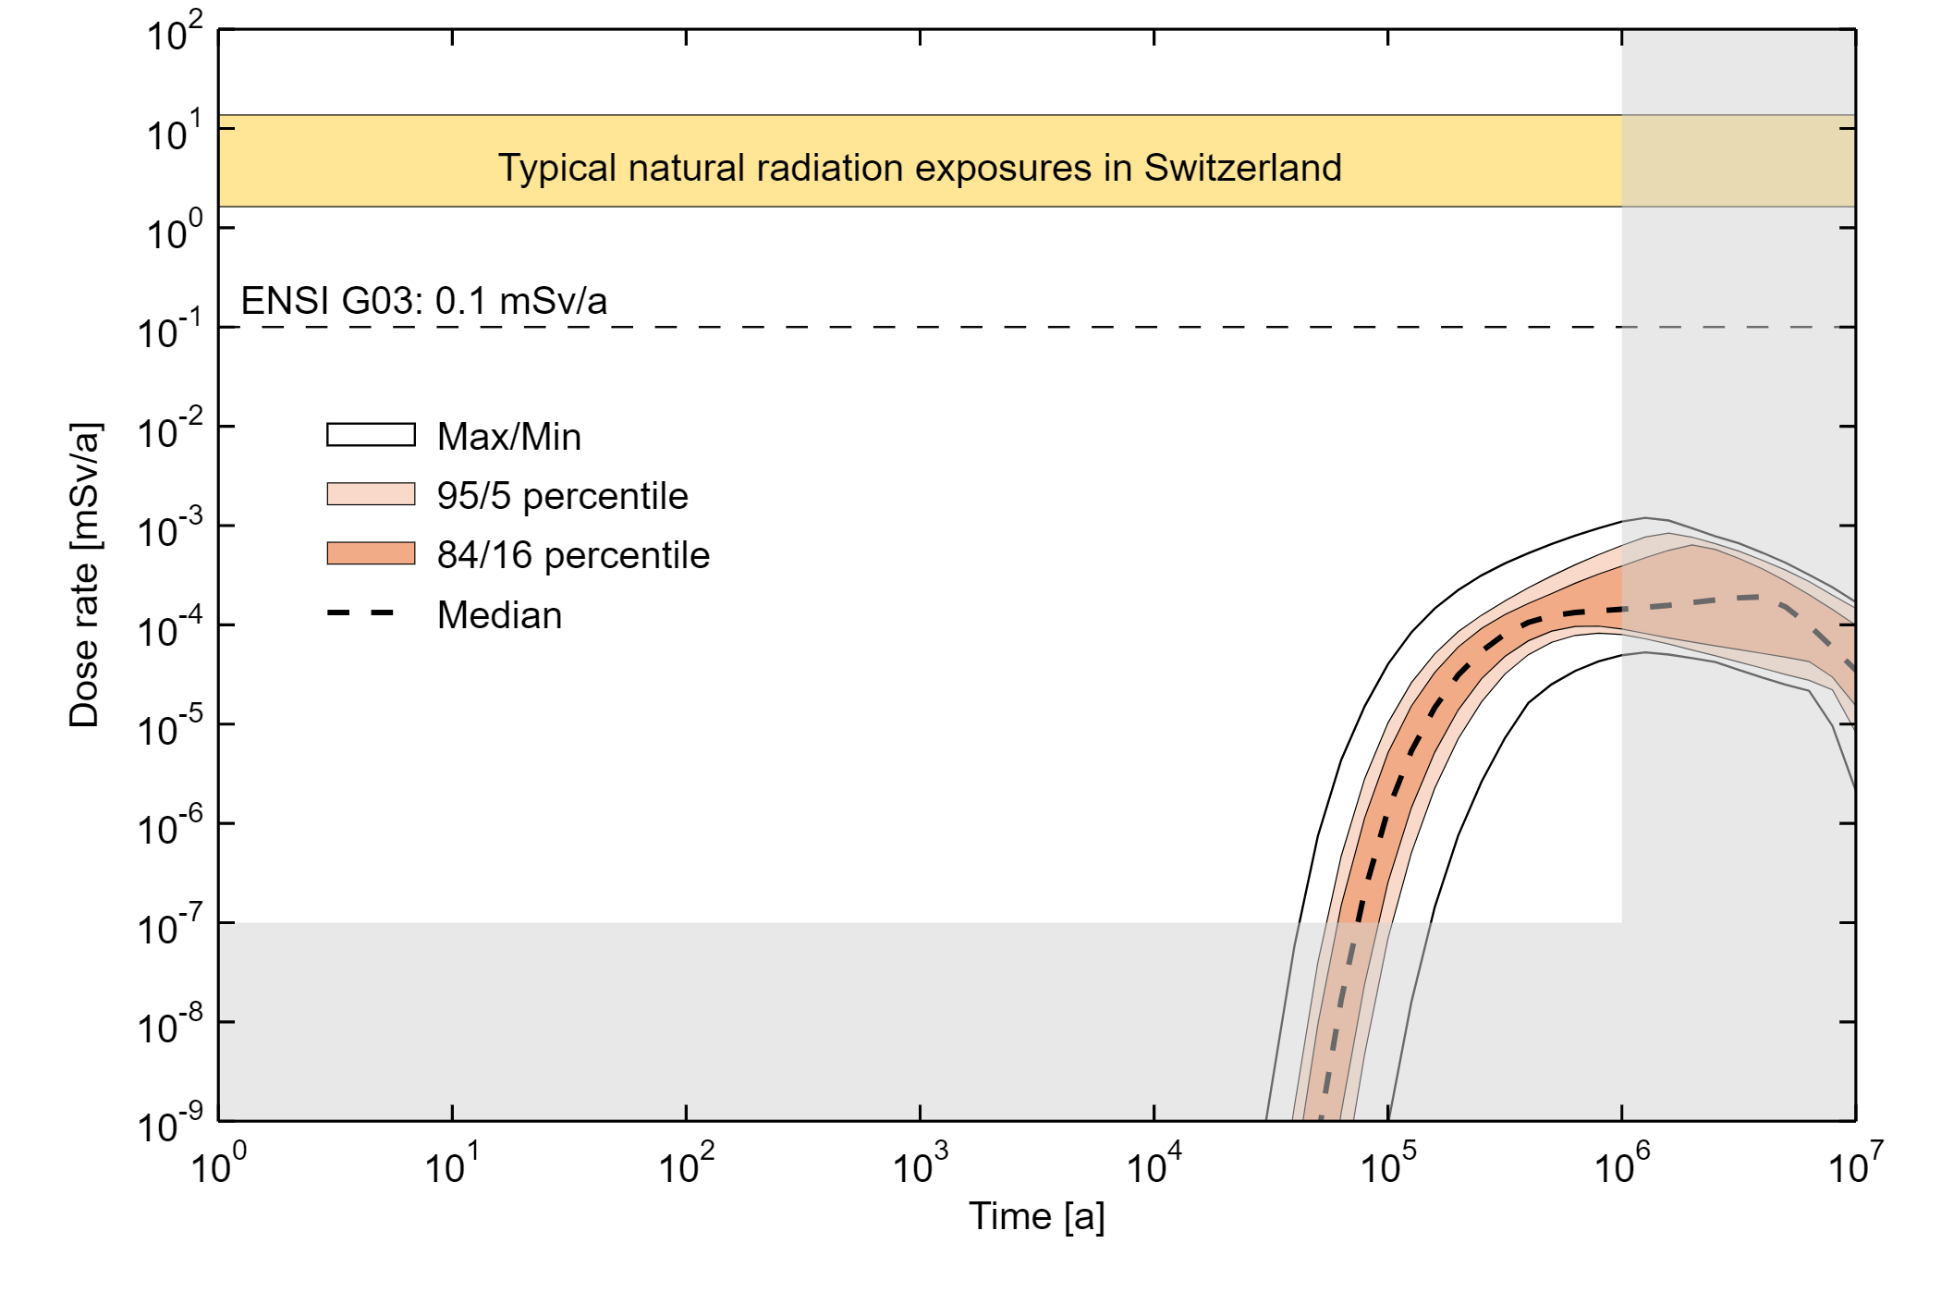
Fig. 8‑5:Dose curves and bandwidths for the probabilistic calculation case assuming radionuclide transport in the aqueous phase
The statistical measures of median, 95/5 and 84/16 percentiles, and the maximum and minimum dose rates individually computed each time as maximum and minimum across all the probabilistic calculations are shown (i.e., the Max/Min lines do not correspond to one calculation case).
So far, we have summarised the results of the reference calculation case and the probabilistic calculation case for the reference safety scenario when considering radionuclide transport in the aqueous phase only. In fact, this is the pathway that contributes most to the dose rates and dominates them. This is illustrated in Fig. 8‑6 which shows the maximum dose rates calculated for the probabilistic calculation case RC-PROB in the form of two boxplots, one where only aqueous phase transport is modelled for all the radionuclides (left side) and one for 14C which, in the form of methane, is the only radionuclide that could significantly contribute to dose rates by migration in the gaseous phase (right side). The maximum dose rates are orders of magnitude smaller in the latter case.
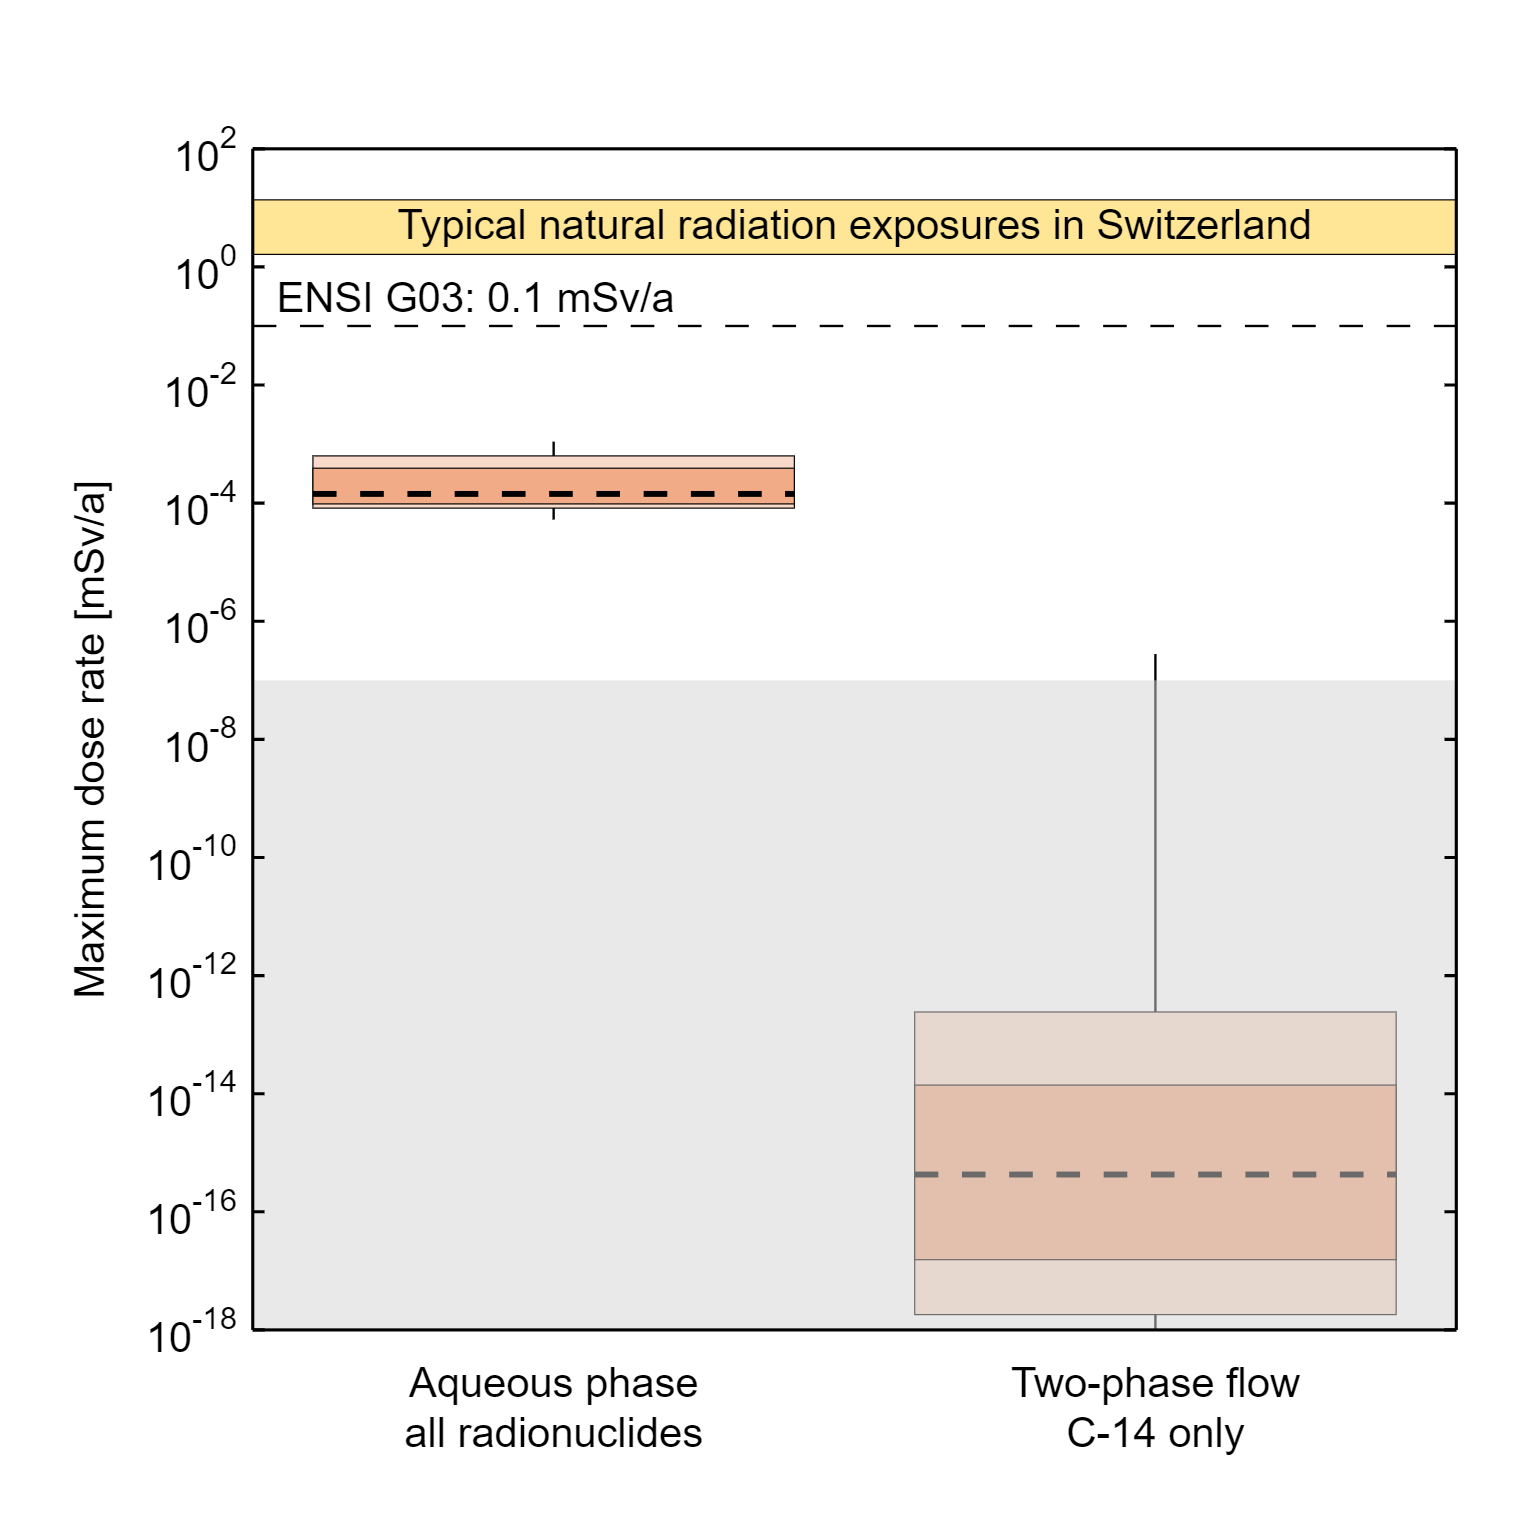
Fig. 8‑6:Summary showing the maximum dose rates for the probabilistic calculation case for the aqueous phase transport (left) and two-phase transport of 14C (right)
The maxima are calculated over a total calculation period of 106 years (see Fig. 8‑5). The boxplots show the statistical measures of median (dashed horizontal line), 95/5 and 84/16 percentiles (light and dark shades of red) and the full extent of the spread between minimum and maximum (thin vertical line).
Both the ample safety margin and the dominance of the aqueous phase transport path are confirmed when analysing the dose rates for all the deterministic cases linked to the reference scenario (Fig. 8‑7). For the aqueous phase transport (Fig. 8‑7a), the results for the warmer and drier biosphere (RS-BIOS/WARM_DRY) and for the pessimistic calculation case (RS-CMB) lead to dose rates that are roughly within the probabilistic bandwidth of the calculation case RS-PROB. However, they are – expectedly – higher than the dose rates of the reference calculation case (RS-RC). The results of the calculation case with assumptions of the inactive Keuper aquifer below the HLW repository section (RS-KEUPER_INACTIVE) and of the two cases with a colder (RS-BIOS/COLD) or a drained farmland biosphere (RS-BIOS/DRAINED_FARMLAND) with lower BDCFs, lead to dose rates that are one to four orders of magnitude below those of the reference calculation case – leaving very large safety margins.
In Fig. 8‑7b, the dose rate for the pessimistic calculation case RS-CMB is shown for the two-phase transport of 14C (mainly transported as methane). It is larger than 10-7 mSv/a for a short time – but still very low. The resulting dose rates for the other deterministic calculation cases for the reference scenario and this transport pathway all remain below 10-9 mSv/a.

Fig. 8‑7:Dose curves for the reference case and for other deterministic calculation cases within the reference scenario, showing the contributions of aqueous phase transport (a) and two-phase transport of 14C (b)
In summary, both the probabilistic and deterministic results for the reference safety scenario demonstrate that the regulatory dose protection criterion is respected. The probabilistic results show a safety margin of more than two orders of magnitude for the 95 percentile and close to three orders of magnitude for the median. The most pessimistic deterministic case has a maximum dose rate occurring after roughly one million years that is still about two orders of magnitude below the regulatory protection criterion. Thus, for the expected evolution of the repository and considering parameter uncertainty within this evolution path, it can be demonstrated with a high level of confidence that humans and the natural environment will not be exposed to harm.