
The effects of parameter uncertainty on performance indicators are analysed probabilistically to identify any possible combinations of parameters that could give rise to a TH evolution of the repository that could damage or degrade the performance of the barriers and perturb the repository safety functions.
Fig. 6‑10 outlines, as an example, a probabilistic workflow with the temperature in the bentonite buffer (TB) as a performance indicator, calculated from simulations of the temperature distribution in the HLW near field. The buffer temperature is of concern, because, if it is too high, the possibility of thermally induced geochemical alteration cannot be excluded, which could alter key buffer properties, such as its swelling capacity and plasticity. Thermally induced geochemical alteration of the buffer is referred to as a deviation in performance, which, if it cannot be excluded, is propagated to safety scenario development and to the analysis of radiological consequences.
The workflow starts with the definition of uncertainty ranges for thermal and hydraulic parameters as explained in detail in Chapter 3 of NAB 24‑25 (Nagra 2024k). Representative parameter values from these ranges are selected as a reference case. In addition, 100 Latin Hypercube samples are taken for the probabilistic realisations. TH-simulations of the HLW near field are carried out for a model domain consisting of a 2D vertical cross-section through the repository centre (Fig. 6‑10 central figure). Transients of the performance indicator TB are monitored at a control point in the bentonite buffer, 7.5 cm above the canister. For each simulation, the maximum temperature, TB,max, is calculated and is normalised by dividing by the performance target of Tmax = 150°C, yielding a dimensionless performance index, denoted by NBT. The performance target represents the maximum temperature in dry bentonite that can be maintained without causing irreversible geochemical alterations. A histogram showing both a probability density function (PDF) and cumulative density function (CDF) of NBT aids in calculating whether Tmax could be exceeded. Additional details on the workflow are given in NTB 24‑22 Rev. 1 (Nagra 2024u).
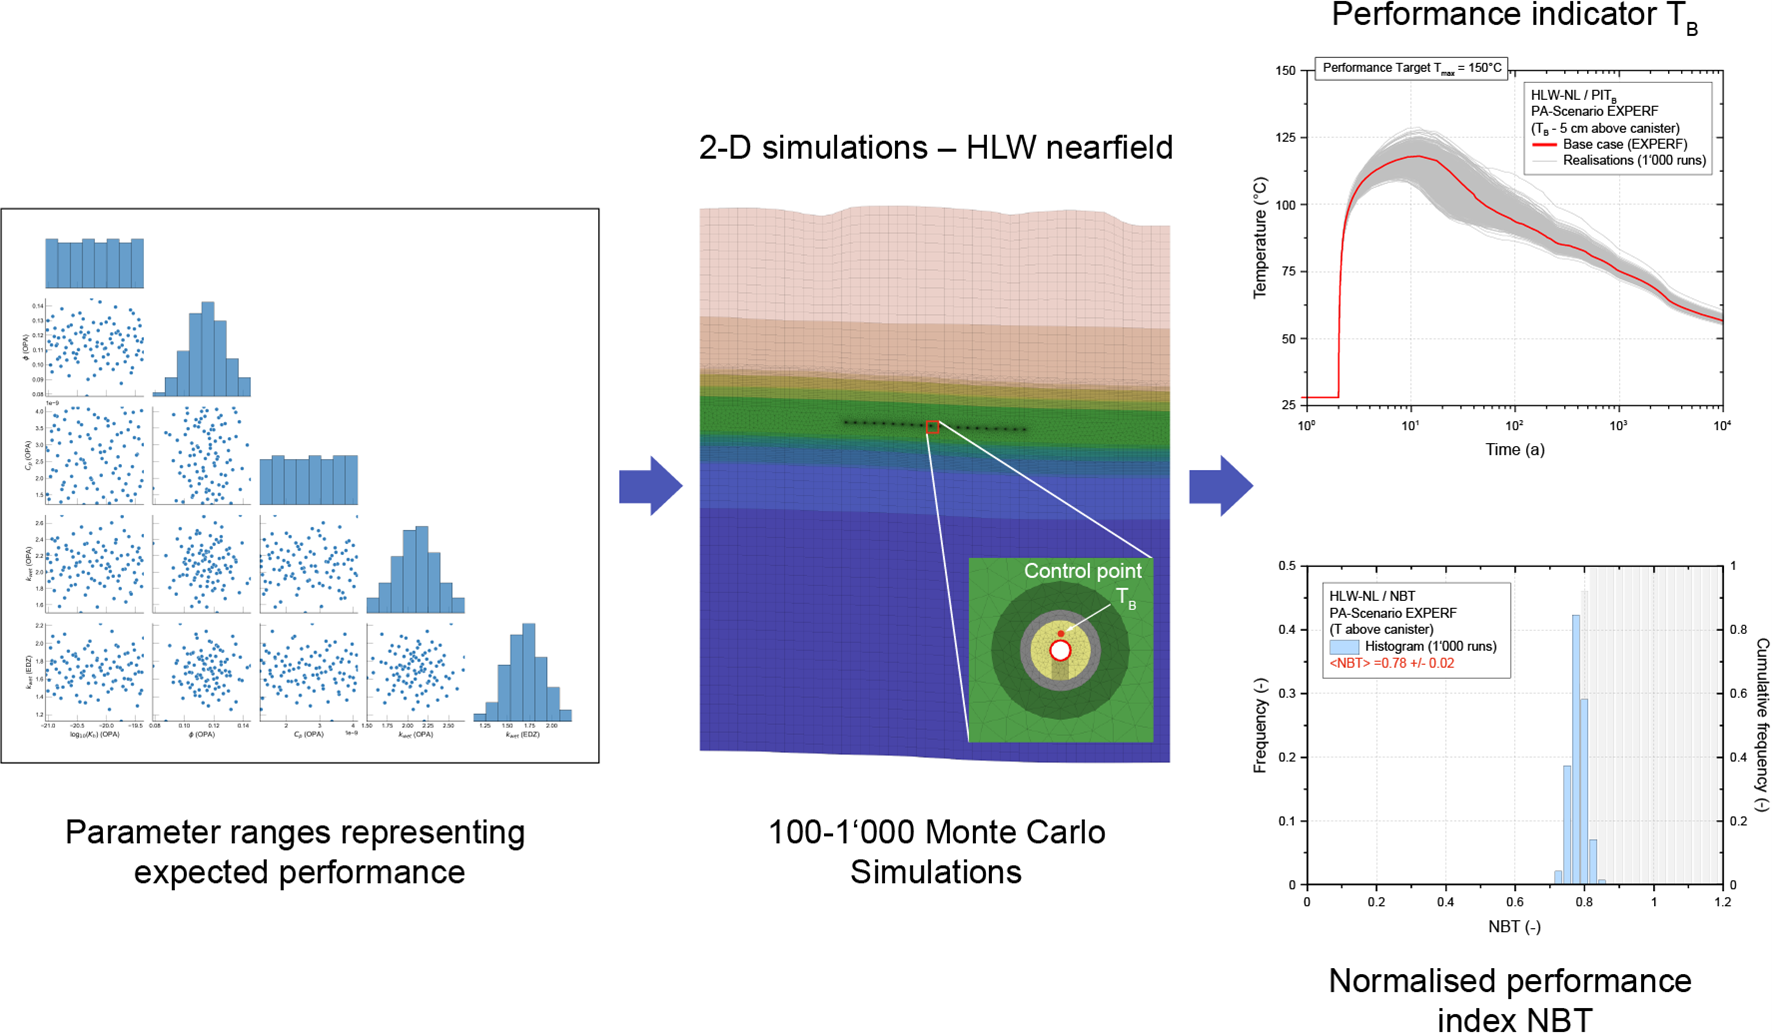
Fig. 6‑10:Probabilistic workflow for the simulation of the temperature distribution in the HLW near field, with the bentonite temperature (TB) as a performance indicator
Scatter-plot matrix of the 100 Latin Hypercube samples from distributions of thermal and hydraulic input parameters (left); Close-up of the 2D model through the centre of an HLW emplacement drift, with the control point representing the performance indicator TB in the bentonite buffer (centre); Transients of the performance indicator TB comprising the reference case and 100 probabilistic realisations, representing the uncertainty range of the performance indicator (right above). Finally, histograms with probability density function and cumulative density function of NBT (right below) aid in calculating performance margins and evaluation scales (see Nagra 2024k for further details).
The results show that, in this example, the performance target is met with a wide safety margin. The same is true for other performance indicators considered in the PA (Nagra 2024u), indicating that, over a wide range of conditions spanning all identified parameter uncertainties, the integrity of the barriers will be maintained, and the system is expected to perform its safety functions as designed.