
The total system performance depends on the thermohydraulic (TH) evolution of the repository system. Detailed TH analyses are described in NTB 24‑22 Rev. 1 (Nagra 2024u) and NAB 24‑25 (Nagra 2024k) and the results are summarised briefly in the following paragraphs.
Fig. 6‑7 shows temperature transients simulated with a 3D repository model over a one-million-year period, including the construction, ventilation14, and post-closure phases. In HLW emplacement drifts, temperature spikes due to heat-generating waste, then decreases back to ambient temperature. Sections of the operations tunnel near the emplacement area also see temperature increases due to their proximity. In the L/ILW emplacement caverns, temperature returns from the relatively low values caused by ventilation to ambient within ~ 3,000 years and does not exceed it. The central repository area (not shown in the figure) shows no significant temperature changes due to heat generated by HLW.
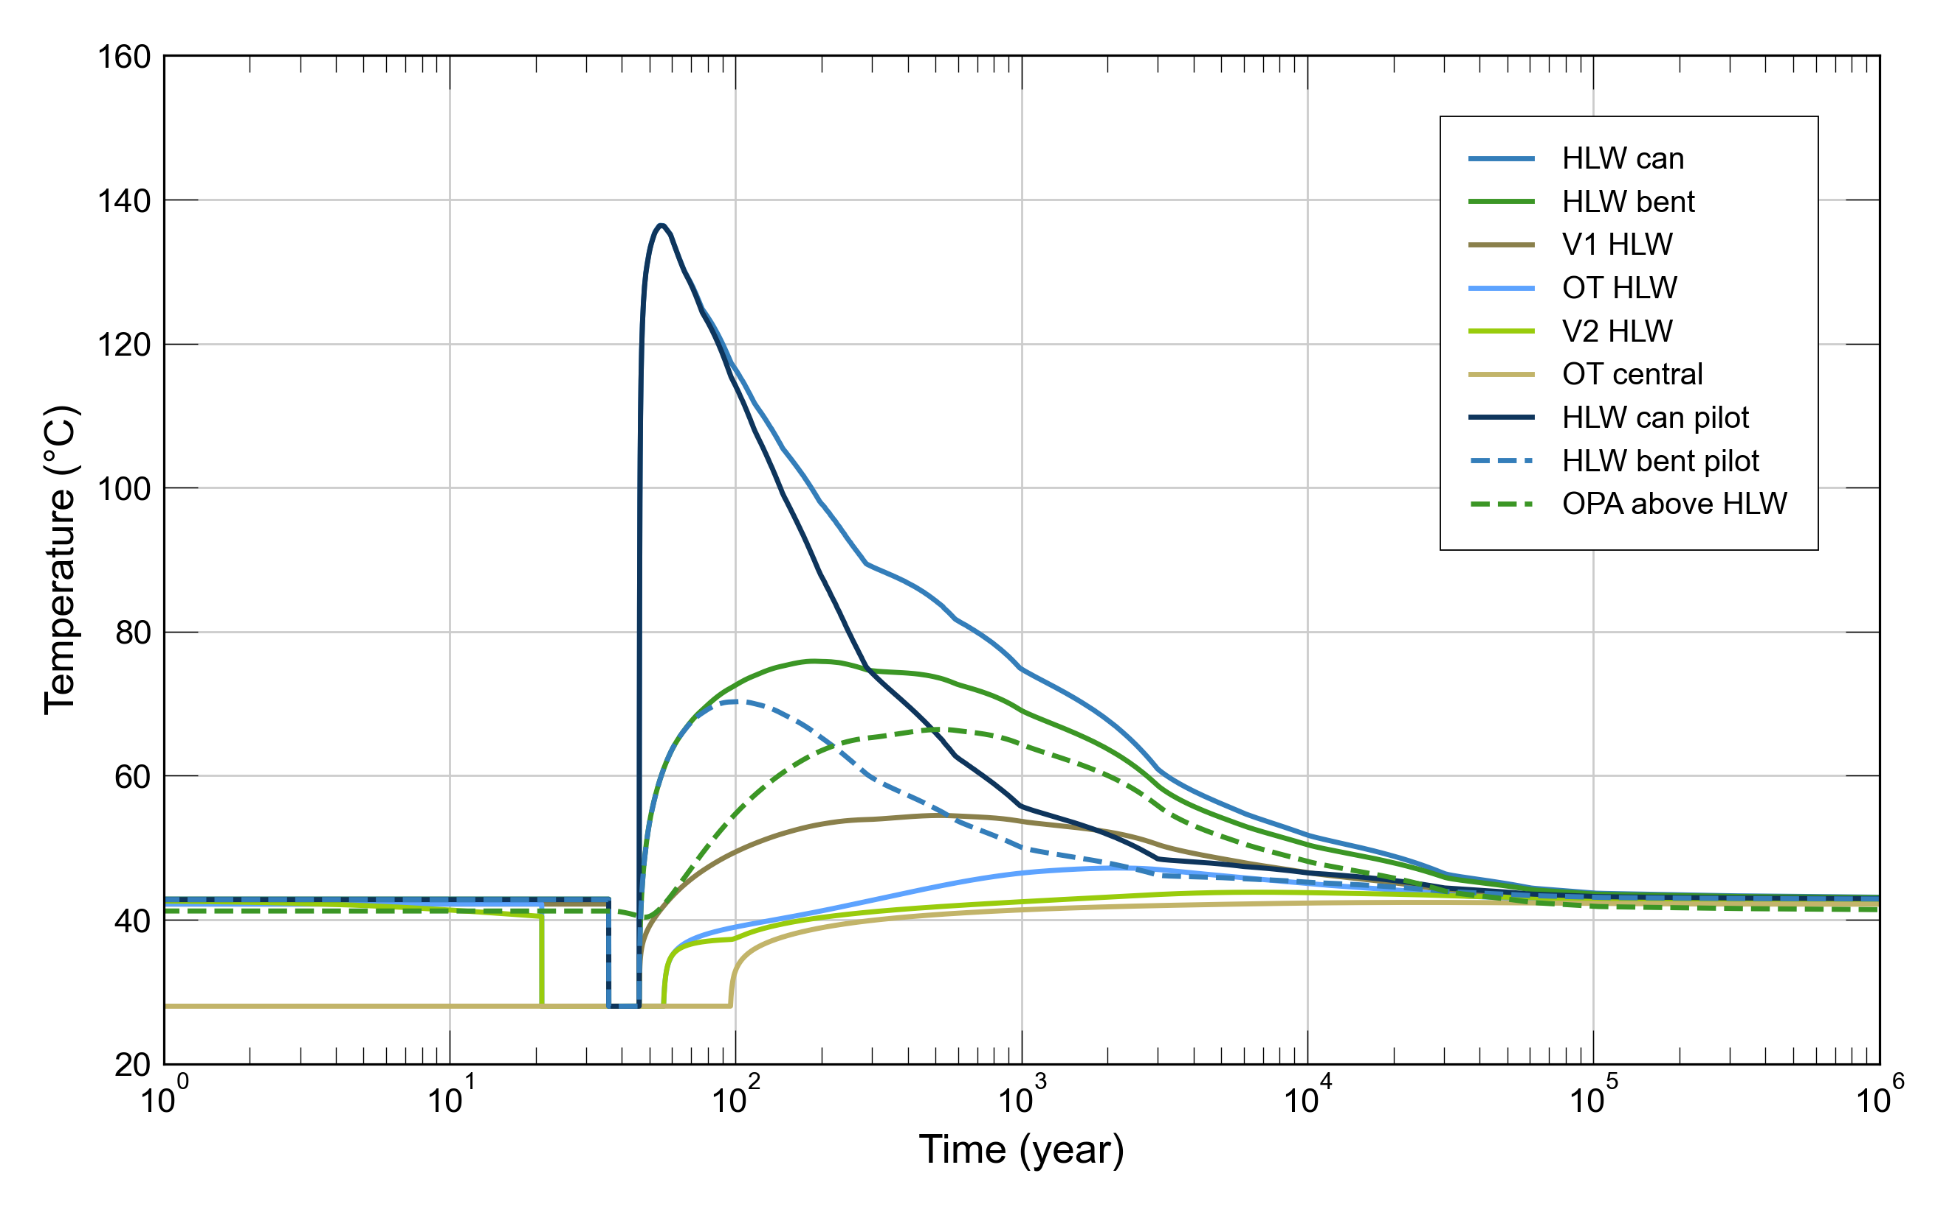
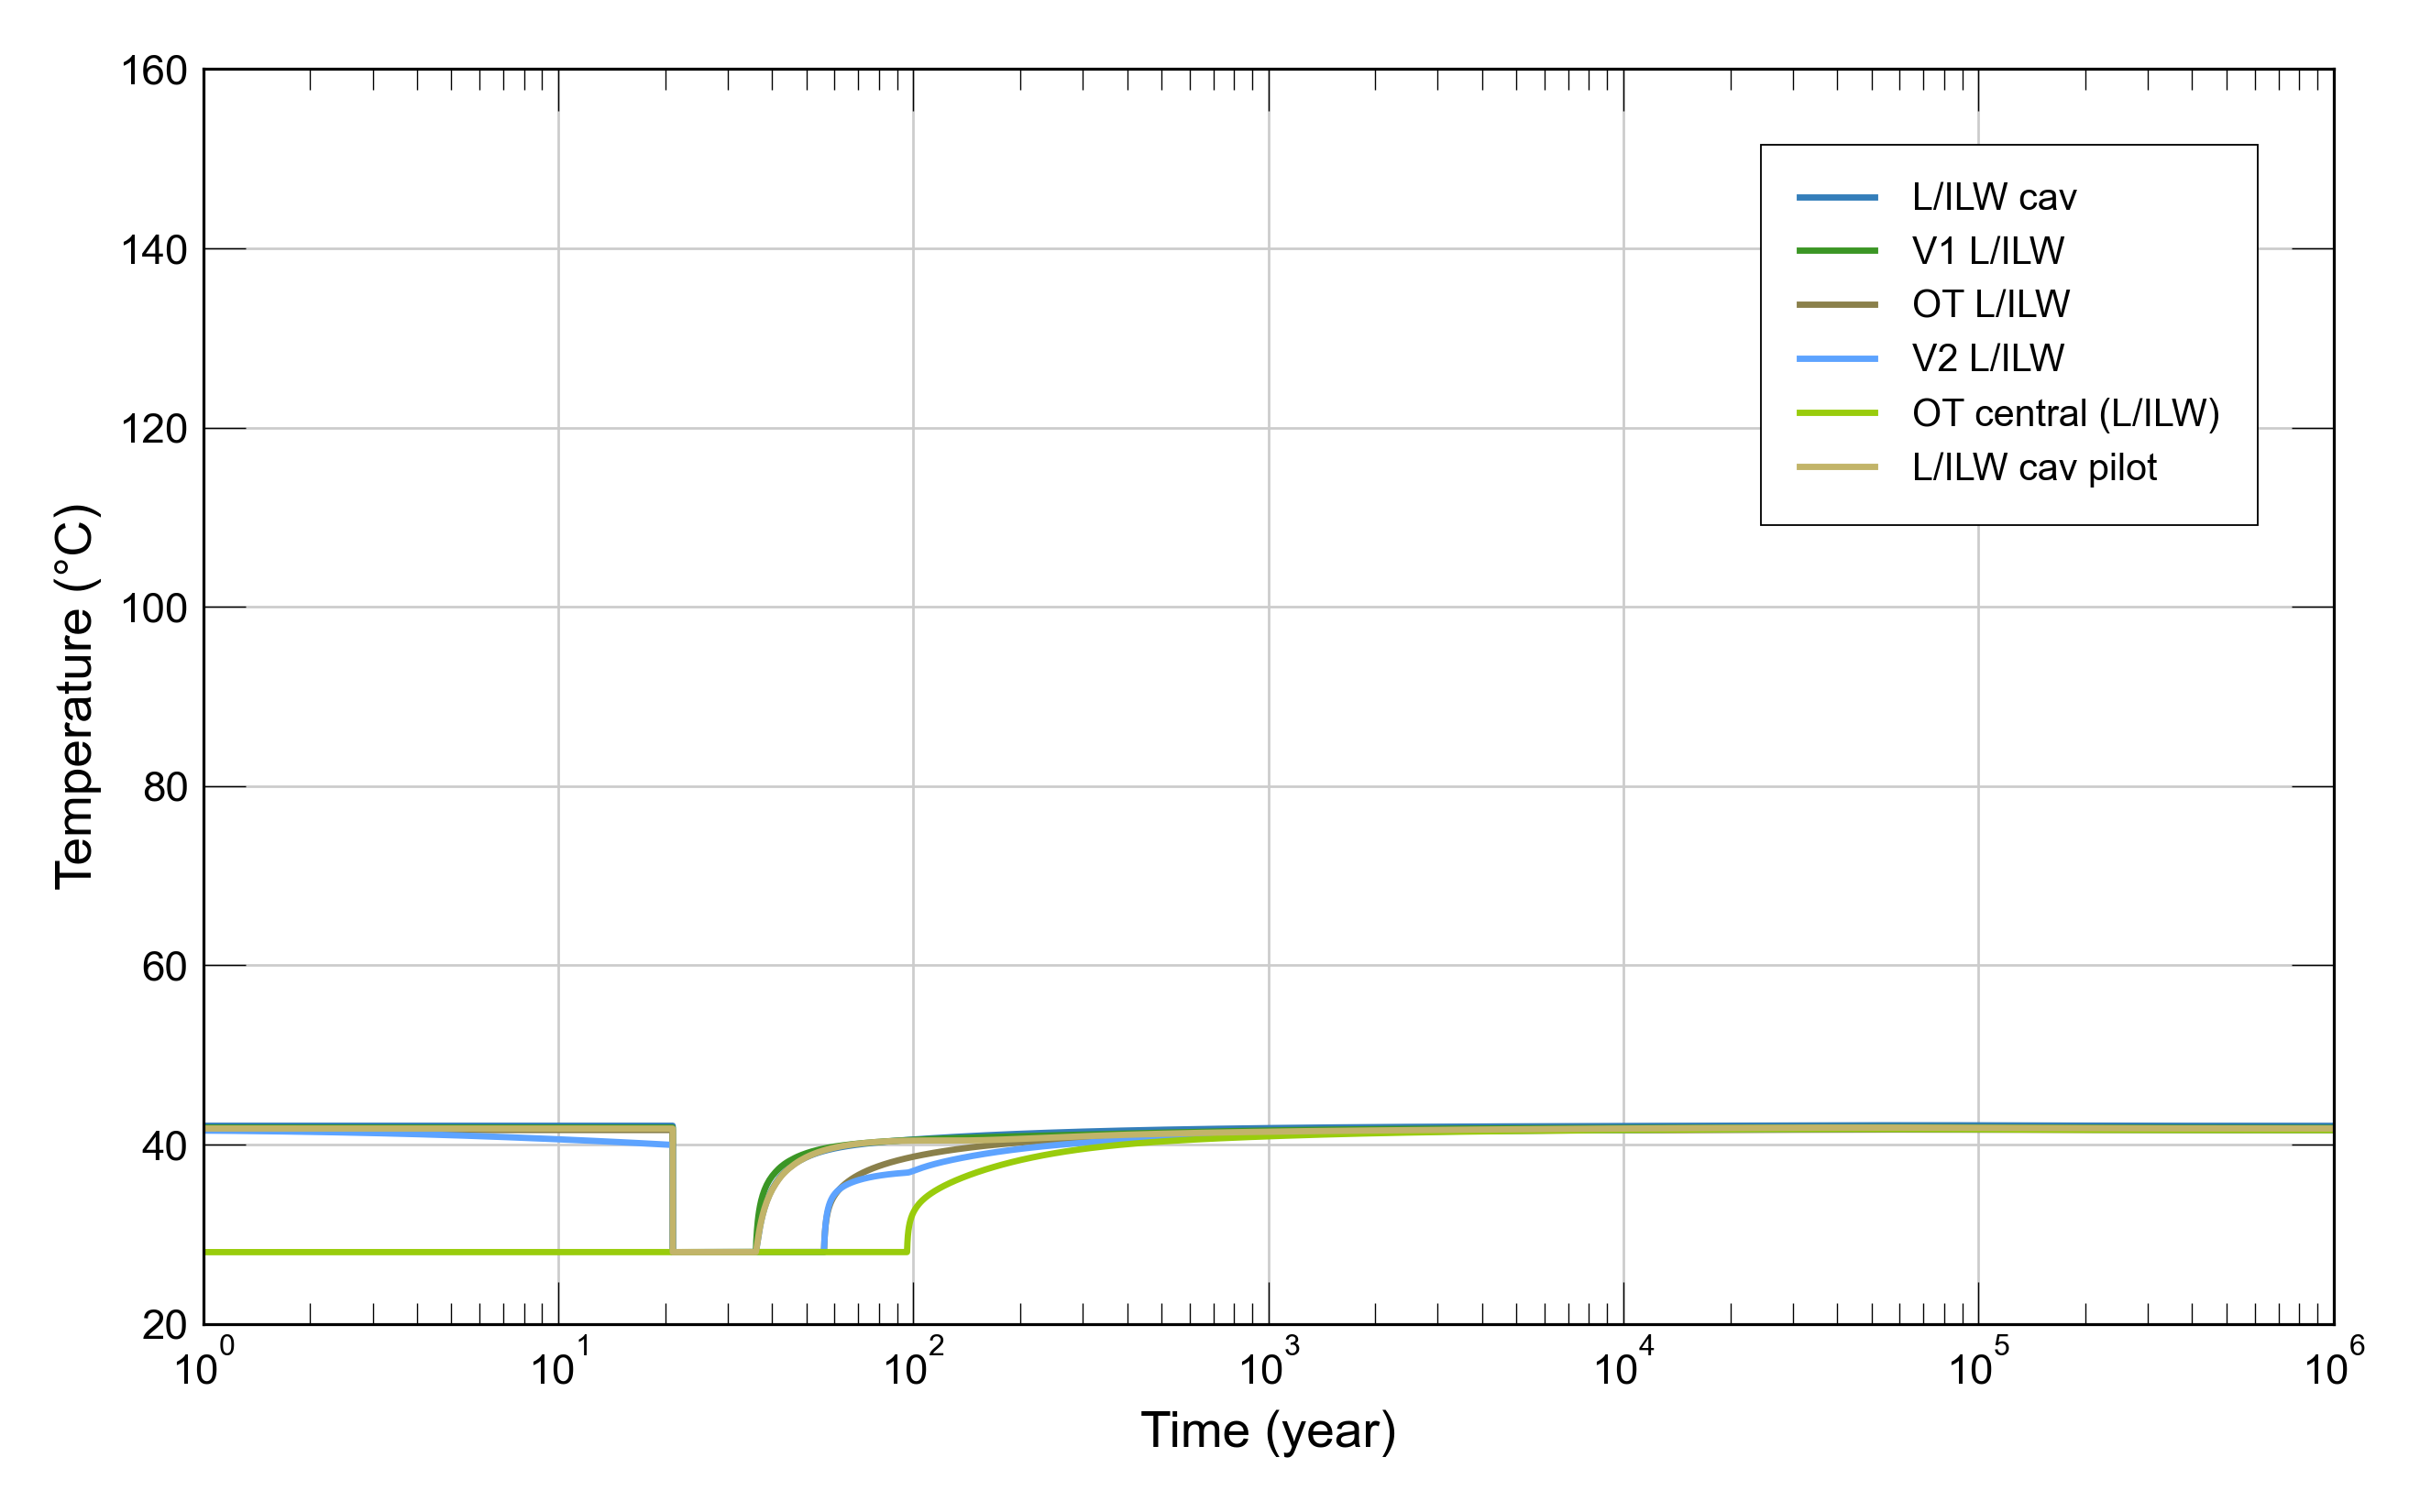
Fig. 6‑7:Assessment of total system: transients of temperature in the HLW repository section (top) and in the L/ILW repository section (bottom)
V1: cavern or drift seal, OT: operation tunnel, V2: repository section seal, pilot: pilot facility. For more details see Section 5.3 in Nagra 2024o.
Fig. 6‑8 shows gas saturation transients from the same simulation. In the HLW repository section (top figure), local gas saturation depends on the backfill material. The operations tunnel, backfilled with high-porosity material, shows increasing gas saturation over time, with the upper parts of this tunnel accumulating more gas. Sections backfilled with bentonite fully saturate with water. HLW drifts saturate with water between 200 and 300 years after emplacement, with the V1-HLW and V2-HLW seals fully saturating after ~ 500 and ~ 3,000 years, respectively. Gas generation is expected to increase after 10,000 years, when the disposal canisters must be assumed to breach and their inner surfaces start to corrode, leading to a gas phase formation in the buffer surrounding the canisters.
In L/ILW emplacement caverns (bottom figure), gas saturation decreases as porewater enters until, after ~ 10,000 years, it increases again due to the corrosion of metals and the degradation of organics. Gas saturation in the operations tunnel increases continuously after backfilling. The central repository area (not shown) also undergoes increasing gas saturation after closure. A continuous gas pathway forms along the repository level emplacement caverns, galleries, and seals over a one-million-year period. The V3 seal in the shaft, composed mainly of compacted bentonite, fully saturates with water after ~ 4,000 years.
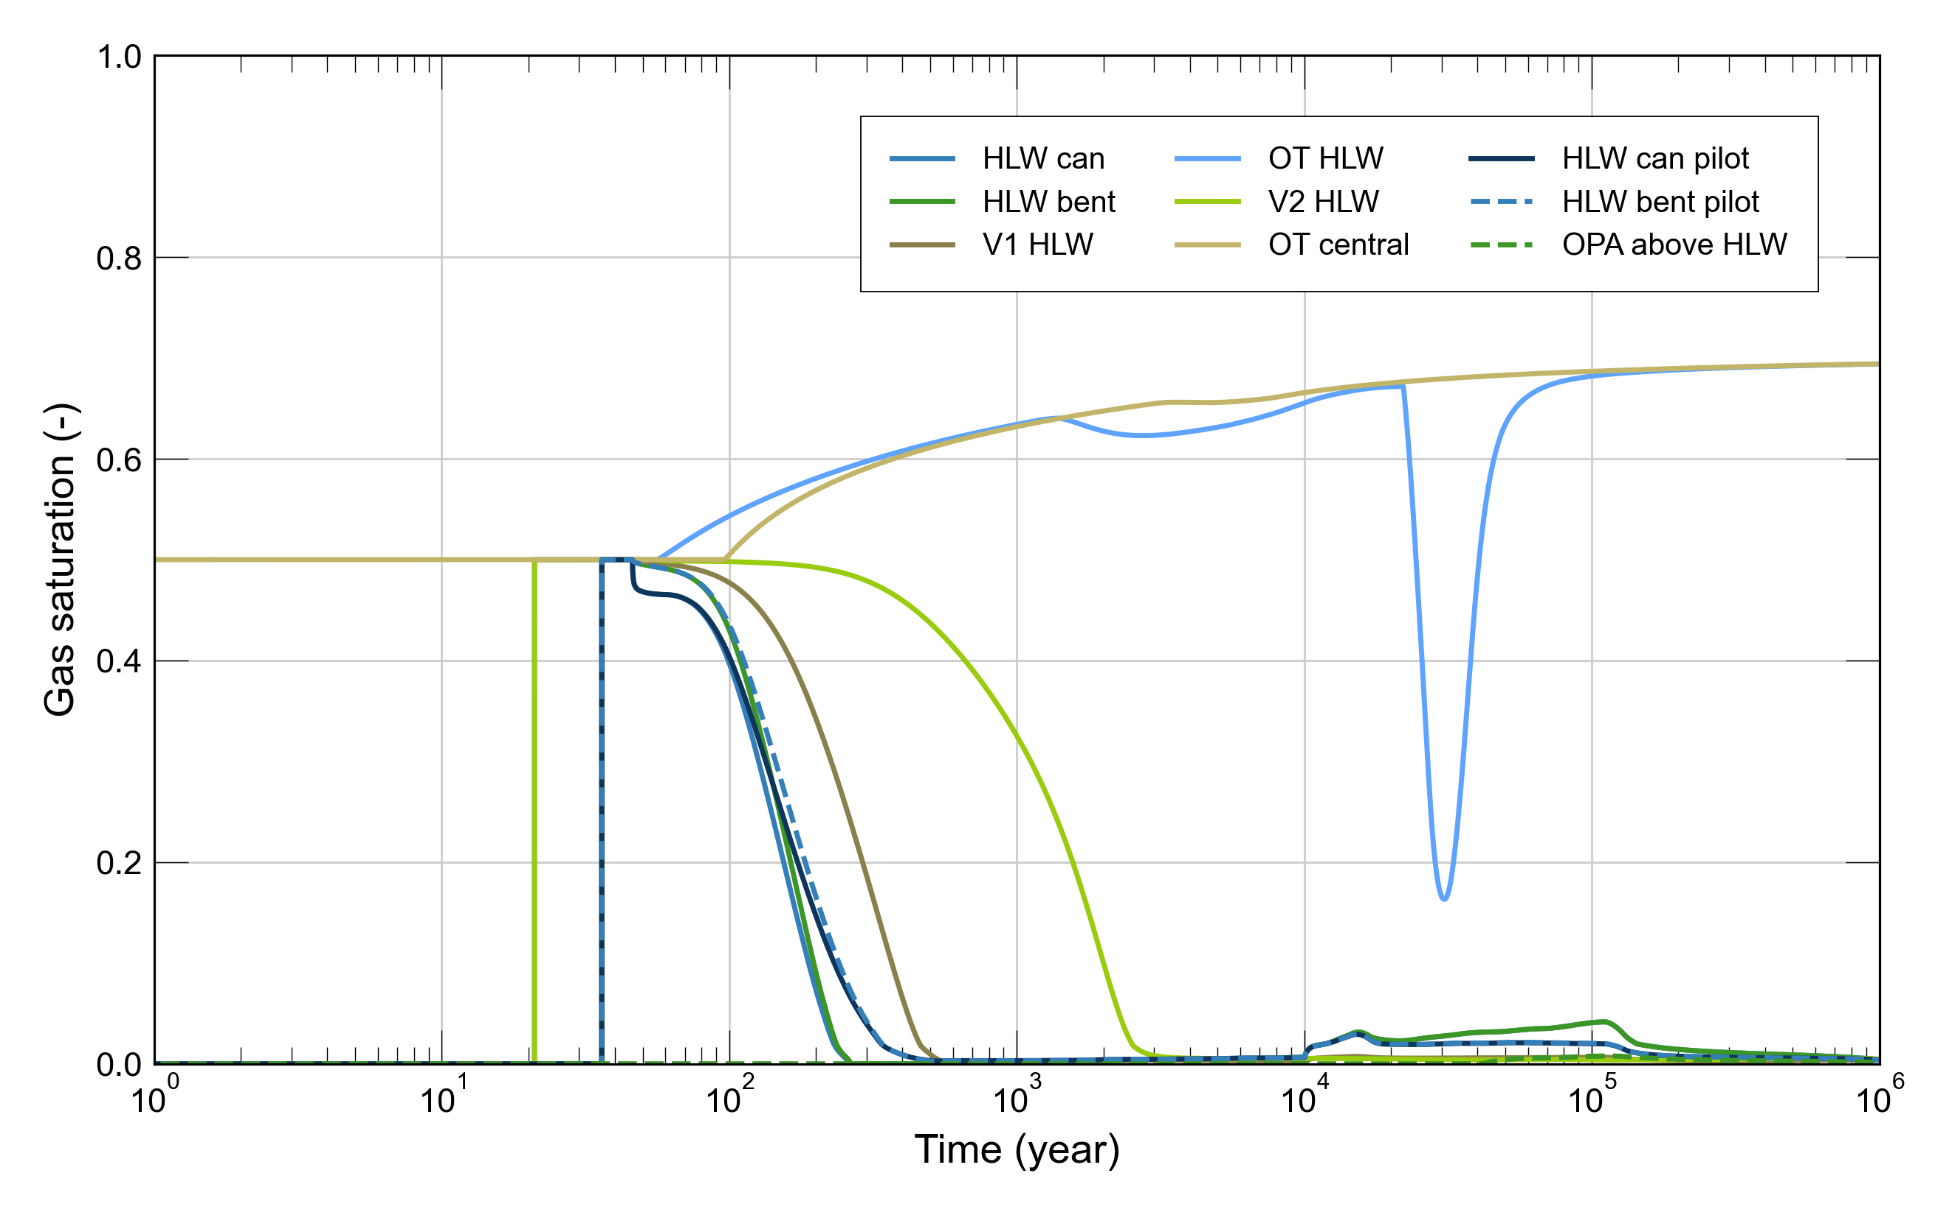
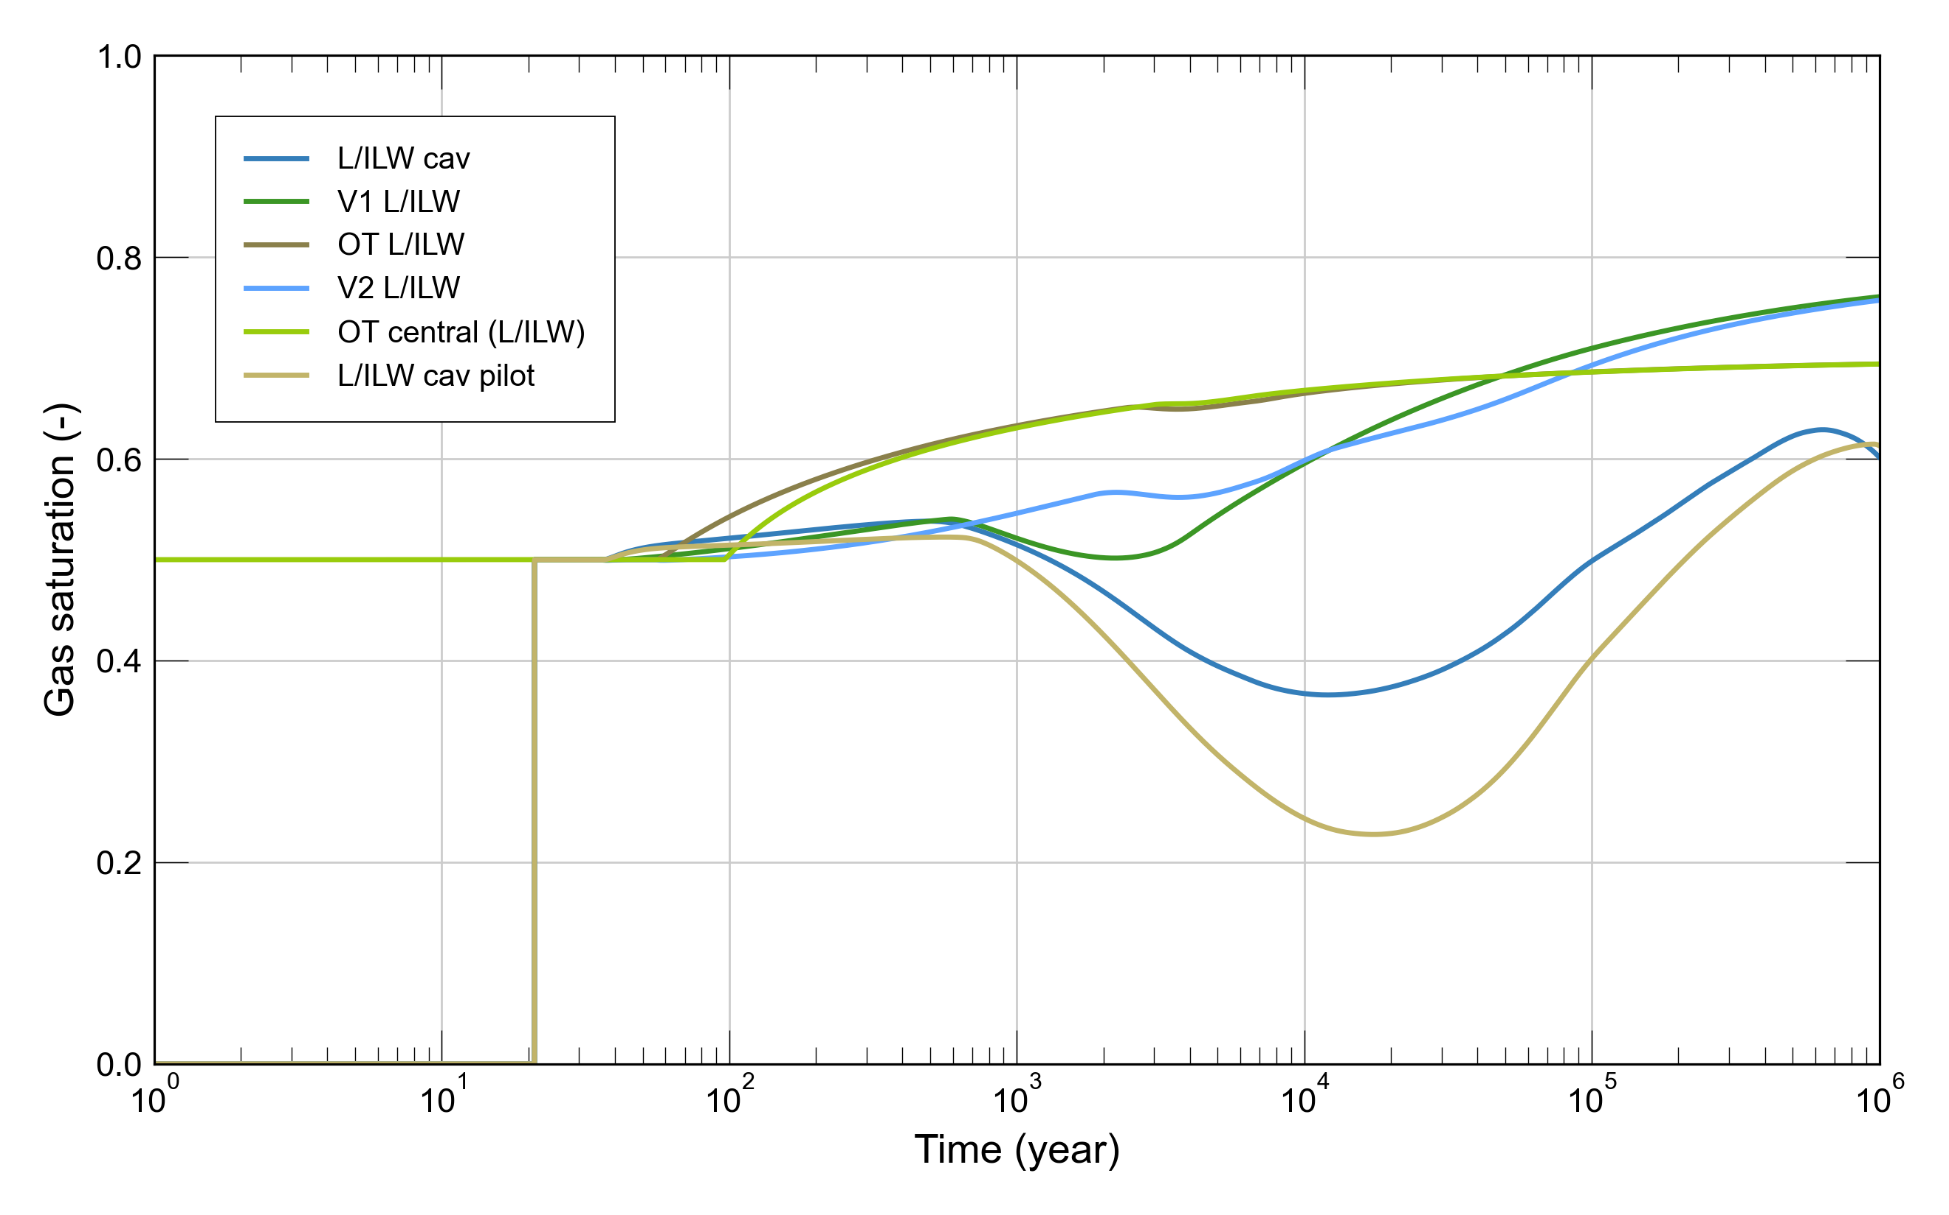
Fig. 6‑8:Assessment of total system: transients of gas saturation in the HLW repository section (top) and in the L/ILW repository section (bottom)
V1: cavern or drift seal, OT: operations tunnel, V2: repository section seal, pilot: pilot repository. For more details see Section 5.3 in Nagra 2024o.
Transient fluid pressure evolution, again from the same simulation, is shown in Fig. 6‑9. Note that pressure shown in the figure corresponds to gas pressure when a gas phase is present, and water pressure when only water is present. In the early post-closure phase (~ 1,000 years), pressure increases in the Opalinus Clay surrounding the HLW repository section due to differential thermal expansion caused by the heat emitted from the waste (Fig. 6‑10, top), reaching a peak of ~ 13 MPa after 200 years at 30 m above the centre of the HLW repository section.
By contrast, thermally induced pressures within the HLW emplacement drifts do not significantly exceed hydrostatic values. After the thermal pulse has dissipated, pressure in the HLW drifts begins to increase due to gas accumulation from the corrosion of the canisters. Upon canister breaching, assumed to occur at 10,000 years, corrosion and gas generation rates increase, and gas pressure reaches a first peak of ~ 10.5 MPa after 15,000 years, followed by a peak of ~ 11.8 MPa after ~ 115,000 years, after which gas pressure decreases towards hydrostatic since the canister has corroded away and gas generation has ceased.
In the L/ILW emplacement caverns (Fig. 6‑9, bottom), pressure starts to increase from about 36 years after emplacement due to the accumulation of waste-generated gas, reaching hydrostatic pressure after ~ 20,000 years and a peak pressure of ~ 9.3 MPa after ~ 70,000 years. Pressure in the operations tunnel and sealing sections of the L/ILW repository section follows a similar path of evolution, due to the hydraulic connection and continuous gas pathways in these repository structures. The same is observed in the pressure evolution in the central area of the repository (not shown in the figure). On the other hand, the fast restoration of hydrostatic pressure in the shaft above the V3 seal is indicative of the hydraulic separation of the shaft from the repository provided by the seal (Nagra 2024o).
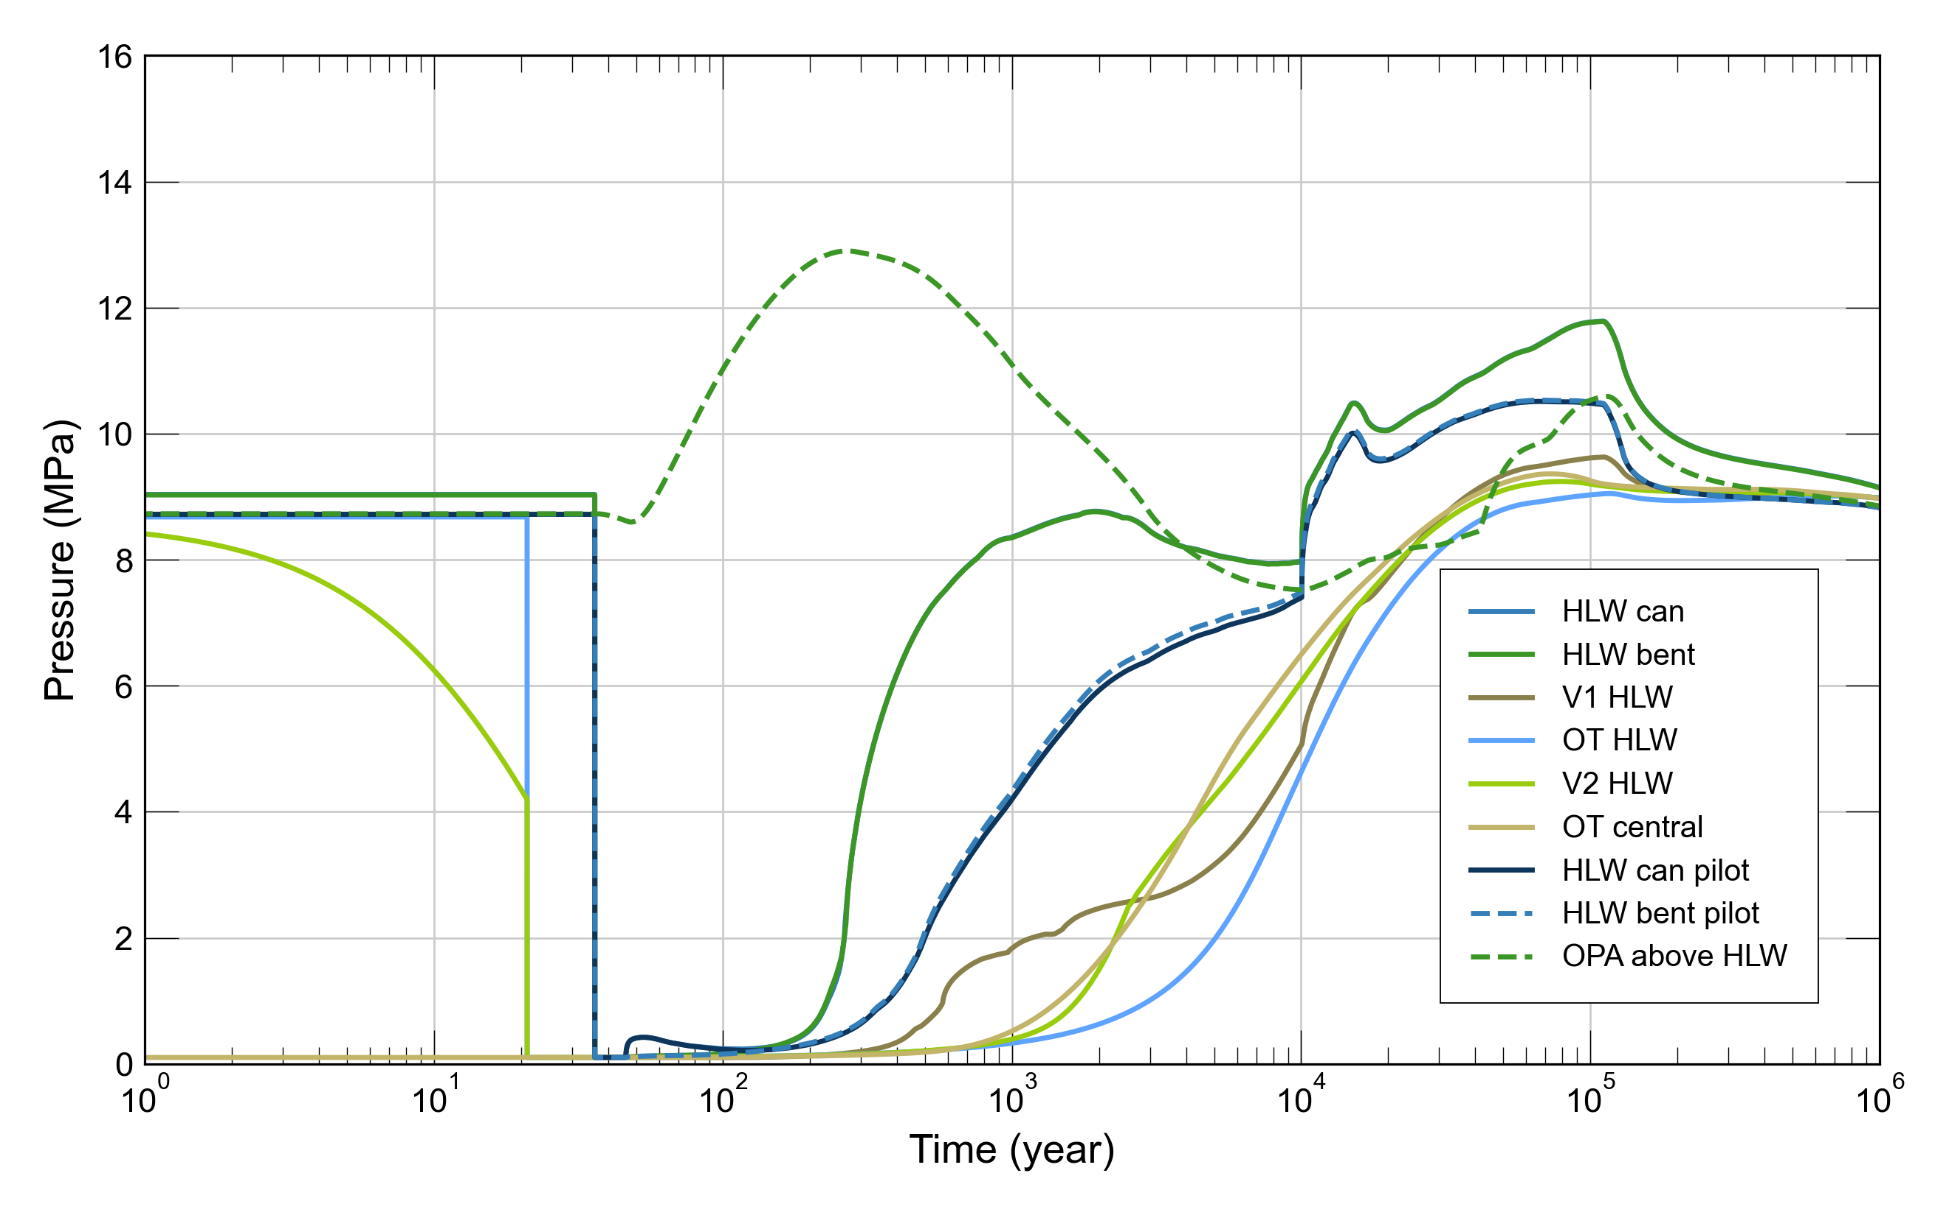
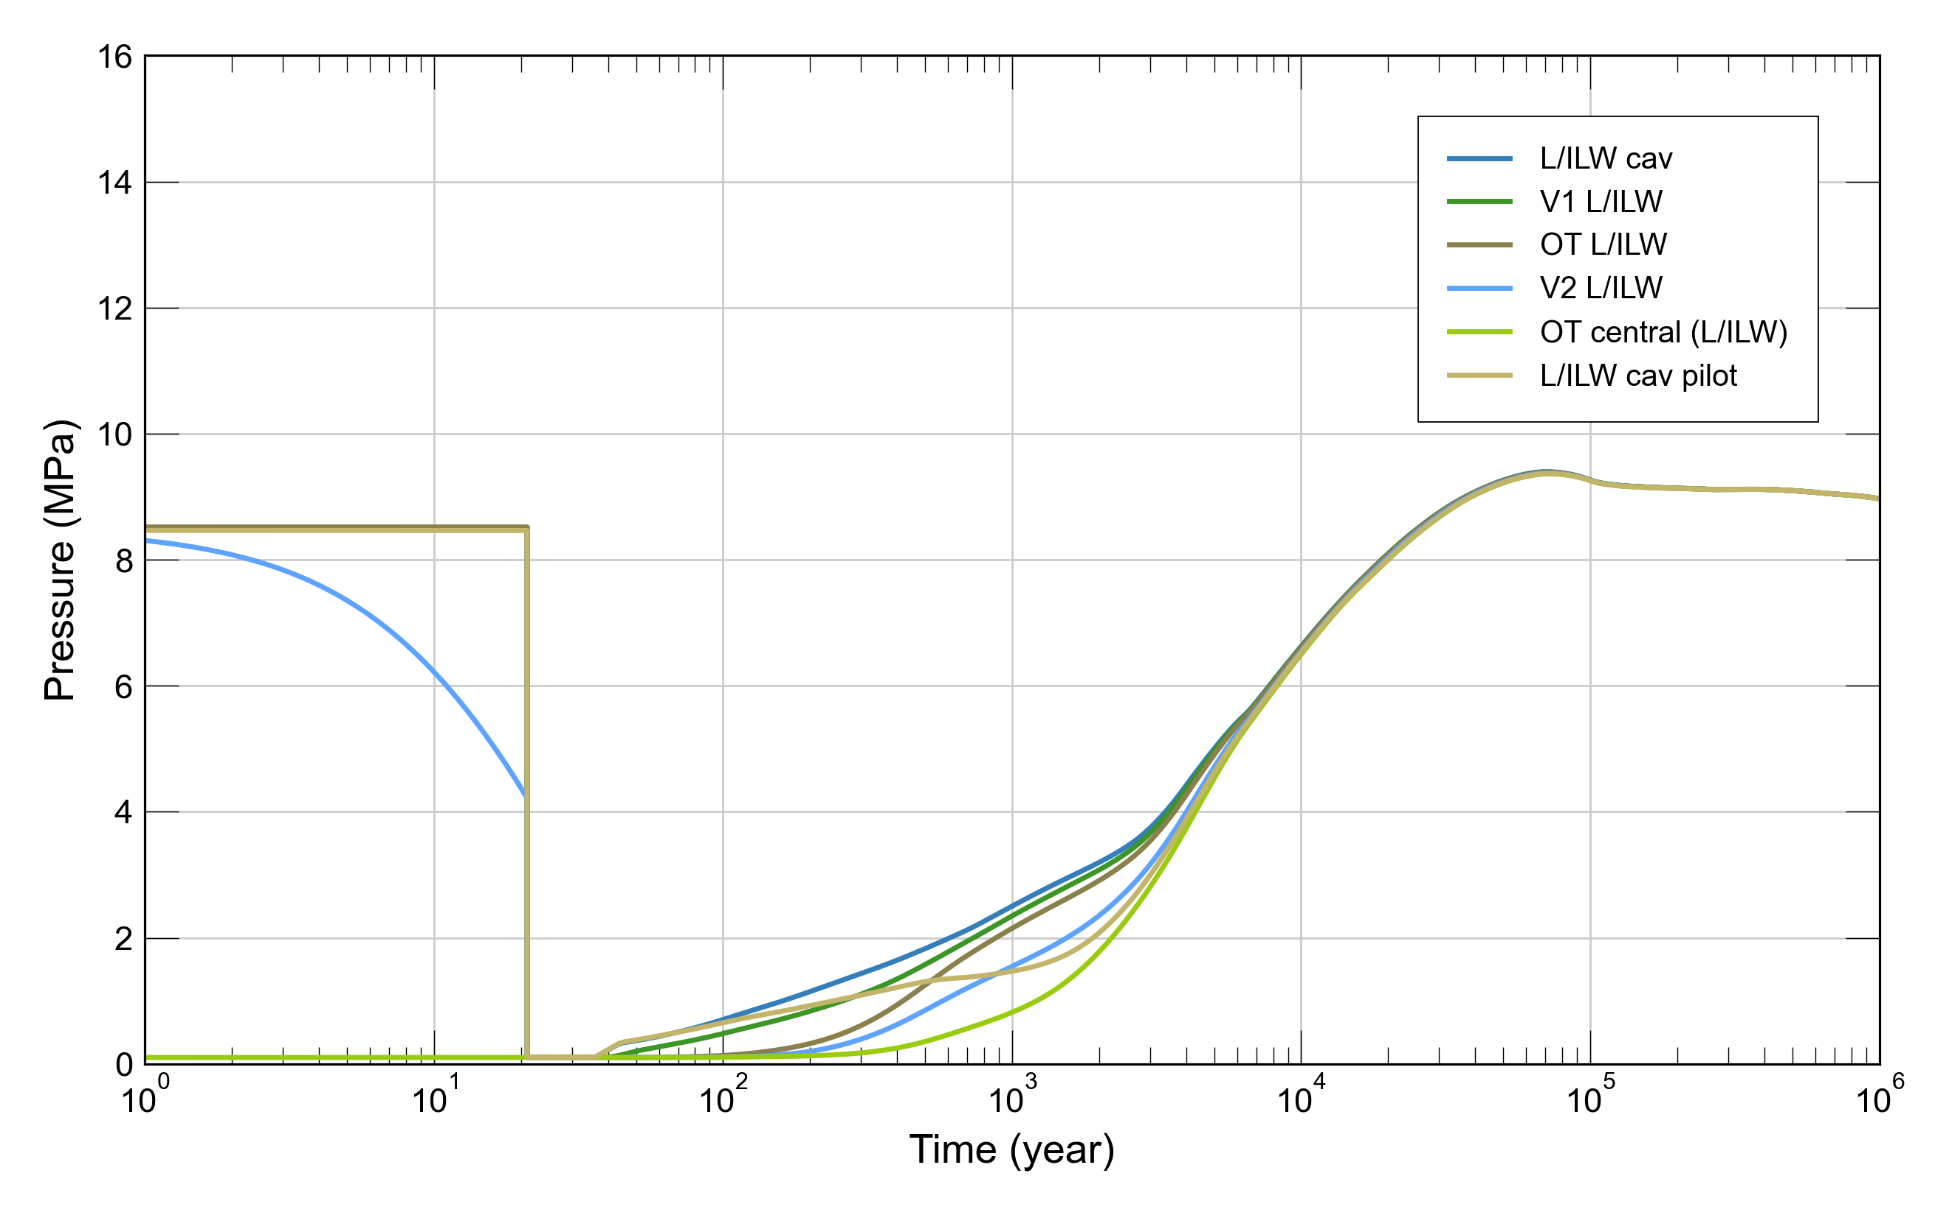
Fig. 6‑9:Assessment of total system: transients of pressure in the HLW repository section (top) and in the L/ILW repository section (bottom)
V1: cavern or drift seal, OT: operations tunnel, V2: repository section seal, pilot: pilot repository. For more details see Section 5.3 in Nagra 2024o.
The temperature drop from ~ 43 ˚C to 28 ˚C seen in the figure occurs during the ventilation period. ↩